

Sample Category Title
Technical Outlook and Review
DXY:
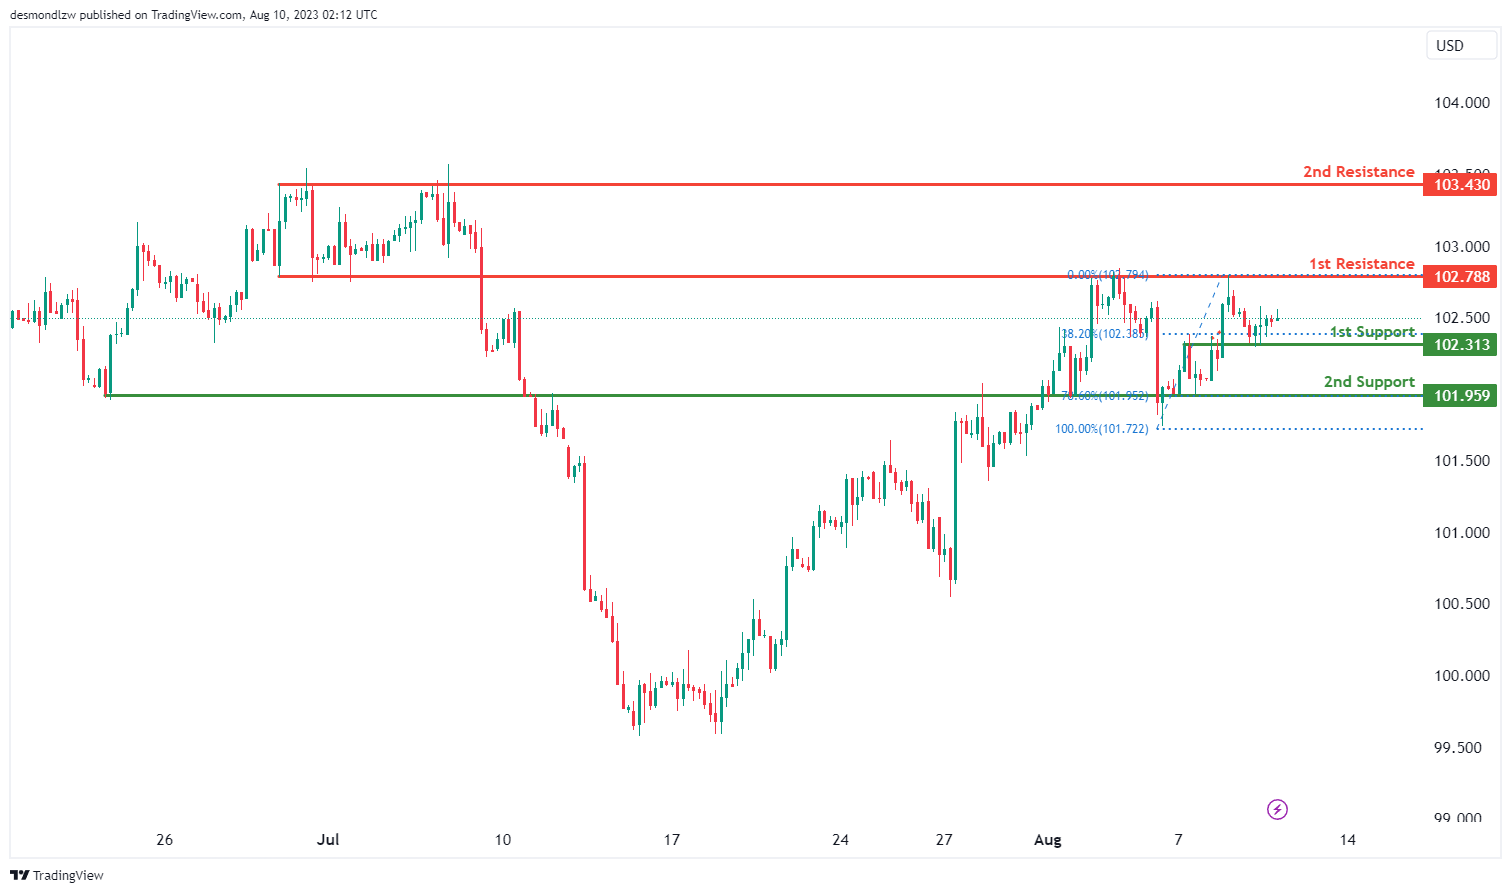
The DXY chart is presently characterized by a neutral overall momentum, implying a lack of discernible directional bias. In light of this neutral stance, it is conceivable that the price may exhibit fluctuations within the range defined by the 1st resistance at 102.78 and the 1st support at 102.31. Notably, the 1st support level derives its significance as an overlap support and is reinforced by the presence of a 38.20% Fibonacci retracement level. In addition, a secondary support at 101.95 reinforces this range as an overlap support. On the opposite spectrum, the 1st resistance at 102.78 is identified as an overlap resistance. Furthermore, an additional layer of resistance is found at the 2nd resistance level of 103.43, distinguished as a multi-swing high resistance.
EUR/USD:
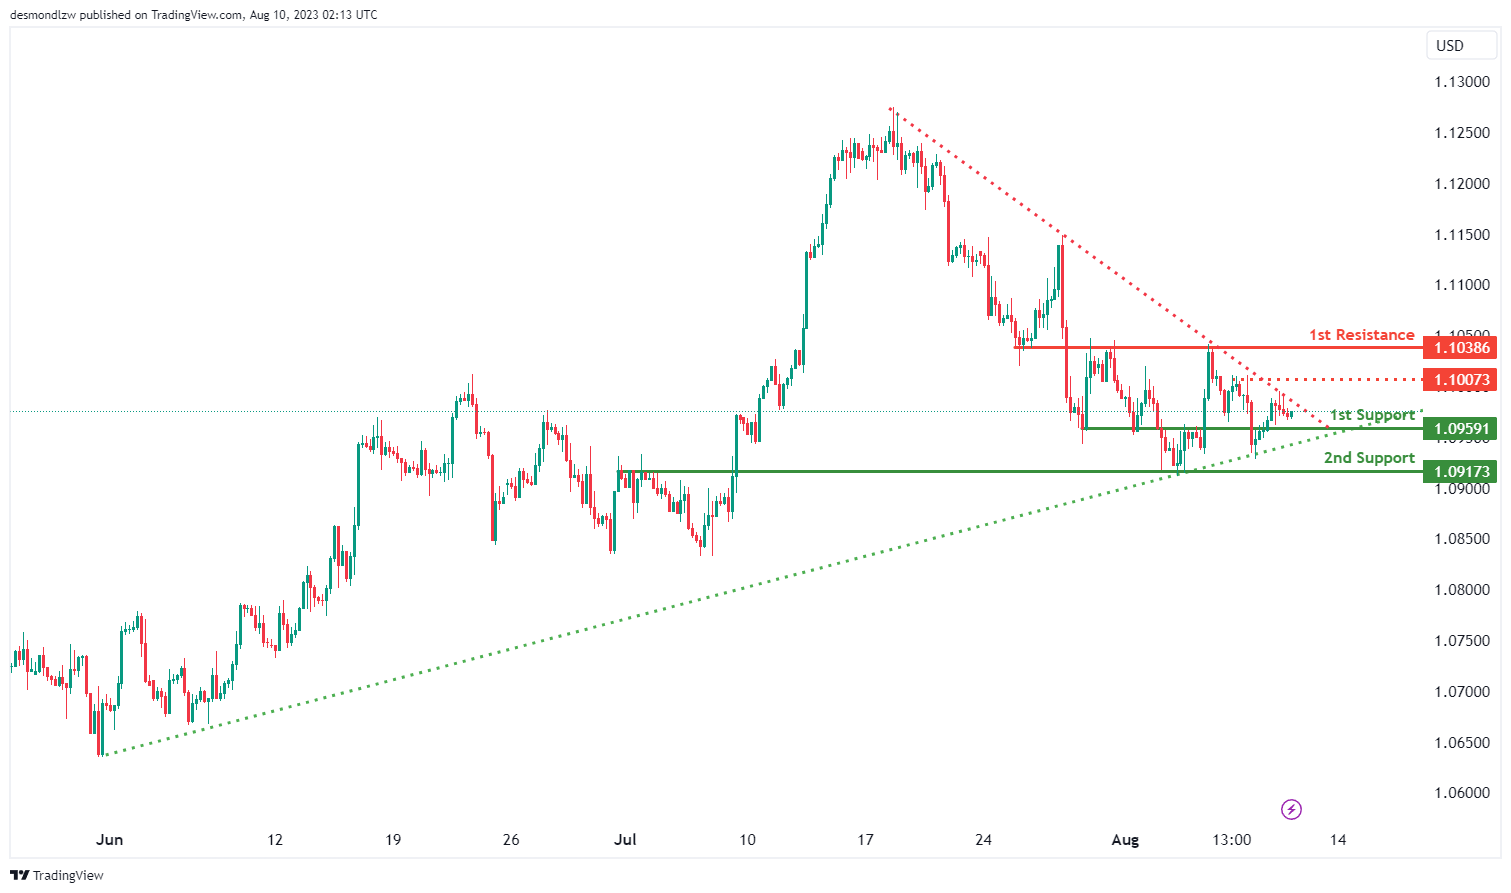
The EUR/USD chart currently reflects a neutral overall momentum, suggesting an absence of a clear directional bias. Given this neutrality, there is a potential for the price to oscillate within the range defined by the 1st resistance at 1.1038 and the 1st support at 1.0959. The 1st support level is notable as an overlap support, with a secondary support at 1.0917 also enhancing its significance. Correspondingly, the 1st resistance at 1.1038 is identified as an overlap resistance. Moreover, an intermediate resistance is noted at 1.1007, distinguished by its alignment as a multi-swing high resistance.
In addition to these observations, a symmetrical triangle chart pattern is evident, which typically signifies a phase of consolidation before a subsequent breakout or breakdown. Notably, a bullish breakout might be indicated by a breach above the upper trendline of the pattern, while a bearish breakdown could be suggested by a breach below the lower trendline.
EUR/JPY:
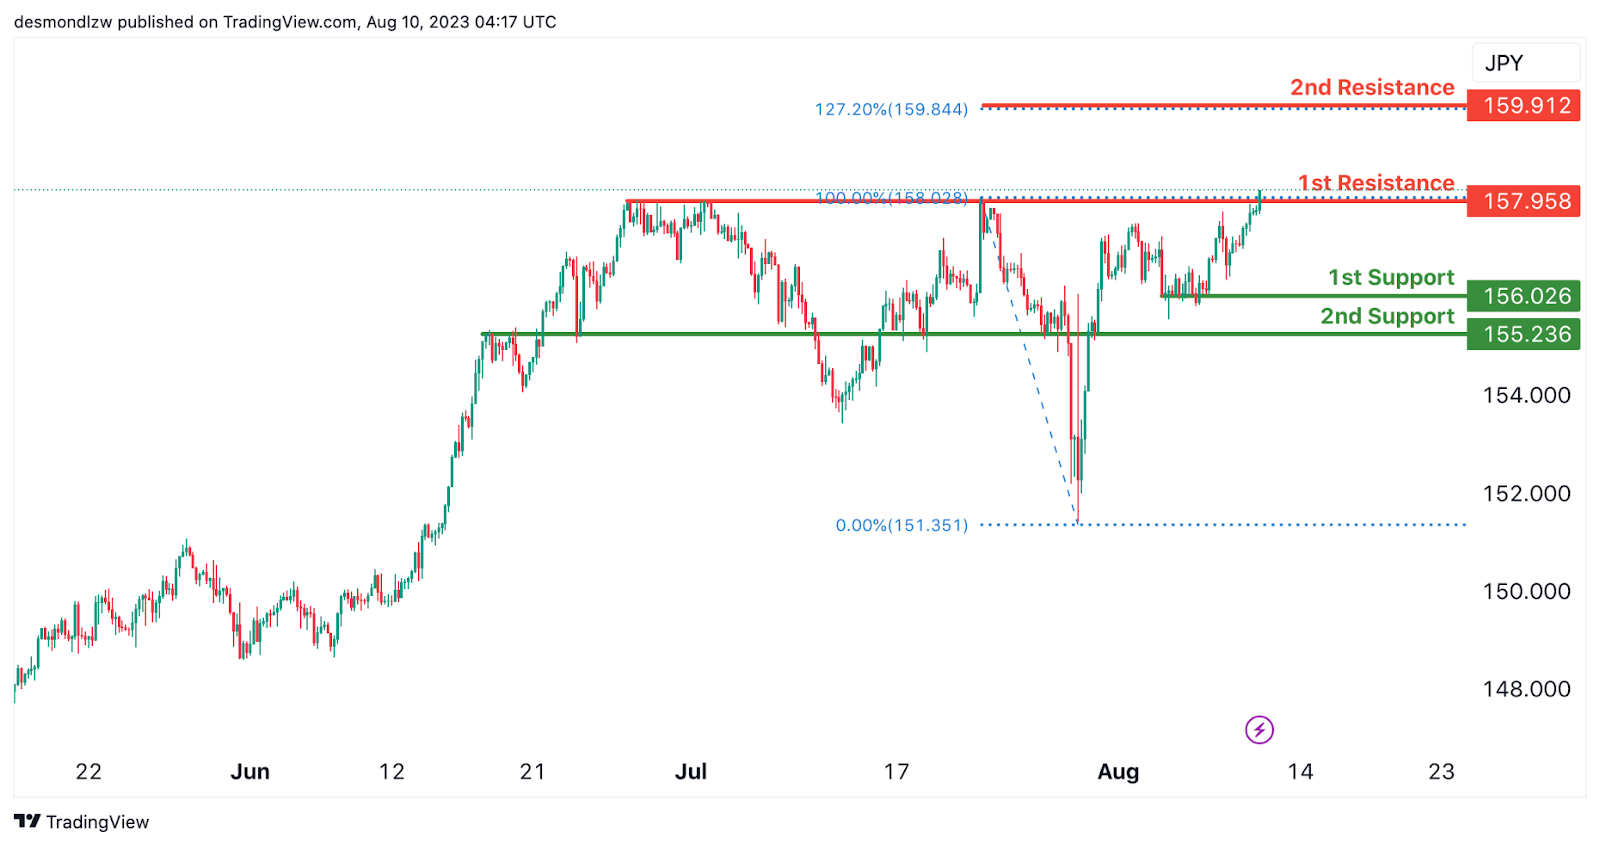
The EUR/JPY chart suggests a bullish overall momentum. There is potential for a bullish break through the 1st resistance level and a subsequent rise to the 2nd resistance level.
The 1st support is positioned at 156.02 and is considered supportive due to its multi-swing low support characteristics. Additionally, the 2nd support at 155.23 is seen as beneficial because it represents an overlap support.
On the resistance side, the 1st resistance level at 157.95 is notable as it signifies a multi-swing high resistance. Furthermore, the 2nd resistance at 159.91 is considered significant due to its representation of a 127.20% Fibonacci extension.
EUR/GBP:
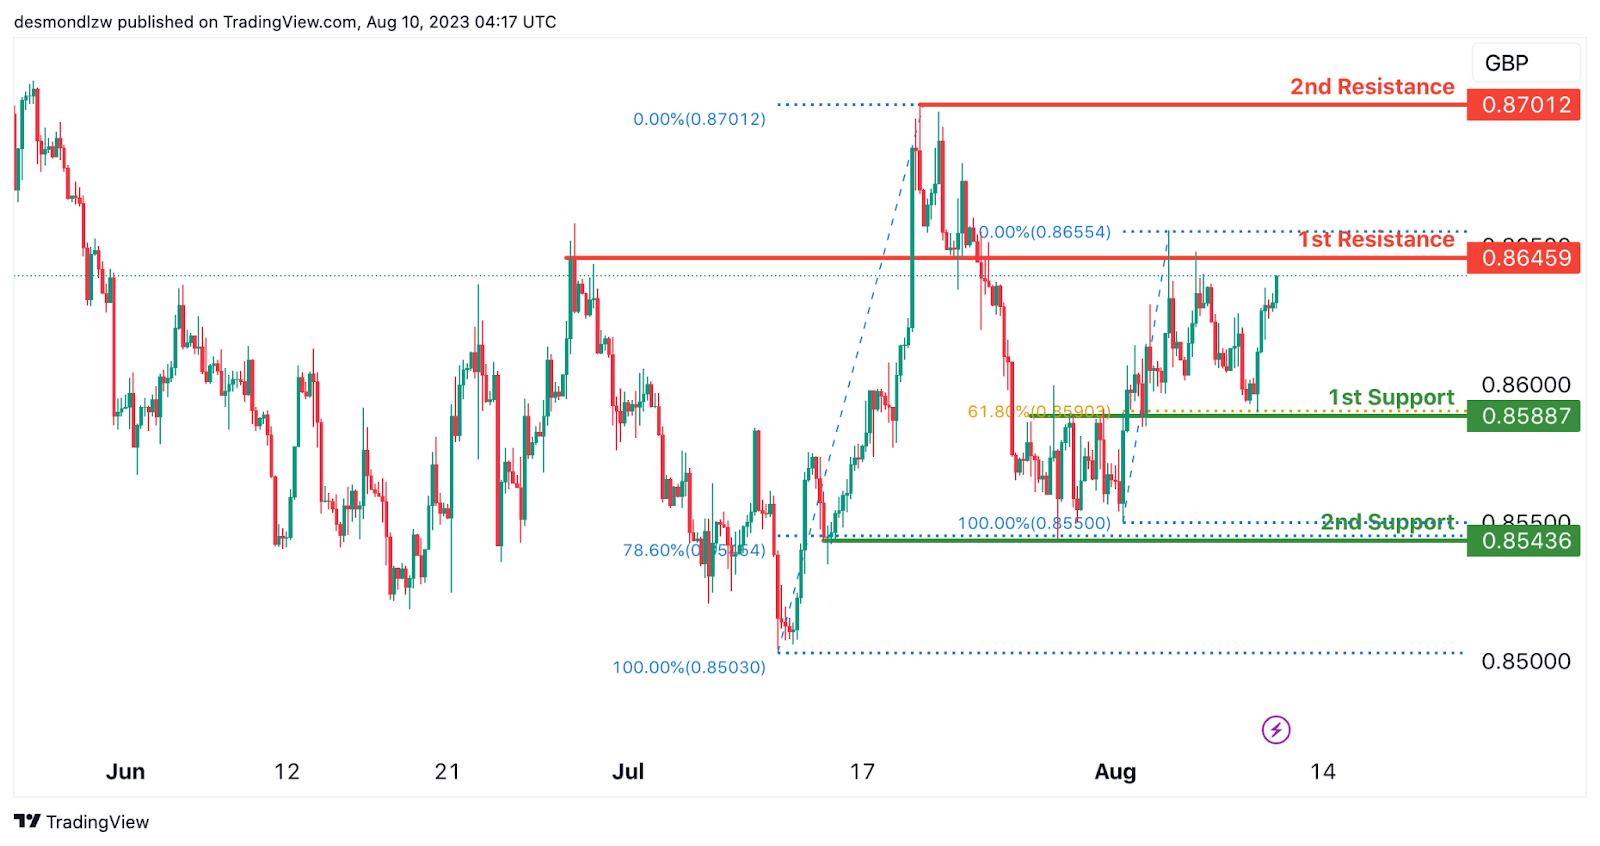
The EUR/GBP chart reflects a bullish overall momentum. There is potential for a bullish continuation towards the 1st resistance level.
The 1st support is positioned at 0.8588 and is considered advantageous due to its pullback support and a 61.80% Fibonacci retracement. Additionally, the 2nd support at 0.8543 is seen as beneficial because it represents a swing low support and a 78.60% Fibonacci retracement.
On the resistance side, the 1st resistance level at 0.8645 is notable as it signifies an overlap resistance. Furthermore, the 2nd resistance at 0.8701 is considered significant due to its swing high resistance characteristics.
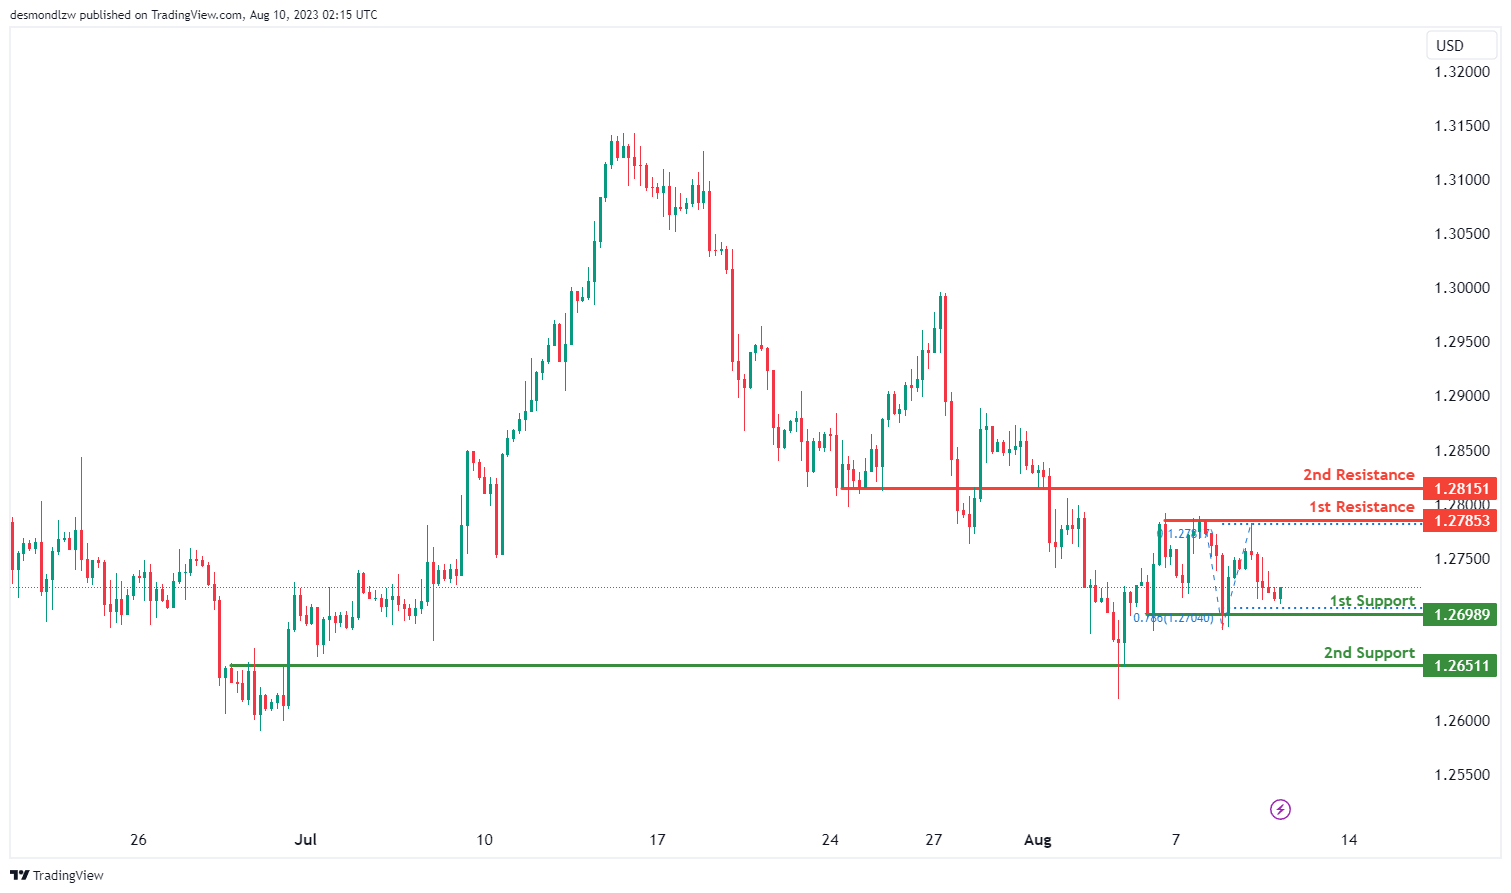
GBP/USD:
The GBP/USD chart currently indicates a bullish overall momentum, implying a prevailing upward trend.
Given this bullish sentiment, there exists the potential for the price to sustain a bullish continuation towards the 1st resistance level at 1.2785.
The 1st support level, situated at 1.2698, derives its significance as a multi-swing low support. Additionally, a 2nd support at 1.2651 reinforces the supportive structure.
Conversely, the 1st resistance level at 1.2785 gains prominence as a multi-swing high resistance, potentially impeding further upward movement.
Further upward pressure is suggested by a 2nd resistance at 1.2815, characterized as a pullback resistance.
GBP/JPY:
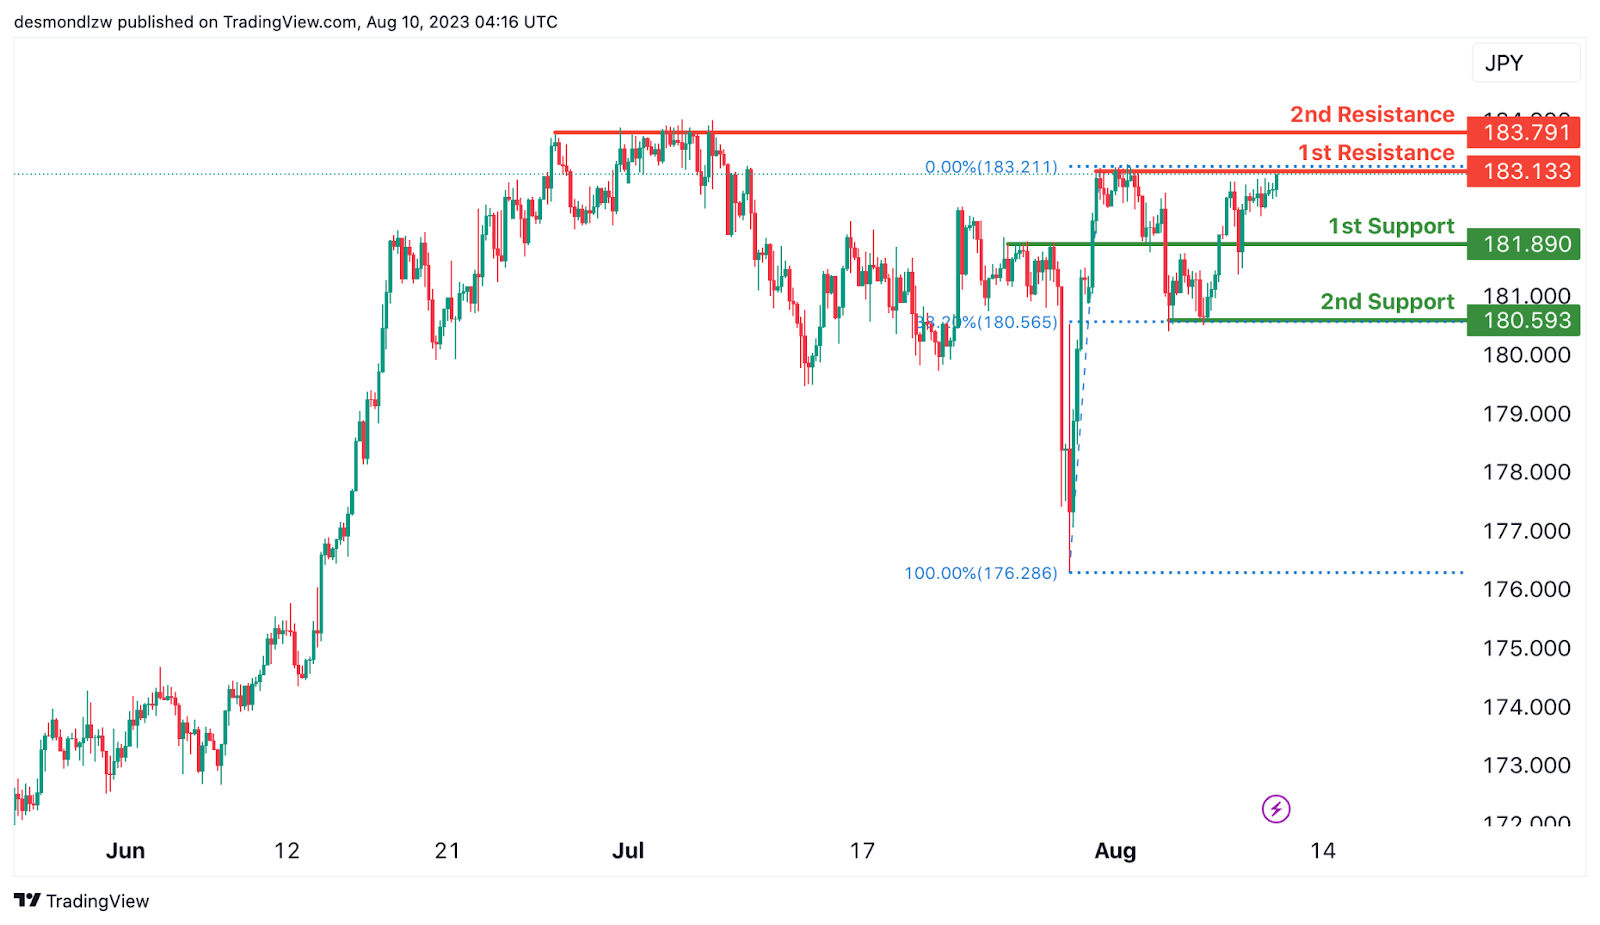
The GBP/JPY chart indicates a bearish overall momentum. There is a potential for a bearish reaction off the 1st resistance level, leading to a drop towards the 1st support level.
The 1st support is located at 181.89 and is considered good due to its overlap support characteristics. Additionally, the 2nd support at 180.59 is viewed as a valuable level because of its multi-swing low support and a 38.20% Fibonacci retracement.
On the resistance side, the 1st resistance level at 183.13 is considered noteworthy as it represents a multi-swing high resistance. Furthermore, the 2nd resistance at 183.79 is significant due to its multi-swing high resistance characteristics.
USD/CHF:
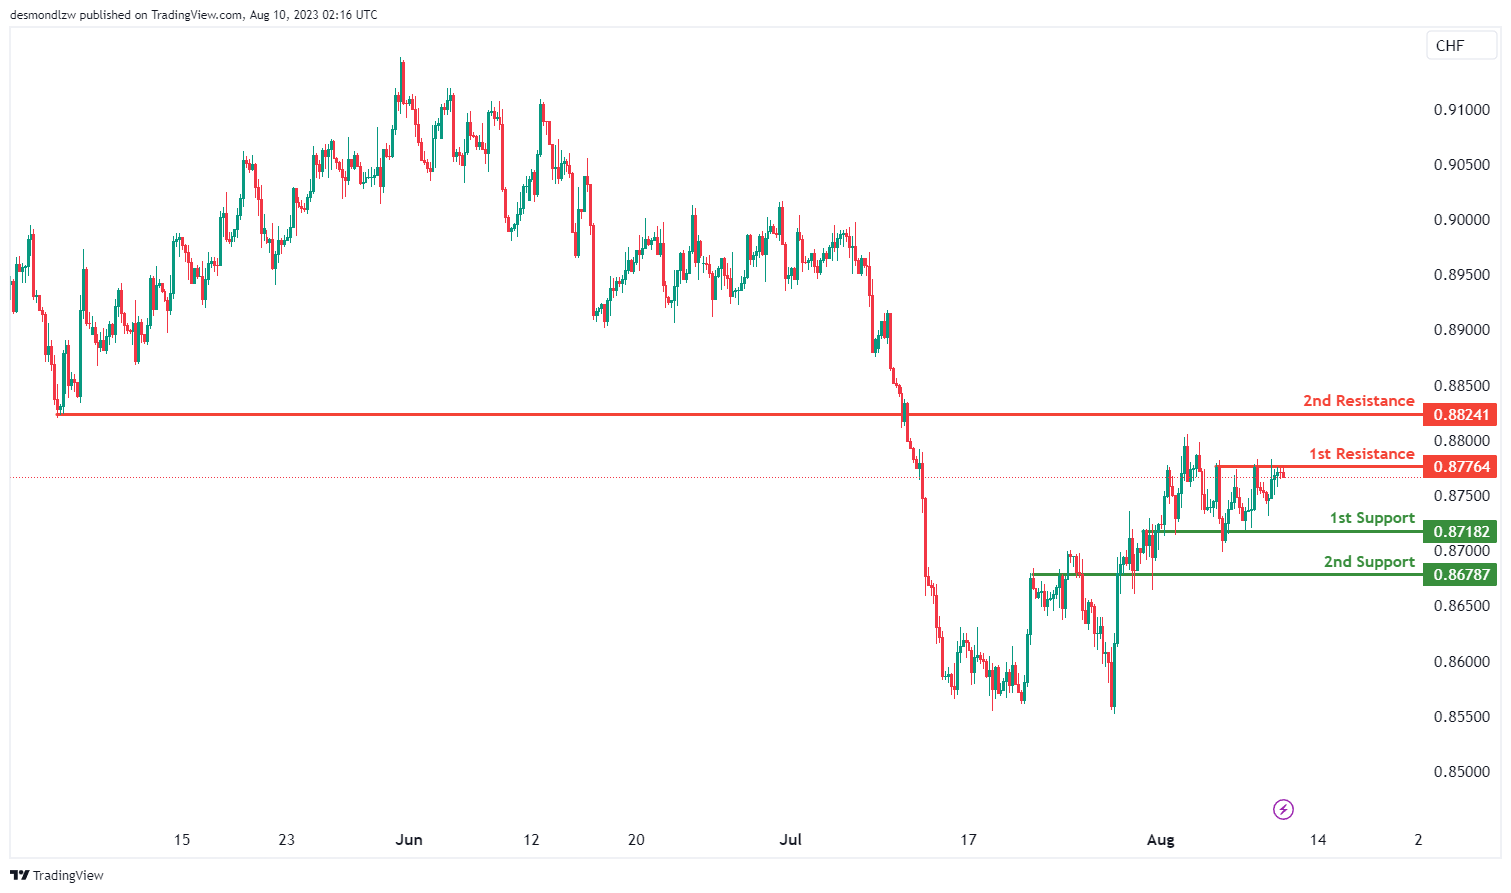
The USD/CHF chart currently demonstrates a bearish momentum, indicating a prevailing downward trend.
Considering this bearish sentiment, there is a potential for the price to extend its bearish movement towards the 1st support level.
The 1st support, situated at 0.8718, holds significance as it aligns with an overlap support.
Furthermore, a secondary support at 0.8678 reinforces the support structure.
Conversely, the 1st resistance level at 0.8776 is of note due to its identification as a multi-swing high resistance, which could hinder further upward movement.
Additionally, a 2nd resistance at 0.8824 is identified as a pullback resistance, further enhancing the resistance potential.
USD/JPY:
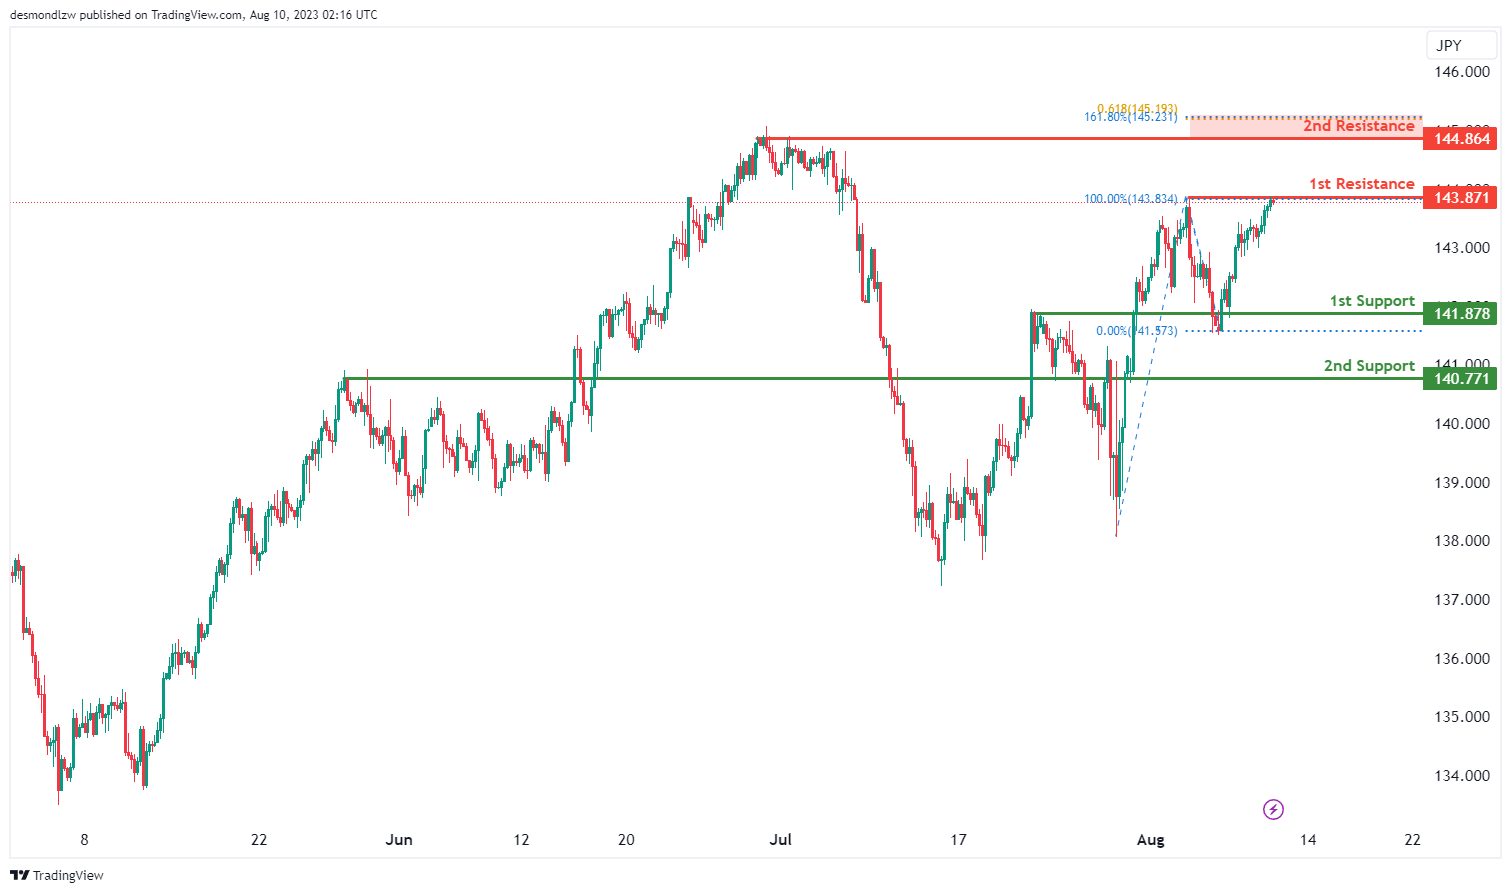
The USD/JPY chart currently reflects a weak bullish momentum with low confidence, suggesting a modest upward trend.
In this context, there is a potential scenario where the price could execute a bullish breakout through the 1st resistance level and ascend towards the 2nd resistance.
The 1st support level, positioned at 141.87, garners significance as an overlap support.
Similarly, a secondary support at 140.77 reinforces the supportive foundation.
Conversely, the 1st resistance level at 143.87 is notable for its characterization as a swing high resistance.
Furthermore, the 2nd resistance level at 144.86 gains prominence due to its identification as a pullback resistance. Notably, the presence of a 161.80% Fibonacci Extension and a 61.80% Fibonacci Projection signifies a confluence of Fibonacci levels, adding strength to its resistance potential.
USD/CAD:
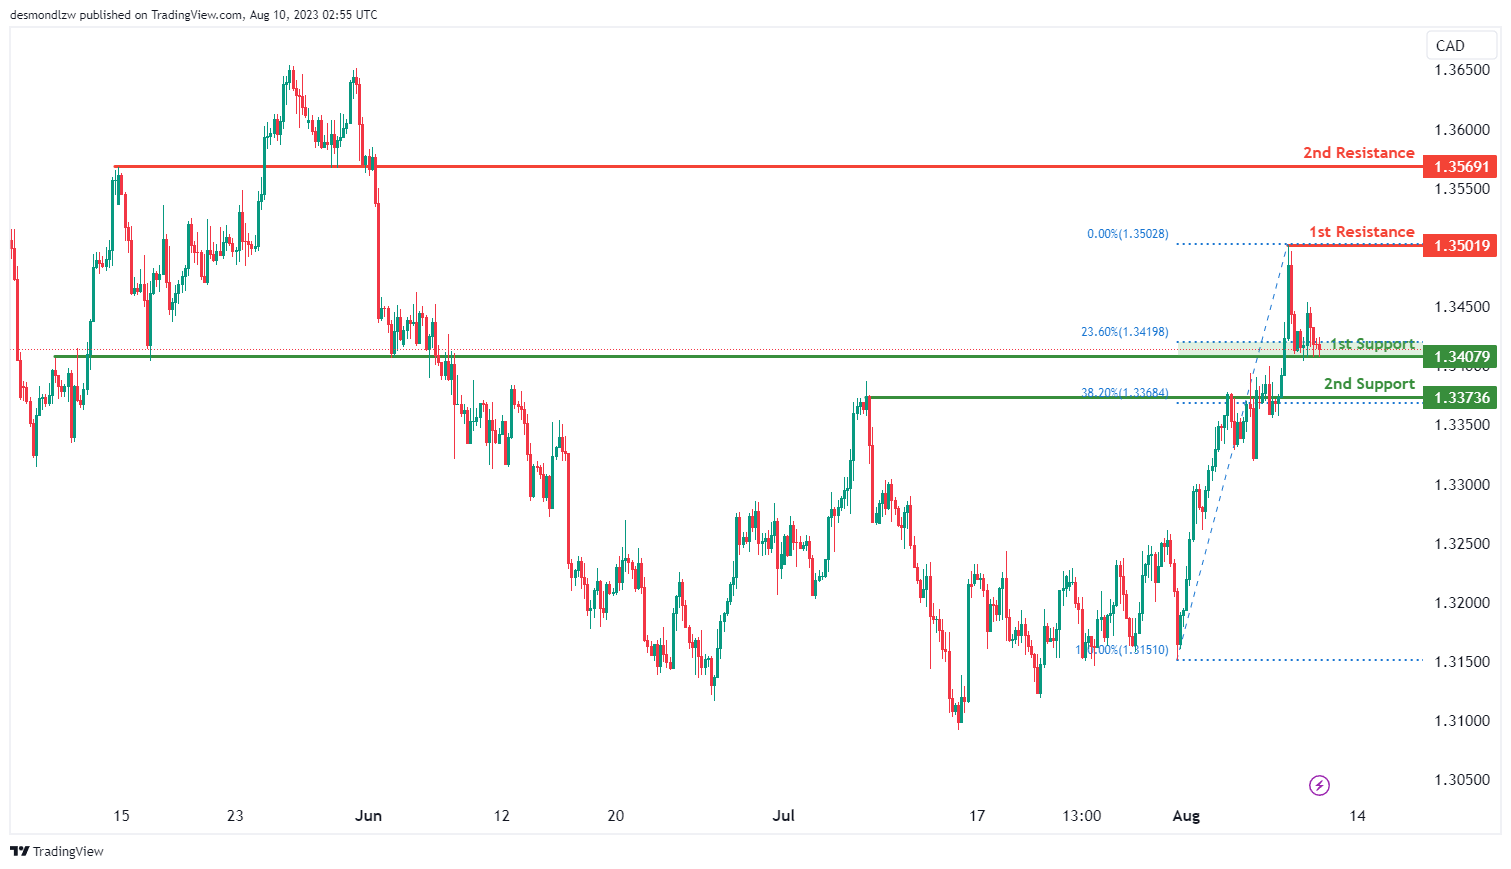
The USD/CAD chart currently depicts a bearish momentum, indicating a potential for the price to possibly extend its bearish movement towards the 1st support level.
The 1st support, positioned at 1.3408, represents an overlap support that aligns with the 23.60% Fibonacci retracement level. Further below, the 2nd support at 1.3374 is an overlap support that aligns with the 38.20% Fibonacci retracement level.
To the upside, the 1st resistance level at 1.3502 is a swing high resistance which could act as a significant barrier should price reach this level. Should price break above this barrier, the 2nd resistance is at 1.3569 which is an overlap resistance that could limit any further upward movement in price.
AUD/USD:
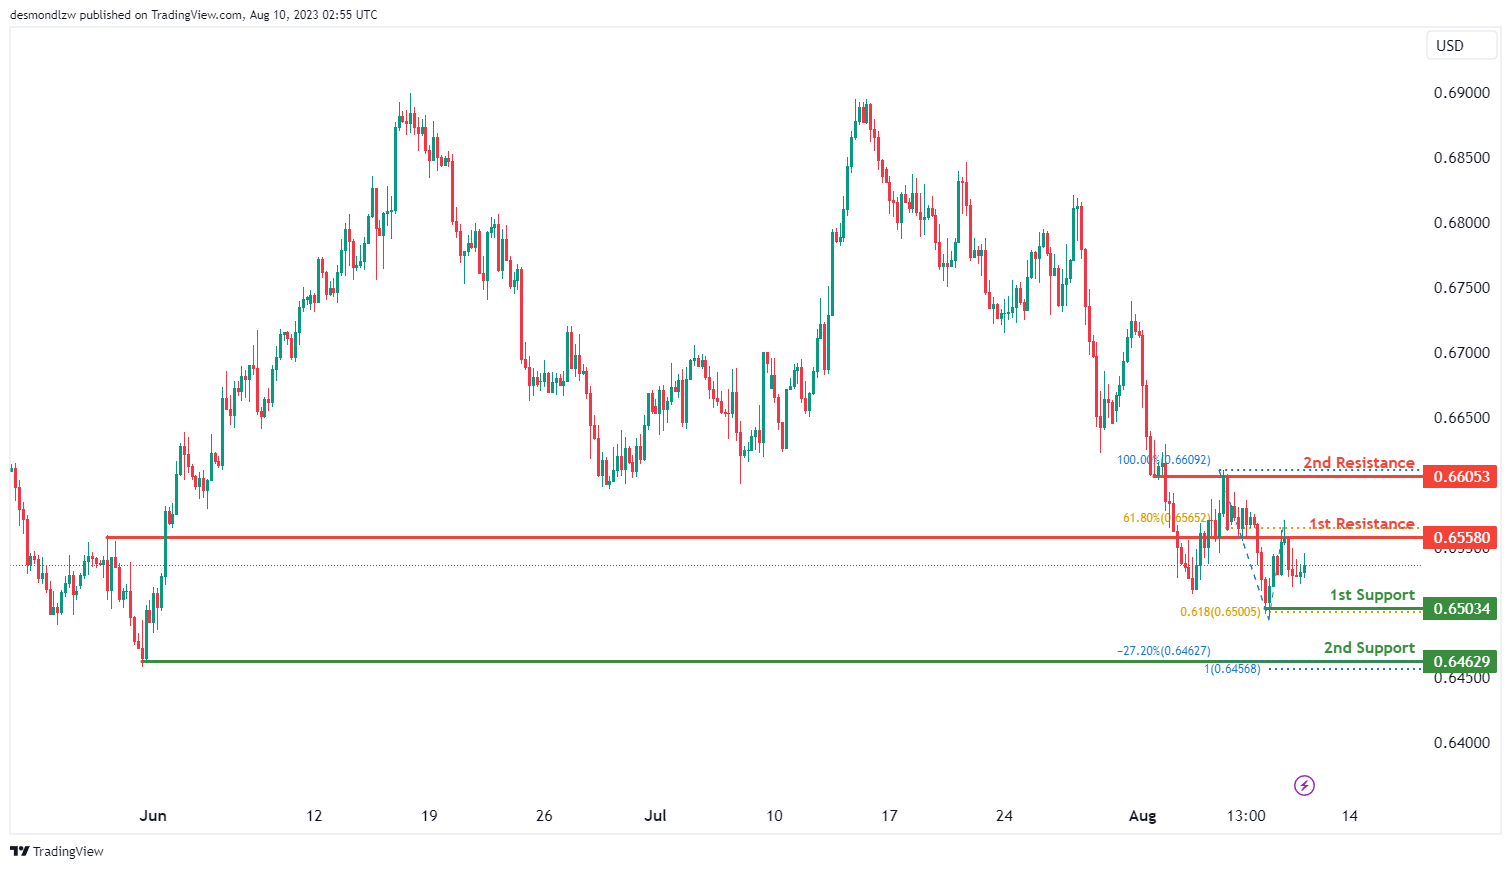
The AUD/USD chart currently reflects a neutral momentum, suggesting an absence of a clear directional bias. In light of this neutrality, there is a potential for the price to fluctuate within the range defined by the 1st resistance and the 1st support levels.
The 1st support level, situated at 0.6503, holds significance as both a swing-low support that aligns with the 61.80% Fibonacci projection level. Further below, the 2nd support at 0.6463 is a swing-low support with added significance due to its alignment with the -27.20% Fibonacci expansion and a 100.00% Fibonacci projection levels, indicating a Fibonacci confluence.
To the upside, the 1st resistance at 0.6558 acts as an overlap resistance that coincides with the 61.80% Fibonacci retracement level. Furthermore, the 2nd resistance level at 0.6605 is identified as an overlap resistance, further reinforcing its potential to hinder any upwards price movements.
NZD/USD
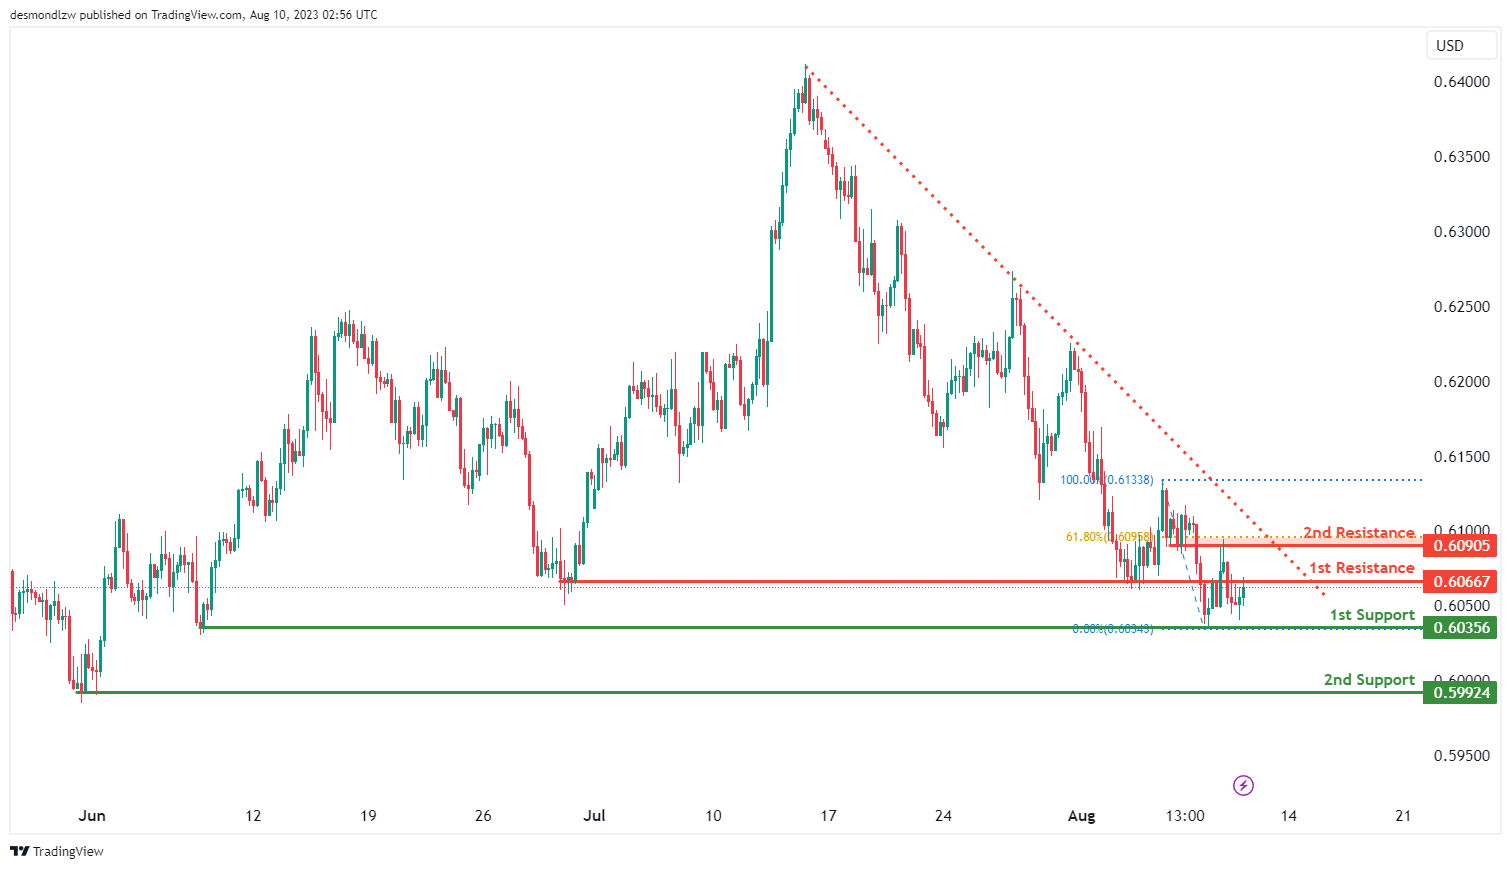
The NZD/USD chart presently indicates a neutral momentum, suggesting a lack of a distinct directional bias. Given this neutrality, it is plausible for the price to potentially exhibit fluctuations within the range defined by the 1st resistance and 1st support levels.
The 1st support level is at 0.6036 and represents an overlap support. The 2nd support level at 0.5992 is also notable, identified as a swing low support.
To the upside, the 1st resistance at 0.6067 is an overlap resistance. Furthermore, the 2nd resistance at 0.6091 is identified as an overlap resistance that aligns with the 61.80% Fibonacci retracement level.
DJ30:
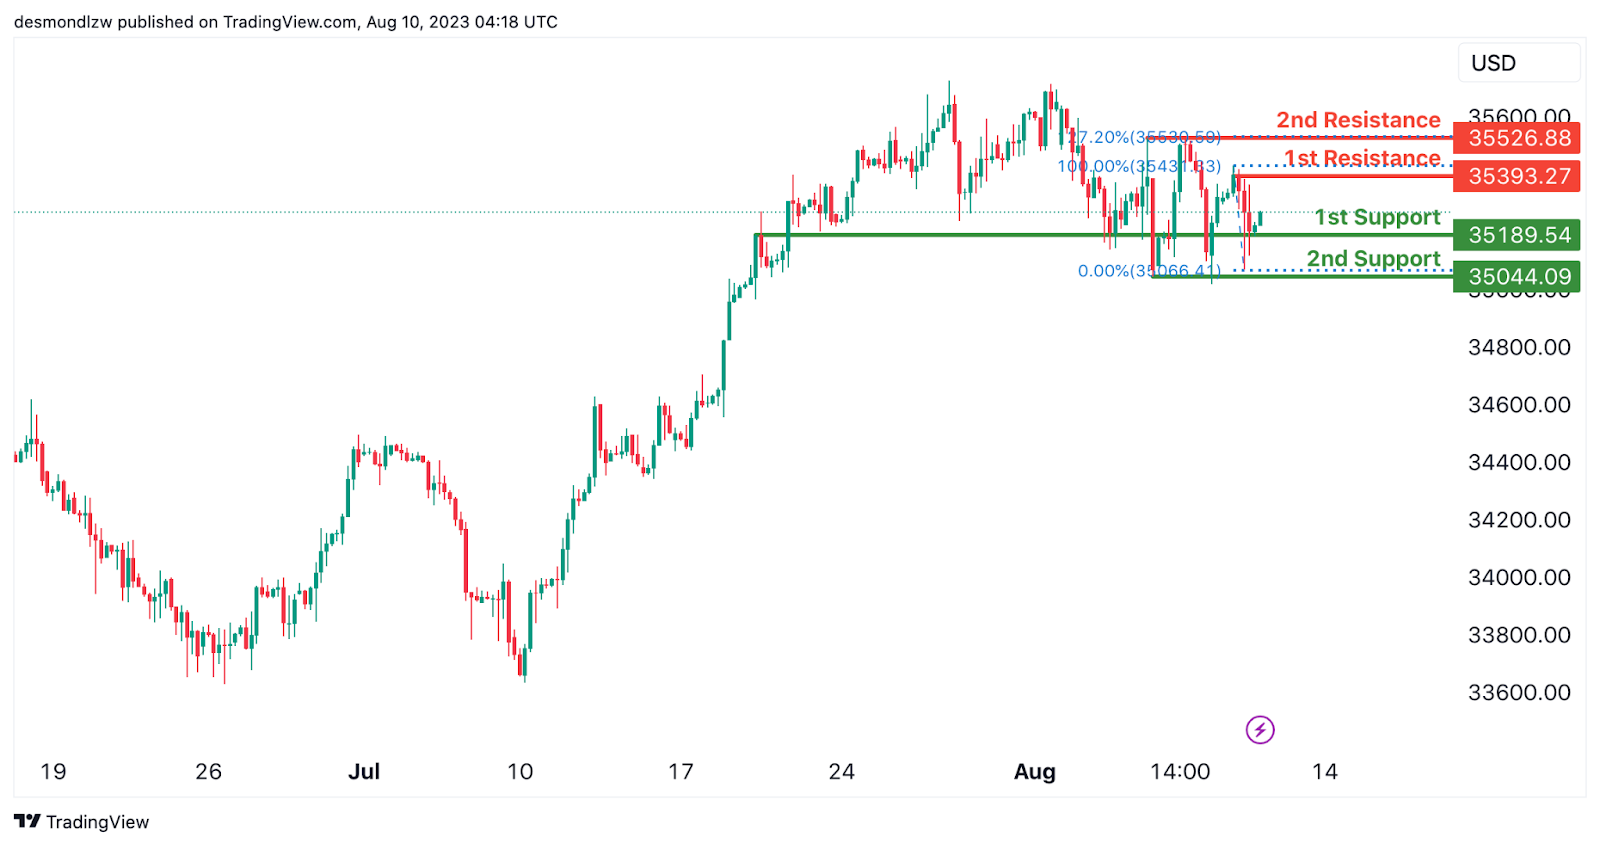
The DJ30 chart displays a bullish overall momentum. There is potential for a bullish continuation towards the 1st resistance level.
The 1st support is positioned at 35189.54 and is considered favorable due to its overlap support characteristics. Additionally, the 2nd support at 35044.09 is seen as a valuable level because of its multi-swing low support properties.
On the resistance side, the 1st resistance level at 35393.27 is notable as it represents a swing high resistance. Furthermore, the 2nd resistance at 35526.88 is considered significant due to its multi-swing high resistance characteristics and a 127.20% Fibonacci extension.
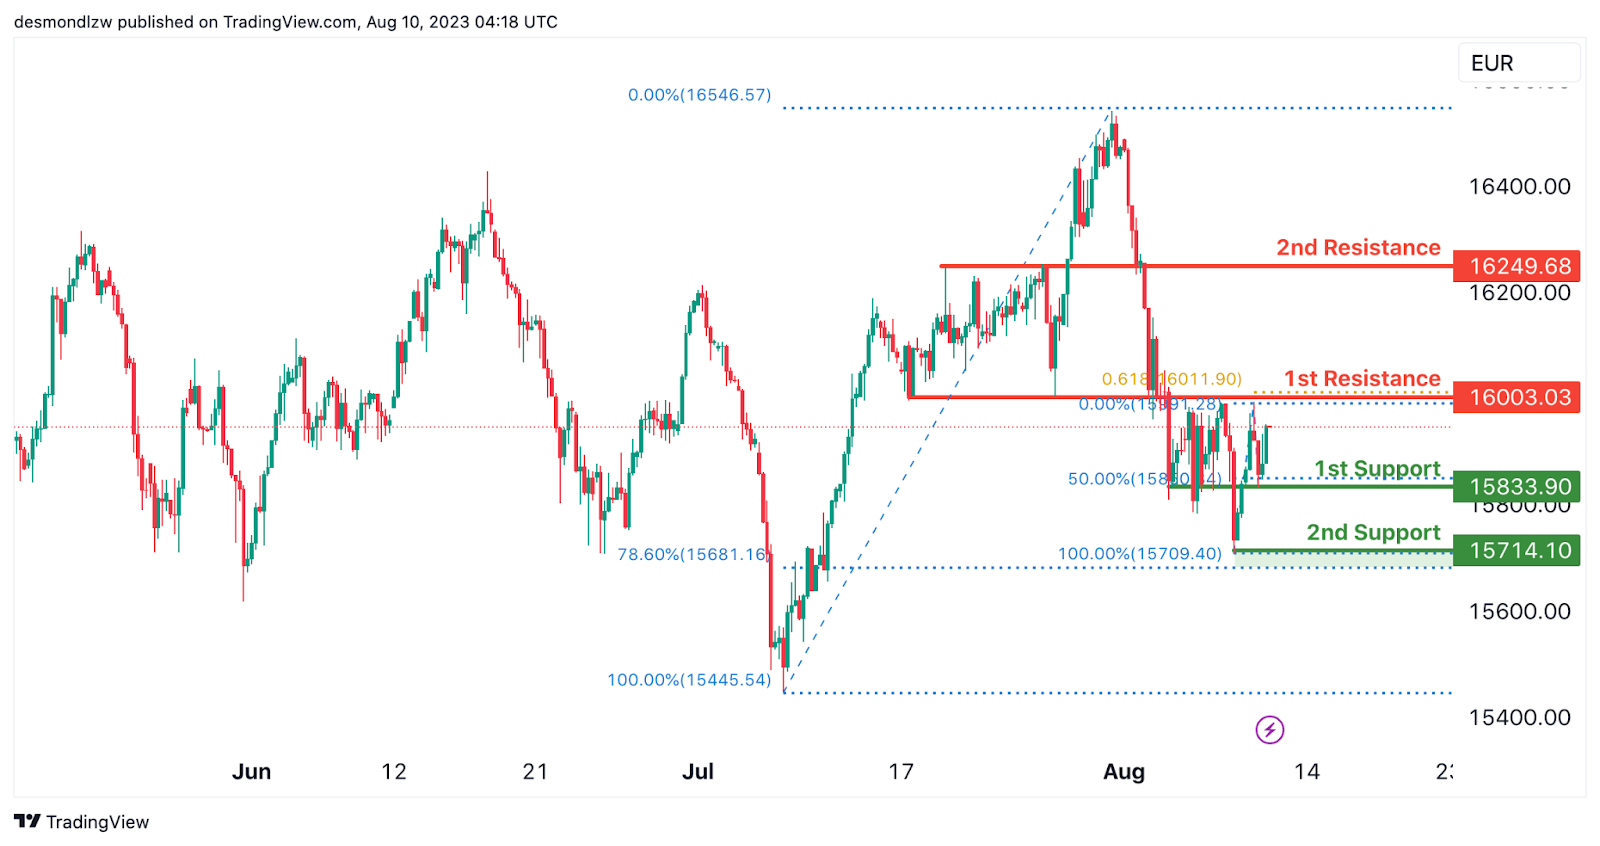
GER30:
The GER30 chart reflects a bullish overall momentum. There is potential for a bullish continuation towards the 1st resistance level.
The 1st support is positioned at 15833.90 and is considered advantageous due to its overlap support and a 50% Fibonacci retracement. Additionally, the 2nd support at 15714.10 is seen as a valuable level because of its swing low support and a 78.60% Fibonacci retracement.
On the resistance side, the 1st resistance level at 16003.03 is notable as it represents a pullback resistance and a 61.80% Fibonacci projection. Furthermore, the 2nd resistance at 16240.68 is considered significant due to its overlap resistance characteristics.
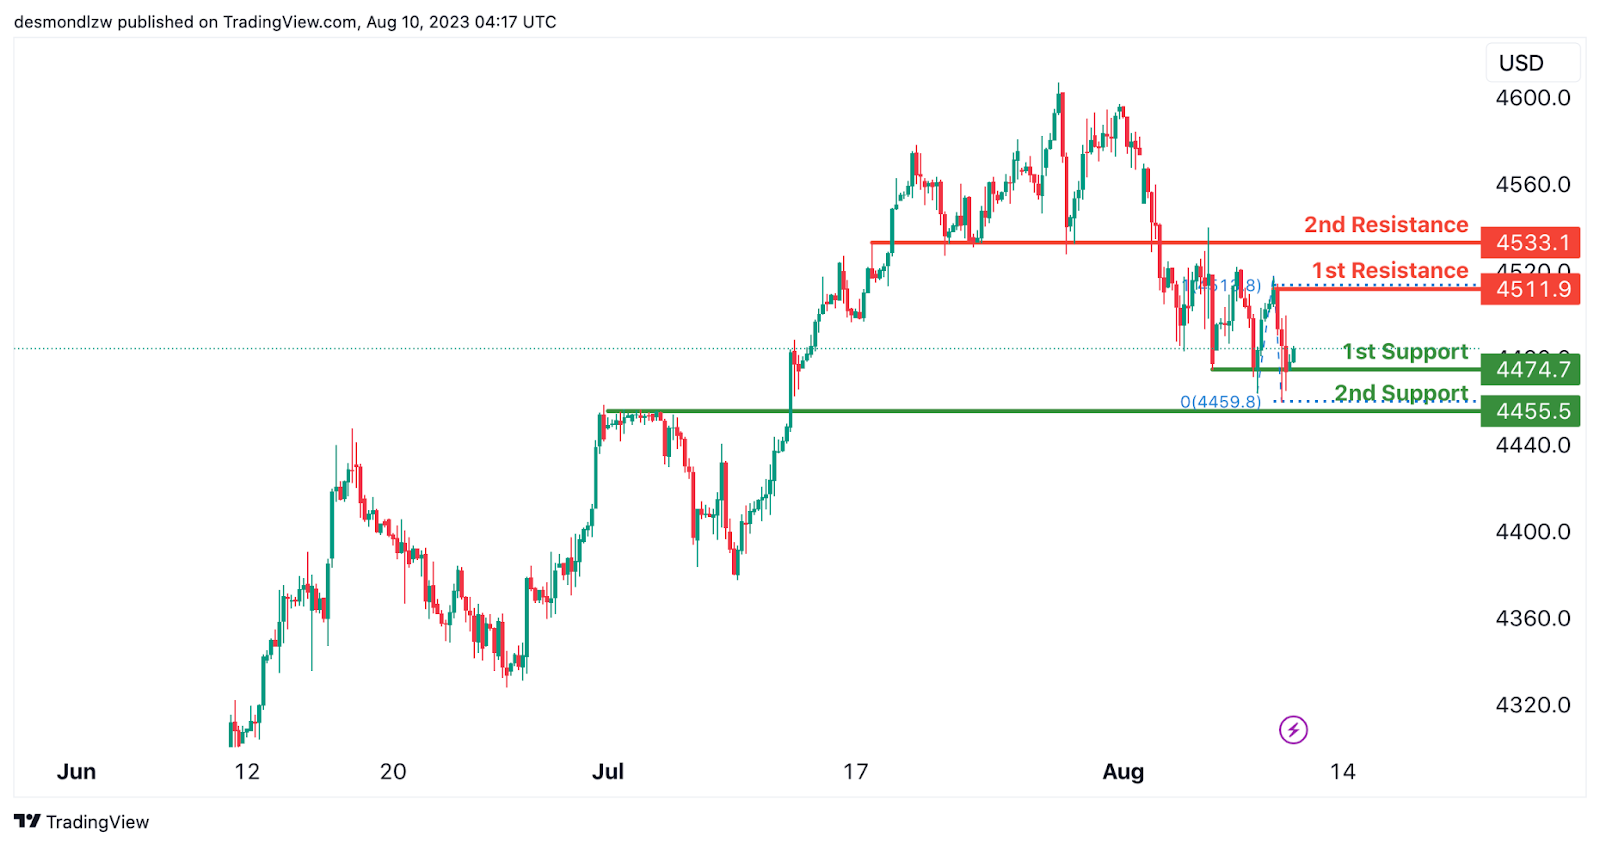
US500
The US500 chart indicates a bullish overall momentum. There is potential for a bullish continuation towards the 1st resistance level.
The 1st support is located at 4474.7 and is considered supportive due to its multi-swing low support characteristics. Additionally, the 2nd support at 4455.5 is seen as beneficial because it represents a pullback support.
On the resistance side, the 1st resistance level at 4511.9 is notable as it signifies a swing high resistance and a 100% Fibonacci projection. Furthermore, the 2nd resistance at 4533.1 is considered significant due to its overlap resistance characteristics.
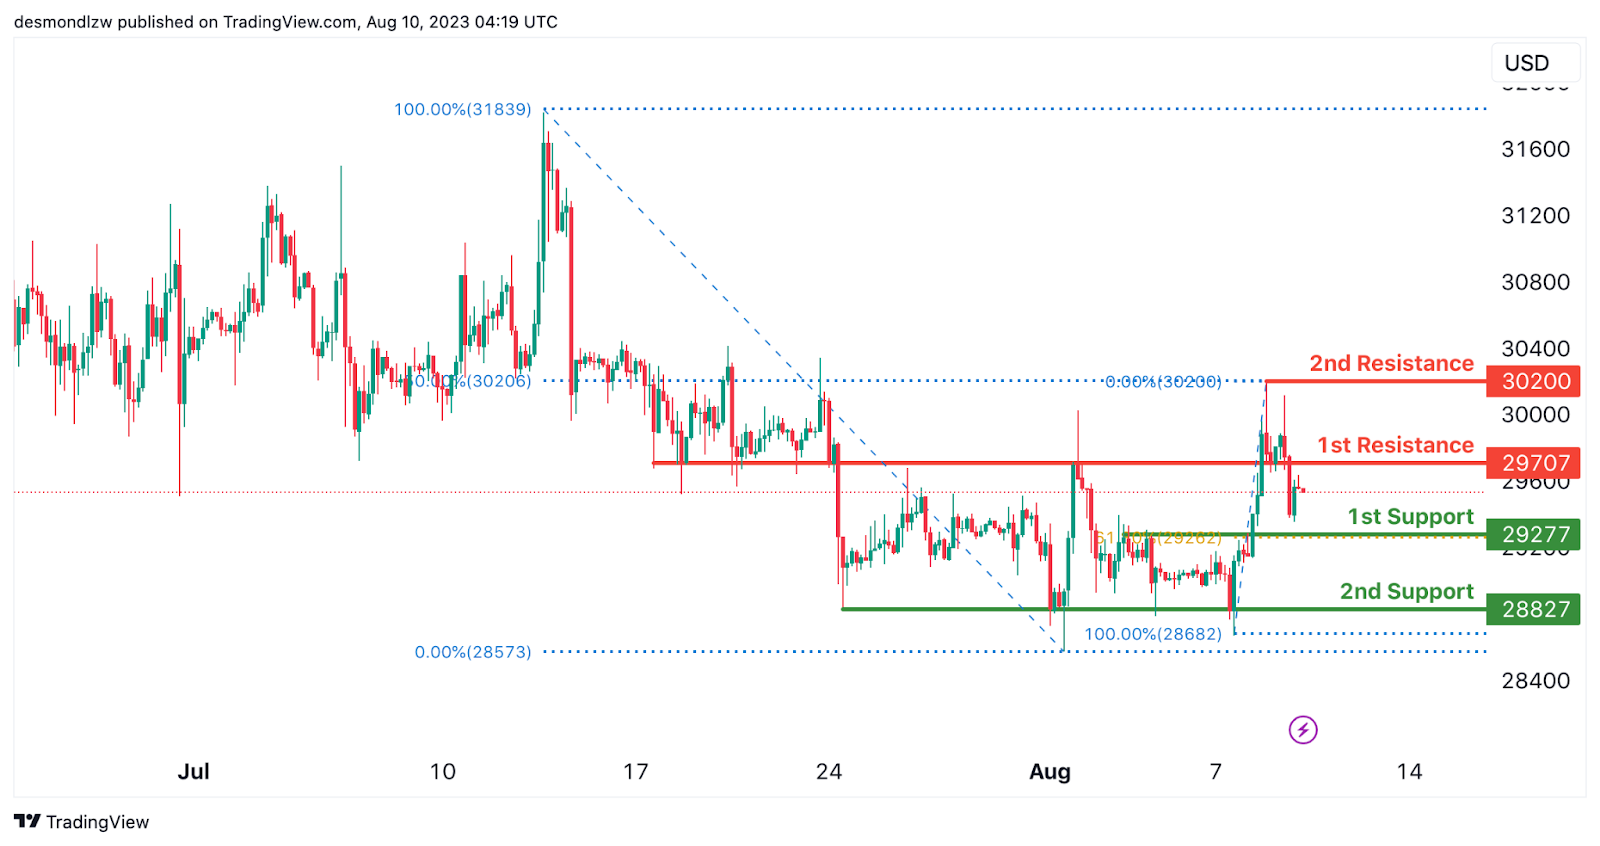
BTC/USD:
The BTC/USD chart shows a bearish overall momentum. There is a potential for a bearish continuation towards the 1st support level.
The 1st support is positioned at 29277 and is considered advantageous due to its pullback support and a 61.80% Fibonacci retracement. Furthermore, the 2nd support at 28827 is also seen as a valuable level because of its multi-swing low support characteristics.
On the resistance side, the 1st resistance level at 29707 is considered noteworthy as it represents an overlap resistance. Additionally, the 2nd resistance at 30200 is significant due to its swing high resistance and a 50% Fibonacci retracement.
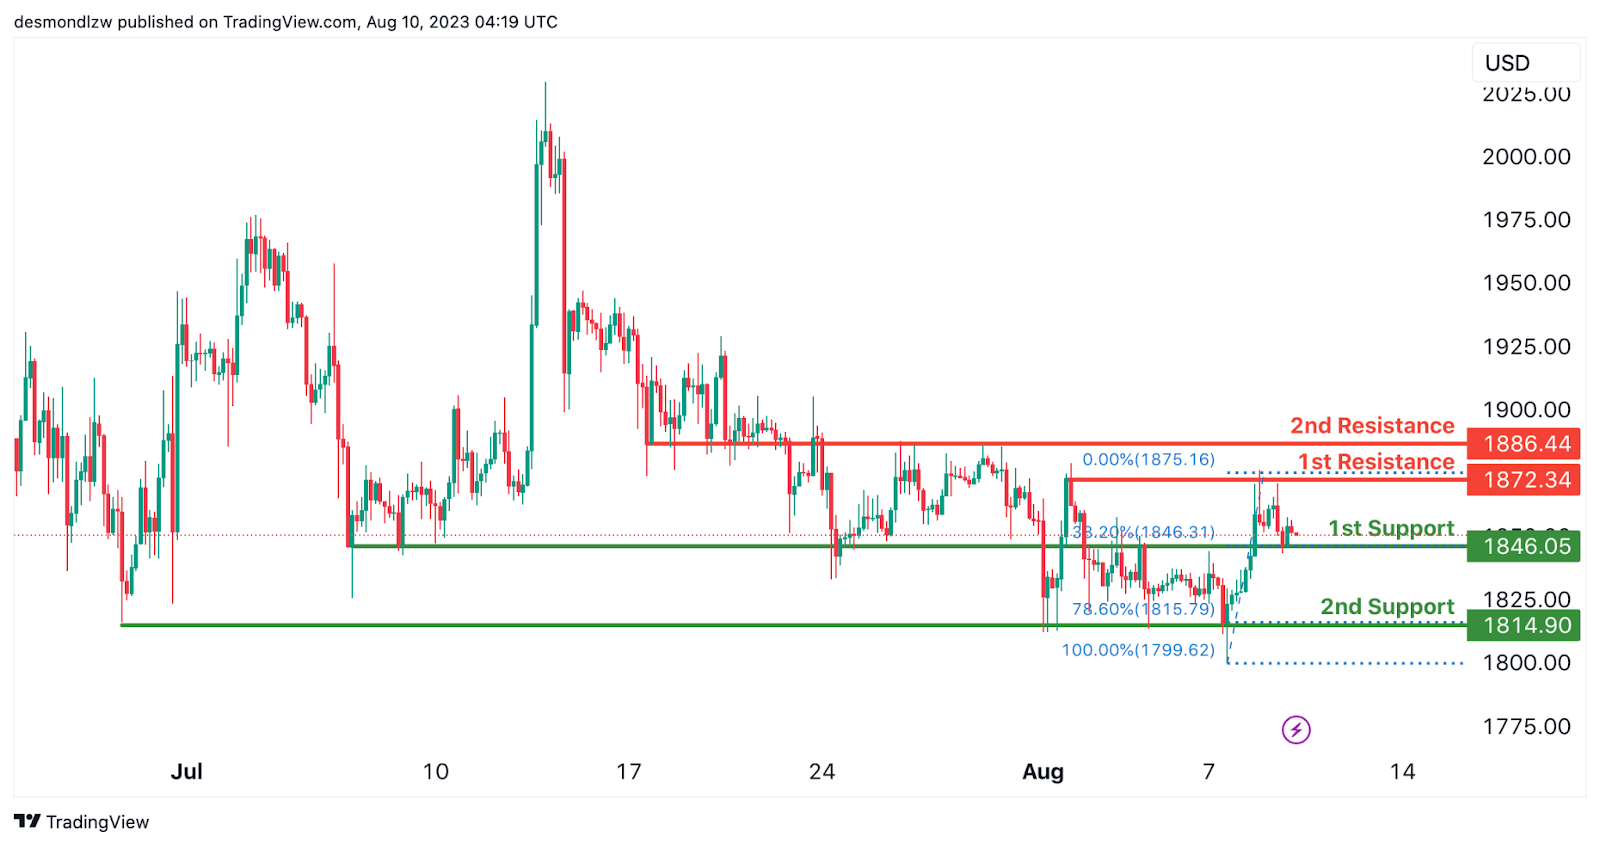
ETH/USD:
The ETH/USD chart indicates a bearish overall momentum. There is a potential for a bearish continuation towards the 1st support level.
The 1st support is located at 1816.05 and is considered favorable due to its overlap support and a 38.20% Fibonacci retracement. Additionally, the 2nd support at 1814.90 is also seen as a valuable level because of its multi-swing low support and a 78.60% Fibonacci retracement.
On the resistance side, the 1st resistance level at 1872.34 is noteworthy as it represents a multi-swing high resistance. Furthermore, the 2nd resistance at 1886.44 is considered significant due to its overlap resistance characteristics.
WTI/USD:
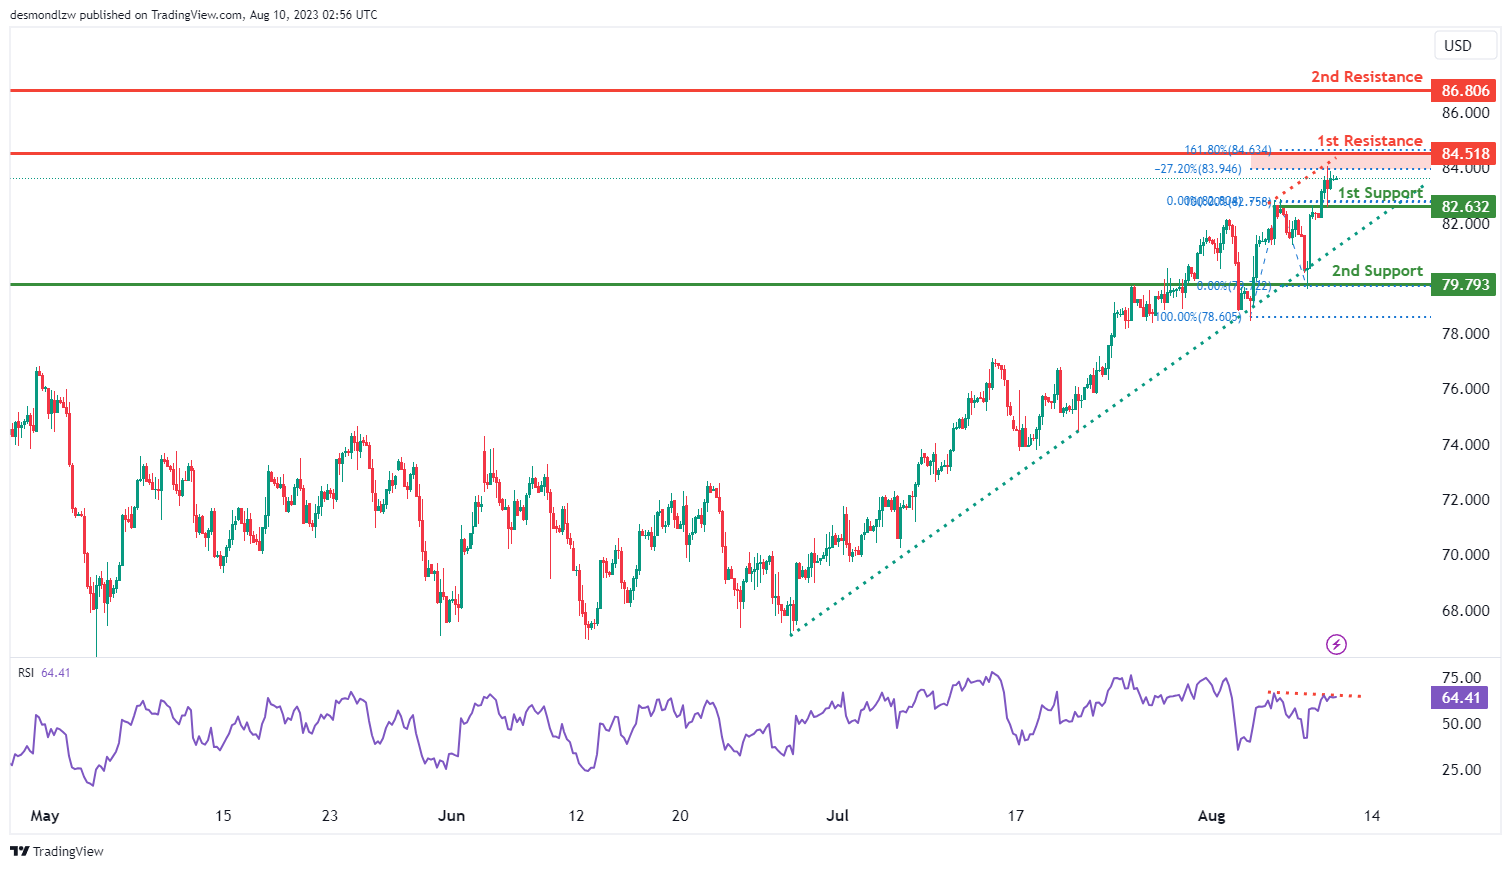
The WTI/USD chart currently showcases a bullish momentum, supported by its position above a significant ascending trend line, which signals the potential for further bullish momentum. Given this bullish outlook, there is a possibility for the price to extend its bullish movement towards the 1st resistance level. However, the Relative Strength Index (RSI) is exhibiting a bearish divergence in relation to price, indicating the possibility of an impending reversal.
The 1st support level, situated at 82.63, is recognized as an overlap support while the 2nd support at 79.79 is also identified as an overlap support.
To the upside, the 1st resistance at 84.52 gains importance as an overlap resistance that aligns with the -27.20% Fibonacci expansion and the 161.80% Fibonacci extension levels, signifying a Fibonacci confluence. In addition, the 2nd resistance level at 86.81 is identified as an overlap resistance.
XAU/USD (GOLD):
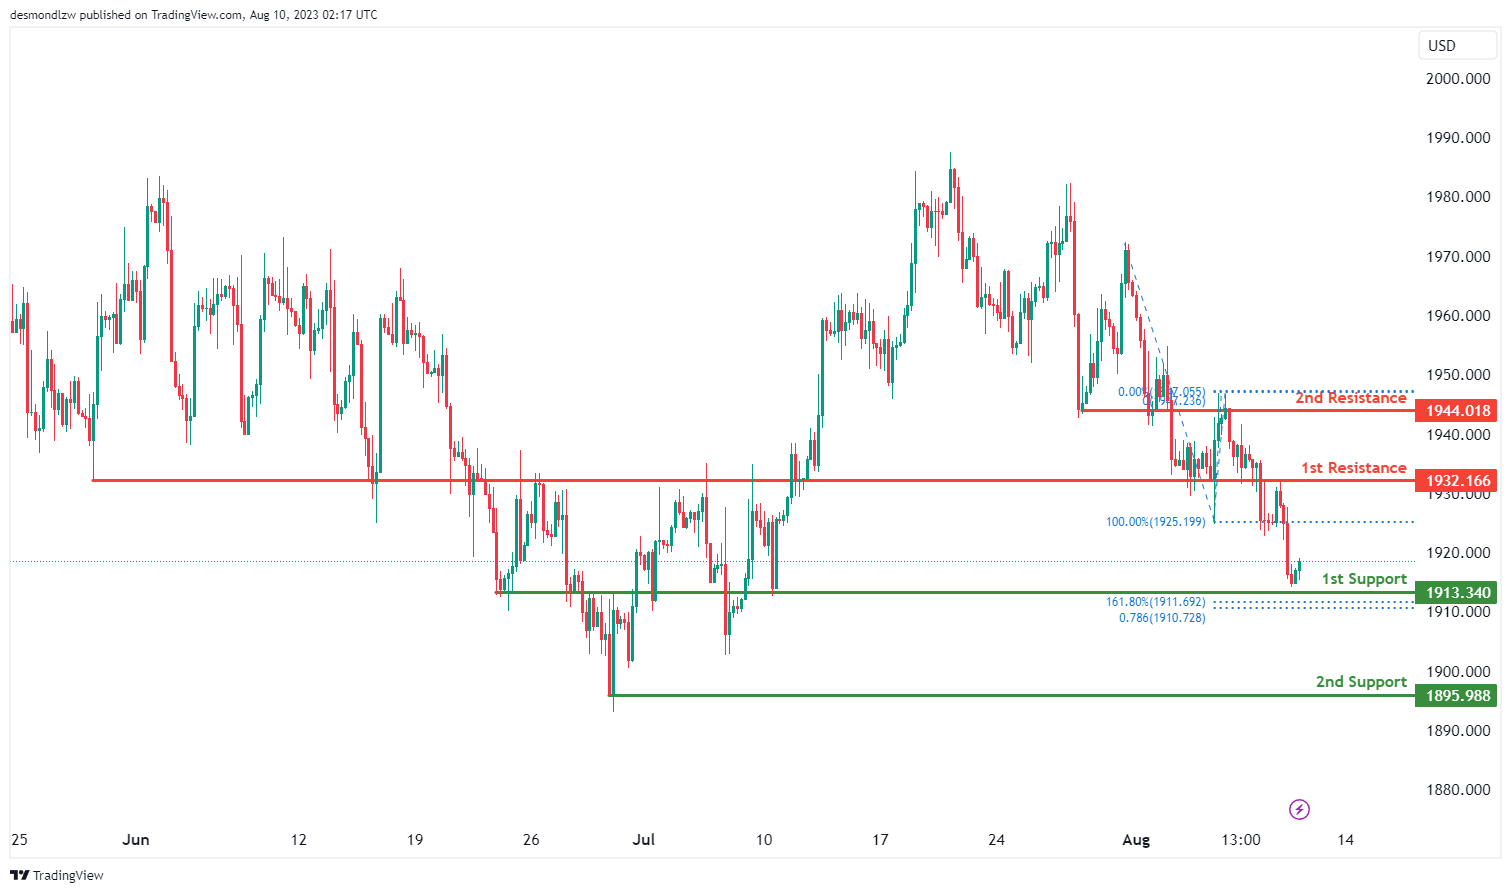
The XAU/USD chart presently portrays a bullish momentum, indicating a prevailing upward trend.
Within this context, there exists the potential for a bullish continuation towards the 1st resistance level.
The 1st support level, situated at 1913.34, is underscored by its status as an overlap support, notably converging with a 161.80% Fibonacci Extension and a 78.60% Fibonacci Projection, indicative of Fibonacci confluence.
A secondary support at 1895.98 enhances the support structure, identified as a swing low support.
Conversely, the 1st resistance level at 1932.16 is of significance as an overlap resistance.
Furthermore, the presence of a 2nd resistance level at 1944.01 as an overlap resistance adds to its prominence in influencing potential price movement.
Crude Oil Price Approaches $85, Can Bears Save The Day?
Key Highlights
- Crude oil price started a fresh increase above the $80 resistance.
- A key bullish trend line is forming with support near $82.25 on the 4-hour chart.
- Gold prices are moving lower and trading well below $1,925.
- The US Consumer Price Index could increase 3.3% in July 2023 (YoY), up from 3.0%.
Crude Oil Price Technical Analysis
Crude oil price formed a base above the $77.50 level against the US Dollar. The price started a fresh increase and was able to clear a major hurdle at $80.
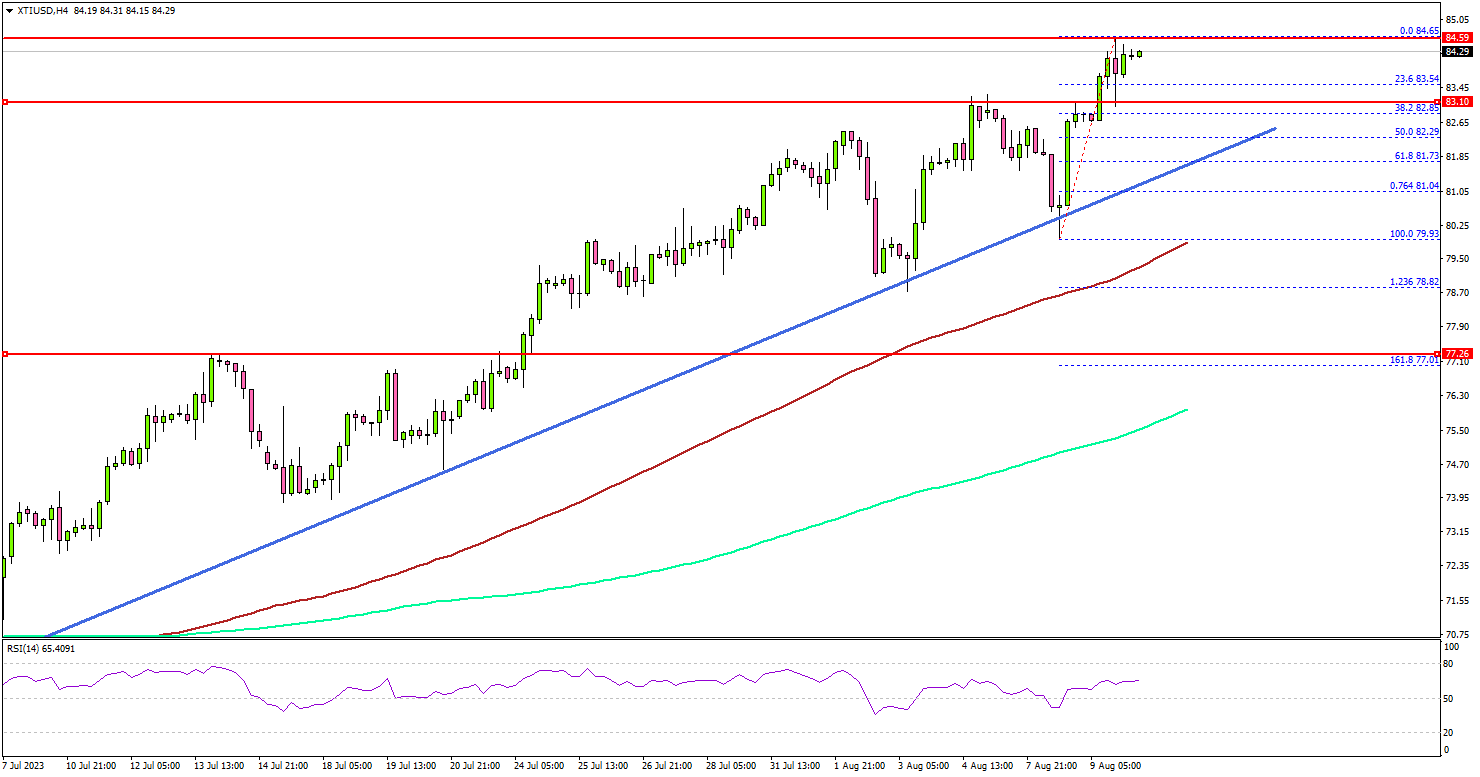
Looking at the 4-hour chart of XTI/USD, the price settled above the $80 level, the 100 simple moving average (red, 4-hour), and the 200 simple moving average (green, 4-hour).
The bulls even pushed the price toward the $85 resistance. A high is formed near $84.65 and the price is still showing bullish signs. On the downside, initial support is near the $83.10 level. The next major support sits near the $82.30 level.
There is also a key bullish trend line forming with support near $82.25 on the same chart. Any more losses might call for a test of the $80 support zone in the coming days.
On the upside, the first major resistance is near the $84.65 level. The next major resistance is near the $85 level, above which the price may perhaps accelerate higher. In the stated case, it could even visit the $88 resistance.
Looking at gold prices, there was a bearish reaction and the price could now move lower toward the $1,900 support zone.
Economic Releases to Watch Today
- US Consumer Price Index for July 2023 (MoM) – Forecast +0.2%, versus +0.2% previous.
- US Consumer Price Index for July 2023 (YoY) – Forecast +3.3%, versus +3.0% previous.
- US Initial Jobless Claims - Forecast 230K, versus 227K previous.
US CPI awaited, NASDAQ heading lower to 55 D EMA
Markets await key US consumer inflation data scheduled for release today, with projections centered on a 0.2% mom uptick for both headline and core CPI. On a yoy basis, headline CPI is anticipated to climb from 3.0% to 3.3%, while core CPI is projected to remain steady at 4.8%.
This anticipated rise in headline inflation, marking the first surge in over a year, can be attributed to unfavorable base effects and a moderate uptick in gas prices. Thus, this shouldn't particularly alarm Fed officials.
If the inflation figures align with expectations, the 0.2% monthly increase in both core CPI would be largely consistent with Fed's 2% inflation target. Such a scenario would strengthen the case for Fed to pause again in its September meeting, adopting a wait-and-see approach.
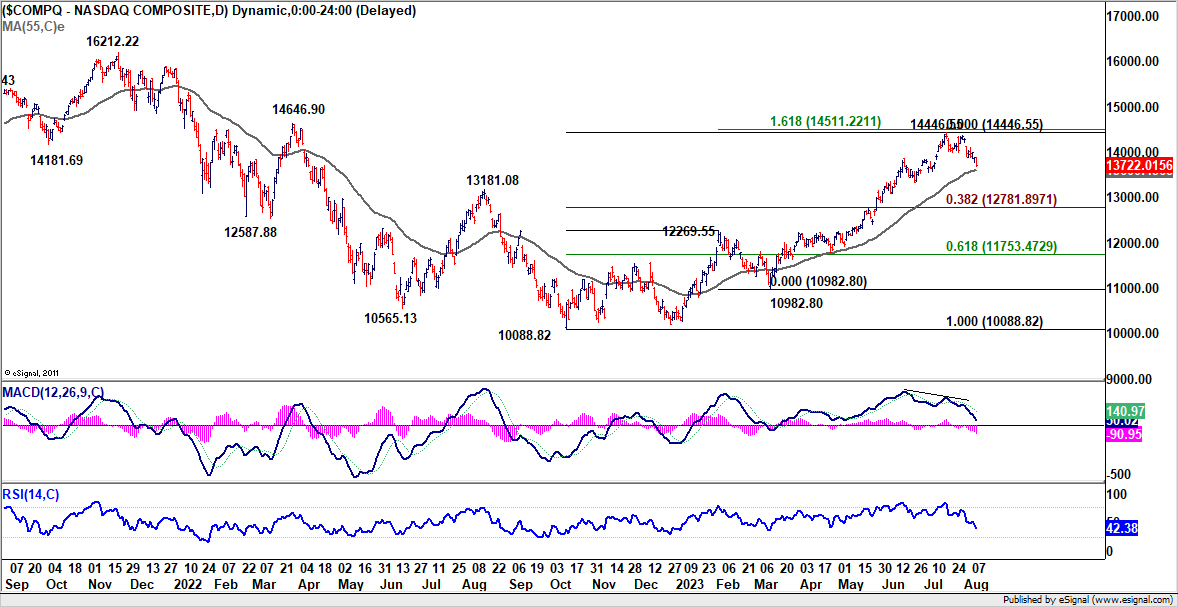
Following broad decline in US stocks, NASDAQ closed down -1.17% overnight. Current development suggests that a short term top at least formed at 14446.55. Deeper decline is expected to 55 D EMA (now at 13600.45).
The grappling question is whether rise from 10088.82, as the second wave of the medium term corrective pattern from 16212.22, has run off its course. It just missed target of 161.8% projection of 10088.82 to 12269.55 from 10982.80 at 14511.22.
Robust support from 55 D EMA would maintain near term bearishness for another rise through 14446.55 at a later stage. However, sustained break of this EMA would raise the chance of a bearish reversal. That is, the third leg of the medium term pattern has already started. NASDAQ would then test the second line of defense at 38.2% retracement of 10088.82 to 14446.55 at 12781.89 to determine its fate.
Preview of RBNZ: Steady as She Goes!
- The RBNZ will keep the OCR at 5.5% and retain its baseline forecast that the rate cycle has peaked.
- Economic developments will likely be viewed as broadly mixed and so will likely lead to only modest changes in the Bank's growth and inflation forecasts.
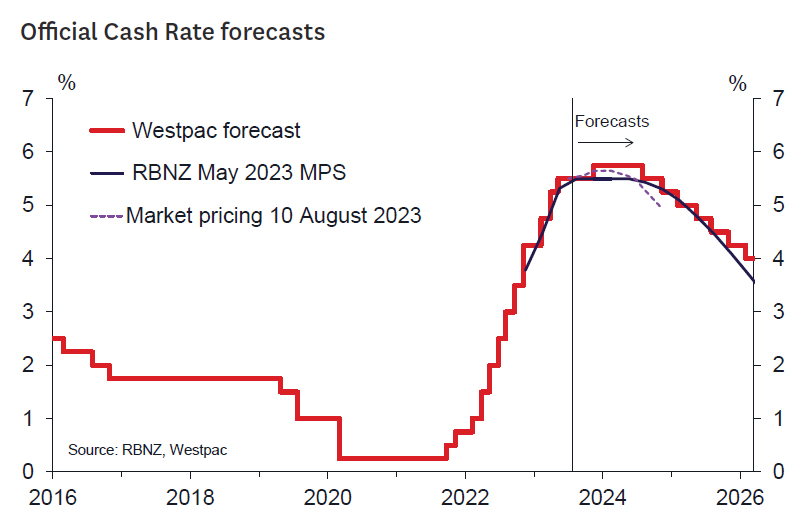
- Looking beyond this meeting, the Bank's forecast for the OCR should continue to indicate rates on hold until August 2024, falling slowly thereafter.
- The Bank will likely emphasise that any future move in policy will depend on the emerging data flow at home and abroad.
The August Monetary Policy Statement should be another "steady as she goes" affair. The RBNZ communicated a strong on-hold stance in the last Monetary Policy Statement in May and in the subsequent OCR review. The overall data flow would likely not have significantly shifted that stance in either direction.
That's not to say there won't be changes to their forecasts. Key factors pushing down inflation pressures in their forecasts will be:
- Weaker March quarter GDP: The RBNZ's starting point for the level of excess capacity in the economy will be adjusted down to reflect that March quarter GDP was weaker than they expected in May. Consequently, the RBNZ he output gap estimate will point to a less overstretched economy.
- A weaker terms of trade and global outlook: Recent months have seen weakness in China, the key market for many of main exports and many of our imports. While the strength of global growth doesn't have a large impact on the RBNZ estimates of inflation, the Bank may make some downward allowance for those developments. Of great significance has been the related substantial downgrade to the outlook for commodities export prices (milk, meat, logs for example), which will imply a weaker terms of trade and lower farm/business incomes. This is probably the largest negative factor weighing on the economic and inflation outlook and will matter for the short and medium- term outlook.
- Higher mortgage rates: the RBNZ noted in their July review these have trended up and marginally tightened financial conditions.
- Slightly weaker wages and a fractionally higher starting point for the unemployment rate: these adjustments were more marginal but nonetheless would be seen as helpful in managing upside risks to the inflation outlook. The Bank may also take comfort from the ongoing decline in the vacancy rate and reports of reduced job 'churn' when thinking about future risks to wages.
On the upside in terms of inflation pressure we expect to see:
- An upgraded house price outlook: House prices have found a base sooner than the RBNZ expected and have taken initial tentative steps higher. The RBNZ will need to reflect this at least in their near-term forecasts.
- A still resilient labour market: Population and labour force growth has been robust and has facilitated stronger employment growth. A sharp downshift in these indicators is required to square with the RBNZ's projected recession over Q2-Q4 2023 making it likely that some upgrade to the nearterm growth outlook will occur – even if just to push the negative quarters of growth out a bit. This will likely broadly offset the downside surprise from the Q1 GDP report.
- Stronger domestic price pressures: While the headline CPI was in line with expectations, non-tradables inflation was higher than the RBNZ assumed, and that will raise questions on how persistent price pressures will be in the next few quarters. The wide-spread nature of pricing pressures should see some short-term upward adjustment to the inflation outlook here.
So where does this all leave us? Probably broadly unchanged in terms of the overall economic outlook and the forward inflation profile. Hence there shouldn't be much change in the OCR track which will probably still show an unchanged OCR until the September quarter of next year (consistent with Westpac's view of easings beginning in the August Statement).
However, what probably has changed is the spread of the risk distribution. Both upside and downside inflation risks have become more pronounced since the May Statement. On the downside the focus should be on the weakness in China and commodities markets and the potential for an earlier move lower in inflation and a deeper recession. A May 2024 easing could come into focus in that scenario.
On the upside, greater persistence in domestic inflation, stronger house prices, and a slower adjustment in the labour market would put the November Statement tightening Westpac sees firmly on the table.
Given these risks, it is probable that the Bank will emphasise that policy is not on a predetermined path and that it will be closely monitoring the emerging data flow both here and abroad.
Japan’s PPI slows down for seventh consecutive month
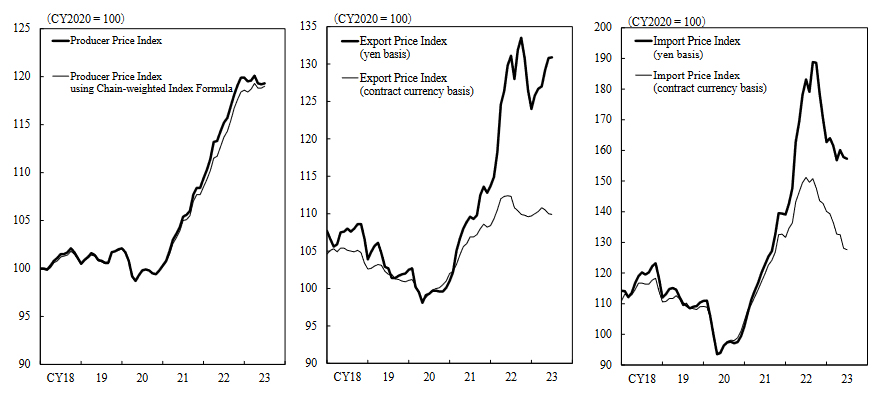
Japan's PPI for July has once again reported a slowdown, decelerating from 4.3% yoy in the previous month to 3.6% yoy. However, this figure slightly surpassed market expectations, which anticipated a drop to 3.5% yoy. It's worth noting that this marks the seventh consecutive month of decline for PPI, tracing back from its December peak of 10.6% yoy.
Looking at some details, yen-denominated import prices saw a significant dip. The -14.1% yoy decline in July, a steeper fall than June's -11.4% yoy, extends the negative trend to its fourth consecutive month.
Simultaneously, yen-denominated export prices also demonstrated downward trends, slipping from a positive growth of 0.8% yoy in the preceding month to a negative -0.2% yoy in July.
Gold Wave Analysis
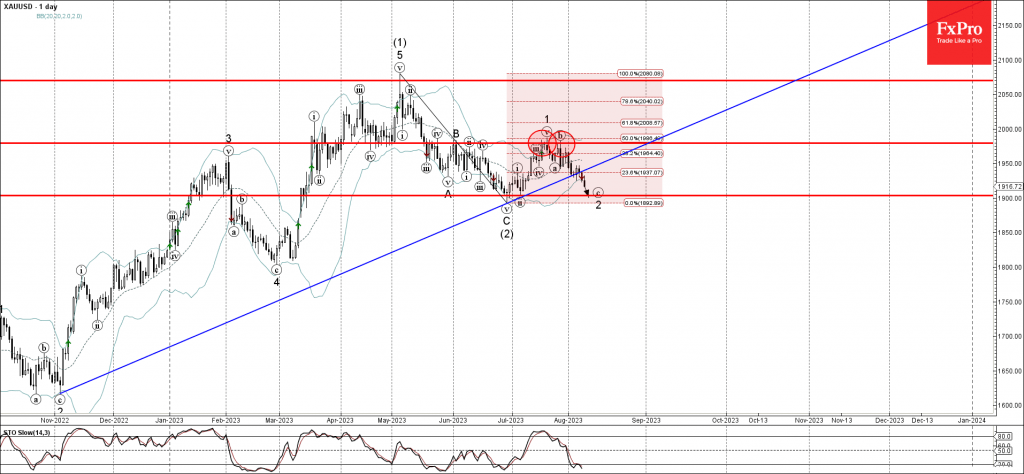
- Gold broke support trendline from November
- Likely to fall to support level 1900.00
Gold previously broke the support trendline from last November, which accelerated the c-wave of the active ABC correction 2.
The active c-wave started earlier from the key resistance level 1980.00, former strong support from April – which has been reversing gold for the last few weeks.
Gold can be expected to fall further toward the next support level 1900.00 (target price for the completion of the active c-wave, monthly low from June).
EURNZD Wave Analysis
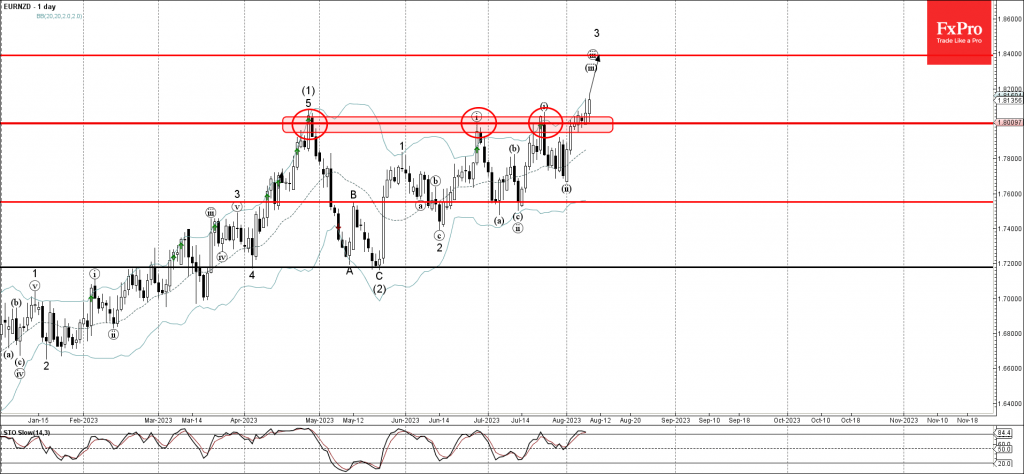
- EURNZD broke round resistance level 1.8000
- Likely to rise to resistance level 1.8400
EURNZD recently broke above the round resistance level 1.8000, which has been steadily reversing the price from April, as can be seen below.
The breakout of the resistance level 1.8000 accelerated the active impulse waves iii and 3, which belong to the intermediate impulse wave (3) from May.
Given the clear daily uptrend, EURNZD can be expected to rise further toward the next resistance level 1.8400 (target price for the completion of the active impulse wave iii).
Could July’s ECB Rate Hike Curse Reappear and Cause Significant Euro Underperformance Until Year-end?
The month of July tends to bring confusing memories for ECB followers due to the respective 2008 and 2011 meetings. Both rate hikes announced back then were eventually seen as policy mistakes with the ECB quickly forced to subsequently ease monetary policy afterwards. Are there any similarities with the current ECB situation? What was the performance of euro-dollar after the July 2008 and 2011 events?
July tends to create a need for policy changes at the ECB
ECB's President Lagarde announced a strategy change at the last meeting by moving to a data-dependent stance. This considerable adjustment was mostly the product of the substantial disagreements emerging at the ECB governing council over the worsening growth outlook. A few ECB members have an extra reason to worry about since the month of July brings strange memories due to the July-2008 and July-2011 ECB meetings.
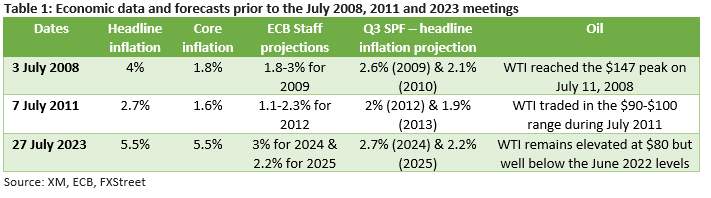
In July 2008, the then President Trichet announced a 25bps rate hike after a 13-month monetary policy pause. With oil prices trading north of $140, and the ECB staff projections and the Survey of Professional Forecasters (SPF) figures showing 1-year inflation remaining comfortably above the 2% price target, it then seemed a reasonable decision for the ECB. However, developments elsewhere, and particularly the lingering subprime crisis in the US, quickly forced the ECB to cut its refinance rate by 175 bps by year-end.
Similarly, in July 2011 President Trichet again ignored the unfolding euro area debt crisis (Greece was going through its first adjustment programme that was agreed on May 2010) and one of the sturdiest US debt ceiling episodes to announce a surprising 25bps rate hike. Contrary to 2008, ECB staff forecasts and Survey of Professional Forecasters figures showed inflation mostly under control on the examined horizon despite the elevated oil prices. Trichet et al were again quickly forced to ease monetary policy by 50bps by end-2011 as the euro area debt crisis was spreading.
Similarities and differences with 2008 and 2011
There are some interesting similarities with the current situation as seen in Table 1 above and Table 2 below. Headline inflation remains elevated, and oil prices are probably at the upper end of their recent trends in all three of these periods. Delving even further and by using the German PMI as a proxy for the euro area, we observe that the Manufacturing component prior to the 2008 and 2011 meetings was on a clear downward path. Now, this indicator is actually hovering at a very low level and signaling a continued contraction of this critical sector. On the flip side, the Services sector was growing in the three periods examined.
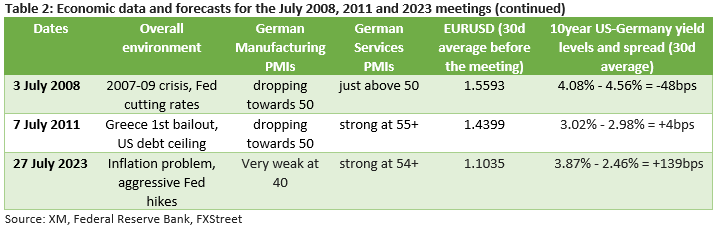
On the other hand, the situation is much different when examining market instruments. In both 2008 and 2011, the ECB was facing an extremely high euro-dollar exchange rate. As seen in Table 2, the 30-day averages leading up to the 2008 and 2011 gatherings were 1.5593 and 1.4399 respectively. These levels tend to hinder the competitiveness of euro area products and thus dampen future inflation. These levels were partly fueled by a risk-off sentiment in the markets as the US was facing its own serious issues.
This situation can also be seen at the 10-year US-German yield spread. In July 2008, the spread was in favour of the German Bunds and in July 2011 the spread was almost zero. Now, the spread is clearly favouring US Treasuries, thus adding another factor against the long-term appreciation of the euro.
What came next for euro-dollar in both 2008 and 2011?
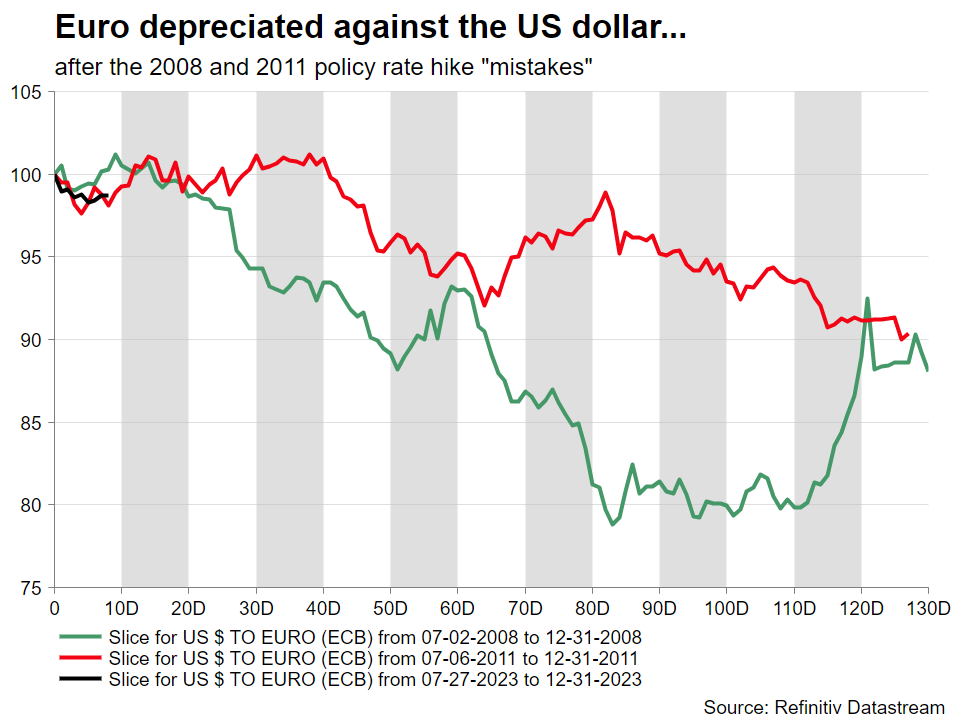
As we can see from Chart 1 below, the euro underperformed against the US dollar after both the July 2008 and 2011 rate hikes, ending each respective year 12% and 10% lower. It is currently around 1% lower since the July 27, 2023 meeting as the market is prepping for the Jackson Hole gathering in late August, and the September central banks’ meetings. Similar results can be found when examining the performance of euro-yen with the pair dropping 25% and 14% respectively by year-end in 2008 and 2011.
Has the ECB made the same mistake again?
Both rate hikes in 2008 and 2011 were seen as too hasty and eventually branded as policy mistakes with the ECB quickly forced to aggressively cut rates during the fourth quarter in both 2008 and 2011. Some would argue that the current situation is different, especially when considering the overall market sentiment and the euro-dollar level and despite the plunging PMIs. However, should the September ECB staff projections point to headline inflation being at or below 2%+ in 2025, the door would probably be shut for another rate hike during 2023. And this would remove one of the stronger euro tailwinds, potentially leading to a repeat of the 2008 and 2011 underperformance against the US dollar.
British Pound Flat on Light Data Calendar
- US inflation expected to rise to 3.3%
- UK GDP projected to fall to 0%
- Fed member Harker says rates may have peaked
The British pound has had a relatively quiet week. In the North American session, GBP/USD is trading at 1.2731, down 0.13%.
Markets eye US inflation, British GDP
It has been a quiet week on the data calendar, with no tier-1 events out of the UK or the US. The rest of the week will be busier, with the US inflation report on Thursday and UK GDP on Friday. That could mean some volatility for the sleepy British pound.
US inflation expected to rise
The Federal Reserve’s aggressive tightening campaign has made its impact felt, as inflation has been falling and dropped to 3.0% in June. Headline CPI is expected to rise to 3.3% in July, while the core rate is expected to remain steady at 4.8%. Will an uptick in inflation change the Fed’s rate path? Probably not, especially if Jerome Powell follows the view that he has often stated, which is that a rate policy is not based on one or two inflation reports.
The money markets are confident that the Fed will take a pause at the September 20th meeting, with an 86% probability according to the FedWatch tool. Another pause in November is likely (71% probability), but a higher-than-expected inflation report on Thursday would likely raise the odds of a rate hike in November.
Fed member Harker said on Tuesday that the Fed might be done raising rates, “absent any alarming new data”. Harker said that rates would need to stay at the current high levels “for a while” and went as far as to say that the Fed would likely cut rates at some point in 2024.
The UK economy is not in good shape and the possibility of a recession is very real. GDP is expected to flatline in Q2 (0.0%) after a weak gain of 0.1% in the first quarter. A weaker-than-expected GDP reading could spook investors and send the British pound lower.
GBP/USD Technical
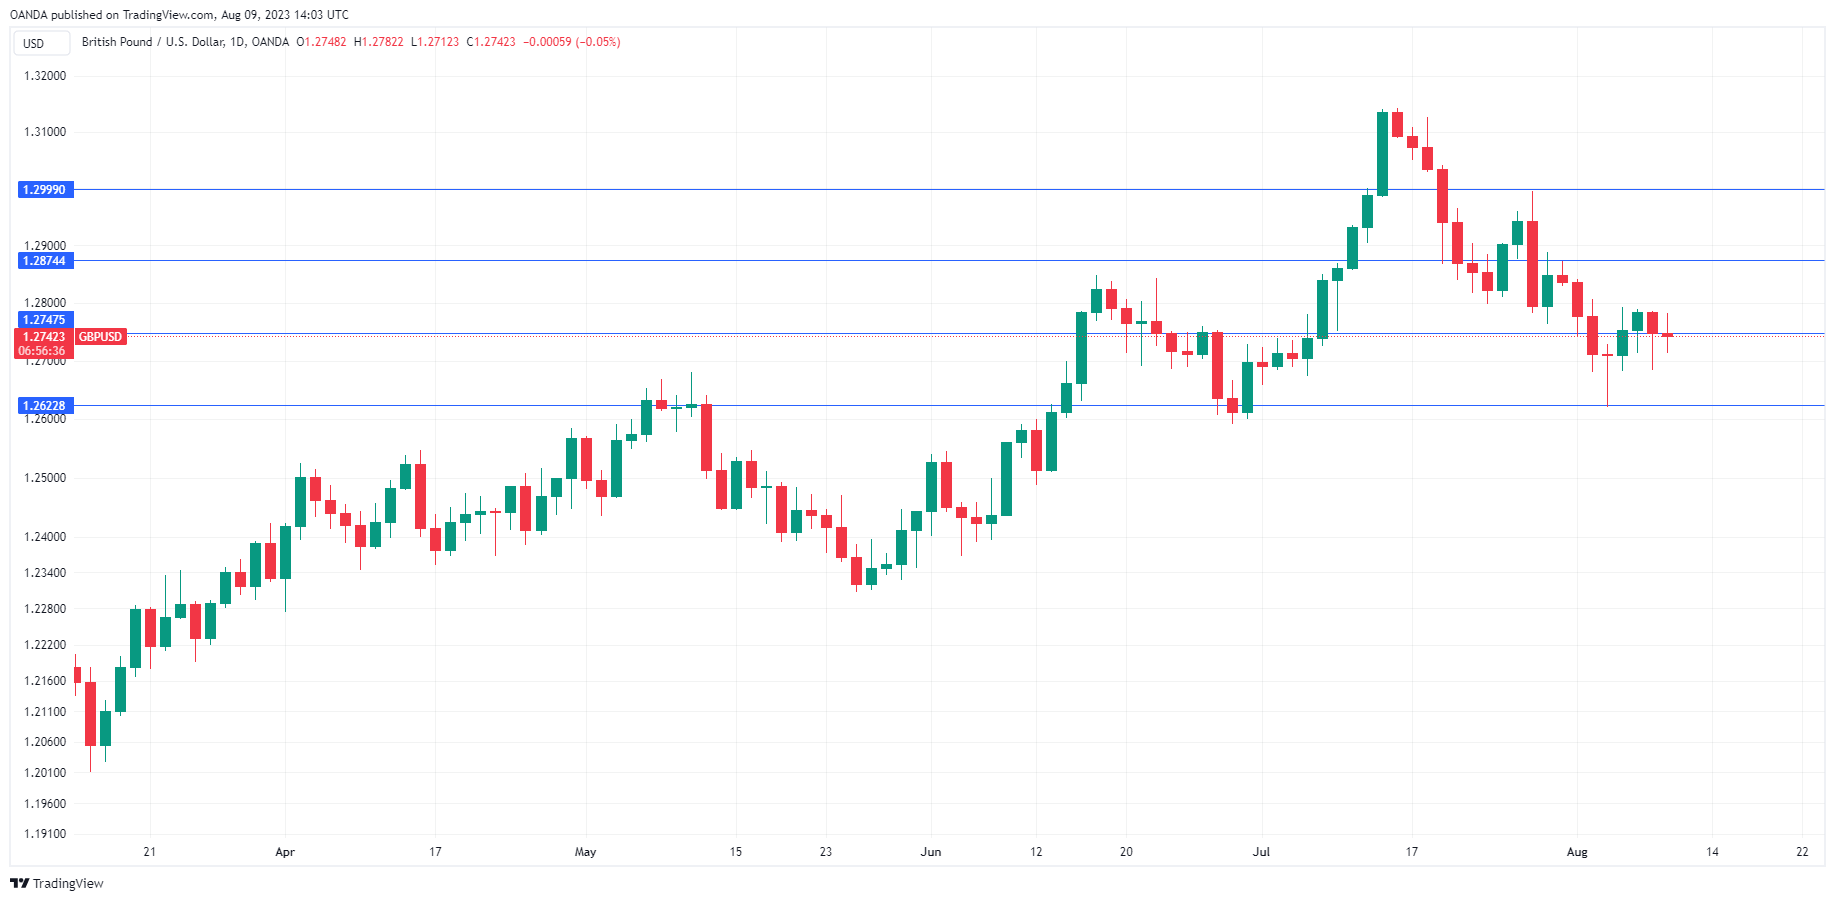
- GBP/USD is testing support at 1.2747. The next support level is 1.2622
- 1.2874 and 1.2999 are the next resistance lines