

Sample Category Title
AUD/USD Daily Report
Daily Pivots: (S1) 0.6502; (P) 0.6540; (R1) 0.6582; More...
Further decline remains in favor in AUD/USD despite today's recovery. Decisive break of 0.6457 support will confirm resumption of whole fall from 0.7156. Next target is 100% projection of 0.7156 to 0.6457 from 0.6894 at 0.6195. Nevertheless, firm break of 0.6608 minor resistance will dampen this view, and turn bias back to the upside for stronger rebound.
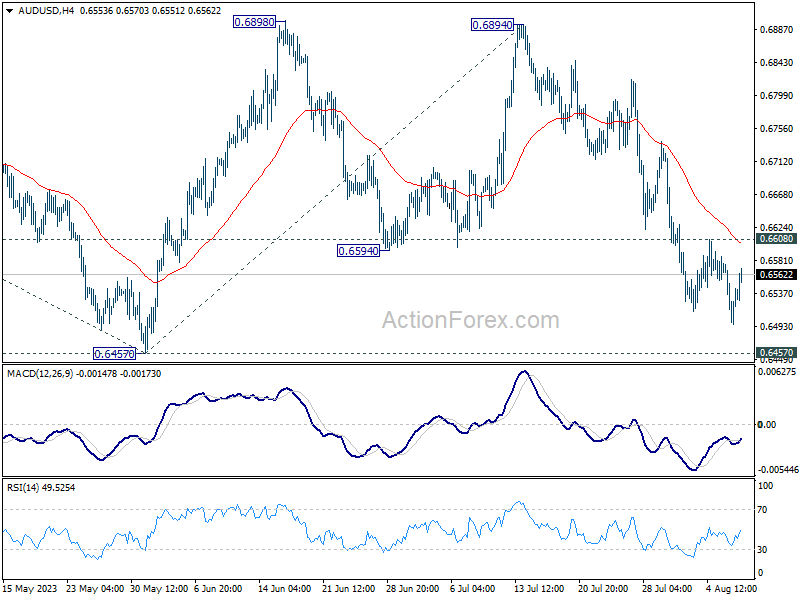
In the bigger picture, outlook is mixed for now as AUD/USD failed to sustain above both 55 D EMA (now at 0.6686) and 55 W EMA (now at 0.6769). On the upside, break of 0.6894 resistance will solidify the case that down trend from 0.8006 (2021 high) has already completed, and target 0.7156 resistance for confirmation. However, break of 0.6457 will likely resume the down trend through 0.6169 (2022 low).
USD/CAD Daily Outlook
Daily Pivots: (S1) 1.3353; (P) 1.3428; (R1) 1.3491; More....
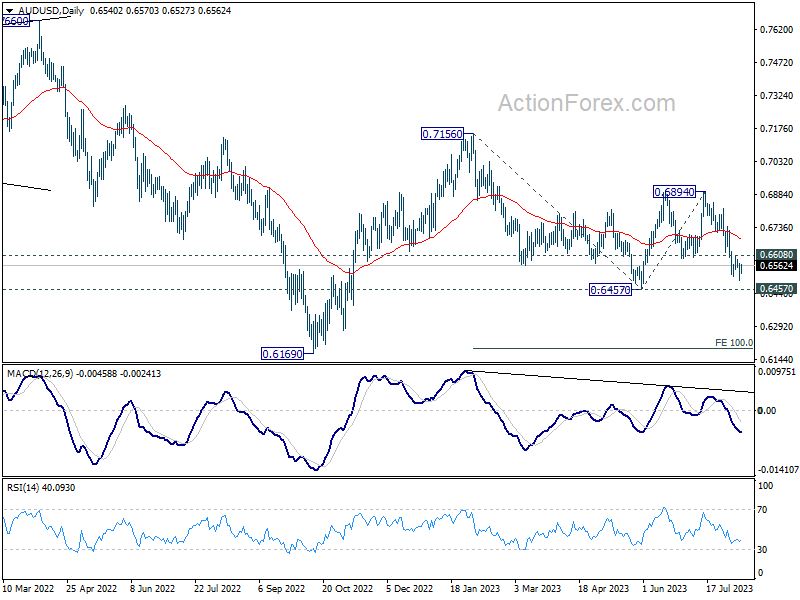
Intraday bias in USD/CAD remains on the upside at this point. Current development argues that correction from 1.3976 has completed with three waves down to 1.3091. Further rally would be seen to 1.3653 resistance next. Break there will further confirm this case and target 1.3976 high. On the downside, though, below 1.3318 minor support will mix up the outlook and turn intraday bias neutral again first.
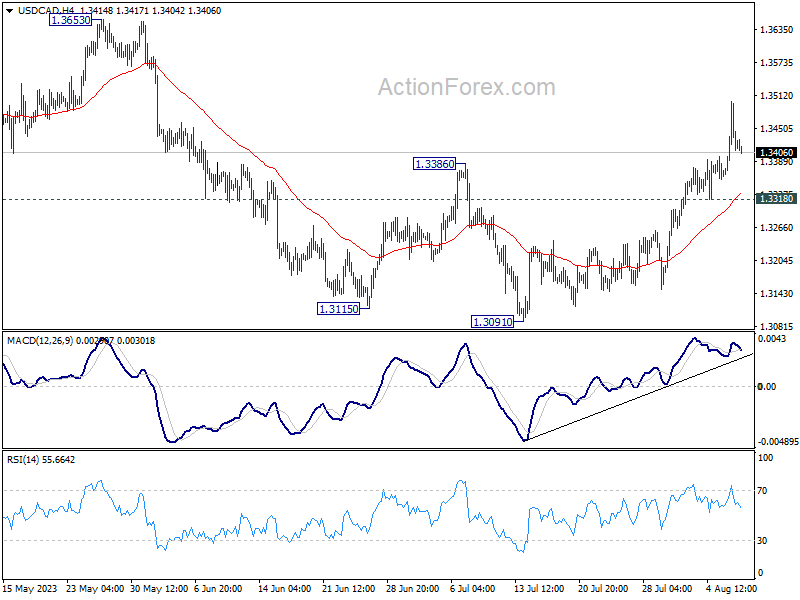
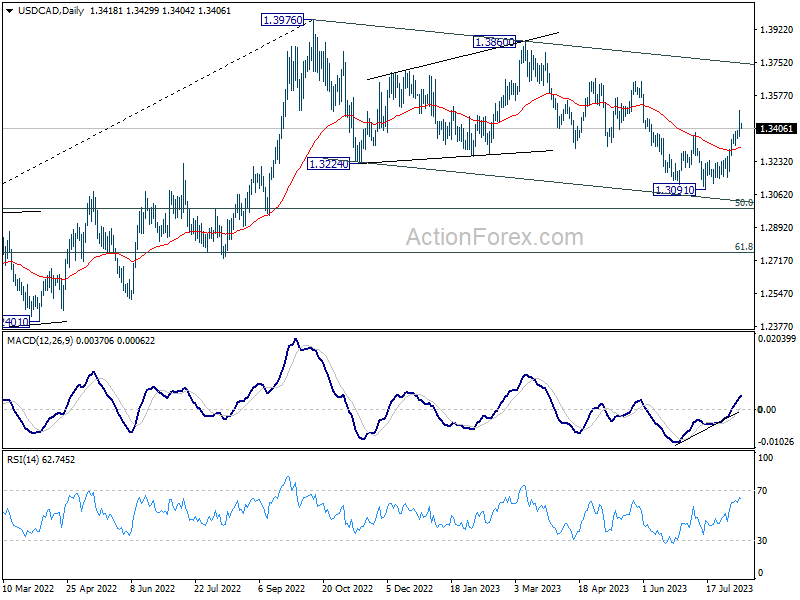
In the bigger picture, price actions from 1.3976 are viewed as a corrective fall only. Upon completion, rise from 1.2005 (2021 low) would resume through 1.3976 towards 1.4667/89 long term resistance zone. In case of another fall, downside should be contained by 61.8% retracement of 1.2005 to 1.3976 at 1.2758.
USD/JPY Daily Outlook
Daily Pivots: (S1) 142.69; (P) 143.10; (R1) 143.78; More...
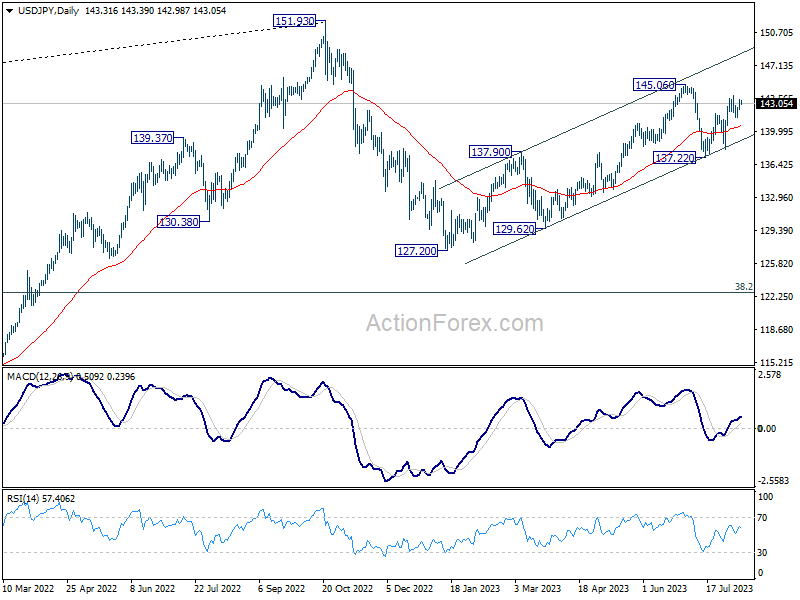
Intraday bias in USD/JPY stays neutral at this point. On the upside, break of 143.88 will resume the rebound from 137.22 to retest 145.06. Decisive break there will resume whole rally from 127.20. On the downside, however, break of 141.50 will turn bias back to the downside for 55 D EMA (now at 140.60).
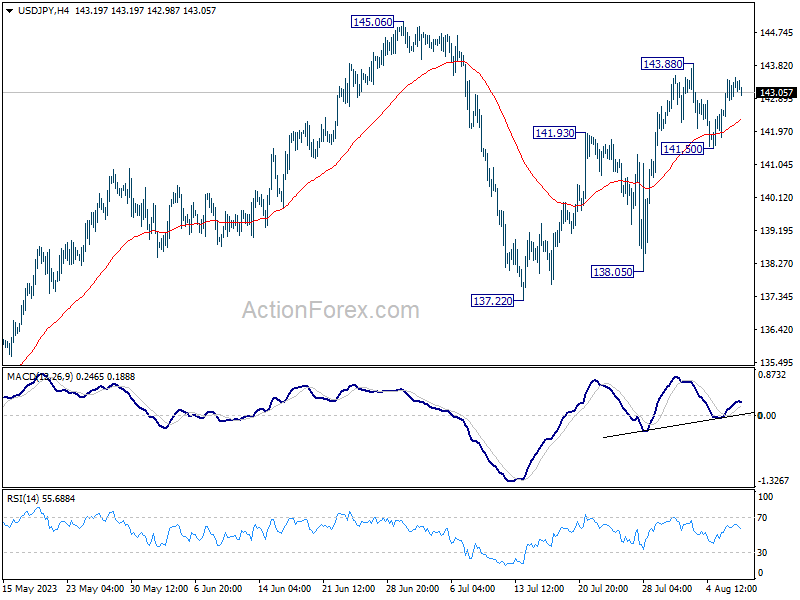
In the bigger picture, overall price actions from 151.93 (2022 high) are views as a corrective pattern. Rise from 127.20 is seen as the second leg of the pattern and could still be in progress. But even in case of extended rise, strong resistance should be seen from 151.93 to limit upside. Meanwhile, break of 137.22 support should confirm the start of the third leg to 127.20 (2023 low) and below.
USD/CHF Daily Outlook
Daily Pivots: (S1) 0.8720; (P) 0.8752; (R1) 0.8785; More....
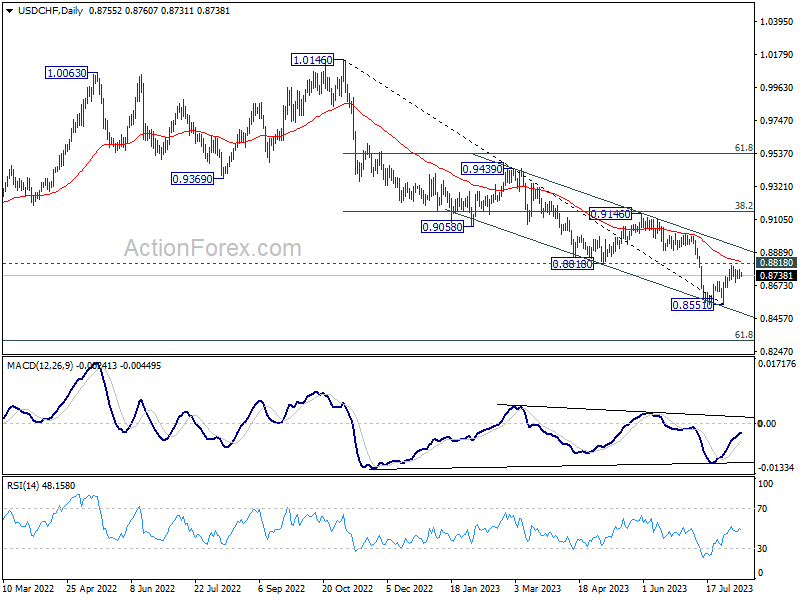
Intraday bias in USD/CHF remains neutral as sideway trading continues. On the downside break of 0.8663 minor support should confirm rejection by 0.8818 and turn intraday bias back to the downside for retesting 0.8551 first. Nevertheless, decisive break of 0.8818 will carry larger bullish implication, and target 0.9146 cluster resistance next.
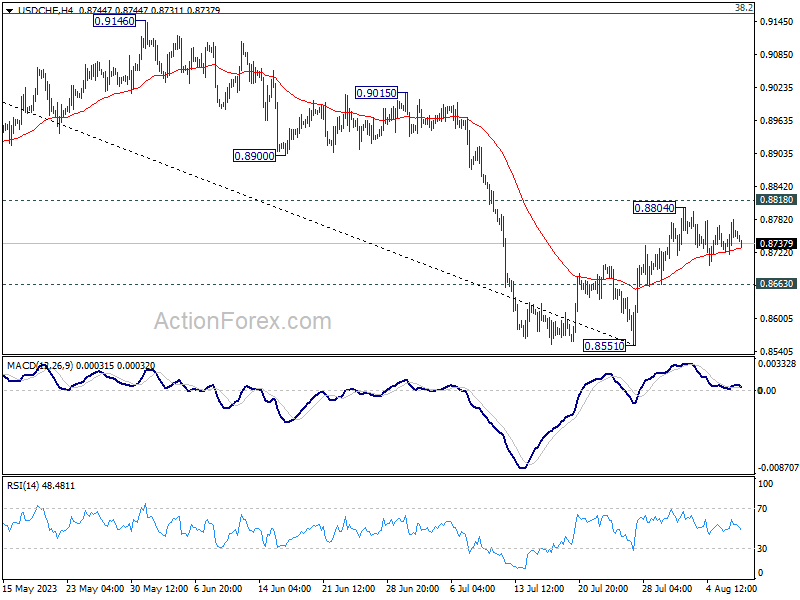
In the bigger picture, down trend from 1.0146 is seen as in progress as long as 0.8188 support turned resistance holds. Next target is 61.8% retracement of 0.7065 (2011 low) to 1.0342 (2016 high) at 0.8317. However, sustained break of 0.8818 should indicate medium term bottoming, and bring stronger rise back to 0.9146 cluster resistance (38.2% retracement of 1.0146 to 0.8551 at 0.9160), even as a correction.
EUR/USD Daily Outlook
Daily Pivots: (S1) 1.0920; (P) 1.0966; (R1) 1.1002; More...
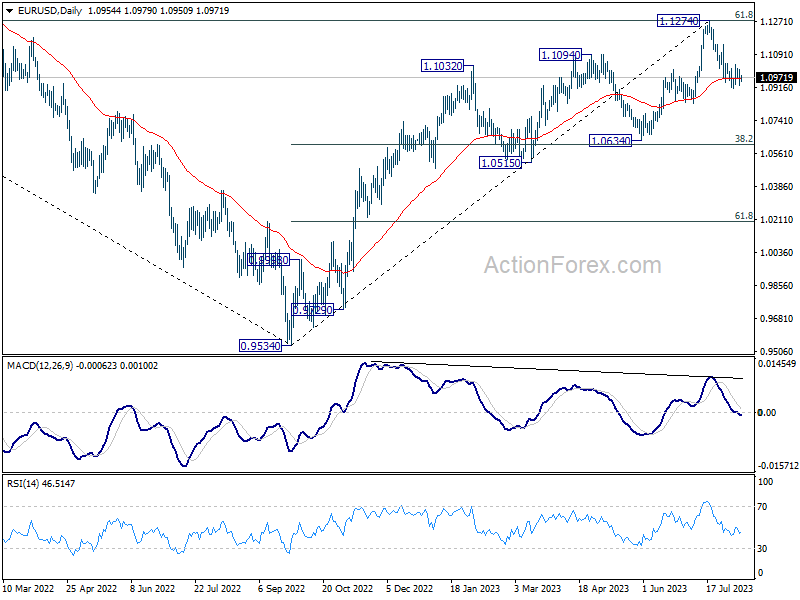
Intraday bias in EUR/USD remains neutral as it's still bounded in range above 1.0911. r. On the downside, break of 1.0911 will resume the fall from 1.1274 to 1.0832 support. Sustained trading below there will target 1.0609/34 cluster support. However, firm break of 1.1046 minor resistance will argue that pull back from 1.1274 has completed, and bring stronger rebound.
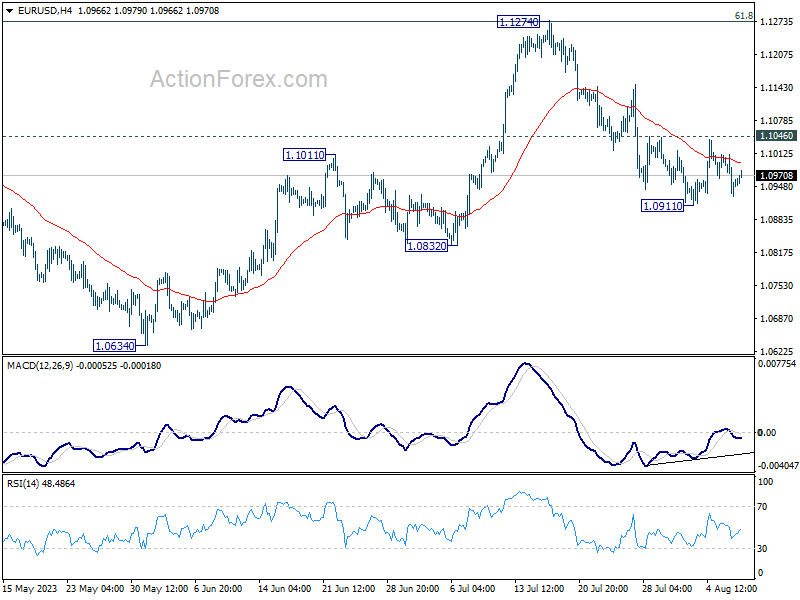
In the bigger picture, a medium term top could be formed at 1.1274, after failing to break through 61.8% retracement of 1.2348 (2021 high) to 0.9534 at 1.1273 decisively, on bearish divergence condition in D MACD. Sustained trading below 55 D EMA (now at 1.0966) will bring deeper correction to 1.0634 cluster support (38.2% retracement of 0.9534 to 1.1274 at 1.0609). Strong support could be seen there, at least on first attempt, to set the range for consolidation.
GBP/USD Daily Outlook
Daily Pivots: (S1) 1.2692; (P) 1.2740; (R1) 1.2795; More...
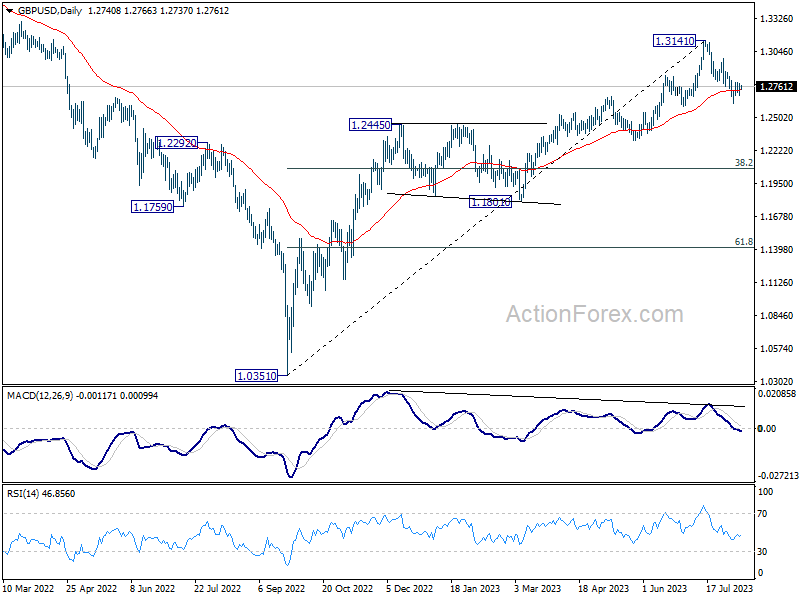
GBP/USD is still bounded in range above 1.2618 and intraday bias stays neutral at this point. On the downside, below 1.2618, and sustained trading below 1.2678 resistance turned support will argue that it's already in a larger correction. Deeper decline would then be seen to 1.2306 support next. Nevertheless, firm break of 1.2796 will indicate that the pull back has completed, and turn bias back to the upside for stronger rebound.
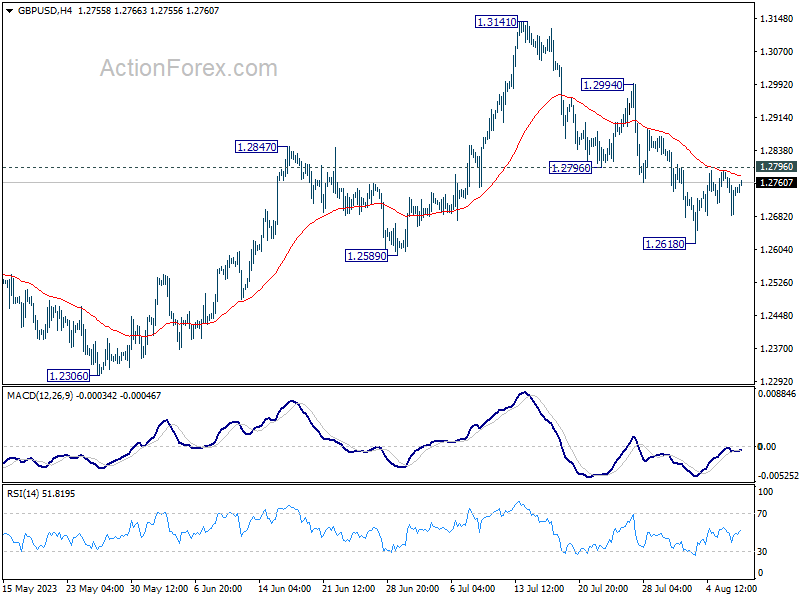
In the bigger picture, a medium term top could be in place at 1.3141 already, on bearish divergence condition in D MACD. Sustained trading below 55 D EMA (now at 1.2726) should confirm this case, and bring deeper fall to 38.2% retracement of 1.0351 to 1.3141 at 1.2075, as a correction to up trend from 1.0351 (2022 low). For now, rise will stay mildly on the downside as long as 1.3141 resistance holds, in case of strong rebound.
Markets Turned Cautious after after China’s Deflation Data
Asian markets exhibited mild risk-off sentiment today, but with limited selloffs observed. China's data revealed a foray into deflation, though expectation remains that this may not be a prolonged phase, especially given the milder-than-expected dip in CPI. While this doesn't offer a significant boost in market sentiment, it's somewhat less gloomy than anticipated.
In the currency arena, the dynamism seemed to ebb once again. Dollar's rally overnight rally appeared to run out of steam swiftly, suggesting that traders might be reserving their significant moves for the impending US CPI data release tomorrow. Concurrently, both Australian and New Zealand Dollars witnessed marginal recoveries.
For the week at hand, British Pound is leading the charge, followed closely by Dollar and Swiss Franc. On the flip side, Japanese Yen finds itself at the bottom of the performance chart, with Euro and Canadian Dollar trailing not far behind. Post its recovery today, Australian Dollar is mixed for now, together with its Canadian counterpart.
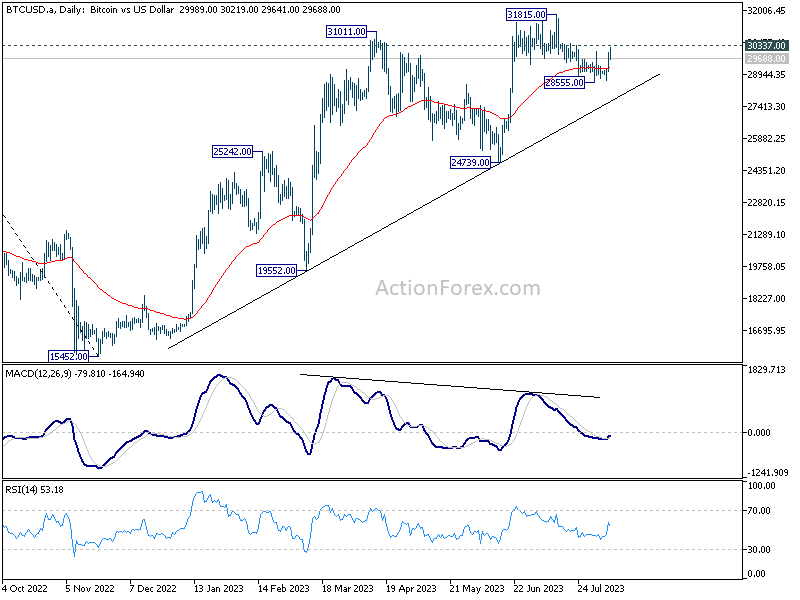
Technically, Bitcoin is attempting a rebound this week, but upside is so far capped by 30337 resistance. Break of this resistance level will suggest that the corrective pullback from 31815 has completed at 28555. That would reaffirm near term bullish for another rise through 31815 to resume larger rally from 15452. If that's realized, let's see if NASDAQ would accompany the move higher. Overnight, DOW dropped -0.45%. S&P dropped -0.42%. NASDAQ dropped -0.79%. 10-year yield dropped -0.052 to 4.026.
China CPI down -0.3% yoy, first negative since 2021
China's CPI for July registered a drop of -0.3% yoy, marking its first decline since February 2021. Although this result is slightly better than the market's expectation of a -0.4% drop, it underscores the economic headwinds faced.
Core inflation measure, which excludes the often erratic food and energy costs, showed a rise to 0.8% yoy from a mere 0.4% yoy. This points to some underlying demand within the economy, albeit muted.
A deeper dive into CPI reveals that food prices have seen a -1% fall yoy, a sharp contrast to the 2.3% yoy rise observed in the previous month. On the other hand, non-food prices climbed 0.5% yoy last month, bouncing back from a -0.6% yoy.
Dong Lijuan, chief statistician at the NBS, commented, "With the impact of a high base from last year gradually fading, the CPI is likely to rebound gradually."
On the PPI front, situation remains challenging. PPI improved from -5.4% yoy to -4.4% yoy in July. This figure not only missed market expectations, which stood at -3.8% yoy, but also marked the tenth straight month of negative readings.
RBNZ business survey points to lower inflation expectations, steady interest rates
As seen from the latest Quarterly RBNZ Survey of Expectations, businesses have slightly tapered their inflation expectations in the near term but wage inflation expectations were on the rise. RBNZ OCR is expected to be unchanged at the current 5.50% through the quarter.
Expectations for annual inflation one year ahead have moderated, moving from 4.28% to 4.17%. However, a two-year horizon sees a marginal uptick in these expectations, which have climbed from 2.79% to 2.83%.
More long-term views, reflected in the five and ten-year ahead inflation expectations, both indicate a pullback, dropping to 2.25% (from 2.35%) and 2.22% (from 2.28%), respectively.
A notable area of concern stems from the annual wage inflation expectations. Over the course of both one and two years, these expectations are on the rise. For the year ahead, expectations climbed from 4.80% to 5.04%, and for the two-year mark, they increased from 3.53% to 3.66%.
Regarding monetary policy, the survey results indicate a stable outlook on the OCR. By the close of the September 2023 quarter, businesses anticipate OCR to average around 5.53%, a minimal climb from the prior quarter's estimate of 5.47%. A one-year ahead mean estimate rose 32 basis points to 5.16% from the previous 4.84%.
Average one-year ahead GDP growth forecast surged to 1.02%, up from previous 0.48%. Moreover, businesses seem to be projecting continued momentum, with two-year ahead GDP growth expectations reaching 1.95% from preceding 1.66%.
GBP/USD Daily Outlook
Daily Pivots: (S1) 1.2692; (P) 1.2740; (R1) 1.2795; More...
GBP/USD is still bounded in range above 1.2618 and intraday bias stays neutral at this point. On the downside, below 1.2618, and sustained trading below 1.2678 resistance turned support will argue that it's already in a larger correction. Deeper decline would then be seen to 1.2306 support next. Nevertheless, firm break of 1.2796 will indicate that the pull back has completed, and turn bias back to the upside for stronger rebound.
In the bigger picture, a medium term top could be in place at 1.3141 already, on bearish divergence condition in D MACD. Sustained trading below 55 D EMA (now at 1.2726) should confirm this case, and bring deeper fall to 38.2% retracement of 1.0351 to 1.3141 at 1.2075, as a correction to up trend from 1.0351 (2022 low). For now, rise will stay mildly on the downside as long as 1.3141 resistance holds, in case of strong rebound.
Economic Indicators Update
| GMT | Ccy | Events | Actual | Forecast | Previous | Revised |
|---|---|---|---|---|---|---|
| 01:30 | CNY | CPI Y/Y Jul | -0.30% | -0.40% | 0.00% | |
| 01:30 | CNY | PPI Y/Y Jul | -4.40% | -3.80% | -5.40% | |
| 03:00 | NZD | RBNZ Inflation Expectations Q/Q Q3 | 2.83% | 2.79% | ||
| 06:00 | JPY | Machine Tool Orders Y/Y Jul P | -19.80% | -21.70% | -21.10% | |
| 12:30 | CAD | Building Permits M/M Jun | 2.30% | 10.50% | ||
| 14:30 | USD | Crude Oil Inventories | 2.1M | -17.0M |
China Falls into Deflation
Market movers today
Another very quiet day on the macro data front, no key releases or central bank speeches are scheduled for today.
The 60 second overview
China: The Chinese economy fell into deflation in July, where CPI dropped 0.3% y/y. Consensus expected this outcome, but it is still a striking development. It is rare that consumer prices decline in China. It happened global crises in 2020 and 2009. It also comes at a time when many other large countries are still battling high inflation. Finally, the price decline in China happened despite the 6% drop in the effective exchange rate the past year.
Japan: M3 money supply growth slowed in Japan to 1.9% in July and fell below the pre-pandemic growth rate. It may suggest that inflationary pressures from monetary policy are not that strong in Japan, but there is likely still an excess supply of money from the big increase in 2020-2021 making its way through the economy, which creates demand and puts upwards pressure on price increases.
Equities: Global equities fell yesterday across regions, though with Japan as the exemption. Lots of action taking place in Europe where banks sold off, driven by Italian banks as the government decided to go on with windfall tax for the sector. A rather special day in global health care with big news from two of the world's leading pharma companies, Eli and Novo. Eli lifting their guidance while test data for Novo (Wegovy) study showed superior results. With the two heavy-weight companies rising 15% and 17% respectively, it was enough to secure a strong outperformance for the health care sector globally.
In US -0.5%, S&P 500 -0.4%, Nasdaq -0.8% and Russell 2000 -0.6%. Asian markets are very mixed this morning. European futures indicating a rebound today while US futures are flat.
FI: A strong rally in global yields led by the long end dominated yesterday. 30y German bonds declined 14bp on the day, while the 2y declined just 5bp. Risks to the Chinese property market and a new bank tax in Italy are among the drivers. ECB's consumer expectations survey pointed to lower inflation expectations in June, which may also have supported the EGBs.
FX: Muted reactions in FX space on the back of China's deflation numbers this morning. The USD has retained its gains vs EUR and JPY with EUR/USD around 1.0960 and USD/JPY still above 143. The Scandies were hit by risk off yesterday. EUR/SEK, popped some ten figures higher, now at 11.73. The NOK has erased some of the losses, EUR/NOK now at 11.25.
Credit: Yesterday credit markets followed equities into risk-off mode. Itraxx Main widened 2.1bp to close at 73.3bp, while Itraxx Crossover widened 9.9bp to close at 409.1bp. Primary market activity continued to be very limited.
OIL ($CL_F) Impulse Sequence Supports More Upside
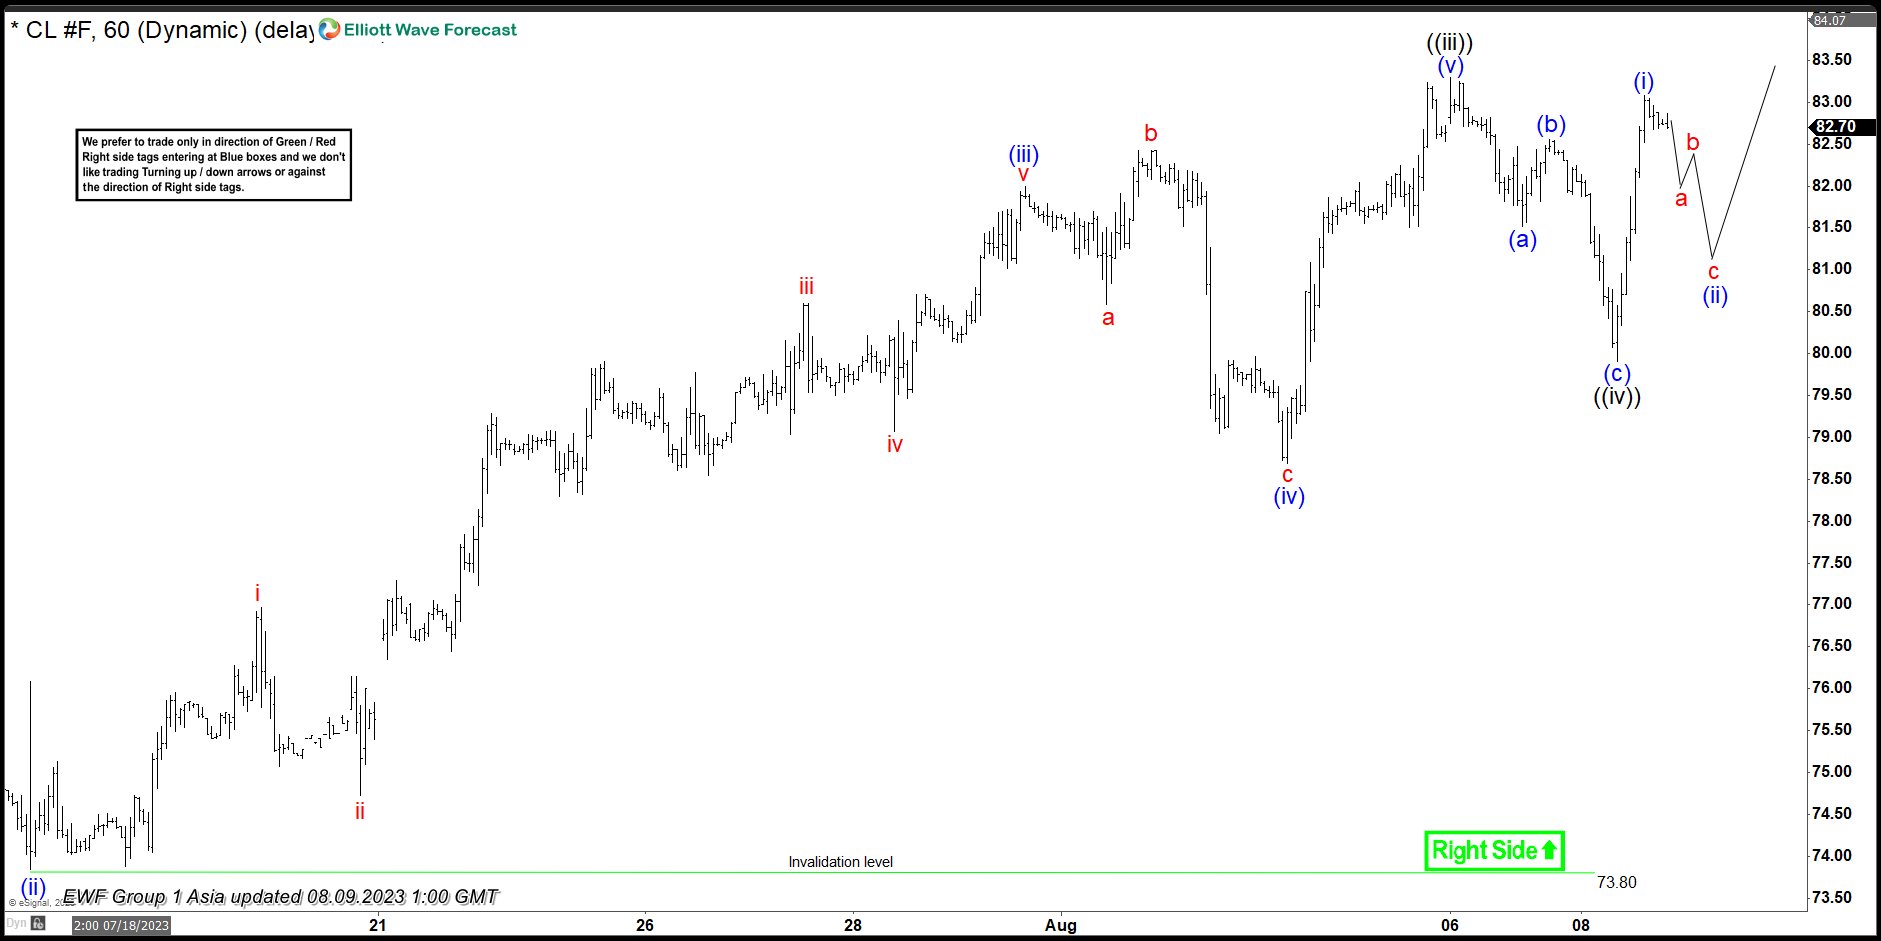
The short-term Elliott wave view in the OIL futures ($CL_F) suggests that the cycle from the 12 June 2023 low is unfolding in an impulse sequence that supports more upside in the instrument. Up from that low, the wave ((i)) ended at $72.72 high in a lesser degree 5 waves. While wave ((ii)) ended at 67.05 low and wave ((iii)) also unfolded in a lesser degree 5 waves sequence. In which, wave (i) of ((iii)) ended at $77.33 high.
Down from there, the pullback to the $73.84 low ended wave (ii) & the instrument rallied higher again. The rally to the $82 high ended wave (iii) & a pullback in wave (iv) ended at $78.69 low. Then a push higher towards $83.30 high ended wave (v) and thus completed the wave ((iii)). From there, OIL did a 3 wave pullback within wave ((iv)) as a zigzag structure where wave (a) ended at $81.52. Wave (b) ended at $82.55 and wave (c) ended at $79.90 low. Near-term, as far as dips remain above the $79.90 low the OIL is expected to resume the upside in wave ((v)) towards $84.09- $85.39 area, which is the inverse 123.6-161.8% target area of wave ((iv)) minimum before a pullback happens.
OIL 1 Hour Elliott Wave Chart From 8.09.2023
OIL Elliott Wave Video
https://www.youtube.com/watch?v=TXIR5mb3EzM
Gold Price Dips And Could Revisit $1,900
Key Highlights
- Gold price is moving lower below the $1,950 pivot zone.
- A major bearish trend line is forming with resistance near $1,935 on the 4-hour chart.
- Crude oil prices are rising steadily above the $80 resistance.
- EUR/USD is consolidating above the 1.0920 support zone.
Gold Price Technical Analysis
Gold price struggled to clear $1,980 and started a fresh decline against the US Dollar. The price traded below the $1,950 support to move into a bearish zone.
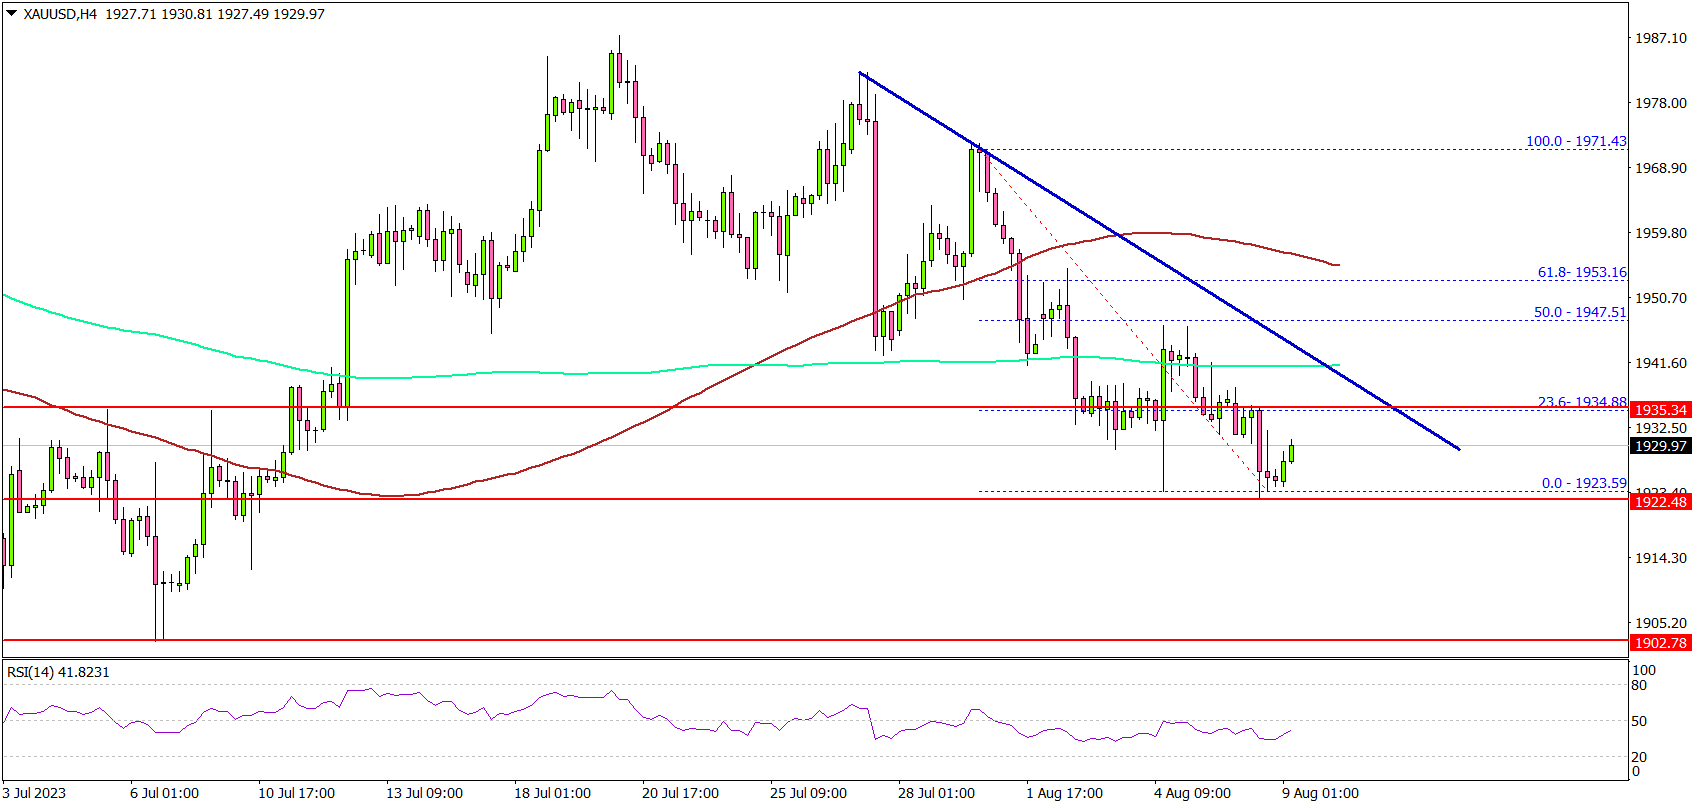
The 4-hour chart of XAU/USD indicates that the price settled below $1,940, the 100 Simple Moving Average (red, 4 hours), and the 200 Simple Moving Average (green, 4 hours).
A low is formed near $1,923 and the price is now consolidating losses. Immediate resistance is near the $1,935 zone. There is also a major bearish trend line forming with resistance near $1,935 on the same chart.
The trend line is near the 23.6% Fib retracement level of the downward move from the $1,971 swing high to the $1,923 low.
The next major resistance is near the $1,950 level or the 50% Fib retracement level of the downward move from the $1,971 swing high to the $1,923 low, above which the price could rise toward $1,970.
Any more gains might send the price toward the $1,978 resistance level or even $1,985. Conversely, the price might decline further. Initial support is near the $1,925 level. The next major support is near $1,915.
If the bulls fail to protect the $1,915 support, there is a risk of a major decline. In the stated case, the price could decline toward the $1,900 level.
Looking at crude oil prices, there was a steady increase and it seems like the bulls might aim for a move toward the $85 level.
Economic Releases to Watch Today
- EIA Crude Oil Stocks Change – Forecast -0.233M, versus -17.049M previous.