

Sample Category Title
RBNZ business survey points to lower inflation expectations, steady interest rates
As seen from the latest Quarterly RBNZ Survey of Expectations, businesses have slightly tapered their inflation expectations in the near term but wage inflation expectations were on the rise. RBNZ OCR is expected to be unchanged at the current 5.50% through the quarter.
Expectations for annual inflation one year ahead have moderated, moving from 4.28% to 4.17%. However, a two-year horizon sees a marginal uptick in these expectations, which have climbed from 2.79% to 2.83%.
More long-term views, reflected in the five and ten-year ahead inflation expectations, both indicate a pullback, dropping to 2.25% (from 2.35%) and 2.22% (from 2.28%), respectively.
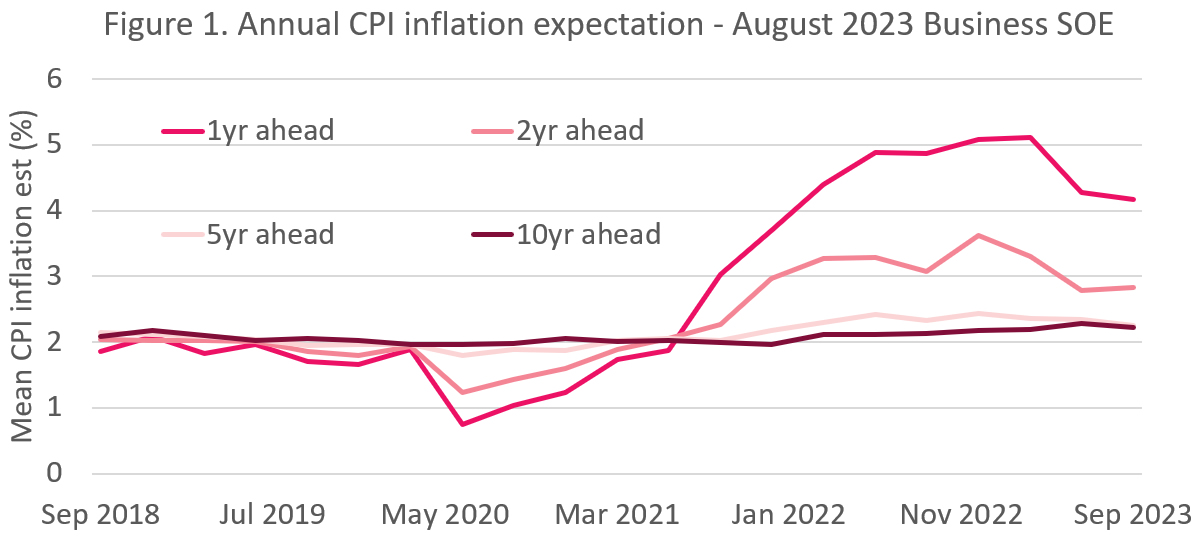
A notable area of concern stems from the annual wage inflation expectations. Over the course of both one and two years, these expectations are on the rise. For the year ahead, expectations climbed from 4.80% to 5.04%, and for the two-year mark, they increased from 3.53% to 3.66%.
Regarding monetary policy, the survey results indicate a stable outlook on the OCR. By the close of the September 2023 quarter, businesses anticipate OCR to average around 5.53%, a minimal climb from the prior quarter's estimate of 5.47%. A one-year ahead mean estimate rose 32 basis points to 5.16% from the previous 4.84%.
Average one-year ahead GDP growth forecast surged to 1.02%, up from previous 0.48%. Moreover, businesses seem to be projecting continued momentum, with two-year ahead GDP growth expectations reaching 1.95% from preceding 1.66%.
China CPI down -0.3% yoy, first negative since 2021
China's CPI for July registered a drop of -0.3% yoy, marking its first decline since February 2021. Although this result is slightly better than the market's expectation of a -0.4% drop, it underscores the economic headwinds faced.
Core inflation measure, which excludes the often erratic food and energy costs, showed a rise to 0.8% yoy from a mere 0.4% yoy. This points to some underlying demand within the economy, albeit muted.
A deeper dive into CPI reveals that food prices have seen a -1% fall yoy, a sharp contrast to the 2.3% yoy rise observed in the previous month. On the other hand, non-food prices climbed 0.5% yoy last month, bouncing back from a -0.6% yoy.
Dong Lijuan, chief statistician at the NBS, commented, "With the impact of a high base from last year gradually fading, the CPI is likely to rebound gradually."
On the PPI front, situation remains challenging. PPI improved from -5.4% yoy to -4.4% yoy in July. This figure not only missed market expectations, which stood at -3.8% yoy, but also marked the tenth straight month of negative readings.
EURGBP Wave Analysis
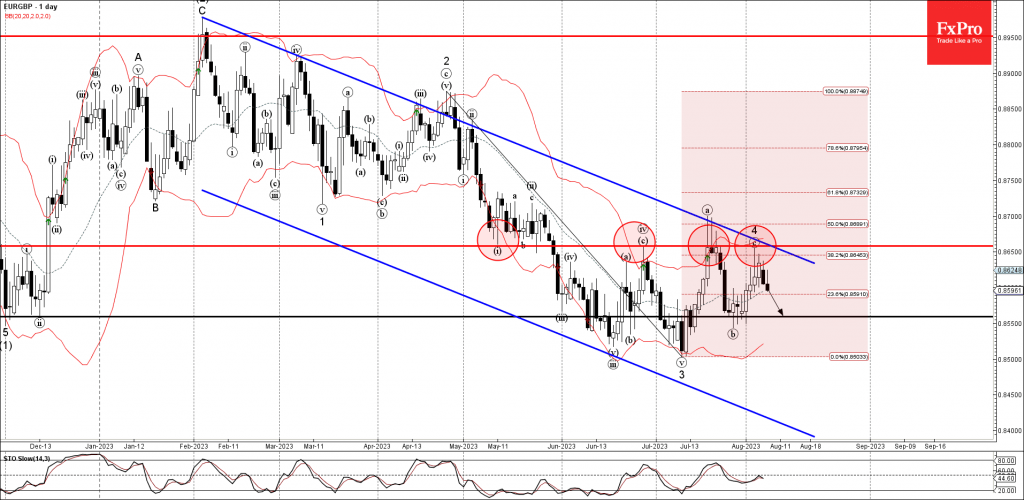
- EURGBP reversed from resistance level 0.8660
- Likely to fall to support level 0.8560
EURGBP currency pair recently reversed down from the pivotal resistance level 0.8660, former support from May, which has been reversing the pair from June.
The resistance level 0.8660, was strengthened by the upper daily Bollinger Band, daily down channel from February and and by the 38.2% Fibonacci correction of the downward impulse from April.
Given the clear daily downtrend, EURGBP can be expected to fall further toward the next support level – 0.8560.
Brent Crude – China Data Weighs on Oil Prices
- Chinese trade data disappoints again
- Saudi and Russian cuts continue to support prices
- Divergence a potential red flag
The data from China appears to be weighing on oil prices today, which is understandable with it being the world’s second-largest economy.
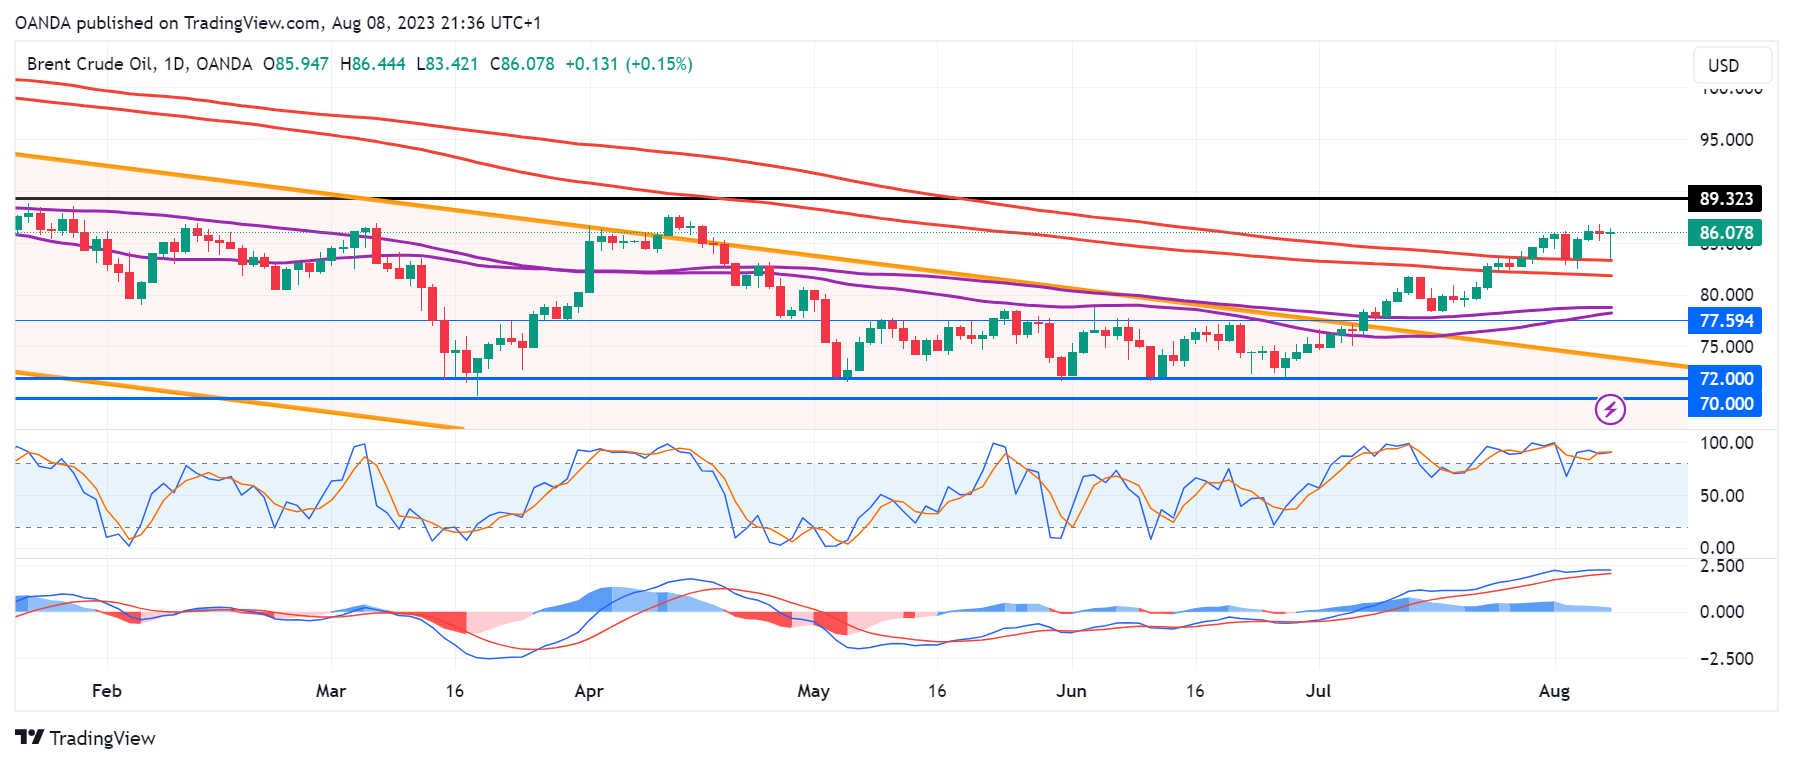
Still, oil remains not far from yesterday’s highs, having recovered more than 20% since late June.
Clearly, the cuts from Saudi Arabia and Russia are working, on top of all of those implemented by OPEC+ since late last year.
The market now looks much tighter and the economic outlook is potentially a little brighter too, with central banks either at or very close to the end of their tightening cycles.
Is the oil rally running on fumes?
We saw plenty of support between March and June around $70-$72 but the price has since rallied strongly, breaking through the descending channel and, more recently, the 200/233-day simple moving average band.
Source – OANDA on Trading View
That’s taken it back into bullish territory, in theory, and today it’s testing that as support from above, as it did last week. A break below would be a bearish signal in the near term, while a hold above could once more reinforce the bullish nature of last month’s breakout.
One thing that is notable is that the momentum indicators have been weakening since mid-July which may suggest the rally has been running on fumes. This kind of divergence isn’t a bearish signal in itself but it could be viewed as a red flag.
FTSE 100 – Investors Troubled by Chinese Trade Data as Oil Prices Pull Back
- Chinese imports fall by 12.4%, exports decline 14.5%
- Pullback coincides with quiet summer trading
- Key support in UK100 may be seen around rising trendline from pandemic lows
It’s been a rough start to the week for stock markets, with trade data from China not helping to lift the mood at a time when we’ve already been seeing a little more risk aversion.
August is typically viewed as a quieter month for financial markets and it would appear this year is no different. Investors more broadly remain very buoyant but that clearly hasn’t been reflected in this month’s performance so far.
The trade data from China was undoubtedly disappointing as it once again showed sluggish demand both domestically and externally, which is consistent with what we’ve seen elsewhere. But while we’ve seen plenty of evidence of this in recent months, imports and exports were well short of expectations.
The economy is quite clearly in need of a boost and I’m just not convinced it’s going to come, not in the forceful and widespread manner it has in the past. Authorities are more likely to engage in smaller, targeted measures that won’t provide the confidence boost investors, or households can really get behind. The sluggish recovery looks set to continue.
FTSE pulls back further amid economic concerns
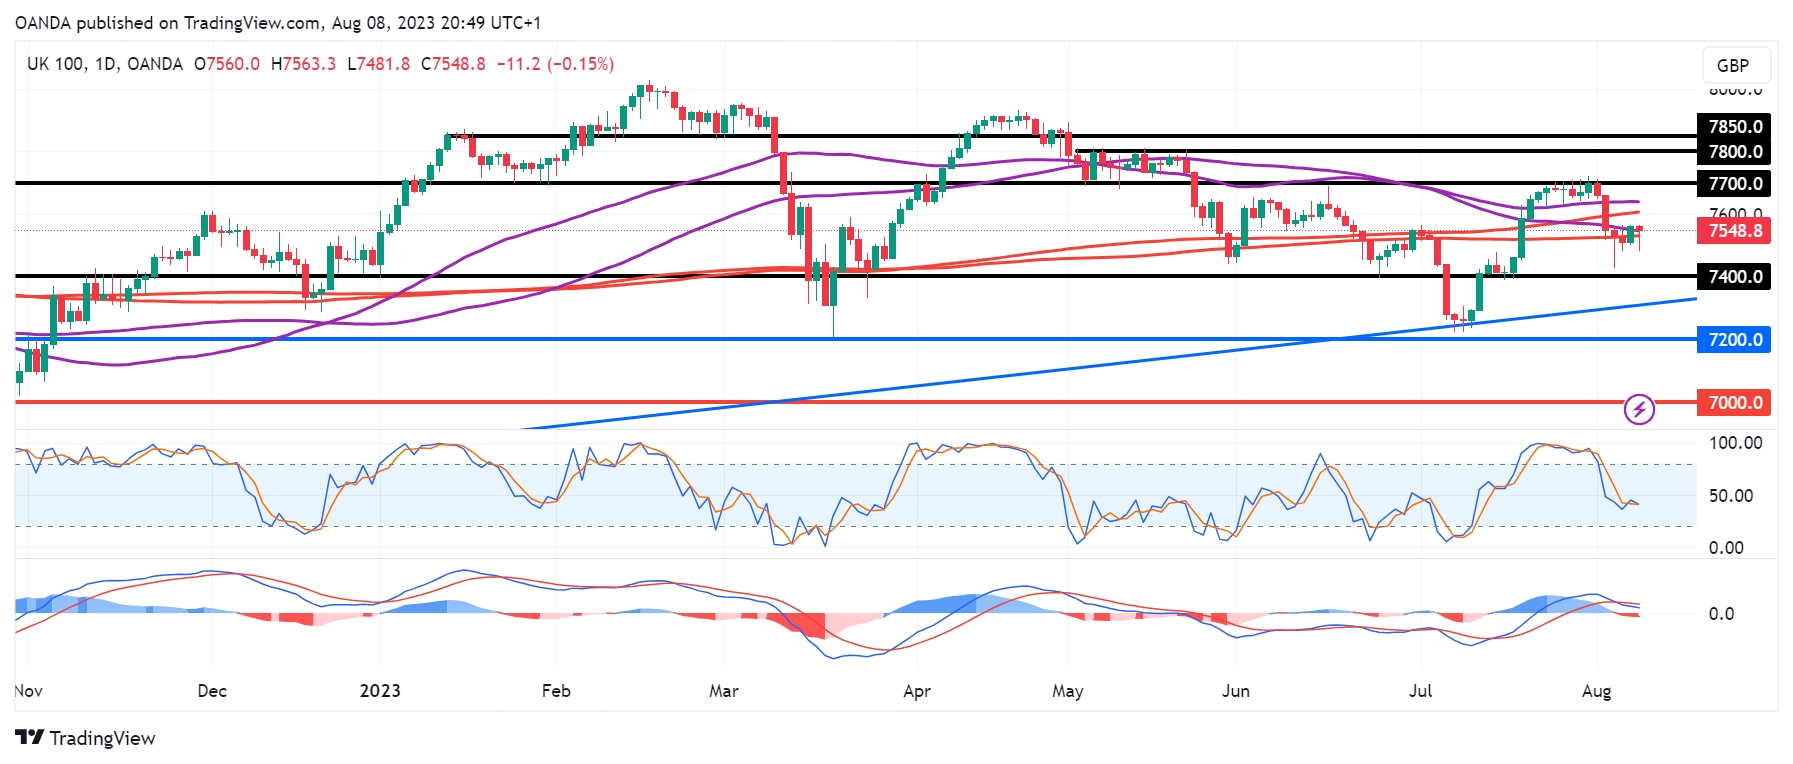
The index has recovered a large portion of the losses from earlier in the day but remains in the red.
Source – OANDA on Trading View
Overall, trading over the last few sessions has been quite choppy, a consolidation after the sell-off a week ago. It ran into some support around 7,400, a level that has been notable as support and resistance over the last couple of years.
The key level is arguably just a little further below though, just above 7,300 around the rising trend line from the pandemic lows. We saw it rebound off here a month ago and a break below here could suggest we’re witnessing more than just a corrective move.
Nasdaq 100 Tests Important Support
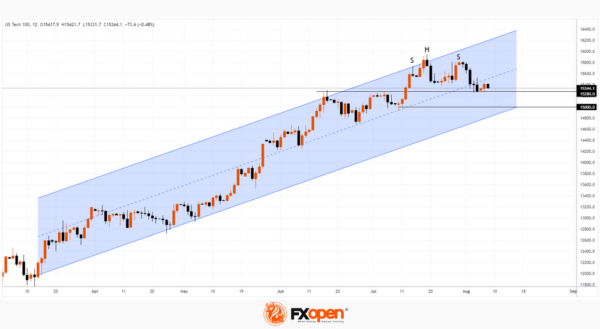
FactSet agency notes a disturbing feature of the current reporting season in the US stock market: if a company publishes a report that exceeds forecasts, its share price does not react with a price increase, which should be expected. This hasn't happened since August 2011, when the stock market fell over 15% in 2 weeks.
This behavior may suggest that the stock market is overbought (due to the AI boom), and a reason to more closely monitor the nature of the test of the 15,280 support level by the price of the Nasdaq 100. The Nasdaq 100 daily chart gives hints that the bears are seizing the initiative:
→ the price of the index has formed a head-and-shoulders pattern;
→ the price goes down to the lower half of the rising channel;
→ since July 19, the chart shows 2 lower tops and 2 lower lows.
If the bears break through the level of 15,280, the next target could be the psychological level of 15,000, in the area of which the lower border of the ascending channel that operates this summer passes — this block can provide significant support.
This article represents the opinion of the Companies operating under the FXOpen brand only. It is not to be construed as an offer, solicitation, or recommendation with respect to products and services provided by the Companies operating under the FXOpen brand, nor is it to be considered financial advice.
Will US Inflation Convince Investors that More Fed Hikes are Needed?
Even after the US employment report revealed higher-than-expected wage growth for July, investors continued to believe that the Fed has already concluded its own tightening crusade. Will this week’s CPI numbers make them change their mind? Where are the risks tilted to and how could the markets respond?
“We could hike, we could pause”
At their July gathering, Fed officials decided to raise interest rates by 25bps to their highest level in 22 years, with the statement accompanying the decision nearly identical to the prior one, thereby leaving the door open to more action if needed.
Nonetheless, at the press conference following the decision, Fed Chair Powell did not appear hawkish enough to convince market participants that more hikes are in the Committee’s chamber. He said they will make decisions meeting by meeting, closely watching economic data, adding that they could hike again in September if the data suggests so, but also that they could choose to hold steady.
When asked about the possibility of rate reductions, Powell said rate cuts will not happen this year, but he refrained from closing the door to any cuts in 2024, adding that this is a judgement they will have to make when the time comes. This encouraged investors to add to their rate-cut bets for next year as his choice to put such a scenario on the table was interpreted as a softening stance compared to prior appearances where he said any rate cuts are ‘a couple of years out.’
Risks are tilted to the upside
Both the ISM manufacturing and non-manufacturing PMIs for July came in below expectations, but the new orders subindex in the manufacturing survey and the prices charged subindex in the non-manufacturing rose by more than anticipated, suggesting improving demand for goods and perhaps a rebound in inflation.
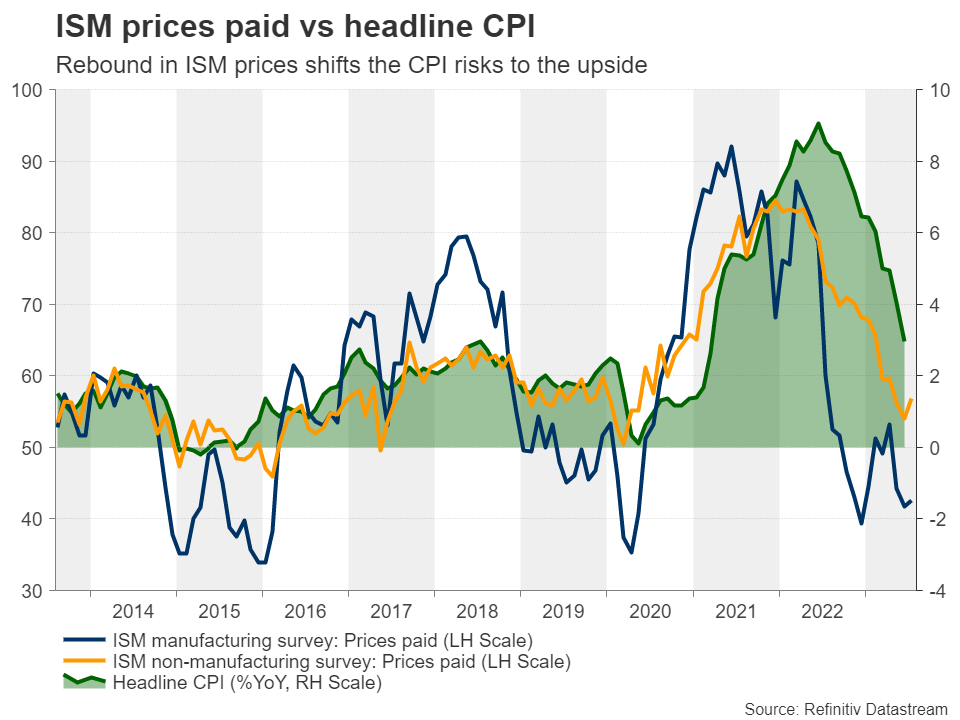
That view is also corroborated by the S&P Global PMIs, with the Chief Business Economist at S&P Global Market Intelligence saying that the stickiness of price pressures remains a major concern and the overall survey sending a worrying signal that a further fall in the inflation rate below 3% may prove elusive in the near term.
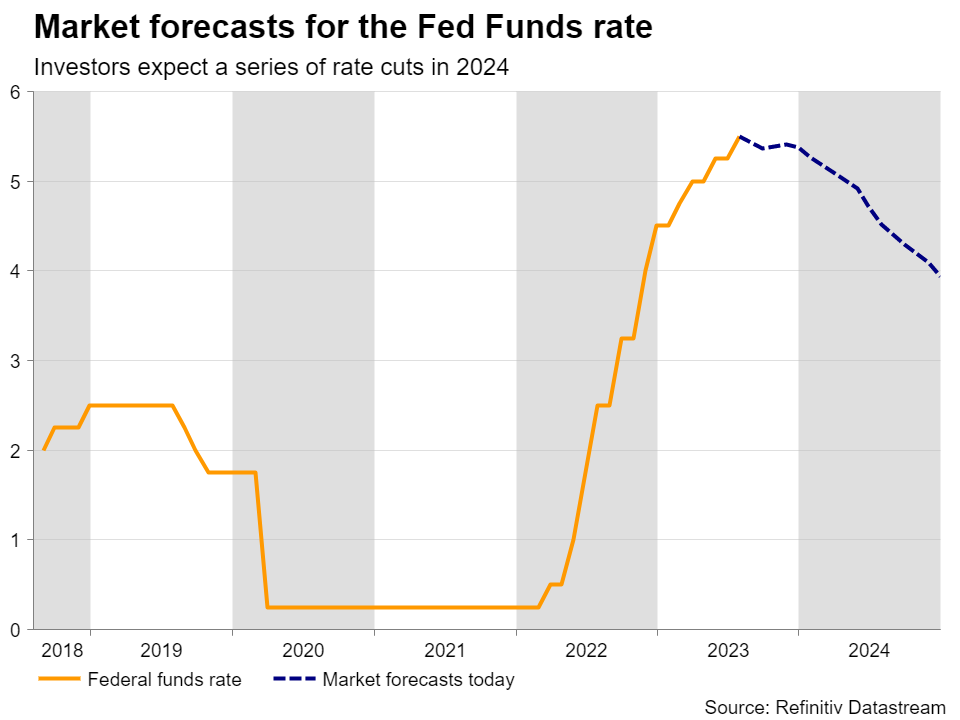
Yet, market participants are largely convinced that the end credits for this tightening crusade have already rolled for the Fed, even after Friday’s jobs report revealed better-than-expected wage growth for the month of July. Investors also believe that nearly 140bps worth of rate cuts may be warranted during next year, despite economic data adding credence to the soft-landing narrative.
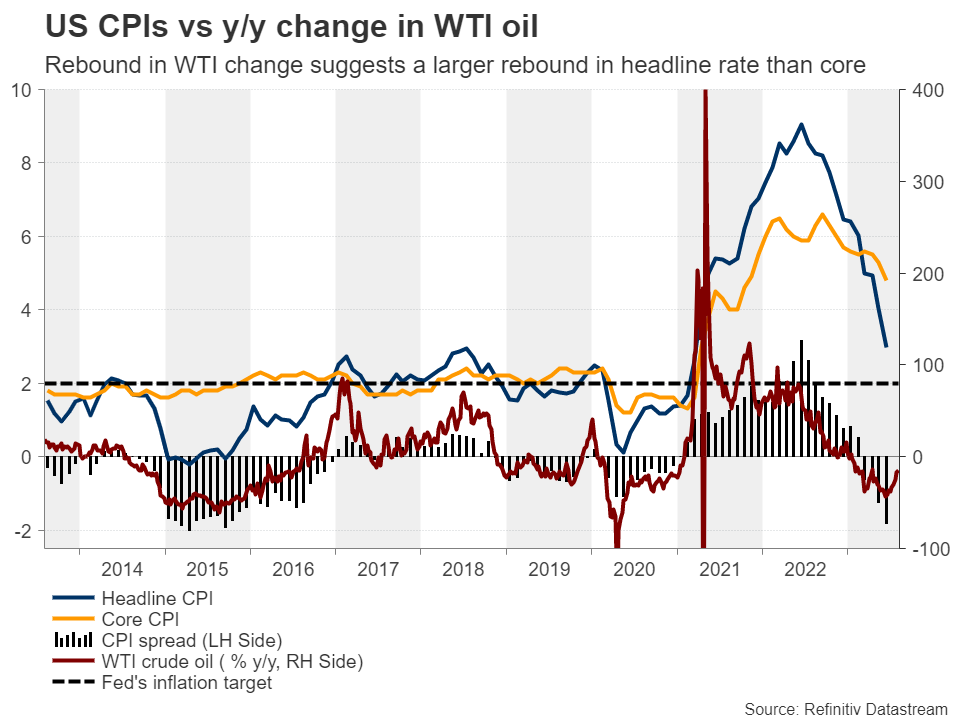
Perhaps traders are waiting for Thursday’s CPI data to confirm whether indeed inflation is now stickier than previously thought. The headline rate is expected to have rebounded to 3.3% year-on-year from 3.0% and the core one is anticipated to have ticked down to 4.7% from 4.8%. That said, the aforementioned business surveys and the wage growth data are implying that the risks may be tilted to the upside, while the rebound in the y/y rate of WTI prices is suggesting that if the core CPI rate moves somewhat higher, the headline rate may increase by even more.
Accelerating inflation could boost dollar and yields, hurt stocks
An upside surprise in the all-important CPIs may prompt market participants to reconsider the possibility of a hike in September and also scale back their rate cut bets, which could help Treasury yields and the US dollar drift further north. A higher implied rate path could also weigh on Wall Street, given that the latest rally was fuelled by a tech euphoria and high-growth tech firms are usually valued by discounting estimated free cash flows for the quarters and years ahead.
Dollar/yen uptrend stays intact
From a technical standpoint, dollar/yen continues to trade above the uptrend line drawn from the low of March 24, as well as above both the 50- and 200-day exponential moving averages, technical indications that keep the prevailing uptrend intact.
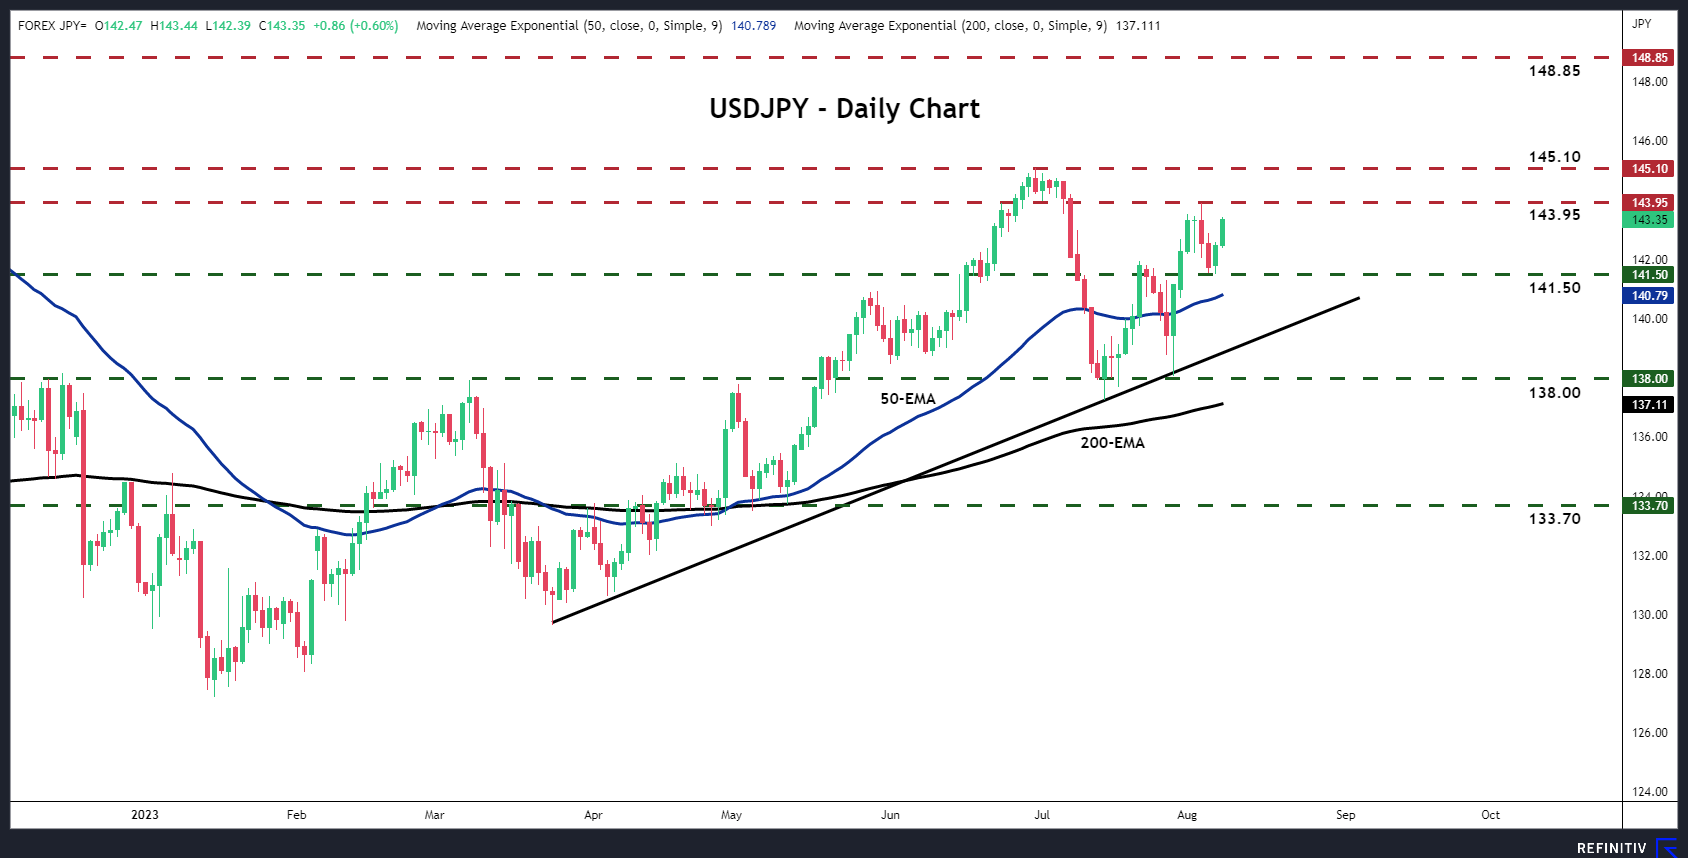
Although the pair pulled back last week, it found support and rebounded from 141.50 on Monday, and accelerating inflation on Thursday could help it breach last Thursday’s high of 143.95. That said, the move that would clearly signal a trend continuation may be a decisive break above the 145.10 zone, which marks the high of June 30. Such a break could carry larger bullish implications and perhaps pave the way towards the high of October 31 at 148.85.
For the outlook of dollar/yen to turn bearish, the price may need to fall below the 138.00 zone, a territory which offered strong support between July 13 and 24 and also strong resistance on March 8 and May 2. Such a dip may tempt the bears to dive all the way towards the 133.70 territory.
Key Moment For The US Stock Market
For the third time in a row, Apple reports a dip in sales as it releases its report for Q2 2023. The announcement led to a 7% drop in stock prices as more investors seemed to lose confidence in the stock’s performance. Despite this development, experts believe that Apple’s free cash flow growth can stabilize the stock prices in the long term. Also worthy of note is that the decline in Apple stock prices resulted in a 2.5% decline in the price action on US500 - thus, the basis for our critical look at the correlation here. Let’s visit the charts, please.
US500 - D1 Timeframe
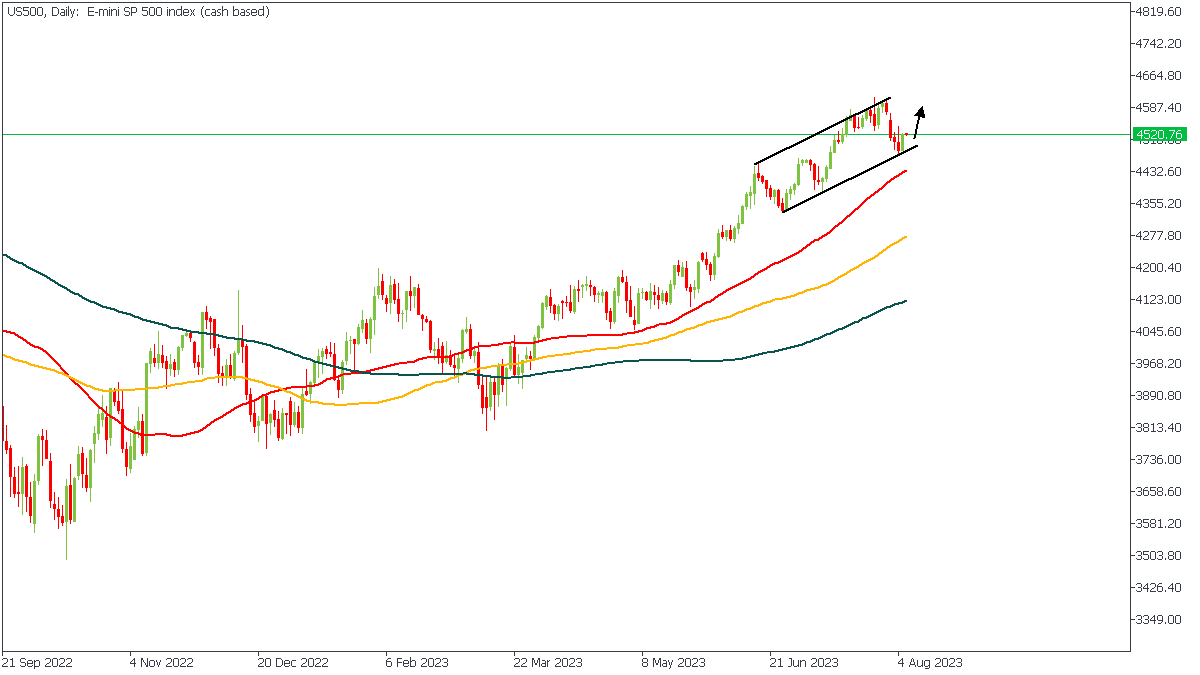
US500 is at the trendline support and has initiated an initial reaction to the trendline. The bounce off the trendline is an ample indication of a bullish intent in the price action. The moving averages’ bullish array is also a considerable confluence supporting my bullish sentiment.
Analyst’s Expectations:
- Direction: Bullish
- Target: 4557.11
- Invalidation: 4478.74
APPLE - D1 Timeframe
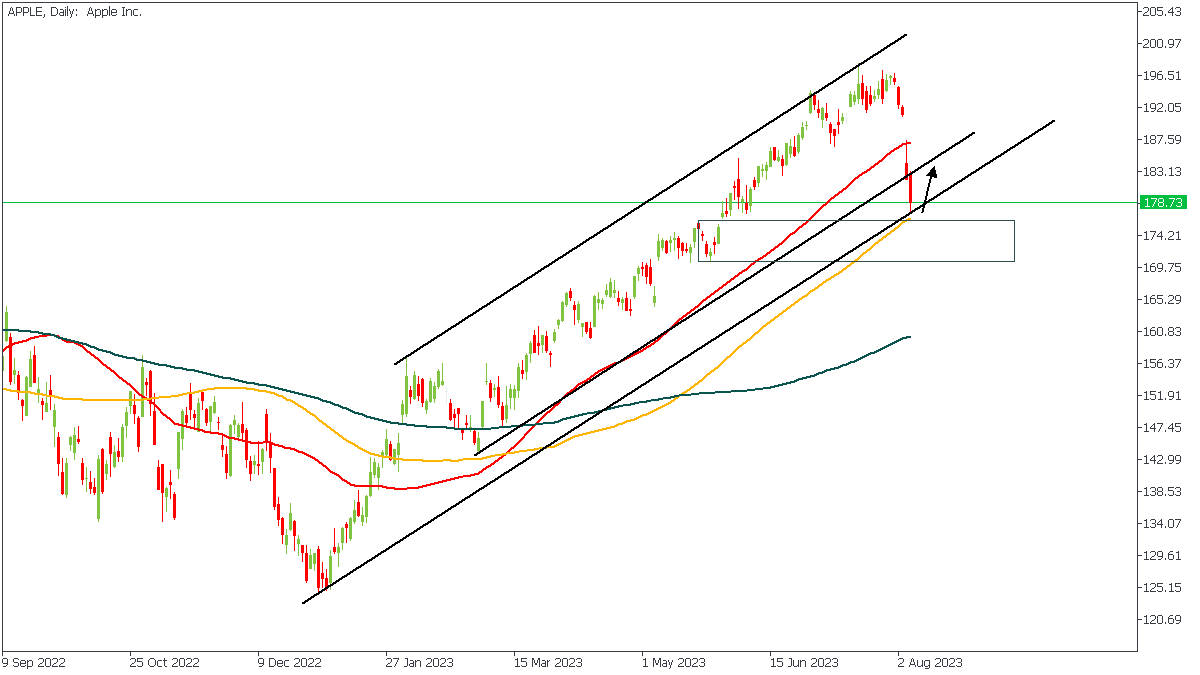
APPLE, as shown on the chart, has significantly dropped in the last few days. That bearish impulse, however, has hit major support in the form of the trendline support, 100-day moving average, and drop-base-rally demand zone, as highlighted in the attached chart. These confluences solidify my expectation of a bullish reaction from the marked zone, however small or big the said reaction appears to be.
Analyst’s Expectations:
- Direction: Bullish
- Target: 184.50
- Invalidation: 174.94
CONCLUSION
The trading of CFDs comes at a risk. Thus, to succeed, you have to manage risks properly. To avoid costly mistakes while you look to trade these opportunities, be sure to do your due diligence and manage your risk appropriately.
Crypto Growth is Too Weak
Market picture
The crypto market is up 0.25% in 24 hours to $1.16 trillion. Bitcoin is up 0.48%, Ethereum is down 0.1%, and altcoins are mixed, ranging from down 1.4% (Dogecoin) to up 0.7% (Solana). The Fear and Greed Index remains in neutral territory at 54.
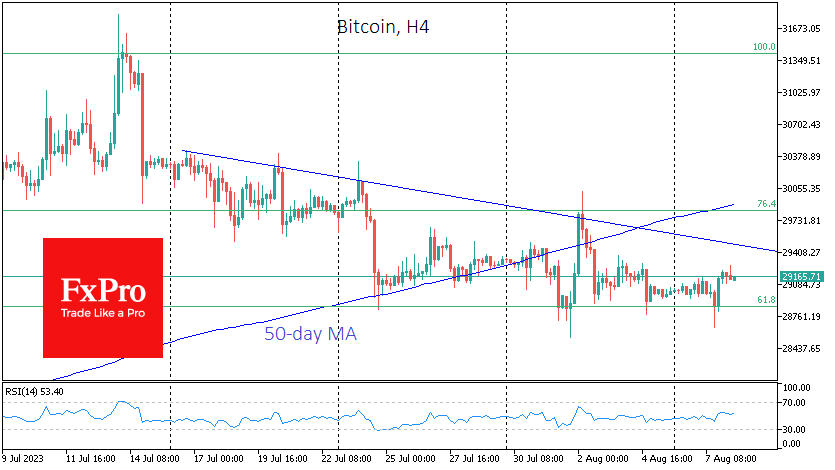
Bitcoin closed slightly higher on the last three daily candles but barely above the $29.2K level. It has yet to confirm a return to growth after a prolonged correction. Bitcoin has been trading within a local downtrend for the past three weeks, with a series of lower highs and lower lows. Late last month, the 50-day moving average turned from support to resistance, reinforcing the medium-term bearish outlook.
According to data from CoinShares, crypto fund investments fell by a record $107 million last week, a record $107 million in the past five months, as outflows continued for a third week. Bitcoin investments fell by $111 million, and Ethereum investments by $6 million. Investments in altcoins are partially offsetting withdrawals from the major cryptocurrencies.
News background
According to Glassnode, the volume of bitcoins held by long-term holders has reached a record high. Holders control 14.599 million BTC or 75% of the cryptocurrency’s total supply.
Michael van de Poppe, the Eight founder, urged accumulating positions. He says, “Big institutions are getting into the game, and the smartest thing to do is to follow them”.
According to Swiss investment firm 21e6 Capital, investors who held bitcoins made 69 per cent more than most cryptocurrency hedge funds in 2023.
The Huobi exchange experienced a major outflow of funds over the weekend amid rumours of the arrest of exchange officials in China. The platform’s stablecoin reserves fell by 30%. A Huobi spokesperson denied the reports.
Bloomberg reports that payment system PayPal is launching its own PayPal USD (PYUSD) stablecoin for money transfers and payments. The issuer is the infrastructure company Paxos.