

Sample Category Title
EUR/USD Daily Outlook
Daily Pivots: (S1) 1.0973; (P) 1.0995; (R1) 1.1026; More...
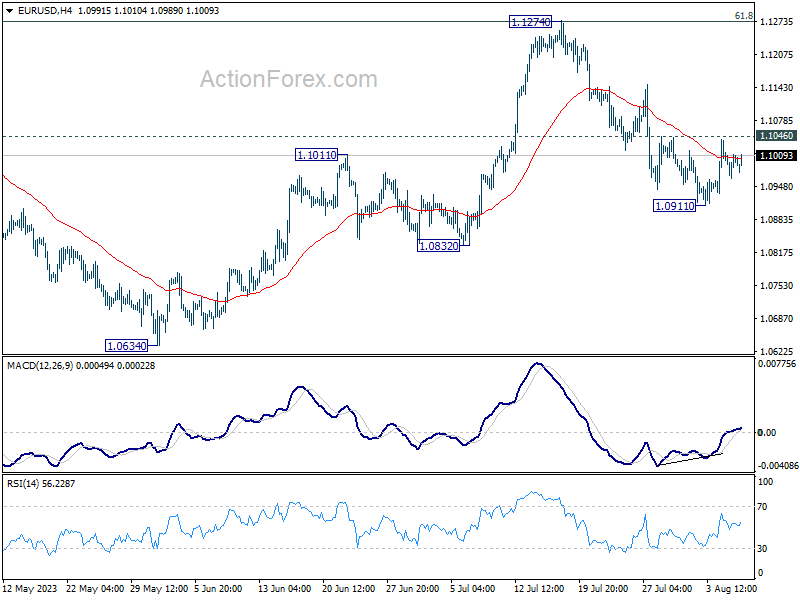
Intraday bias in EUR/USD remains neutral as range trading continues. On the downside, break of 1.0911 will resume the decline from 1.1274 to 1.0832 support. Sustained trading below there will target 1.0609/34 cluster support. However, firm break of 1.1046 minor resistance will argue that pull back from 1.1274 has completed, and bring stronger rebound.
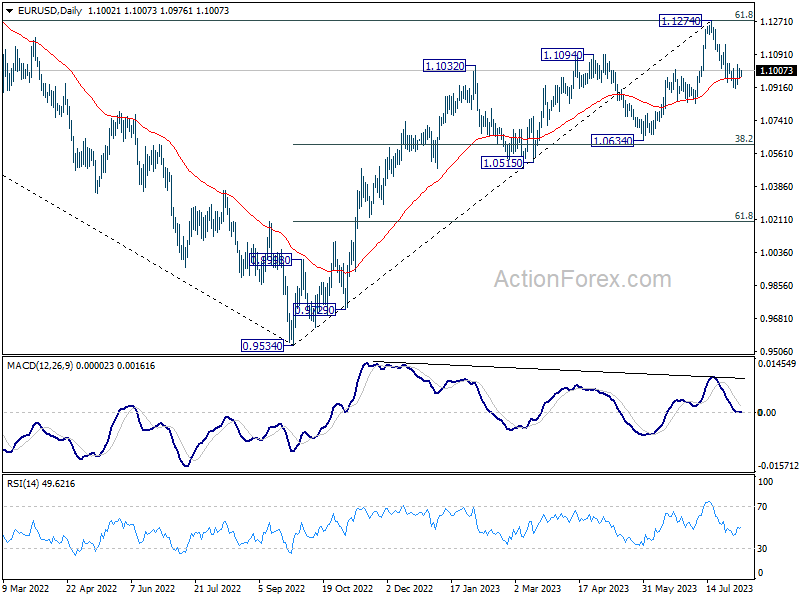
In the bigger picture, a medium term top could be formed at 1.1274, after failing to break through 61.8% retracement of 1.2348 (2021 high) to 0.9534 at 1.1273 decisively, on bearish divergence condition in D MACD. Sustained trading below 55 D EMA (now at 1.0966) will bring deeper correction to 1.0634 cluster support (38.2% retracement of 0.9534 to 1.1274 at 1.0609). Strong support could be seen there, at least on first attempt, to set the range for consolidation.
GBP/USD Daily Outlook
Daily Pivots: (S1) 1.2735; (P) 1.2762; (R1) 1.2811; More...
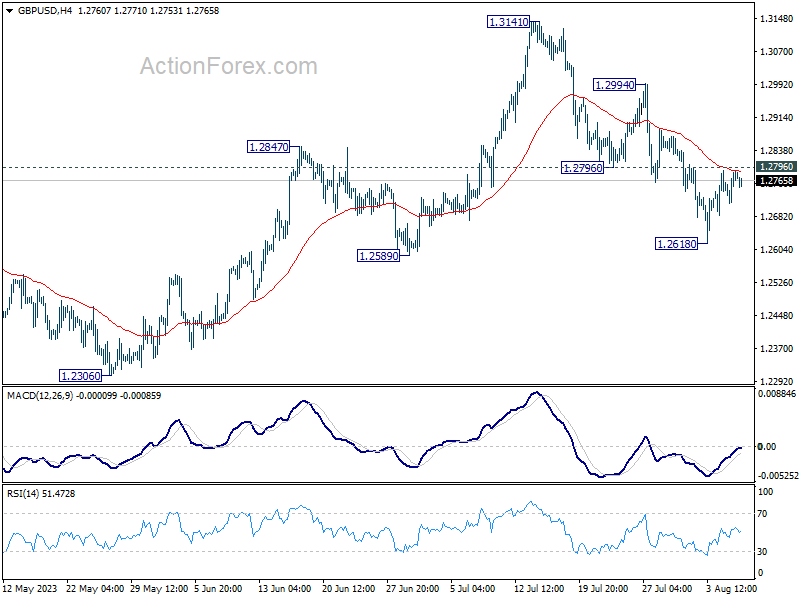
Range trading continues in GBP/USD and intraday bias remains neutral. On the downside, below 1.2618, and sustained trading below 1.2678 resistance turned support will argue that it's already in a larger correction. Deeper decline would then be seen to 1.2306 support next. Nevertheless, firm break of 1.2796 will indicate that the pull back has completed, and turn bias back to the upside for stronger rebound.
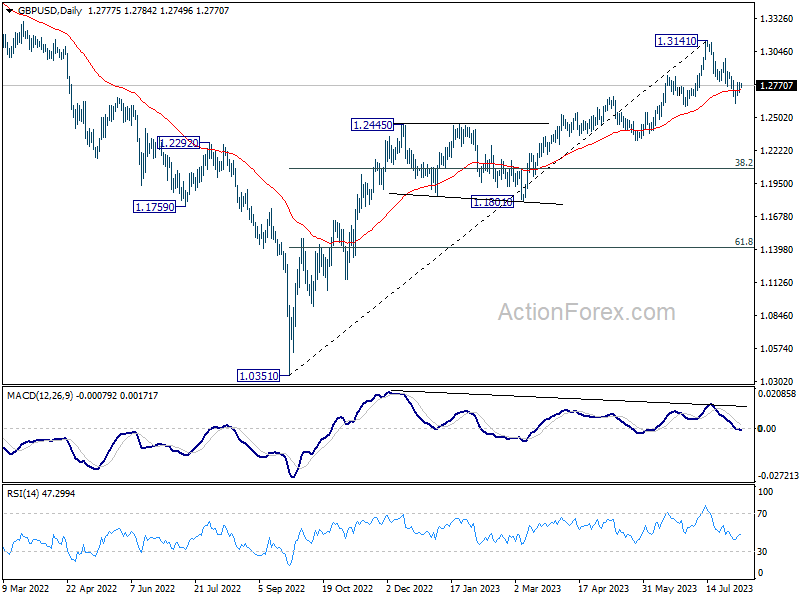
In the bigger picture, a medium term top could be in place at 1.3141 already, on bearish divergence condition in D MACD. Sustained trading below 55 D EMA (now at 1.2726) should confirm this case, and bring deeper fall to 38.2% retracement of 1.0351 to 1.3141 at 1.2075, as a correction to up trend from 1.0351 (2022 low). For now, rise will stay mildly on the downside as long as 1.3141 resistance holds, in case of strong rebound.
USD/CHF Daily Outlook
Daily Pivots: (S1) 0.8705; (P) 0.8740; (R1) 0.8763; More....
Intraday bias in USD/CHF stays neutral as sideway trading continues. On the downside break of 0.8663 minor support should confirm rejection by 0.8818 and turn intraday bias back to the downside for retesting 0.8551 first. Nevertheless, decisive break of 0.8818 will carry larger bullish implication, and target 0.9146 cluster resistance next.
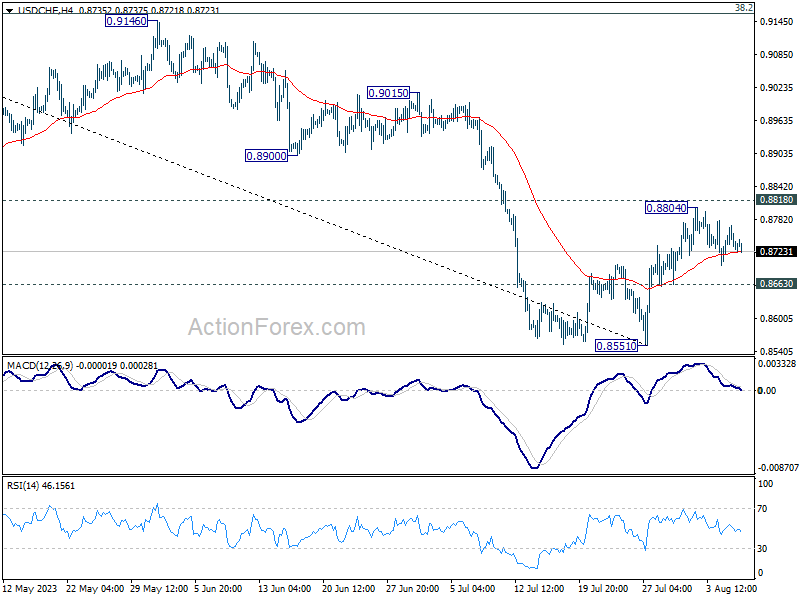
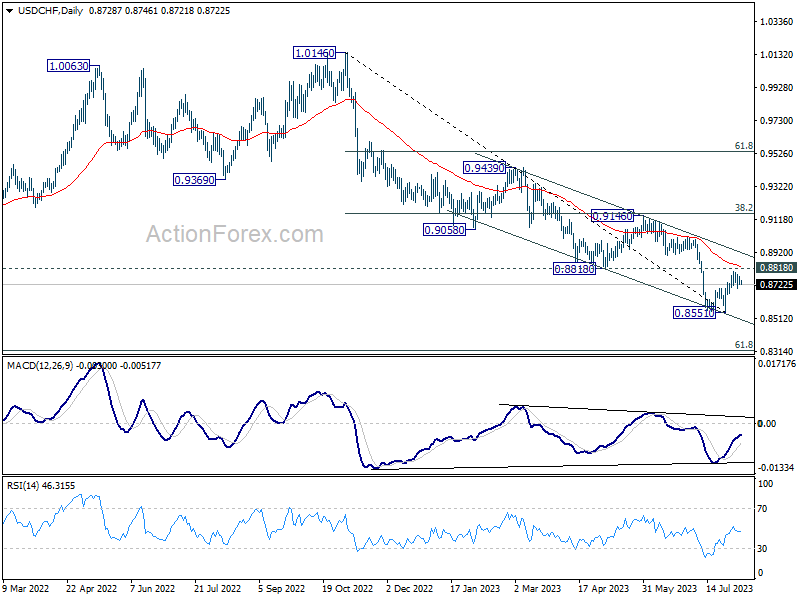
In the bigger picture, down trend from 1.0146 is seen as in progress as long as 0.8188 support turned resistance holds. Next target is 61.8% retracement of 0.7065 (2011 low) to 1.0342 (2016 high) at 0.8317. However, sustained break of 0.8818 should indicate medium term bottoming, and bring stronger rise back to 0.9146 cluster resistance (38.2% retracement of 1.0146 to 0.8551 at 0.9160), even as a correction.
USD/JPY Daily Outlook
Daily Pivots: (S1) 141.81; (P) 142.19; (R1) 142.87; More...
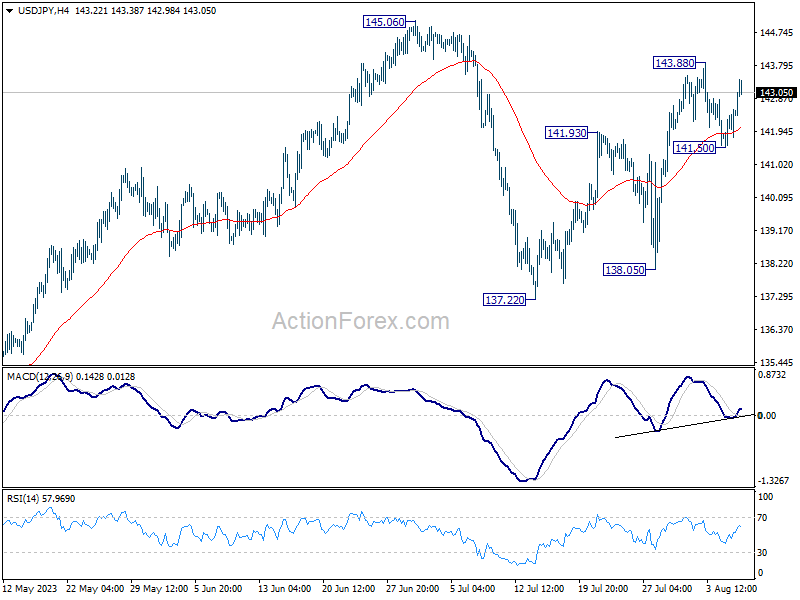
Intraday bias in USD/JPY is turned neutral first with current strong recovery. On the upside, break of 143.88 will resume the rebound from 137.22 to retest 145.06. Decisive break there will resume whole rally from 127.20. On the downside, however, break of 141.50 will turn bias back to the downside for 55 D EMA (now at 140.60).
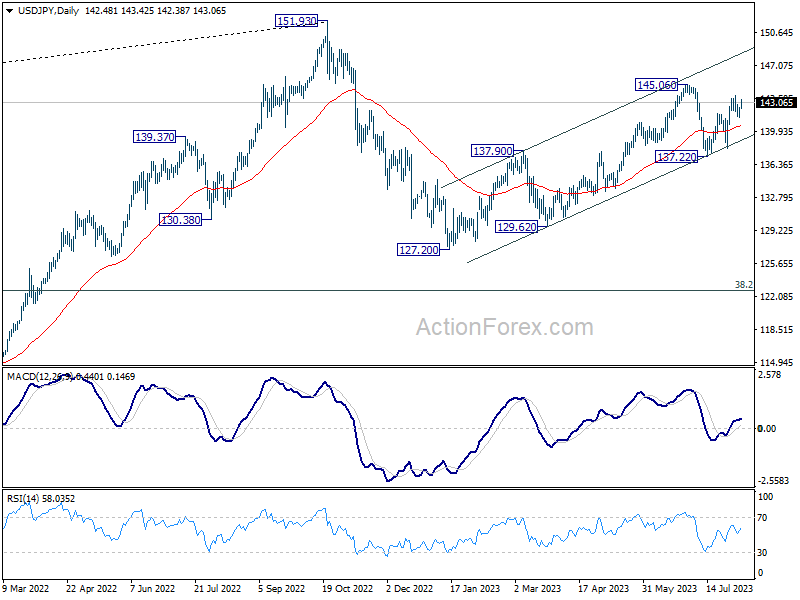
In the bigger picture, overall price actions from 151.93 (2022 high) are views as a corrective pattern. Rise from 127.20 is seen as the second leg of the pattern and could still be in progress. But even in case of extended rise, strong resistance should be seen from 151.93 to limit upside. Meanwhile, break of 137.22 support should confirm the start of the third leg to 127.20 (2023 low) and below.
USD/CAD Daily Outlook
Daily Pivots: (S1) 1.3350; (P) 1.3374; (R1) 1.3393; More....
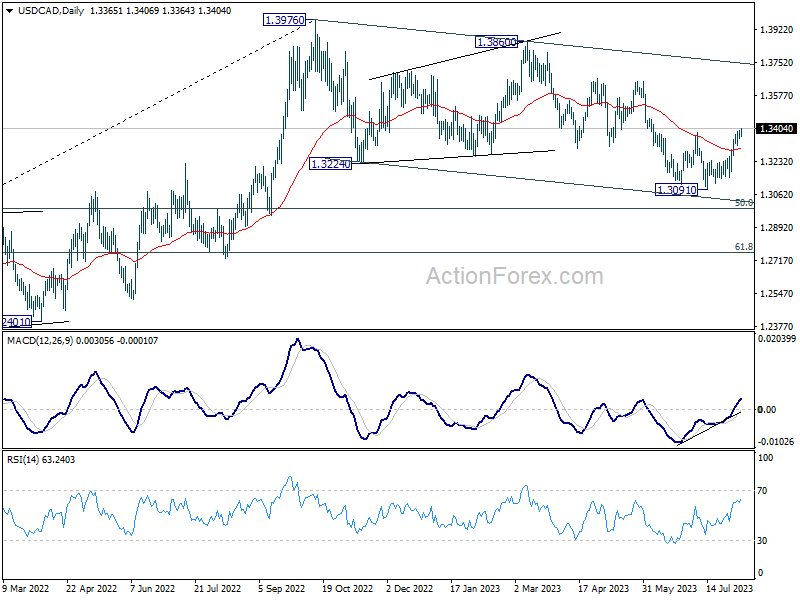
Intraday bias in USD/CAD on the upside with break of 1.3386 resistance. Current development argues that correction from 1.3976 has completed with three waves down to 1.3091. Further rally would then be seen to 1.3653 resistance next. Break there will further confirm this case and target 1.3976 high. On the downside, though, below 1.3318 minor support will mix up the outlook and turn intraday bias neutral again first.
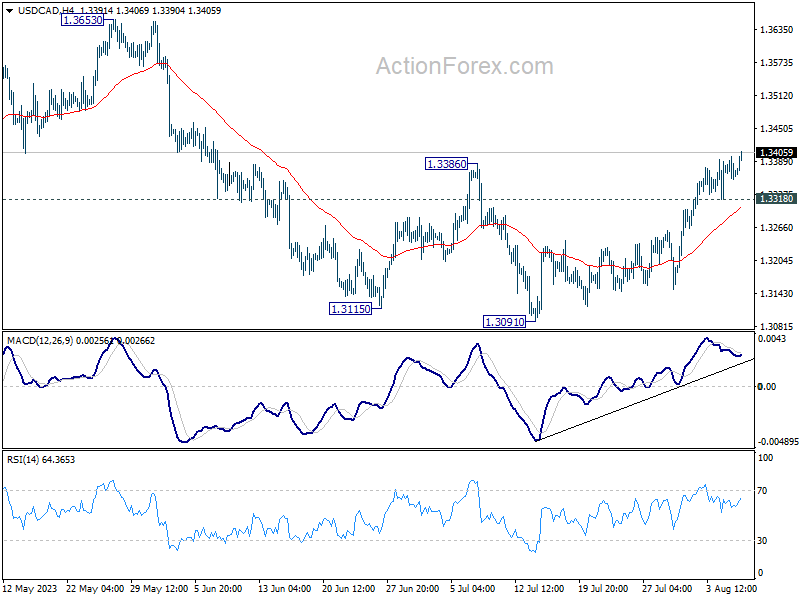
In the bigger picture, price actions from 1.3976 are viewed as a corrective fall only. Upon completion, rise from 1.2005 (2021 low) would resume through 1.3976 towards 1.4667/89 long term resistance zone. In case of another fall, downside should be contained by 61.8% retracement of 1.2005 to 1.3976 at 1.2758.
Dire Chinese Trade Data
Market movers today
Today will be a quiet day in terms of economic data releases. From the US, the NFIB Small Business Optimism index will be released for July along with international trade data for June. From Germany, the revised July inflation figures are due for release.
The Fed's Harker and Barkin are scheduled to give speeches in the afternoon.
Overnight, Chinese July CPI data will be released.
The 60 second overview
Japan: Wages rose 2.3% y/y in July in Japan. It was slower than in June, where wages increased 2.5% y/y, but two straight months of wage growth above 2% could still be a sign that the trend is higher as higher inflation passes through to labour earnings. It is probably not enough to satisfy Bank of Japan and puts monetary tightening on the agenda at the upcoming meeting in September.
China: Foreign trade data for July was dire reading for the global economy as well as the Chinese domestic economy. Exports declined 14.5% y/y - the biggest decline since the pandemic in 2020 - in a sign of slower external demand. Imports plunged 12.4% y/y raising concerns about weaker domestic demand.
FX: USD is higher overnight vs EUR, JPY and CNY amid weaker Chinese trade data and renewed pressure on Asian equities. EUR/USD dropped below the 1.10 mark and USD/JPY jumped above 143. Both SEK and NOK have had some good sessions, when they were supported by positive risk sentiment, but are for the opposite reason slightly on the defensive this morning. EUR/SEK trades around 11.66 and EUR/NOK around 11.19.
Credit: Yesterday, credit markets had a soft day with both CDS indices closing marginally wider with iTraxx Main at 71.2bp (+1.2bp), while iTraxx Crossover closed at 399.2bp (+5.8bp). The primary Eurobond market was still very quiet and according to Bloomberg's recent survey among primary market participants a slow pace of activity should be expected throughout the week.
Equities: Global equities higher yesterday driven by a lift to US stocks. US sector performance also dominating the global direction with communication service outperforming together with financials. Value outperformed growth for the fourth out five last sessions although energy stocks were underperforming. Not really a macro-driven day but more of a stock-selection day with less appetite for unprofitable tech.
In US Dow +1.2%, S&P 500 +0.9%, Nasdaq +0.6% and Russell 2000 +0.1%.
The lift on Wall Street yesterday spilling over to parts of Asia this morning despite yet another set of weak Chinese trade data. Futures on both sides of the Atlantic are in red this morning.
AUD/USD Daily Report
Daily Pivots: (S1) 0.6555; (P) 0.6574; (R1) 0.6593; More...
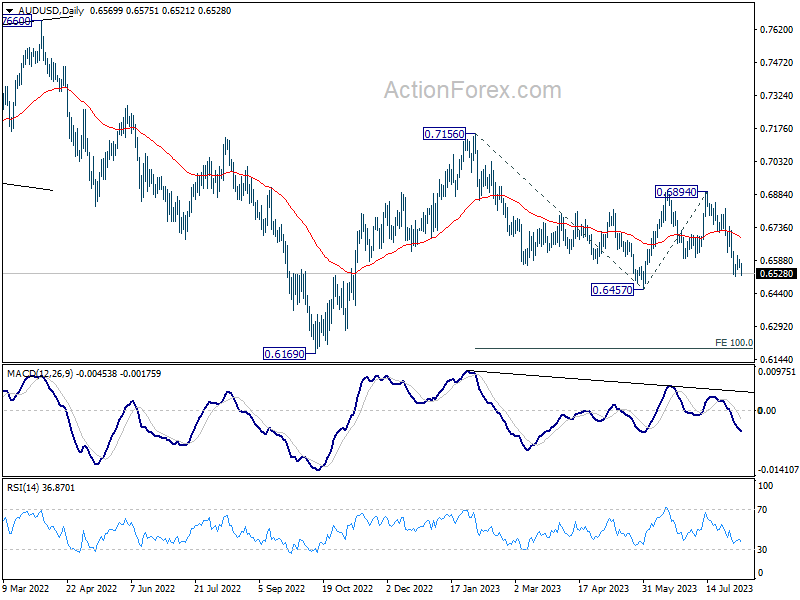
AUD/USD dips notably today but stays above 0.6513 temporary low. Intraday bias stays neutral first, and outlook remains bearish. Current development argues that larger fall from 0.7156 is still in progress. Below 0.6513 will bring retest of 0.6457 support first. Firm break there will confirm this case and target 100% projection of 0.7156 to 0.6457 from 0.6894 at 0.6195. Nevertheless, on the upside, above 0.6628 minor resistance will mix up the outlook and turn bias back to the upside for stronger rebound.
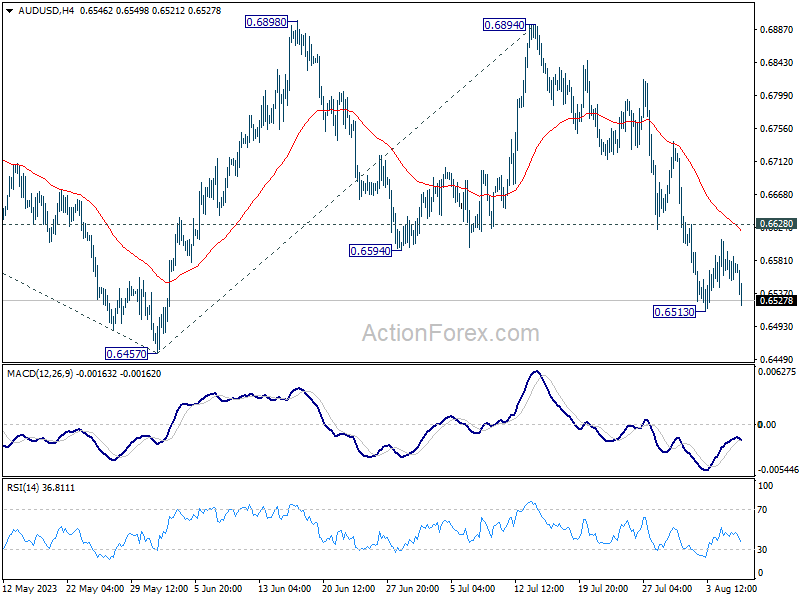
In the bigger picture, outlook is mixed for now as AUD/USD failed to sustain above both 55 D EMA (now at 0.6686) and 55 W EMA (now at 0.6769). On the upside, break of 0.6894 resistance will solidify the case that down trend from 0.8006 (2021 high) has already completed, and target 0.7156 resistance for confirmation. However, break of 0.6457 will likely resume the down trend through 0.6169 (2022 low).
Yen Down on Japan Wage Data; China Trade Figures Sends Aussie Lower
Today's Asian session witnessed a revitalized forex market, triggered largely by pivotal economic data releases. Japan's weaker-than-anticipated wage growth data placed Yen under notable pressure, reinforcing BoJ's commitment to persist with its ultra-loose monetary policy. Simultaneously, unexpectedly poor trade figures from China exerted downward force on Hong Kong stocks, as well as on Australian and New Zealand dollars.
Conversely, Dollar is showing signs of a near-term rally resurgence. An imminent breakout from its recent range seems likely, especially when pitted against Yen and commodity-linked currencies. For the time being, European majors are holding steady, oscillating in their respective ranges both against Dollar and amongst themselves.
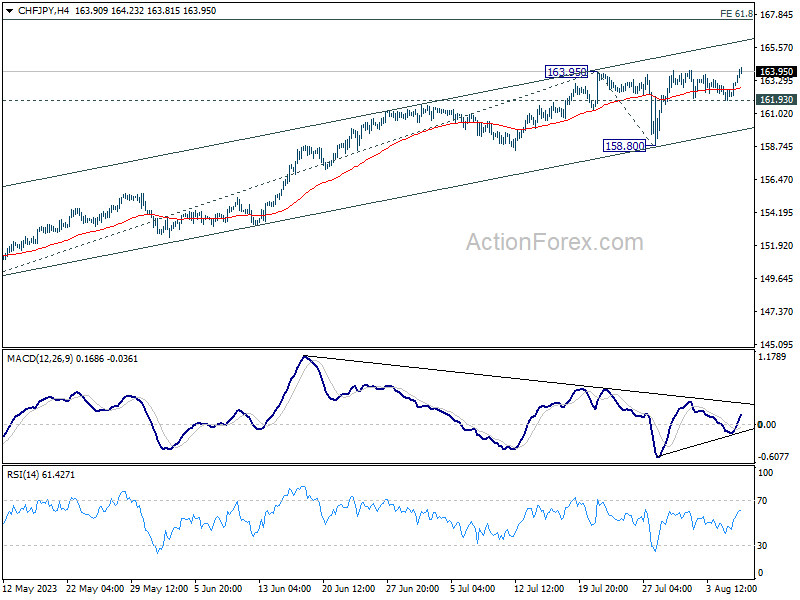
Technically, CHF/JPY looks ready to resume its record run with today's strong rally. For now, outlook will stay bullish as long as 161.93 support holds, even in case of retreat. Next target is 61.8% of 149.77 to 163.95 from 158.80 at 167.56. A point of attention will be on whether 4H MACD could break above its falling trend line to signal a new phase of upside acceleration.
In Asia, at the time of writing, Nikkei is up 0.50%. Hong Kong HSI is down -1.46%. China Shanghai SSE is down-0.16%. Singapore Strait Times is up 0.12%. Japan 10-year JGB yield is down -0.016 to 0.612. Overnight, DOW rose 1.16%. S&P 500 ro se0.90%. NASDAQ rose 0.6%. 10-year yield rose 0.018 to 4.078.
Japan's wages growth and household spending miss expectations, supports ultra-loose BoJ
Today's wage growth data out of Japan came in softer than anticipated, reinforcing BoJ's position towards maintaining its ultra-loose monetary strategy. Furthermore, the consistent decline in real wages continues to weigh down consumer spending.
Nominal cash earnings for workers in June grew by only 2.3% yoy, missing the projected 3.0% yoy rise. This marks a deceleration from previous month's impressive 2.9% yoy – the most robust growth observed in nearly 30 years. Delving deeper, June's base salary advance was logged at 1.4% yoy, , also under May's 1.7% yoy .
Economists have previously estimated that wage increases of 3% or more are crucial to sustain consumer inflation above BoJ's 2% target.
Compounding concerns, real cash earnings continued their downward trajectory, recording a decline of -1.6% yoy, faring worse than the anticipated stasis at -0.9% yoy. This represents the 15th consecutive month of negative readings in this domain.
Furthermore, overall household spending for June saw a contraction of -4.2% yoy, veering further off the expected -3.5% yoy decline. This marks the fourth consecutive month of shrinking household spending.
These lackluster wage figures pose a challenge for the BoJ. As Governor Kazuo Ueda remarked, the trajectory of income trends is pivotal in determining the realistic prospects of accomplishing lasting inflation. Today's data lends credence to the BoJ's recent evaluation that consistently achieving price increments beyond 2% remains a distant goal. Consequently, the need to uphold its ultra-accommodative monetary parameters becomes ever more evident.
Australia's Consumer Sentiment down -0.4%, no lift from RBA pause
Australia's Westpac Consumer Sentiment Index for August indicated a slight decline, registering at 81, a drop of -0.4% mom from July's reading of 81.3. Westpac's analysis suggests that this decrease cements the prevailing pessimistic mood among consumers. Interestingly, RBA's decision to pause rate hikes did not notably influence this sentiment. The prevailing concerns about inflation continue to overshadow, although confidence in the job market did see a marginal improvement.
Regarding RBA's upcoming meeting on September 5, Westpac anticipates the central bank will maintain its current stance, leaving rates untouched at 4.1%. This cash rate is expected to be the zenith of this financial cycle. It is now up to incoming data and unfolding economic scenarios to present a compelling argument for further monetary tightening.
Westpac emphasized that for RBA to be prompted into action, any economic developments would need to be not just surprising, but also substantial, essentially posing a challenge to the bank's medium-term outlook.
Australia NAB business confidence rose to 2, inflationary pressures on the rise
Australia's NAB Business Confidence Index for July revealed an upward tick, moving from -1 in June to 2. However, Business Conditions saw a slight dip from 11 to 10. Delving into specific metrics, readings for trading conditions, profitability, and employment remained unchanged with the previous month, all settling at 16, 10, and 6 respectively.
Notably, the month saw a pronounced rise in price and cost growth. Labour cost growth surged to 3.7% in quarterly equivalent terms, up from June's 2.3%, and purchase cost growth escalated to 2.6%, a jump from the previous month's 2.2%. Furthermore, final price growth climbed to 2%, doubling June's 1%.
Commenting on the findings, NAB Chief Economist, Alan Oster, remarked, "Business conditions in July remained resilient and have largely held steady at above-average levels over the past few months."
He added, "While business confidence rebounded to positive territory, overall confidence remains muted."
Oster further noted the inflationary pressures highlighted by the survey, noting, "Despite the Q2 CPI release indicating an improvement, the survey underscores that the upward pressure on inflation remains significant."
China's exports down -14.5% yoy in Jul, shipments to ASEAN down -21.4% yoy
July saw a sharper-than-expected contraction in China's exports, with decline of -14.5% yoy to USD 281.76B. This marked the steepest drop since February 2020 and exceeded market expectations, which had forecasted a decline of -12.5% yoy. Concurrently, imports also took a hit, plunging by -12.4% yoy to USD 201.16B, much steeper than anticipated -5% yoy drop.
With these declines, China's trade surplus unexpectedly widened. July's figures show surplus expanding from USD 70.6B to USD 80.6B, surpassing the market forecast of USD 67.8B.
A key observation was the sharp decline in shipments to ASEAN – one of China's primary trade partners. Exports to ASEAN dropped by a significant -21.43% yoy in July, marking its second straight monthly decline. This is noteworthy as ASEAN had played a pivotal role in bolstering China's export sector earlier in the year.
In addition, exports to EU and US followed suit with declines of -20.62% yoy and -23.12% yoy, respectively. The dip in shipments to US represents a continued trend, with July marking the twelfth consecutive month of decline.
Looking ahead
Trade balance data from France, US and Canada will be the main focuses in a rather light day.
AUD/USD Daily Report
Daily Pivots: (S1) 0.6555; (P) 0.6574; (R1) 0.6593; More...
AUD/USD dips notably today but stays above 0.6513 temporary low. Intraday bias stays neutral first, and outlook remains bearish. Current development argues that larger fall from 0.7156 is still in progress. Below 0.6513 will bring retest of 0.6457 support first. Firm break there will confirm this case and target 100% projection of 0.7156 to 0.6457 from 0.6894 at 0.6195. Nevertheless, on the upside, above 0.6628 minor resistance will mix up the outlook and turn bias back to the upside for stronger rebound.
In the bigger picture, outlook is mixed for now as AUD/USD failed to sustain above both 55 D EMA (now at 0.6686) and 55 W EMA (now at 0.6769). On the upside, break of 0.6894 resistance will solidify the case that down trend from 0.8006 (2021 high) has already completed, and target 0.7156 resistance for confirmation. However, break of 0.6457 will likely resume the down trend through 0.6169 (2022 low).
Economic Indicators Update
| GMT | Ccy | Events | Actual | Forecast | Previous | Revised |
|---|---|---|---|---|---|---|
| 23:01 | GBP | BRC Like-For-Like Retail Sales Y/Y Jul | 1.80% | 3.00% | 4.20% | |
| 23:30 | JPY | Labor Cash Earnings Y/Y Jun | 2.30% | 3.00% | 2.50% | 2.90% |
| 23:30 | JPY | Overall Household Spending Y/Y Jun | -4.20% | -3.50% | -4.00% | |
| 23:50 | JPY | Bank Lending Y/Y Jul | 2.90% | 3.10% | 3.20% | |
| 23:50 | JPY | Current Account (JPY) Jun | 2.35T | 2.24T | 1.70T | |
| 00:30 | AUD | Westpac Consumer Confidence Aug | -0.40% | 2.70% | ||
| 01:30 | AUD | NAB Business Conditions Jul | 10 | 9 | 11 | |
| 01:30 | AUD | NAB Business Confidence Jul | 2 | 0 | -1 | |
| 03:00 | CNY | Trade Balance (USD) Jul | 80.6B | 67.8B | 70.6B | |
| 03:00 | CNY | Trade Balance (CNY) Jul | 576B | 470B | 491B | |
| 05:00 | JPY | Eco Watchers Survey: Outlook Jul | 54.4 | 54.5 | 53.6 | |
| 06:00 | EUR | Germany CPI M/M Jul F | 0.30% | 0.30% | ||
| 06:00 | EUR | Germany CPI Y/Y Jul F | 6.20% | 6.20% | ||
| 06:45 | EUR | France Trade Balance (EUR) Jun | -8.0B | -8.4B | ||
| 10:00 | USD | NFIB Business Optimism Index Jul | 90.6 | 91 | ||
| 12:30 | USD | Trade Balance (USD) Jun | -65.2B | -69.0B | ||
| 12:30 | CAD | Trade Balance (CAD) Jun | -1.7B | -3.4B | ||
| 14:00 | USD | Wholesale Inventories Jun F | -0.30% | -0.30% |
Technical Outlook and Review
DXY:
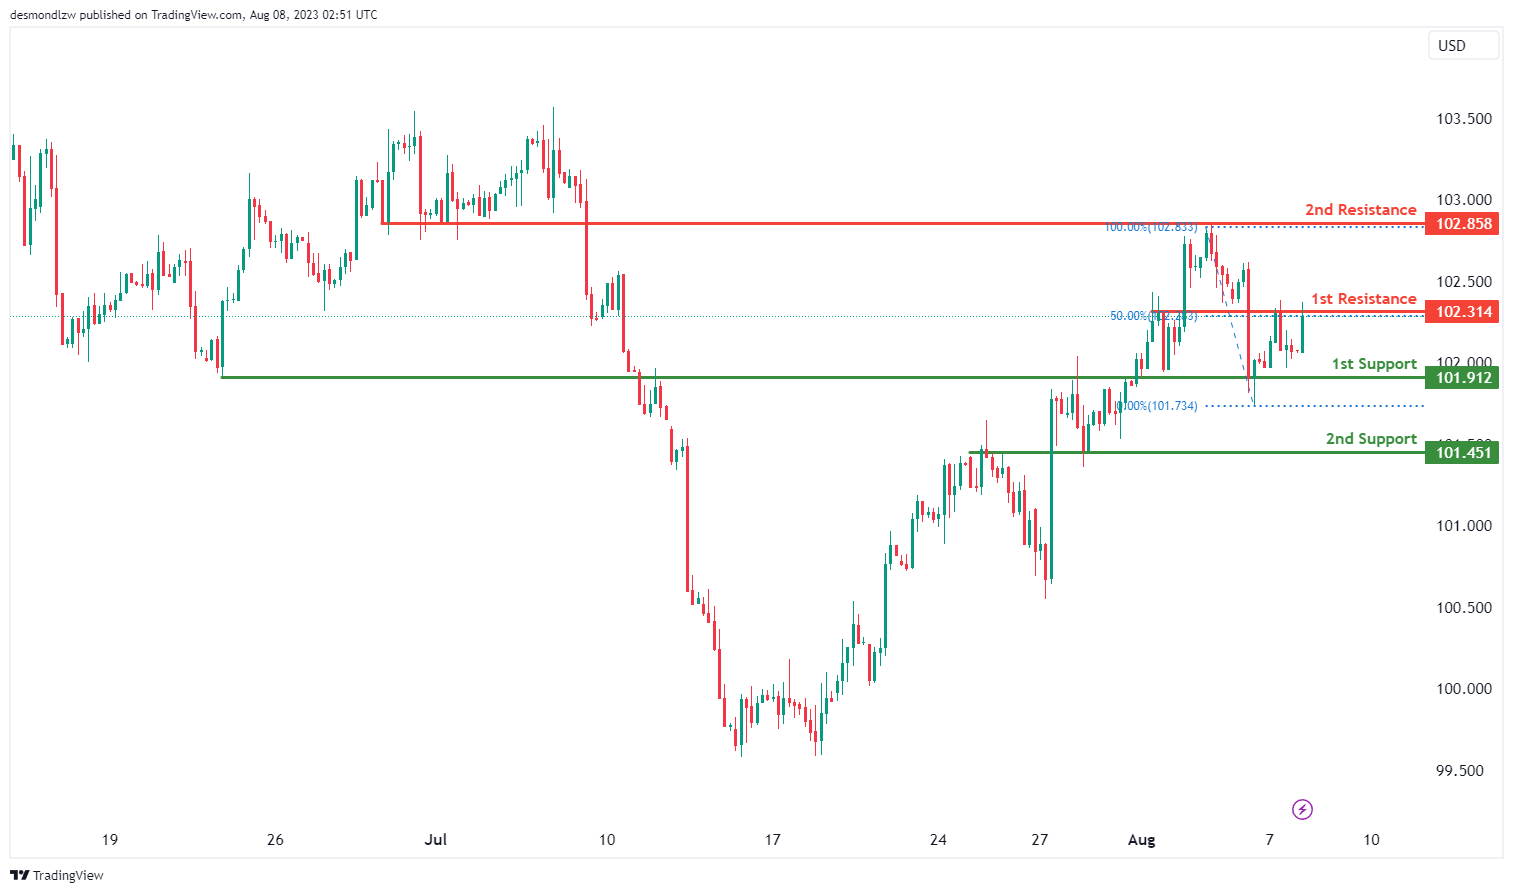
The DXY (Dollar Index) chart is currently displaying a bearish overall momentum, suggesting a downward trend in the market.
In light of this bearish sentiment, the price could potentially experience a bearish reaction upon reaching the 1st resistance level and subsequently drop towards the 1st support level.
The 1st support level is noted at 101.91, and it holds significance as an overlap support, indicating potential buying interest from traders at this level.
Furthermore, there is a 2nd support level at 101.45, also recognized as an overlap support, adding additional weight to its importance as a potential price level where buyers may step in.
On the other hand, the 1st resistance level stands at 102.31, identified as an overlap resistance and coinciding with a 50% Fibonacci retracement level. This resistance level may attract selling pressure and limit further upside movement.
Additionally, the 2nd resistance is situated at 102.85, categorized as an overlap resistance, which could further hinder any upward price advances.
EUR/USD:
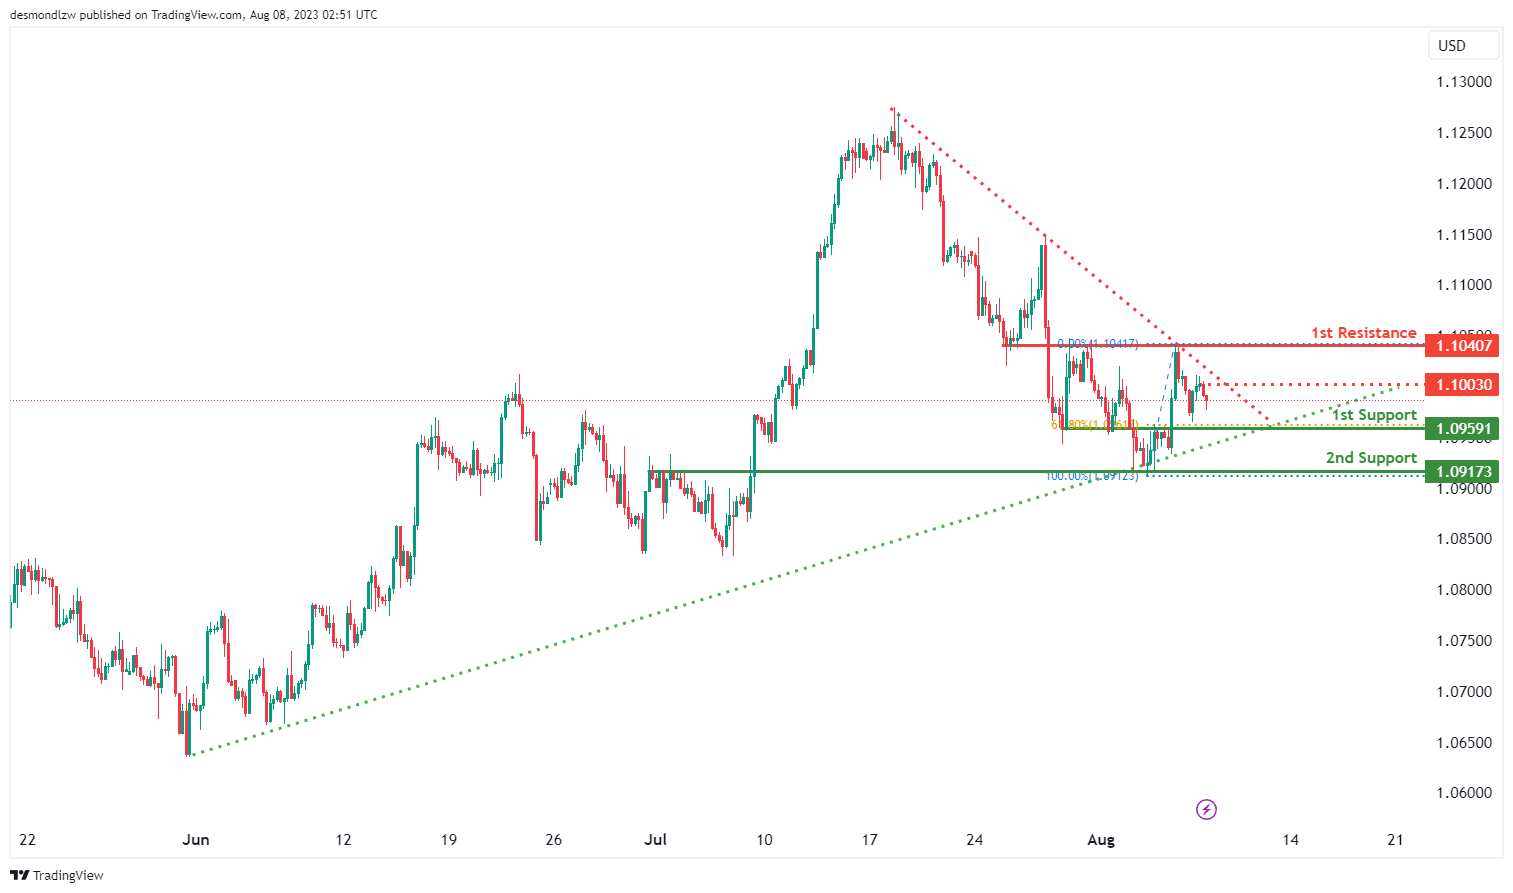
The EUR/USD chart is currently indicating a neutral overall momentum, lacking a clear directional trend.
In this situation, the price of the EUR/USD currency pair has the potential to fluctuate between the 1st resistance and the 1st support level.
The 1st support level is at 1.0959, which is considered a pullback support and gains significance from its alignment with a 61.80% Fibonacci retracement level. Traders may view this level as a favorable buying opportunity during pullbacks in the market.
Alongside the 1st support, there is a 2nd support level situated at 1.0917, identified as an overlap support. This level may also attract buyers’ interest and provide additional support during price declines.
On the other hand, the 1st resistance is positioned at 1.1040, acting as an overlap resistance and coinciding with a 50% Fibonacci retracement level. This resistance level could impede further upward movement and attract selling pressure.
Furthermore, an intermediate resistance level is noted at 1.1003, identified as an overlap resistance, further adding to potential resistance points in the price movement.
Additionally, the chart pattern observed is a symmetrical triangle, which signifies a period of consolidation before an eventual breakout or breakdown. A break above the upper trendline of the pattern might indicate a bullish breakout, while a break below the lower trendline could suggest a bearish breakdown.
EUR/JPY:
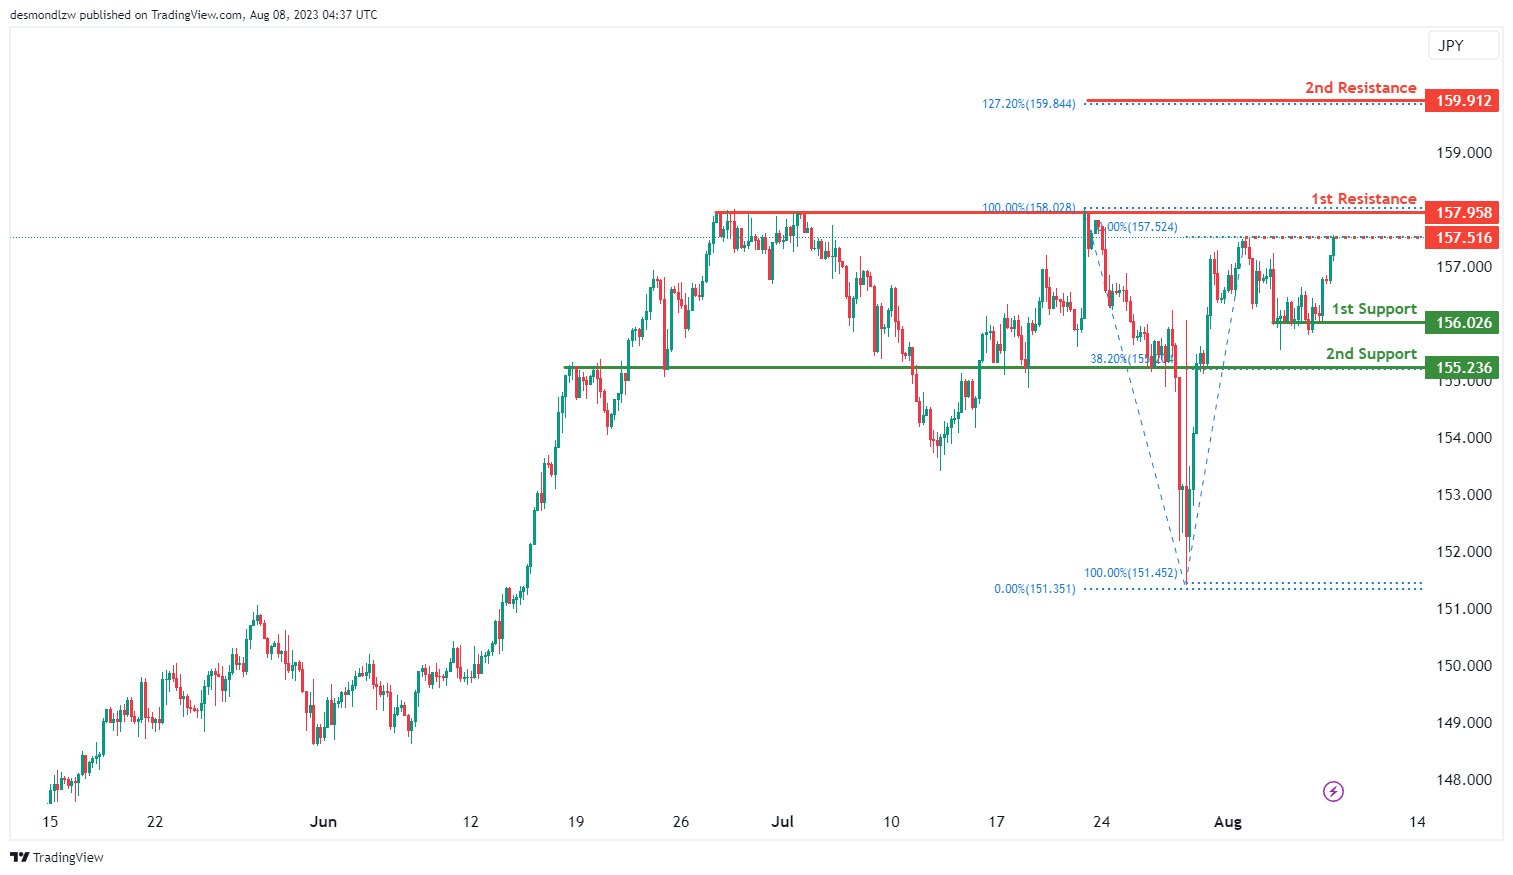
The EUR/JPY instrument currently demonstrates a bullish momentum on the chart. Given this trend, the price is expected to maintain its bullish trajectory, moving towards the 1st resistance level at 157.95.
The 1st support level at 156.02 is significant due to its role as a multi-swing low support. The 2nd support, identified at 155.23, is characterized by its overlap support nature and is aligned with a 38.20% Fibonacci Retracement.
Turning our attention to resistance levels, the 1st resistance at 157.95 is notable for its multi-swing high resistance characteristic. The 2nd resistance, pinpointed at 159.91, corresponds with a 127.20% Fibonacci Extension.
Additionally, there’s an intermediate resistance level set at 157.51, which stands out for its function as a swing high resistance.
EUR/GBP:
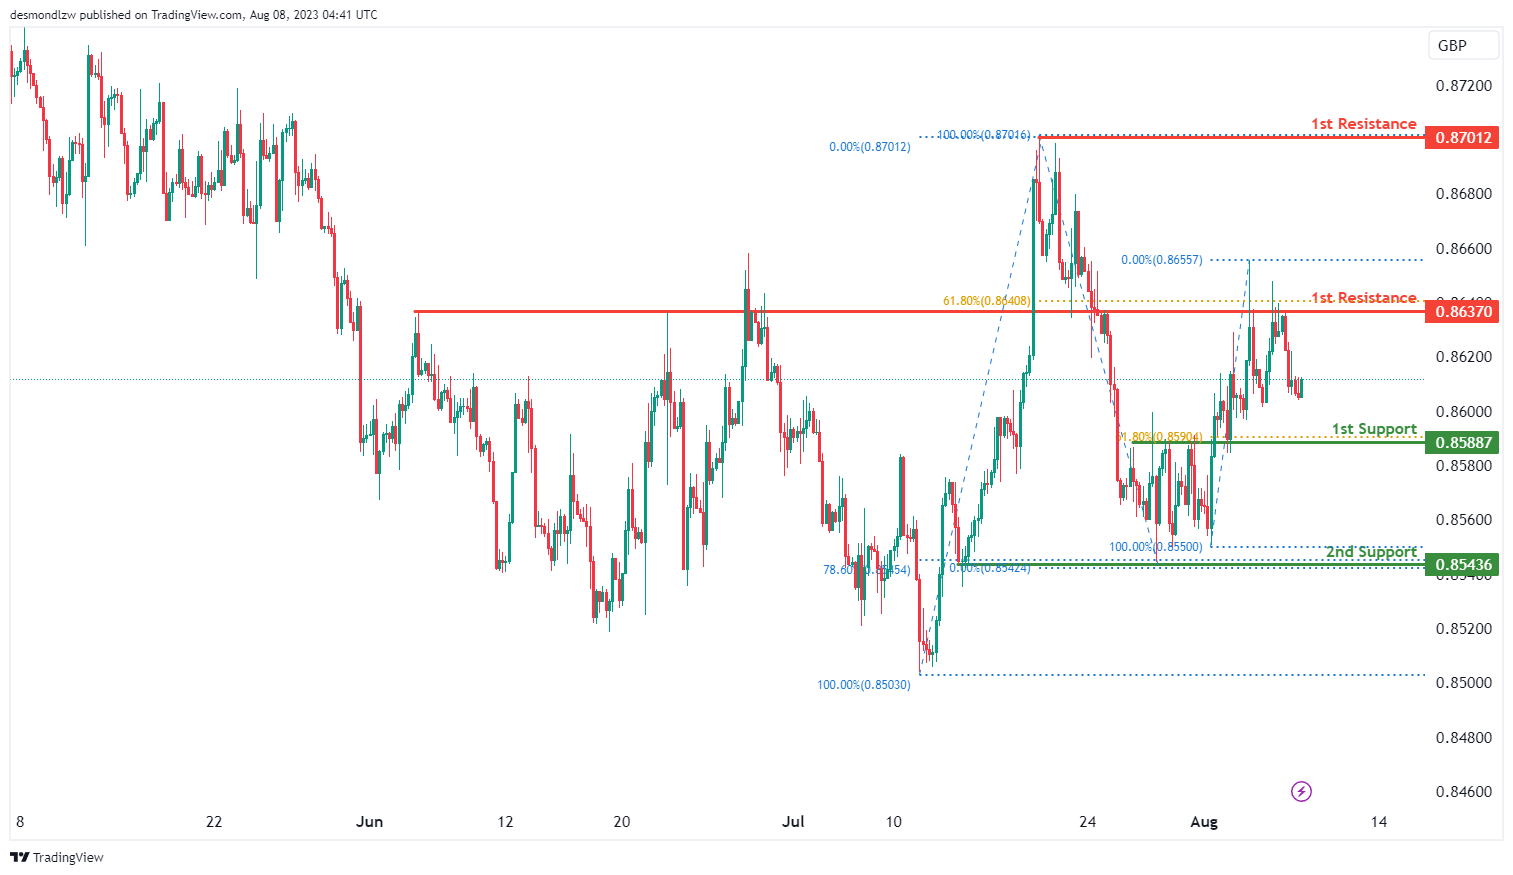
The EUR/GBP instrument currently showcases a bearish trend on the chart. Given this downward trajectory, there’s a potential for the price to continue its bearish path towards the 1st support level, set at 0.8588.
This 1st support level is significant because it acts as an overlap support and aligns with a 61.80% Fibonacci Retracement. Meanwhile, the 2nd support at 0.8543 is notable due to its nature as a swing low support, also corresponding with a 78.60% Fibonacci Retracement.
On the flip side, the 1st resistance is located at 0.8637 and is characterized by its pullback resistance attribute, in conjunction with a 61.80% Fibonacci Retracement. The 2nd resistance level, situated at 0.8701, is distinguished by its role as a swing high resistance.
GBP/USD:
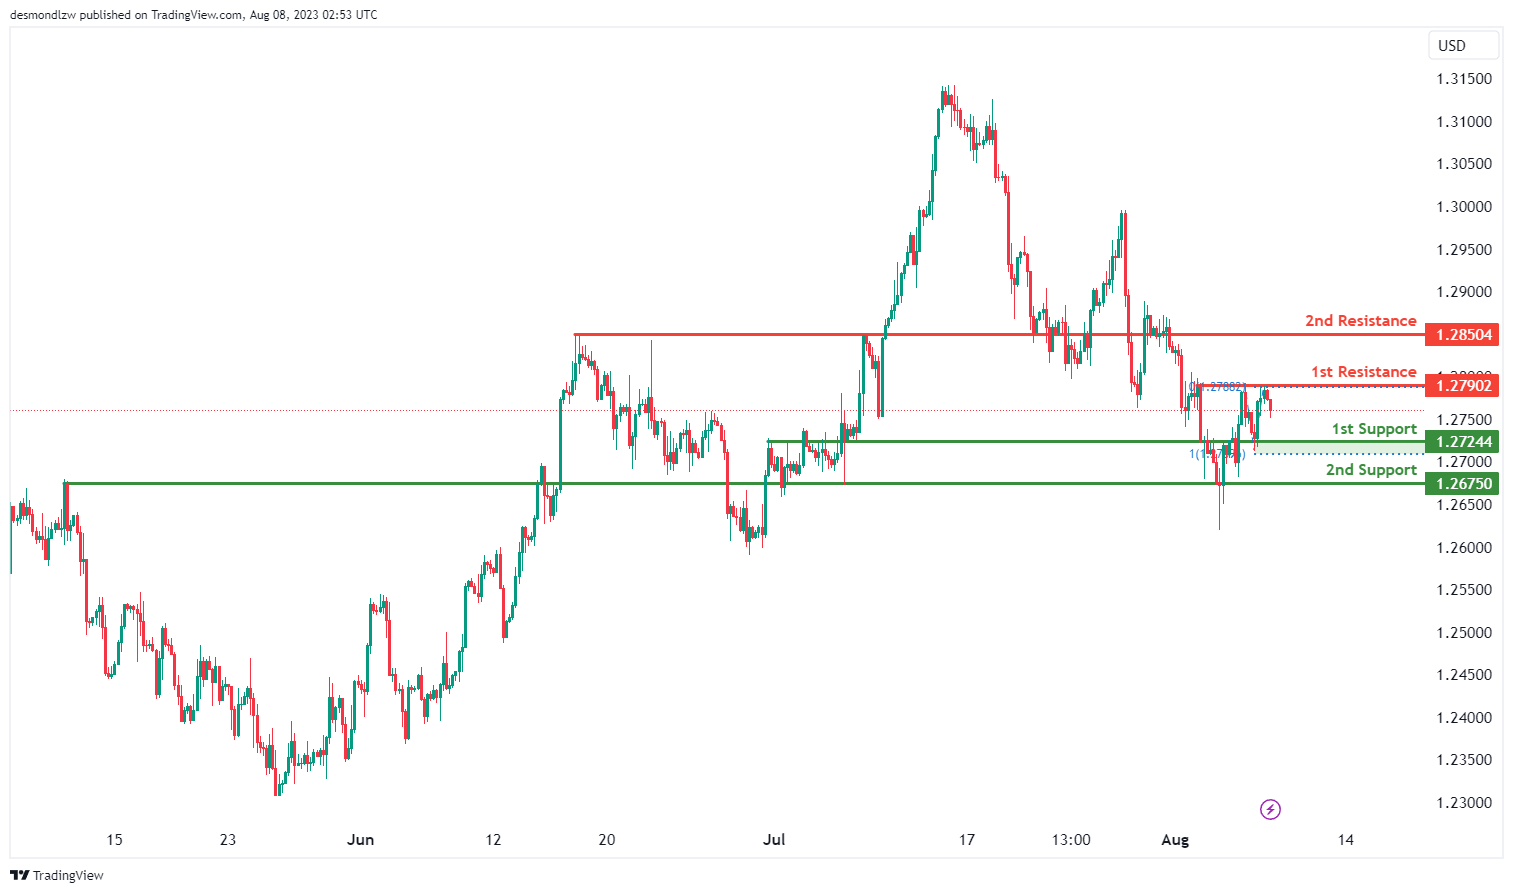
The GBP/USD chart is currently showing a bearish overall momentum, indicating a downward trend in the market.
Given this bearish sentiment, the price of the GBP/USD currency pair has the potential to continue its bearish movement towards the 1st support level.
The 1st support level is located at 1.2724 and gains significance as an overlap support, being aligned with a 100% Fibonacci projection level. This level may attract buyers’ interest and provide a potential floor for the price during the bearish continuation.
In addition to the 1st support, there is a 2nd support level situated at 1.2675, identified as an overlap support, which adds further reinforcement to its potential as a support level.
On the other hand, the 1st resistance level is positioned at 1.2724, noted as a multi-swing high resistance. This level could act as a significant barrier to any upward movement in the price.
Furthermore, there is a 2nd resistance level at 1.2850, identified as a pullback resistance, which may limit any upward retracement attempts during the bearish trend.
GBP/JPY:
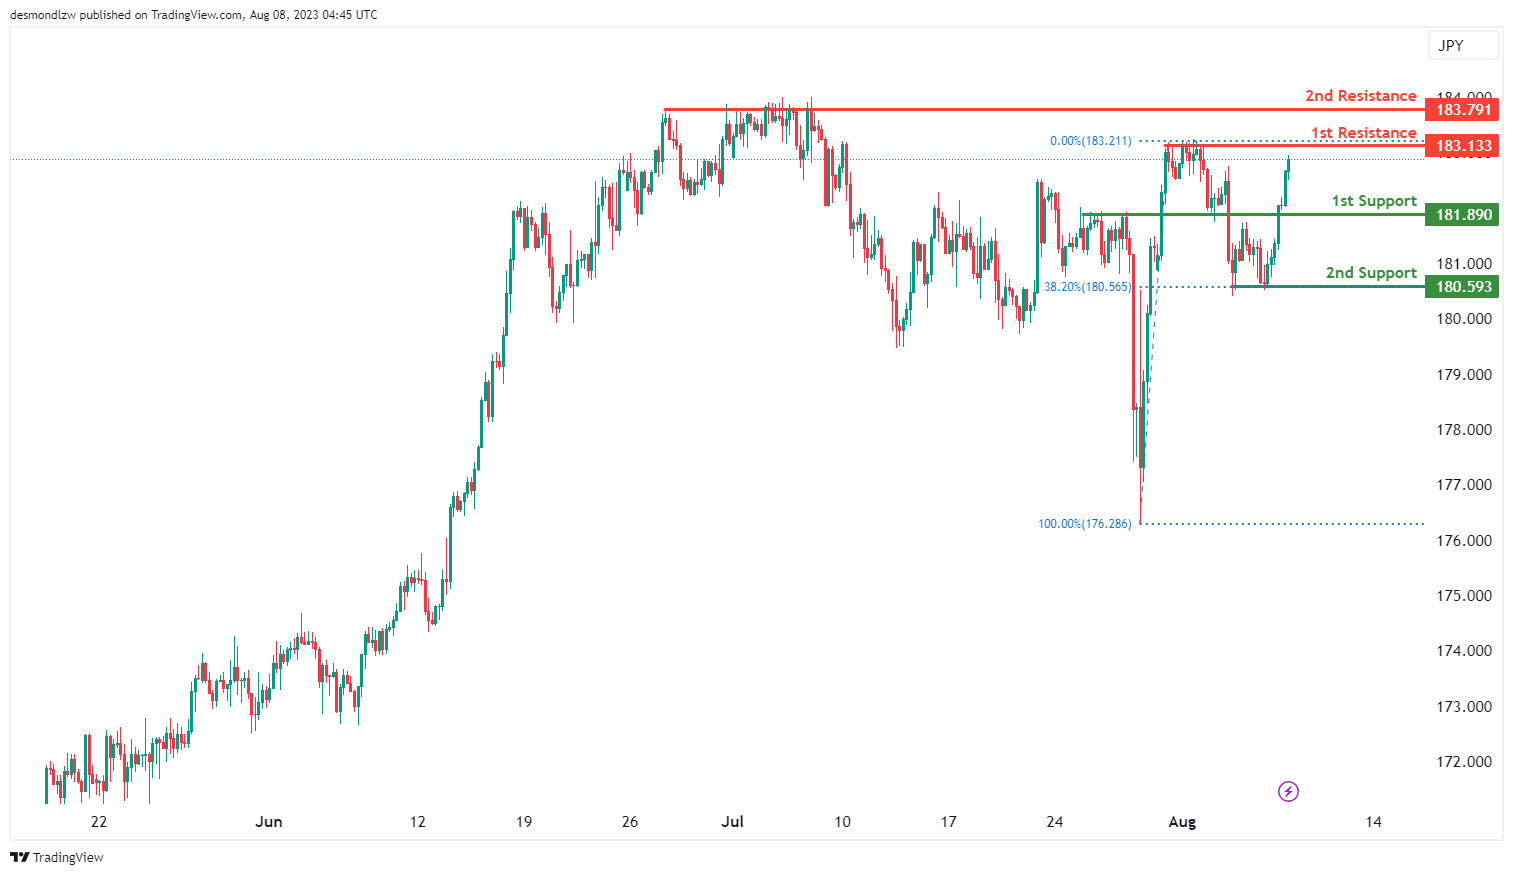
The GBP/JPY currency pair appears to be on a bullish momentum. Given this upward trajectory, there’s potential for the price to continue its bullish trend towards the 1st resistance level, which is located at 183.13.
The 1st support level, pegged at 181.89, acts as an overlap support and is of significance due to its proximity to current price levels, offering a potential cushion against potential pullbacks. The 2nd support level is established at 180.59, and its importance is elevated because it serves as a multi-swing low support, aligning with a 38.20% Fibonacci Retracement.
On the upside, the 1st resistance point is at 183.13, denoted by its multi-swing high resistance characteristic. This is a crucial level to watch as breaking above it could pave the way for further bullish momentum. The 2nd resistance level is slightly higher, at 183.79, which is also recognized for its role as a multi-swing high resistance. Breaking this level might indicate a strong bullish continuation.
USD/CHF:
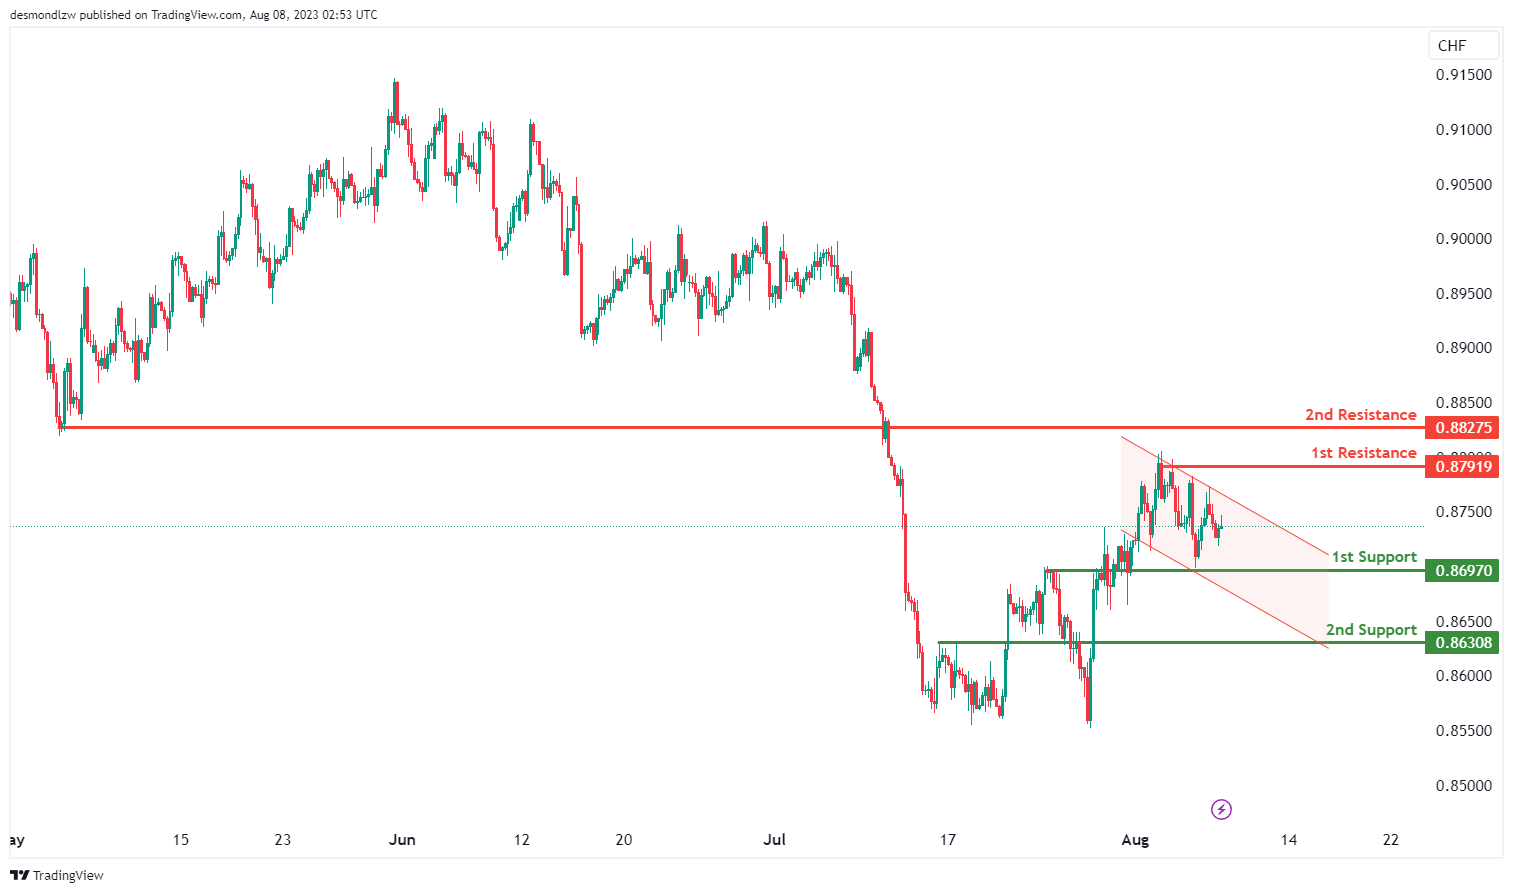
The USD/CHF chart is currently demonstrating a bearish overall momentum, suggesting a downward trend in the market.
This bearish sentiment is supported by the fact that the price is following a bearish descending channel pattern.
Given this bearish trend, the price of USD/CHF may potentially continue its downward movement towards the 1st support level.
The 1st support level is noted at 0.8697, which is considered an overlap support. This level may attract buyers and provide potential support during the bearish continuation.
Furthermore, there is a 2nd support level at 0.8630, identified as a pullback support. Traders may view this level as a critical area of potential buying interest during price pullbacks in the market.
On the other hand, the 1st resistance level stands at 0.8791, categorized as a swing high resistance. This level could act as a significant barrier to any potential upward movement in the price.
Additionally, there is a 2nd resistance level at 0.8827, recognized as a pullback resistance. This level may limit any upward retracement attempts during the bearish trend.
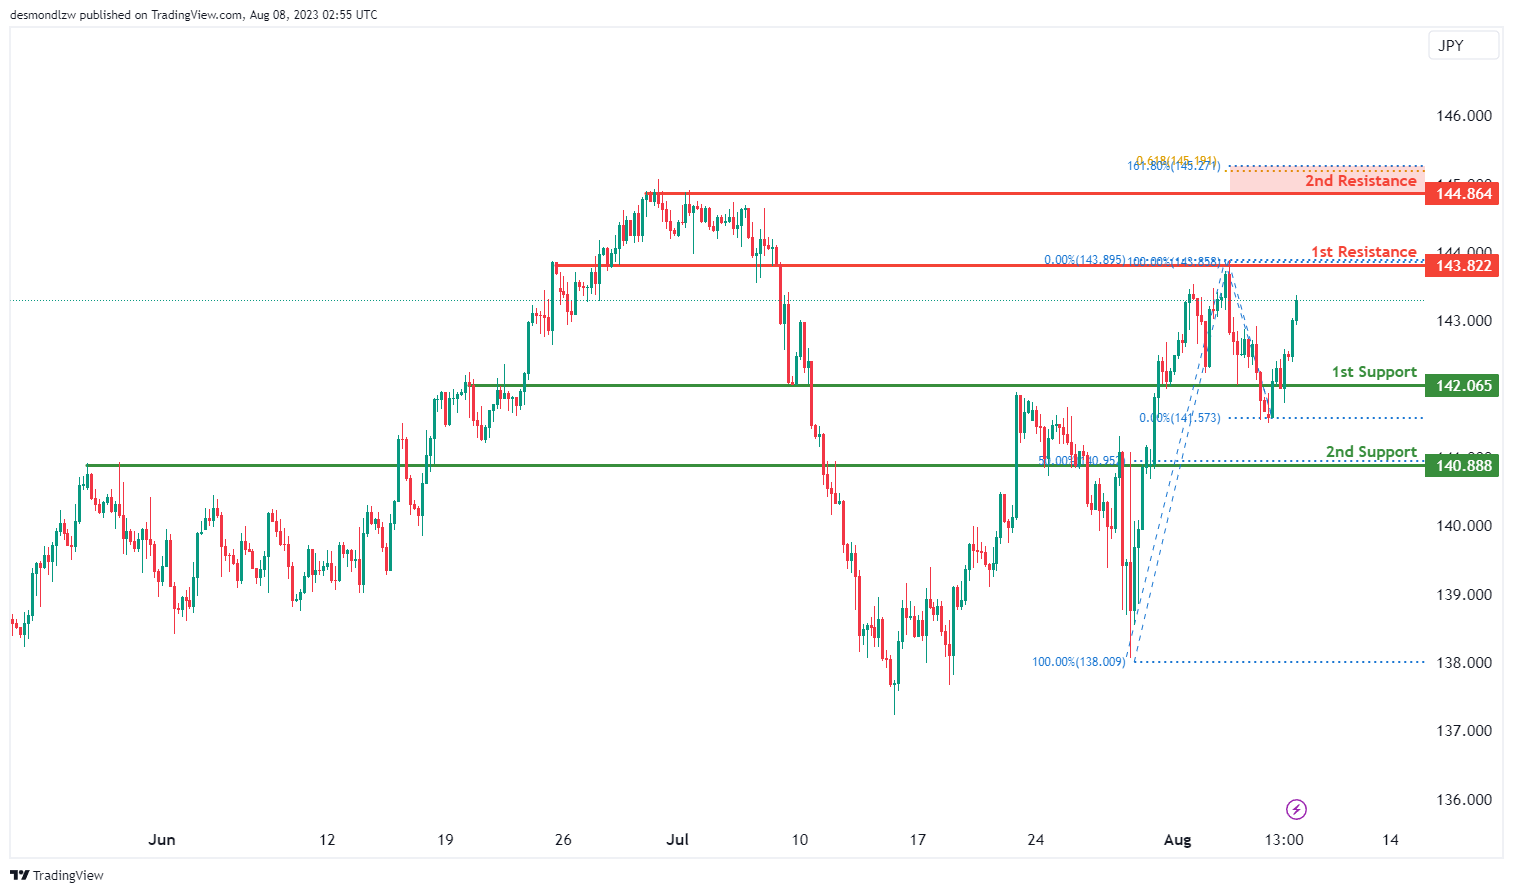
USD/JPY:
The USD/JPY chart is currently showing a bullish overall momentum, indicating an upward trend in the market.
Given this bullish sentiment, the price of the USD/JPY currency pair has the potential to continue its upward movement towards the 1st resistance level.
The 1st support level is located at 142.0600 and is considered an overlap support, which may attract buyers and provide a potential floor for the price during any retracements.
In addition to the 1st support, there is a 2nd support level situated at 140.8800, identified as a pullback support, adding further significance to its potential as a support level during price pullbacks.
On the other hand, the 1st resistance level is positioned at 143.8200 and is noted as an overlap resistance. This level could act as a significant barrier to any further upward movement in the price.
Furthermore, there is a 2nd resistance level at 144.8600, recognized as a pullback resistance. This level holds additional importance due to its alignment with a 61.80% Fibonacci projection and a 161.80% Fibonacci extension, indicating Fibonacci confluence, which may exert strong resistance and limit the price’s upward movement.
USD/CAD:
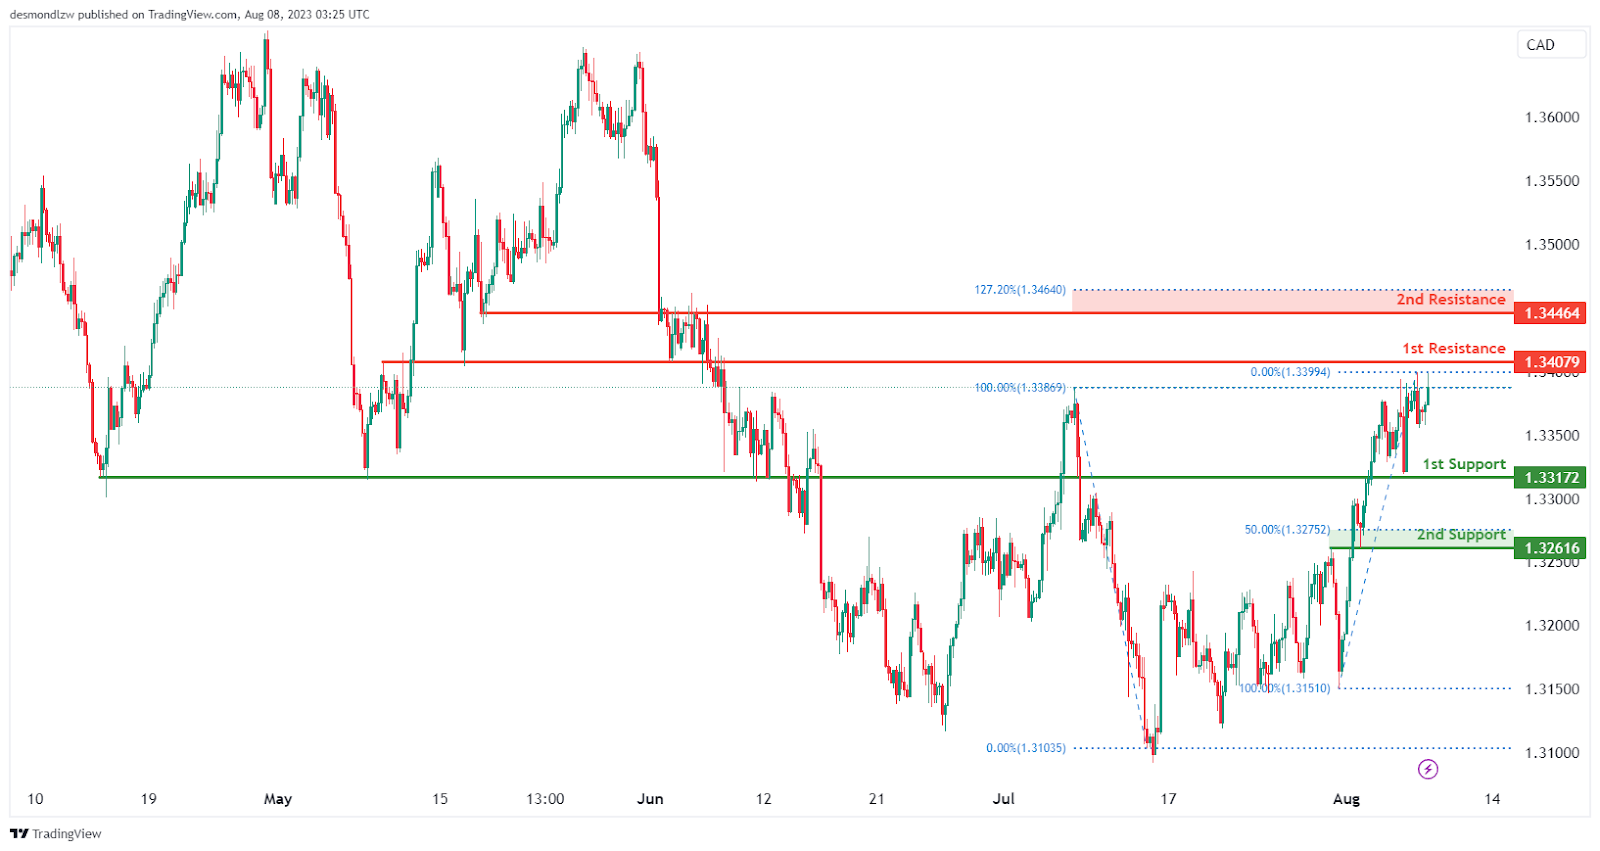
The USD/CAD pair is currently displaying a bullish momentum, indicating a possible bullish continuation towards the 1st resistance level.
The 1st resistance level is at 1.3408 which is identified as an overlap resistance, making it a potential obstacle for an upward price movement. Should the price break above this level, the 2nd resistance at 1.3446 may come into play. This is a resistance level that aligns with close to the 127.20% Fibonacci extension level which could potentially act as a barrier for further upside movement.
To the downside, the 1st support level is at 1.3317, identified as an overlap support where price has previously found both support in the past. The 2nd support level at 1.3262 which represents a pullback support that is reinforced by the 50% Fibonacci retracement level.
AUD/USD:
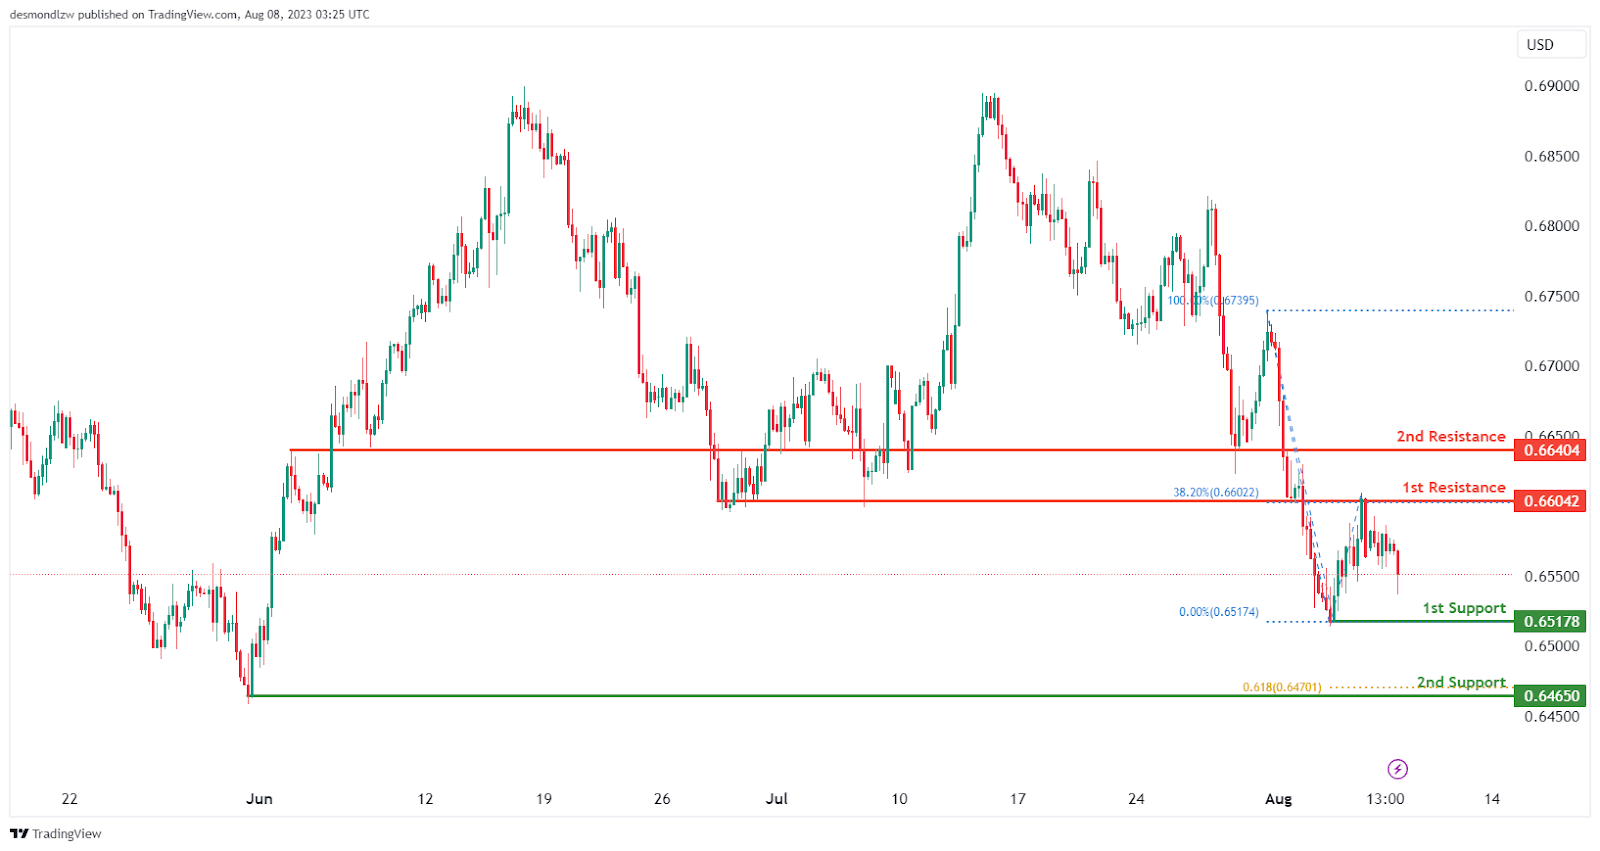
The AUD/USD pair is currently demonstrating a bearish moomentum with the expectation for a bearish continuation towards the 1st support level.
The 1st support level at 0.6518 is recognized as a swing-low support. If the price breaches this level, the 2nd support level is at 0.6465. This level has also been identified as a swing-low support that corresponds with the 61.80% Fibonacci projection level.
To the upside, the 1st resistance level at 0.6604 is an overlap resistance that aligns with the 38.20% Fibonacci retracement level. Should the price break above this level, the 2nd resistance at 0.6640 may come into focus. This level is recognized as an overlap resistance that could prove to be a significant barrier should price rise to this level.
NZD/USD
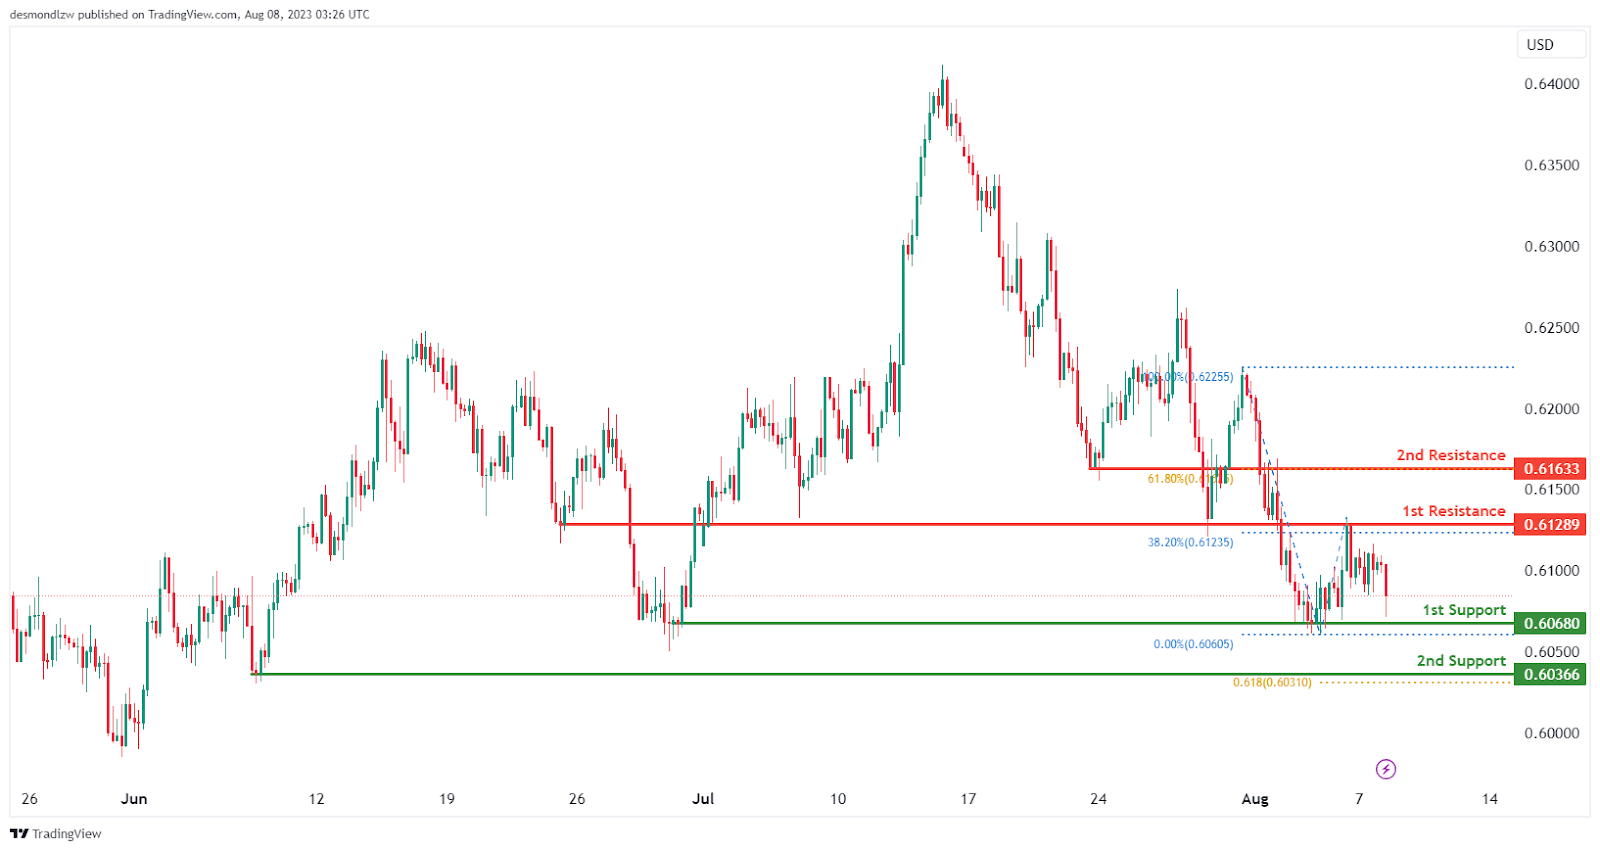
The NZD/USD chart is currently exhibiting a bullish overall momentum, indicating an upward trend in the market.
Given this bullish sentiment, the price of NZD/USD may potentially experience a bullish bounce off the 1st support level at 0.6068 and continue its upward movement towards the 1st resistance level at 0.6128.
The 1st support level is located at 0.6068 and is considered an overlap support. In addition to the 1st support, there is a 2nd support level at 0.6036, identified as a swing low support. This level gains significance from its alignment with a 61.80% Fibonacci projection, adding further strength to its potential as a support level.
On the other hand, the 1st resistance level stands at 0.6128 and is noted as an overlap resistance. This level could act as a significant barrier to any further upward movement in the price.
Furthermore, there is a 2nd resistance level at 0.6163, identified as an overlap resistance, and aligned with a 61.80% Fibonacci retracement. This level may exert additional resistance pressure on the price.
DJ30:
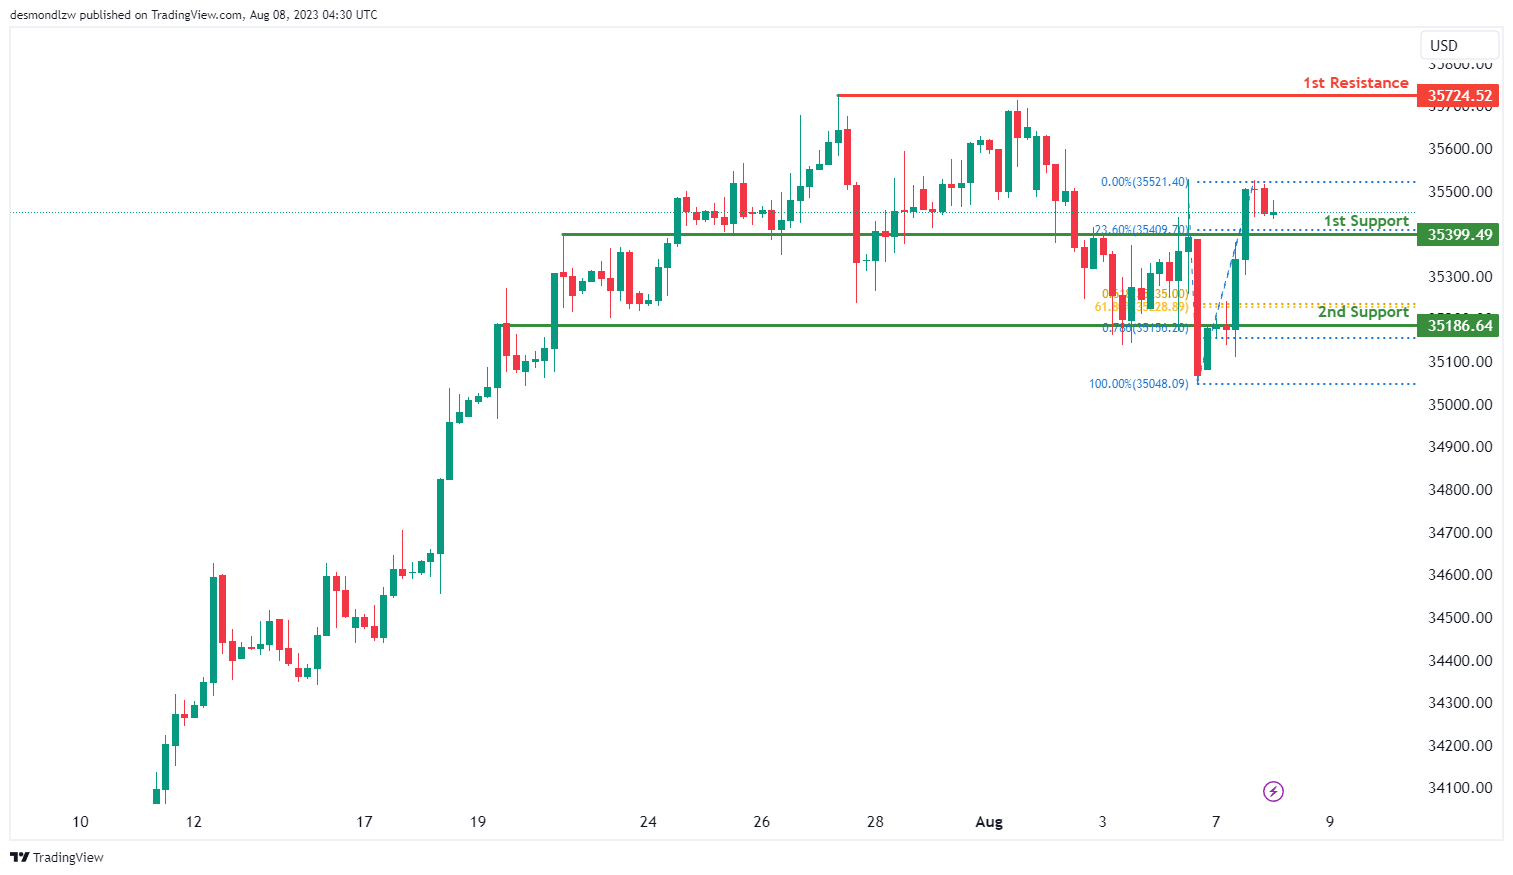
The DJ30 instrument is currently displaying a bearish overall momentum on the chart. The price could potentially continue its bearish movement towards the 1st support level at 35399.49.
The 1st support level at 35399.49 is recognized for its role as an overlap support and its alignment with a 23.60% Fibonacci Retracement. The 2nd support, positioned at 35186.64, stands out for its overlap support designation. Additionally, it correlates with both a 61.80% Fibonacci Retracement and a 61.80% Fibonacci Projection, highlighting a Fibonacci confluence.
On the resistance front, the 1st resistance level at 35724.52 is notable for its role as a multi-swing high resistance.
GER30:
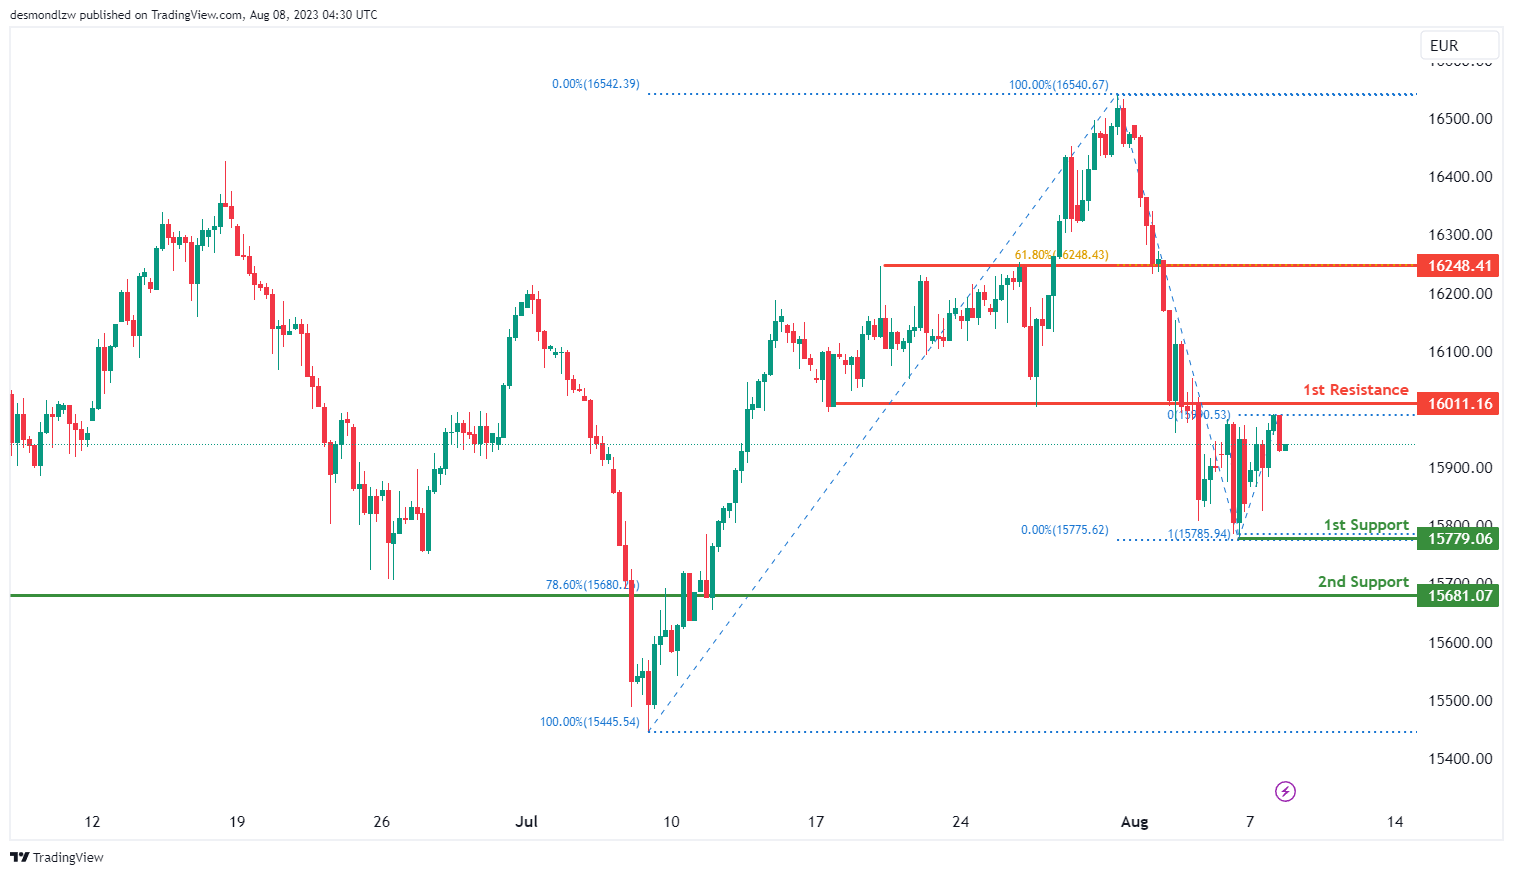
The GER30 instrument is currently indicating a bearish momentum on the chart. The price is anticipated to continue its bearish trajectory towards the 1st support level at 15779.06.
The 1st support level at 15779.06 is distinguished for its role as a swing low support and its alignment with a 100% Fibonacci Projection. The 2nd support, pinpointed at 15681.07, is notable because of its overlap support designation and its correspondence with a 78.60% Fibonacci Retracement.
In terms of resistance, the 1st resistance level at 16011.16 is characterized by its function as a pullback resistance. The 2nd resistance at 16248.41 is defined by its status as an overlap resistance and its alignment with a 61.80% Fibonacci Retracement.
US500
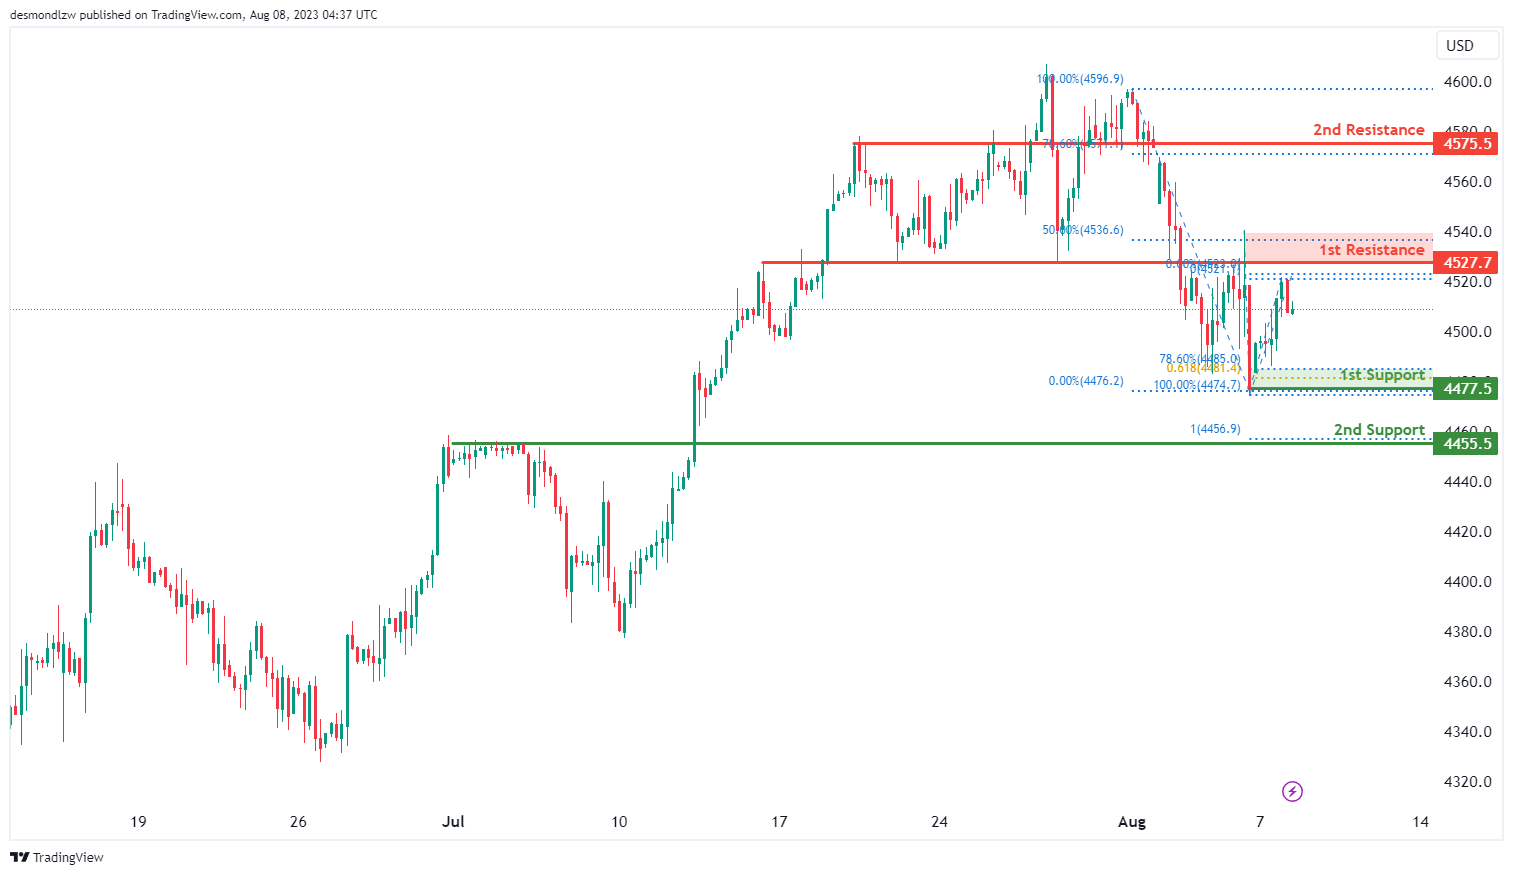
The US500 instrument currently showcases a bearish momentum on the chart. The price is anticipated to continue its bearish movement towards the 1st support level at 4477.5.
The 1st support level at 4477.5 is prominent due to its function as a swing low support. Additionally, it aligns with a 78.60% Fibonacci Retracement and a 61.80% Fibonacci Projection, which signifies a Fibonacci confluence. The 2nd support, set at 4455.5, is characterized by its role as a pullback support and its correspondence with a 100% Fibonacci Projection.
In the realm of resistance, the 1st resistance level at 4527.7 is recognized as an overlap resistance and aligns with a 50% Fibonacci Retracement. The 2nd resistance level at 4575.5 is defined by its status as an overlap resistance and its association with a 78.60% Fibonacci Retracement.
BTC/USD:
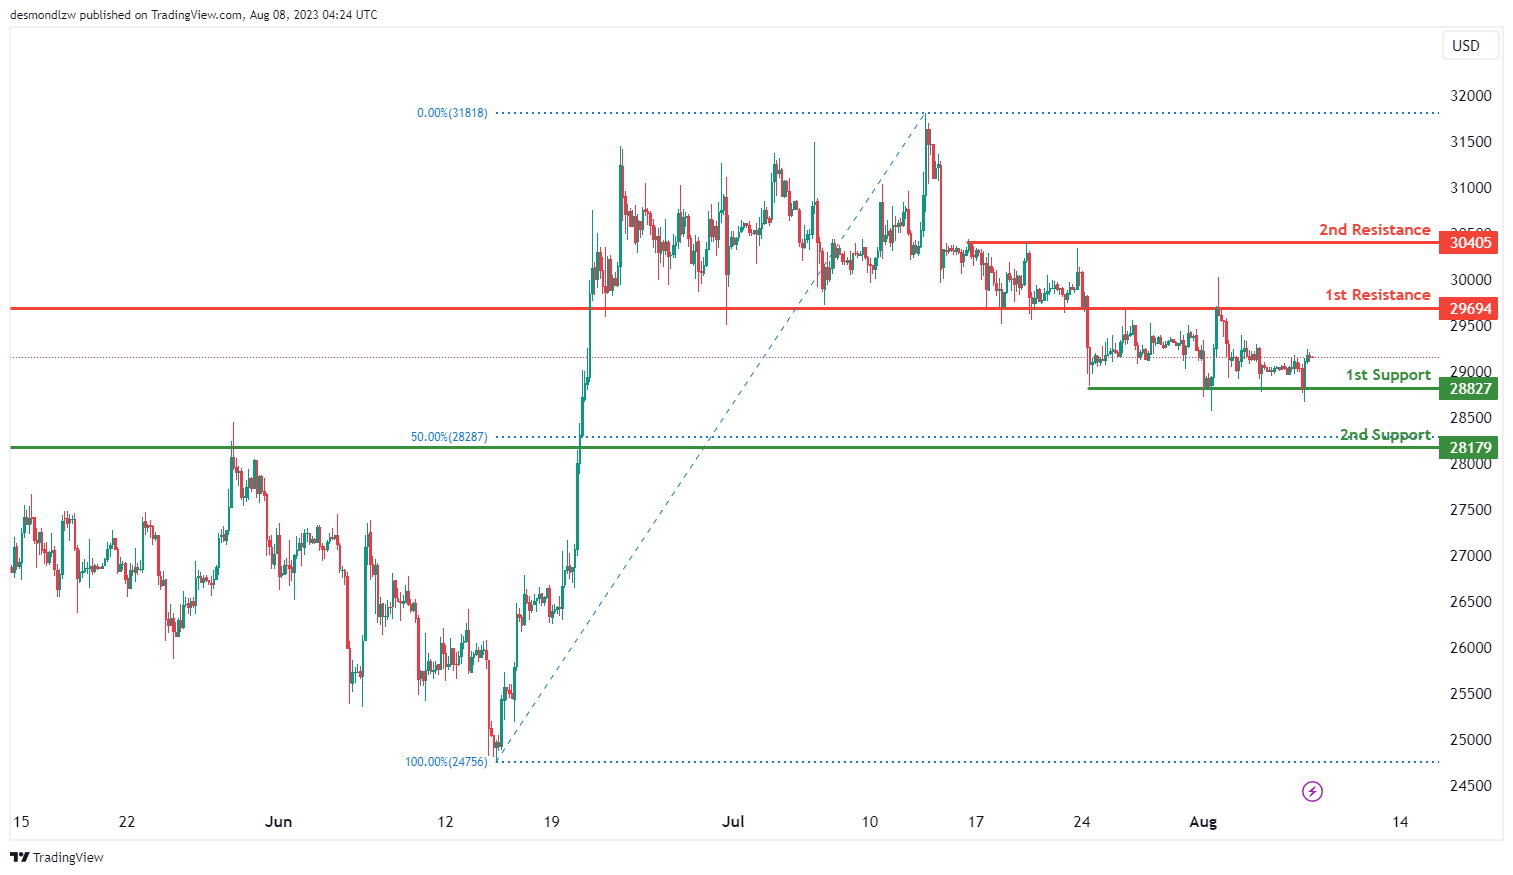
The BTC/USD instrument currently exhibits a neutral momentum on the chart. The price is predicted to fluctuate between the 1st resistance level at 29694 and the 1st support level at 28827.
The 1st support level at 28827 is recognized for its role as a multi-swing low support. The 2nd support, situated at 28179, is defined by its function as a pullback support and coincides with a 50% Fibonacci Retracement.
On the resistance spectrum, the 1st resistance level at 29694 is marked by an overlap resistance. The 2nd resistance, positioned at 30405, is characterized by its status as a multi-swing high resistance.
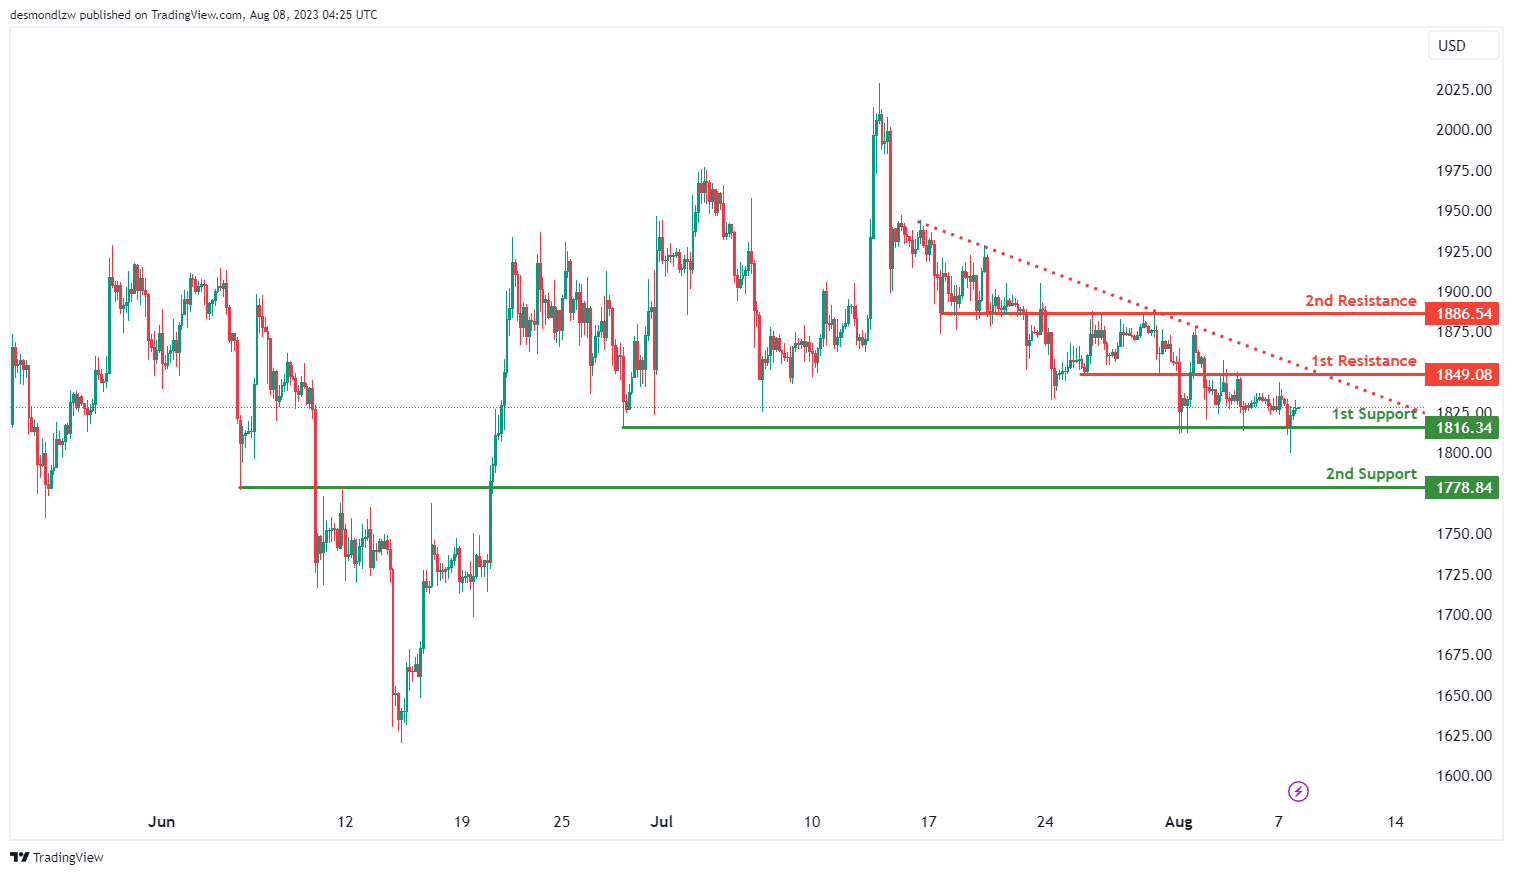
ETH/USD:
The ETH/USD instrument is currently exhibiting a neutral momentum on the chart. It is anticipated that the price might fluctuate between the 1st resistance level at 1849.08 and the 1st support level at 1816.34.
The 1st support level at 1816.34 is notable for its role as a multi-swing low support. The 2nd support, pinpointed at 1778.84, is characterized by its status as an overlap support.
In terms of resistance, the 1st resistance level at 1849.08 is identified by an overlap resistance. Similarly, the 2nd resistance at 1886.54 is marked as an overlap resistance.
WTI/USD:
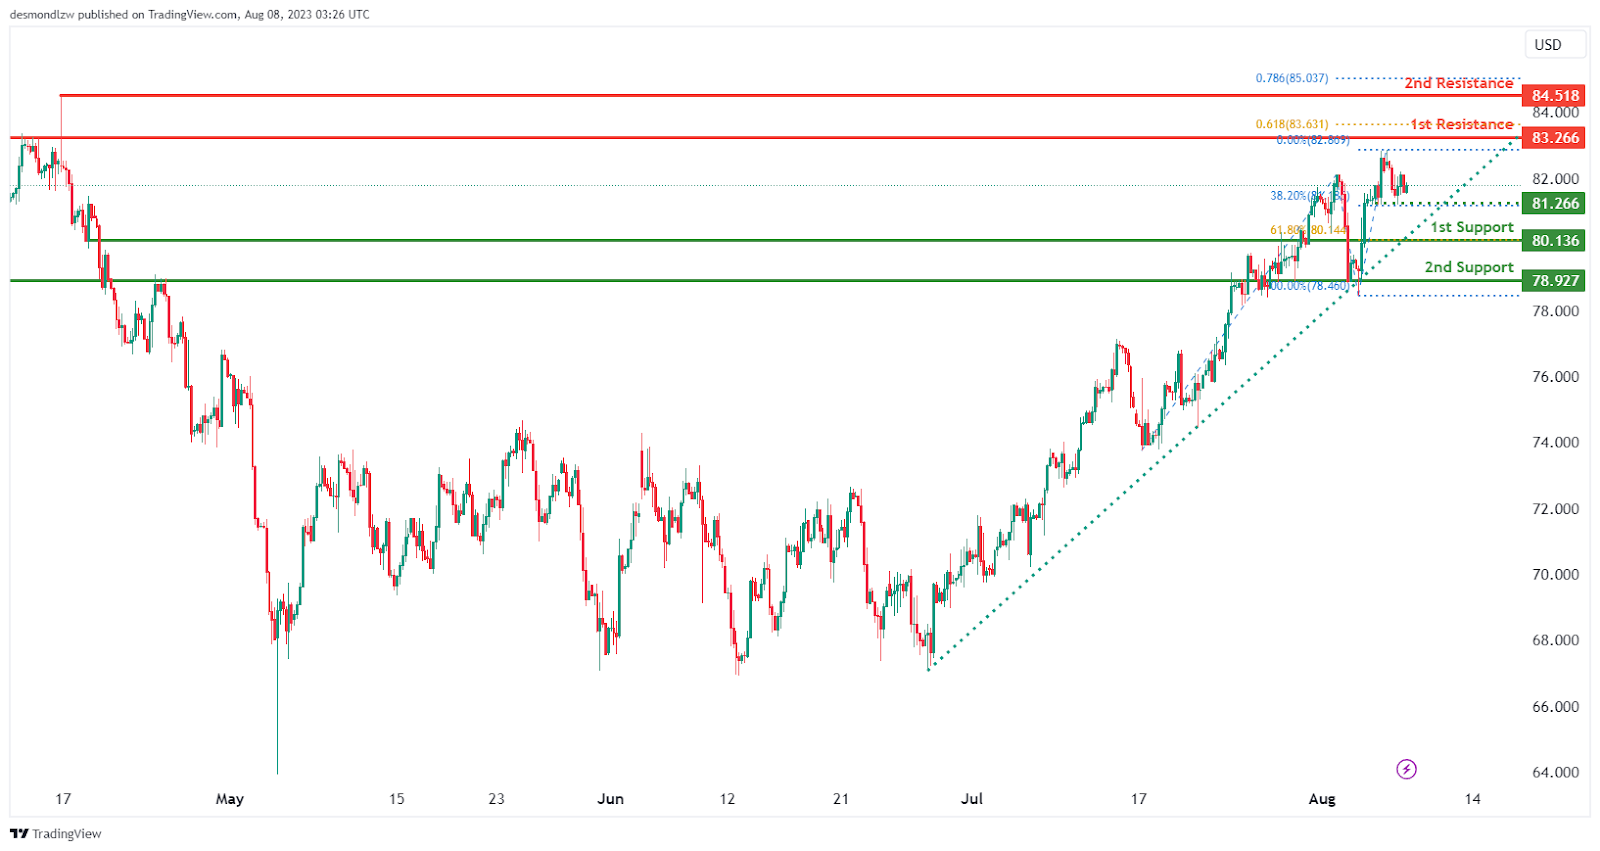
The WTI Crude Oil (West Texas Intermediate) is currently demonstrating a bullish momentum. One of the significant indicators reinforcing this momentum is that price is trading above a major ascending trend line, suggesting that further bullish moves could be expected in the future.
The 1st support level is at 80.14 which represents an overlap support that corresponds to the 61.80% Fibonacci retracement level. Further below, the 2nd support is found at 78.93 which represents as overlap support and could act as a potential floor if prices were to decline to this level.
In addition, there is an intermediate support at 81.27 which represents a pullback support level that corresponds to the 38.20% Fibonacci retracement level. This level may provide a temporary floor or reversal zone for any short-term price pullbacks.
To the upside, the 1st resistance level is situated at 83.27 which represents an overlap resistance level that corresponds close to the 61.80% Fibonacci projection level. This is an area which could potentially halt the bullish momentum temporarily.
Beyond this, the 2nd resistance is located at 84.52 which represents a swing-high resistance level that corresponds close to the 78.60% Fibonacci projection level. This level might present a considerable hurdle for further price gains.
XAU/USD (GOLD):
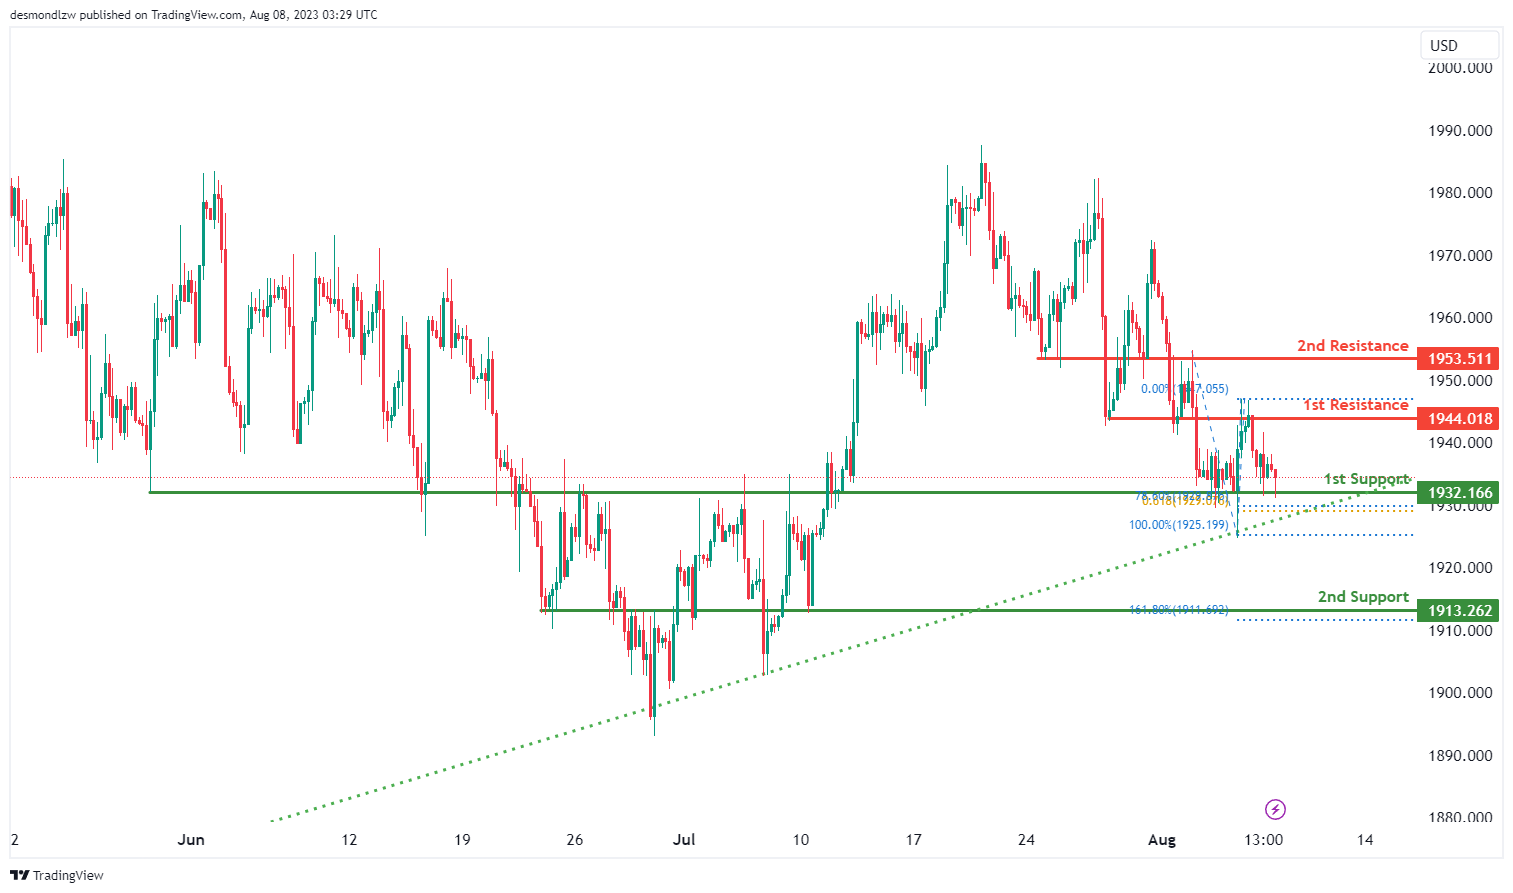
The XAU/USD chart is currently showing a bullish overall momentum, indicating a strong upward trend in the market.
This bullish sentiment is supported by the fact that the price is above a major ascending trend line, suggesting the potential for further bullish momentum in the future.
Given this bullish trend, the price of XAU/USD may potentially experience a bullish bounce off the 1st support level and continue its upward movement towards the 1st resistance level.
The 1st support level is located at 1932.16 and is considered an overlap support. This level gains significance from its alignment with a 61.80% Fibonacci projection and a 78.60% Fibonacci retracement, indicating Fibonacci confluence. This combination of Fibonacci levels adds strength to the support level, making it a crucial area for potential buying interest.
In addition to the 1st support, there is a 2nd support level at 1913.26, also identified as an overlap support, providing additional potential support during price declines.
On the other hand, the 1st resistance level stands at 1944.08, noted as an overlap resistance. This level could act as a significant barrier to any further upward movement in the price.
Furthermore, there is a 2nd resistance level at 1953.51, identified as an overlap resistance, which may exert further resistance pressure on the price.
China’s exports down -14.5% yoy in Jul, shipments to ASEAN down -21.4% yoy
July saw a sharper-than-expected contraction in China's exports, with decline of -14.5% yoy to USD 281.76B. This marked the steepest drop since February 2020 and exceeded market expectations, which had forecasted a decline of -12.5% yoy. Concurrently, imports also took a hit, plunging by -12.4% yoy to USD 201.16B, much steeper than anticipated -5% yoy drop.
With these declines, China's trade surplus unexpectedly widened. July's figures show surplus expanding from USD 70.6B to USD 80.6B, surpassing the market forecast of USD 67.8B.
A key observation was the sharp decline in shipments to ASEAN – one of China's primary trade partners. Exports to ASEAN dropped by a significant -21.43% yoy in July, marking its second straight monthly decline. This is noteworthy as ASEAN had played a pivotal role in bolstering China's export sector earlier in the year.
In addition, exports to EU and US followed suit with declines of -20.62% yoy and -23.12% yoy, respectively. The dip in shipments to US represents a continued trend, with July marking the twelfth consecutive month of decline.