Sample Category Title
Australian Dollar Calm After Rough Week
- RBA says decision to pause was close call
- Australia to release confidence data on Tuesday
- US employment report a mixed bag
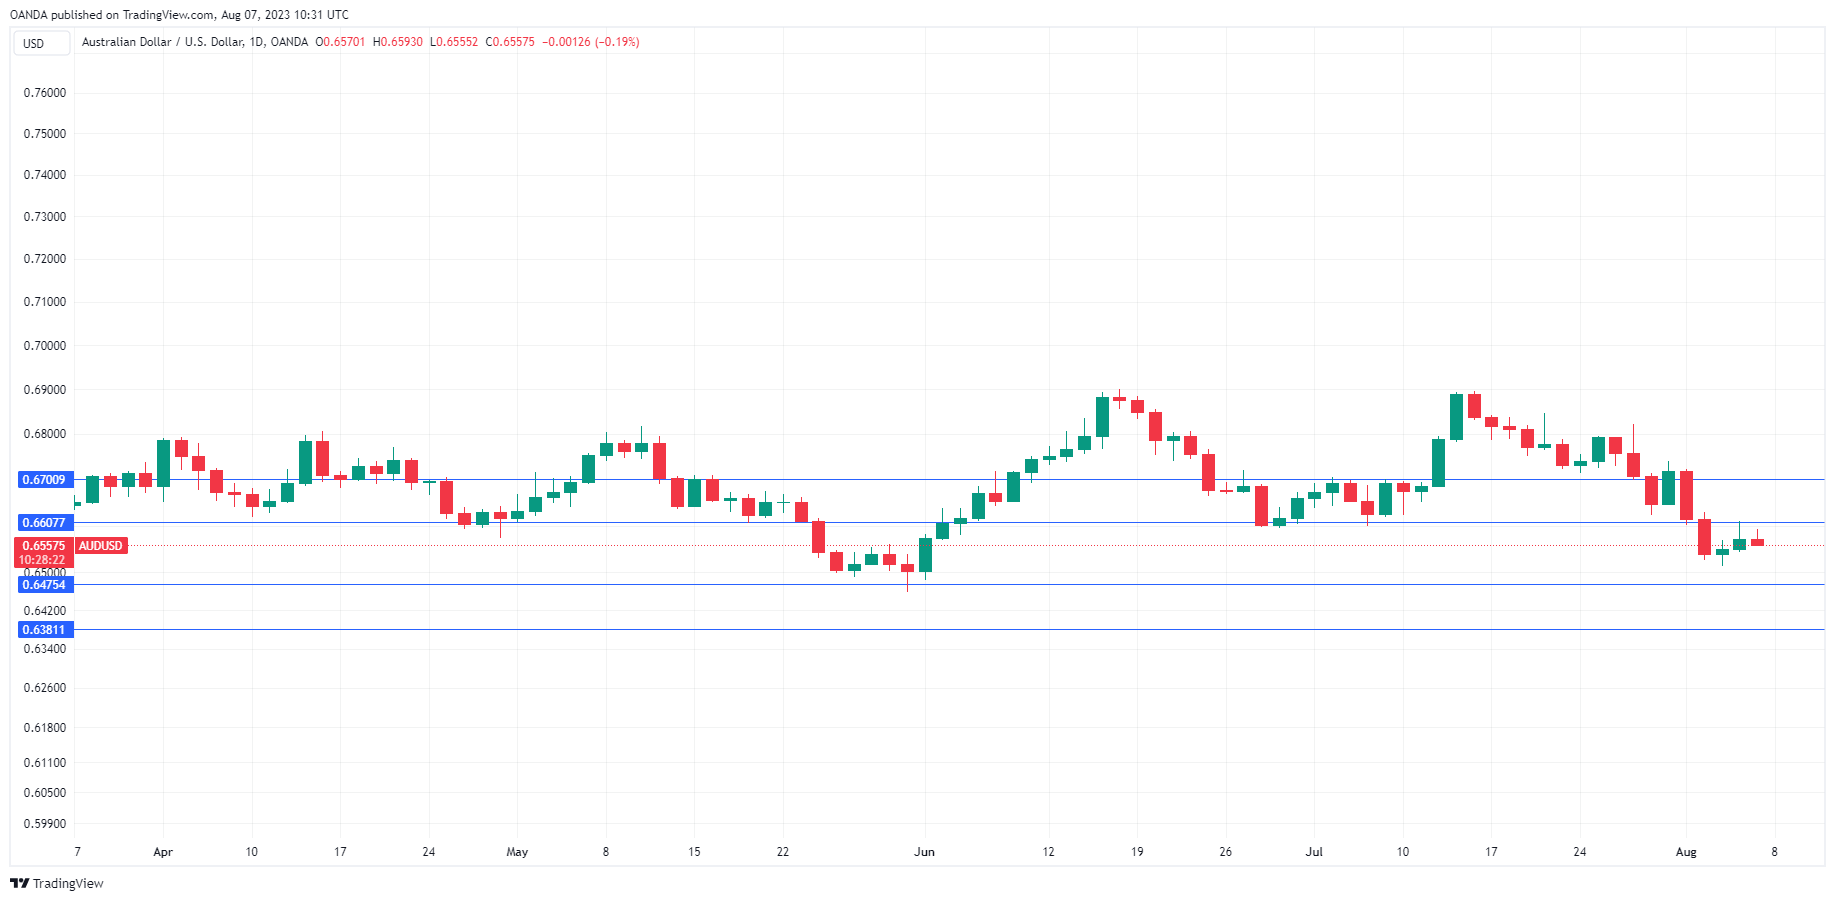
The Australian dollar is coming off another rough week, with losses of 1.17%. The currency has looked dreadful, losing close to 300 points since July 17th. In Monday’s European session, AUD/USD is trading at 0.6556, down 0.20%.
RBA in ‘wait and see’ mode
The week wrapped up with the Reserve Bank of Australia’s quarterly policy statement, which didn’t reveal anything dramatic. The RBA paused rates for a second straight time last week and the statement indicated that the central bank is in a ‘wait and see’ mode with its rate policy. The RBA’s view is that inflation risks remain “broadly balanced” as it strives to guide the economy to a soft landing after an aggressive tightening campaign.
The statement noted that the RBA has been divided on its rate path, saying that at the July and August meetings, the board considered raising rates. In the end, those members in favour of a pause won the day at both meetings, a signal that inflation is falling down fast enough for most members. The statement maintained the RBA’s forecast that inflation will drop to 4.1% by the end of the year and to 2% by the end of 2025, with core inflation dropping to 2.9% by mid-2025.
We’ll get a look at Australian confidence data on Tuesday, with the markets braced for soft readings. Westpac Consumer Confidence is expected to dip to 80.7 in August, down from 81.3 in July. The NAB Business Confidence index is projected to decline to -3 in July, following the zero reading in June.
US employment report a mixed bag
The July employment report was a mix. Nonfarm payrolls were soft at 187,000, despite a banner ADP release which fuelled expectations of a breakout nonfarm payrolls release. Job growth is slowing, but the unemployment rate ticked lower to 3.5% down from 3.6%, and wage growth stayed steady at 4.4%.
The money markets are expecting the Federal Reserve to take a pause at the September meeting, with a probability of 84%, according to the FedWatch. It’s entirely possible that the Fed is done with tightening, but that will depend to a large extent on upcoming inflation and employment data.
AUD/USD Technical
- There is resistance at 0.6607 and 0.6700
- 0.6475 and 0.6382 are providing support
GBP/USD Struggles While EUR/GBP Aims Higher
GBP/USD is struggling to gain pace above the 1.2800 resistance. EUR/GBP is rising and might rise above the 0.8650 resistance.
Important Takeaways for GBP/USD and EUR/GBP Analysis Today
- The British Pound is attempting a fresh increase above 1.2680.
- There was a break above a key bearish trend line with resistance near 1.2725 on the hourly chart of GBP/USD at FXOpen.
- EUR/GBP is rising and trading above the 0.8600 zone.
- There is a major bullish trend line forming with support near 0.8625 on the hourly chart at FXOpen.
GBP/USD Technical Analysis
On the hourly chart of GBP/USD at FXOpen, the pair started a fresh decline from the 1.2880 zone. As mentioned in the previous analysis, the British Pound extended losses below the 1.2800 pivot level against the US Dollar.
The pair even tested the 1.2620 support zone. A low was formed near 1.2620 and the pair is now attempting a fresh increase. There was a move above the 1.2680 resistance zone. Besides, there was a break above a key bearish trend line with resistance near 1.2725.
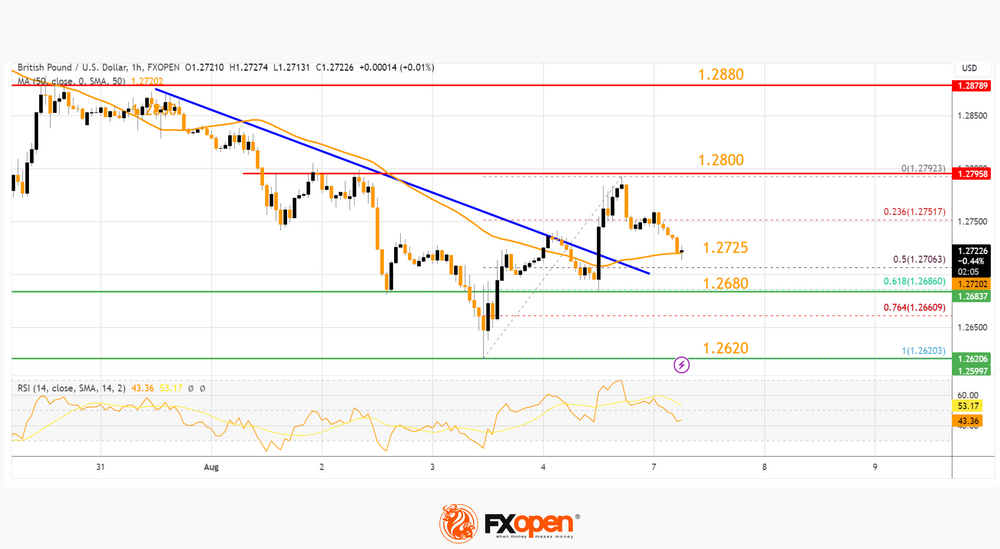
However, the pair struggled to clear the 1.2800 resistance zone. A high is formed near 1.2792 and the pair is now correcting gains. It is trading near the 50-hour simple moving average at 1.2725 and approaching the 50% Fib retracement level of the upward move from the 1.2620 swing low to the 1.2792 high.
On the downside, there is a key support forming near 1.2680. It is close to the 61.8% Fib retracement level of the upward move from the 1.2620 swing low to the 1.2792 high.
If there is a downside break below the 1.2680 support, the pair could accelerate lower. The next major support is near the 1.2620 zone, below which the pair could test 1.2550. Any more losses could lead the pair toward the 1.2500 support.
On the upside, the GBP/USD chart indicates that the pair is facing resistance near 1.2750. The next major resistance is near the 1.2800 zone. A close above the 1.2800 resistance zone could open the doors for a move toward 1.2880.
EUR/GBP Technical Analysis
On the hourly chart of EUR/GBP at FXOpen, the pair started a steady increase from the 0.8555 zone. The Euro traded above the 0.8600 pivot level to enter a positive zone against the British Pound.
The EUR/GBP chart suggests that the pair settled above the 50-hour simple moving average and 0.8625. A high is formed near 0.8647 and the pair is now consolidating gains. It traded below the 23.6% Fib retracement level of the upward move from the 0.8601 swing low to the 0.8647 high.
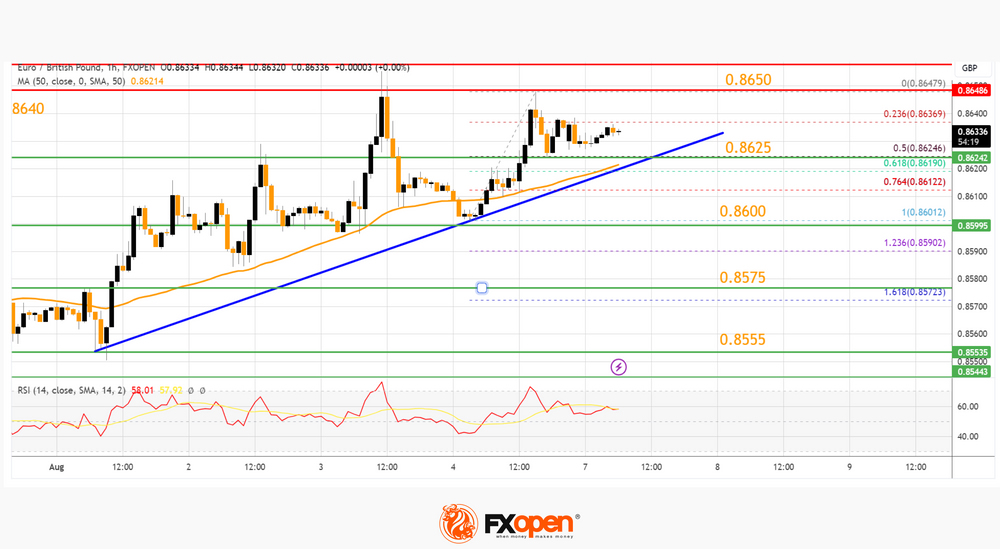
Immediate support sits near a bullish trend line at 0.8625. It is close to the 50% Fib retracement level of the upward move from the 0.8601 swing low to the 0.8647 high.
The next major support is near 0.8600. A downside break below the 0.8600 support might call for more downsides. In the stated case, the pair could drop toward the 0.8555 support level.
Immediate resistance is near 0.8650. The next major resistance could be 0.8675. A close above the 0.8675 level might accelerate gains. In the stated case, the bulls may perhaps aim for a test of 0.8700. Any more gains might send the pair toward the 0.8740 level.
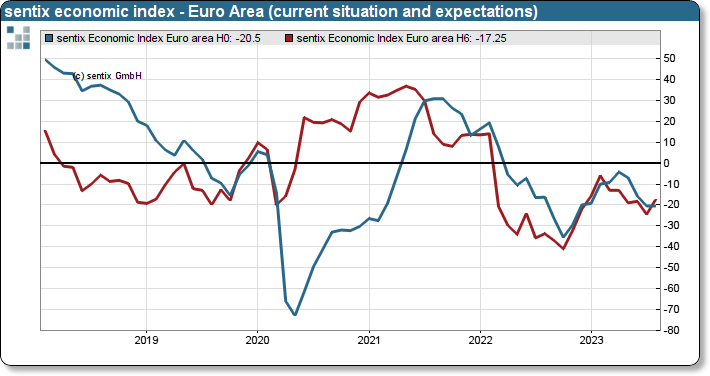
Eurozone Sentix rose to -18.9, but no joy about this development
Eurozone Sentix Investor Confidence rose from -22.5 to -18.9 in August, much better than expectation of -25.0. Current Situation Index was unchanged at -20.5. Expectations Index rose from -24.5 to -17.3. Inflation theme barometer rose to -11, indicating a decline in inflationary pressure. Central bank policy barometer also rose to -13.
Nevertheless, Sentix noted, "Investors are thus by no means positive about economic developments, the expected rate of deterioration is merely easing. Thus, at the beginning of August 2023, the economy in the euro zone remains in recession mode. There can therefore be no joy about this development."
In Germany, Sentix Investor Confidence fell from -28.4 to -30.4, lowest since October 2022. Current Situation Index dropped from -28.0 to -35.3. worst since July 2020. Expectations index rose slightly from -28.8 to -26.0.
Forex and Cryptocurrencies Forecast
EUR/USD: Dollar Bulls Disappointed by NFP
Throughout the past week, leading up to Thursday, August 3, the dollar continued to strengthen its position and build on the offensive that began on July 18. It appears that markets, wary of the global economic condition, have once again turned to the American currency as a safe haven.
Interestingly, the dollar seemed to benefit from Fitch's first downgrade of the long-term US credit rating in 12 years. The agency reduced the rating by one notch from the highest AAA to AA+, a move that seems more of a reputational hit than a trigger for market collapse. However, in such situations, investors tend to shed the weakest and most risky assets in their portfolio, opting for more liquid US treasury bonds and the dollar instead. It's worth recalling 2011 when the US rating downgrade by Standard & Poor's triggered a stock market fall and multi-year dollar growth as it turned out that other countries were in even worse conditions. The shaky state of high-risk corporate bonds doesn't need to be mentioned, as it is self-evident.
A number of analysts do not rule out the possibility that a similar situation could repeat this time around. The key level of the DXY Dollar Index at 100.0 points could serve as a launching pad for further growth. (Round levels like 80.0 during the periods from 1990 to 1995 and in 2014, and 90.0 from 2017 to 2021 played a similar role.).
The macroeconomic data released last week for the United States proved to be rather mixed. On one hand, the Purchasing Managers' Index (PMI) in the country's manufacturing sector grew month-over-month from 46.0 to 46.4 points, but on the other hand, it fell short of the forecast of 46.8. Conversely, the PMI in the services sector declined from 53.9 to 52.7, against a forecast of 53.0. Despite the index remaining in the recovery zone (above 50), the figures suggest that this sector of the economy is also grappling with the consequences of the Federal Reserve's hawkish policy and decreasing consumer demand. The increase in initial jobless claims from 221K to 227K also put pressure on the dollar.
As for the Eurozone, preliminary data shows that inflation, albeit slowly, is beginning to recede. The Consumer Price Index (CPI) fell from 5.5% to 5.3%, which fully met market expectations. The rate of decline in retail sales volumes also slowed, moving from -2.4% to -1.4%, beating the forecast of -1.7%.
Following such statistics, everything was set to be decided on Friday, August 4. The market was awaiting fresh data from the US labour market, including indicators such as wage levels, unemployment rates, and Non-Farm Payrolls (NFP): the number of new jobs created outside the agricultural sector. These figures play a special role as the state of the labour market, alongside inflation, influences the Federal Reserve's decisions regarding future monetary policy.
In the end, the figures didn't change significantly. However, market participants decided that they were more indicative of a bearish than bullish sentiment for the dollar. The increase in average hourly earnings (month over month) remained at the previous level of 0.4%, the unemployment rate dropped slightly from 3.6% to 3.5% (forecast was 3.6%). The NFP figure also remained relatively unchanged, registering at 187K compared to 185K a month earlier. However, this number fell short of expectations of 200K.
The NFP is a key barometer of potential cooling in the US economy. A decline in NFP suggests that the 'screws' have been tightened too much, the economy is stagnating, and perhaps further tightening of monetary policy needs to be paused. At the very least. Or maybe it's time to end the cycle of monetary restriction altogether. This logic drove the DXY down and pushed EUR/USD up. As a result, the pair ended the five-day period at a mark of 1.1008.
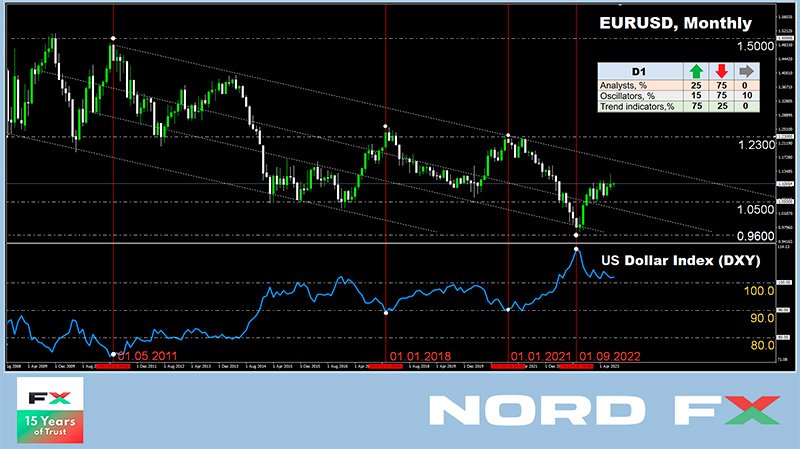
As for the near-term prospects, at the time of writing this review on the evening of August 4, only 25% of analysts voted for the pair's growth and further dollar weakening, with 75% taking the opposite stance. The picture is similar among the oscillators on D1: 75% point south (15% are in the oversold zone), 15% point north, and 10% are in the neutral zone. The trend indicators present the opposite situation: 75% recommend buying, and the remaining 25% recommend selling.
The pair's nearest support is located around 1.0985, then 1.0945, 1.0895-1.0925, 1.0845-1.0865, 1.0780-1.0805, 1.0740, 1.0665-1.0680, and 1.0620-1.0635. The bulls will meet resistance around 1.1045, then 1.1090-1.1110, 1.1150-1.1170, 1.1230, 1.1275-1.1290, 1.1355, 1.1475, and 1.1715.
We've already mentioned that the state of the labour market and inflation are the defining factors for Central Banks' monetary policy formation. While we received plenty of statistics on the former last week, the coming week will bring data on the latter. On Monday, August 8, we'll find out what's happening with inflation in Germany, and on Thursday, August 10th, the US Consumer Price Index (CPI) values will be made public. Also, on this day, unemployment statistics in the US will be released. To round off the work week, on Friday, August 11, another important inflation indicator, the US Producer Price Index (PPI), will be revealed.
GBP/USD: Was the BoE Right or Wrong?
The intrigue regarding how much the Bank of England (BoE) would raise the key interest rate on August 3, by 50 or 25 basis points (bps), ended in favour of a more cautious step. The rate increased from 5.00% to 5.25%, returning the GBP/USD pair to the zone of five-week lows, with the local bottom found at the level of 1.2620.
Economists at Commerzbank commented on the decision by the British regulator as follows: "The Bank of England is trying to restore its authority," they write. "However, it is still unclear how successful it will be." Commerzbank believes that the BoE's decision to slow the pace of rate hikes, based only on the fact that June's inflation surprised with a smaller figure, does not necessarily indicate that the Central Bank has changed its overall approach. "If inflationary conditions in the UK continue to improve," the bank's economists believe, "the current rate decision may turn out to be adequate. But if the June inflation report turns out to be an isolated case, then the Bank of England will most likely seem too hesitant again, which will put pressure on the pound.".
In June, the Consumer Price Index (CPI) in the United Kingdom decreased from 8.7% to 7.9% (with a forecast of 8.2%). However, inflation in the country remains the highest among developed nations. Considering that it significantly exceeds the target benchmark of 2%, the British regulator, according to some experts, will still have to maintain a more active stance and continue raising the rate, despite the growing risks of recession.
After the fall of DXY due to disappointing labour market data in the US, GBP/USD ended the week at 1.2748. The median forecast of experts for the near future looks quite neutral. Bears were backed by 45%, bulls by 30%, and the remaining 25% preferred to abstain. Among the oscillators on D1, 10% are coloured green, 15% are neutral grey, and 75% are red (a quarter of them signal oversold). The ratio of green and red for trend indicators remains 50% to 50%, as a week ago. If the pair moves south, it will encounter support levels and zones at 1.2675-1.2695, 1.2575-1.2600, 1.2435-1.2450, 1.2300-1.2330. 1.2190-1.2210, 1.2085, 1.1960, and 1.1800. In case of the pair's growth, it will meet resistance at the levels of 1.2800-1.2815, then 1.2880, 1.2940, 1.2980-1.3000, 1.3050-1.3060, 1.3125-1.3140, 1.3185-1.3210, 1.3300-1.3335, 1.3425, 1.3605.
It's noteworthy that the UK's GDP data is set to be released on Friday, August 11, offering some insight into the country's economic health. However, you can expect more significant volatility in the exchange rate on Thursday, August 10, when the U.S. inflation (CPI) data will be published. These economic indicators wield a significant influence on the exchange rate, and will be closely scrutinized by traders and investors. The outcome could potentially influence the Bank of England's future monetary policy decisions and, in turn, impact the value of GBP/USD.
USD/JPY: Inflation Decides Everything
During the first half of the week, the yen, like other currencies in the DXY basket, retreated under the pressure of the dollar, and the USD/JPY pair reached a high of 143.88. However, then the Bank of Japan (BoJ) came to the aid of the national currency.
We reported in our last review that for the first time in many years, the new head of the Bank, Kazuo Ueda, decided to turn the rigid targeting of the yield curve into a flexible one. The target level of yield on Japanese 10-year government bonds (JGB) remained the same, 0%. The allowable yield fluctuation range of +/-0.5% was also maintained. But from now on, this limit was no longer to be seen as a rigid boundary but became more flexible. Of course, within certain limits – the Bank of Japan drew a "red line" at the 1.0% level and announced that it would conduct purchase operations to keep the yield from rising above this mark.
And now, less than a week after this revolutionary step for the BoJ, the yield on JGB reached nine-year highs near the 0.65% mark. As a result, the central bank hurried to intervene, and to avoid further growth, it conducted an intervention by buying these securities, thereby supporting the yen.
The Japanese currency received further support on Friday, August 4th, due to weak data on the NFP in the USA. As a result, the week's finish for USD/JPY was at the level of 141.73.
There is no doubt that inflation data will be crucial for central banks and, in turn, for currency markets. At the moment, there is much evidence that inflation in Japan will continue to rise. A few days ago, the country's government recommended a 4% increase in the minimum wage, and spring wage negotiations secured the highest wage growth in the last three decades. Against this backdrop, there is increasing evidence that businesses are ready to pass this growth on to consumers, leading to a rise in the Consumer Price Index (CPI). This trend reflects a willingness among Japanese companies to respond to growing labour costs by increasing prices, potentially fuelling inflation. In turn, this may have an impact on the Bank of Japan's policy decisions and influence the value of the yen in currency markets. The situation clearly highlights the interconnectedness of labour markets, monetary policy, and currency value, and underscores the importance of closely monitoring economic indicators and central bank actions.
To combat rising prices, the Bank of Japan's (BoJ) counterparts in the U.S. and Europe are tightening monetary policy and raising interest rates. Analysts at the Dutch Rabobank are hoping that the BoJ will finally follow suit and gradually move away from its ultra-soft policy. As a result, they anticipate that the USD/JPY exchange rate could return to the 138.00 mark within a three-to-six-month period.
The view of strategists at Japan's MUFG Bank is less optimistic. They write, "Currently, we forecast the first rate hike by the Bank of Japan in the first half of next year. The shift towards tightening BoJ policy supports our forecast of yen strengthening in the coming year." As for the recent change in the yield curve control policy, MUFG believes that it alone is insufficient to cause a recovery of the Japanese currency.
Economists at Germany's Commerzbank and Finland's Nordea Bank agree that if the Japanese regulator manages to tame inflation, the yen's exchange rate should rise. However, changes in the Bank of Japan's policy will not happen quickly. Therefore, according to many specialists, significant shifts can only be expected around 2024.
The various views and forecasts presented highlight the complexity of the economic environment and the challenges of predicting monetary policy changes and currency movements. The situation in Japan is particularly nuanced, given the BoJ's long-standing struggle with deflation and its commitment to an extremely accommodative monetary stance. Market participants and policymakers will need to pay close attention to a range of economic indicators, central bank signals, and global economic trends to navigate the evolving landscape.
As for the analysts' short-term forecast, it offers no clear direction. A third of them believe the USD/JPY pair will move north in the coming days, a third expect it to move south, and the final third anticipate a sideways or "east" movement. The indicators on the D1 timeframe look as follows:
Oscillators: 75% are coloured green, and 25% are neutral grey. Trend indicators: The greens have a clear advantage, with 85%, and the reds account for only 15%.
The nearest support level is positioned at 141.40, followed by 140.60-140.75, 139.85, 138.95-139.05, 138.05-138.30, 137.25-137.50, 135.95, 133.75-134.15, 132.80-133.00, 131.25, 130.60, 129.70, 128.10, and 127.20. The nearest resistance stands at 141.20, then 142.90-143.05, 143.75-144.04, 145.05-145.30, 146.85-147.15, 148.85, and finally, the October 2022 high of 151.95.
Given the divergent opinions of analysts and the varying readings of the technical indicators, market participants should approach this currency pair with caution. A careful examination of upcoming economic data releases, central bank statements, and other fundamental factors could provide additional insights into the likely direction of USD/JPY.
No significant information concerning the Japanese economy is expected in the upcoming week. Traders should be aware that Friday, August 11, is a holiday in Japan, as the country observes Mountain Day.
CRYPTOCURRENCIES: ETH/BTC - Who Will Win?
Last week's crypto review was titled "In Search of a Lost Trigger." Over the past week, the trigger has still not been found. After the decline on July 23-24, BTC/USD moved to another phase of sideways movement, vigorously resisting the strengthening dollar. The surge on August 1-2 to $30,000 looked very much like a bull trap and ended with the pair hesitating and returning to the Pivot Point around $29,200. Digital gold, unlike physical gold, hardly reacted to the publication of labour market data in the US on August 4.
Some analysts believe that the crisis in DeFi is putting additional pressure on Bitcoin, and even predict a significant decline for the leading cryptocurrency in the near future. However, in our view, what they call a "crisis" is not actually one. Everything comes down to the vulnerabilities in early versions of the Vyper programming language, which is used to write smart contracts on which decentralized exchanges (DEX) operate. On July 30, liquidity pools in four pairs (CRV/ETH, alETH/ETH, msETH/ETH, pETH/ETH) using early Vyper versions 0.2.15-0.3.0 were hacked on the Curve Finance exchange. Other pools, the total number of which exceeds two hundred, were unaffected. The total loss amounted to about $52 million.
According to CertiK experts, traders lost digital assets worth $303 million as a result of hacking attacks in July. According to PeckShield data, from January to June 2023, the crypto industry faced at least 395 hacks, resulting in the theft of about $480 million. So, the hacking of Curve Finance is certainly unpleasant, but nothing extraordinary. It's far from the scale of last year's crashes in Terra (LUNA) and FTX.
Perhaps in order to feel more or less at ease, one should not put all their eggs in one basket. This was the message from the CEO of Galaxy Investment Partners, Michael Novogratz, in an interview with Bloomberg. "If an investor was young and took risks calmly, I would advise him to buy Alibaba shares," the billionaire said. "I would also advise investing in silver, gold, bitcoin, and Ethereum. That would be my portfolio."
Novogratz's confidence in bitcoin's future was bolstered after the largest investment company, BlackRock, filed an application for a spot bitcoin ETF. The businessman noted that BlackRock's CEO, Larry Fink, never believed in bitcoin, but has now changed his mind. "Now he says that BTC will be a global currency, and people around the world will trust it. He took the orange pill. He believes in bitcoin," Michael Novogratz stated.
Peter Brandt, a legendary trader and veteran of the financial industry, has also "taken the orange pill." He believes that over time, the first cryptocurrency will "come out of the shadow" of more traditional investment assets, such as stocks and gold, and in the future, it will be bitcoin that sets the tone in the financial market.
Peter Brandt emphasized that U.S. regulators will surely approve the launch of spot bitcoin ETFs. However, in his opinion, this approval will not be news, just as the halving will not be an event. After them, the price of BTC may even go down instead of up. "In 48 years of speculation," Brandt writes, "I have always found that markets take into account events before they happen." Always follow the saying "Buy on the rumour, sell on the fact," advises the Wall Street legend.
Moderate pessimism regarding the consequences of the halving was also expressed by analysts at CME Group. They noted that the demand for crypto assets, which was very strong during the first eight years of bitcoin's existence, has noticeably slowed down over the past five years. Therefore, in their opinion, there is no guarantee that the halving will lead to an appreciation of either BTC or altcoins.
Despite the warnings, many influencers and crypto enthusiasts continue to compete in forecasting how much bitcoin will grow in the coming years. Here are some opinions, sorted in ascending order. An analyst going by the nickname TechDev forecasts the price of BTC by relying on the behaviour of traditional financial markets, including the price of 10-year Chinese bonds, the dynamics of the Dollar Index, as well as the balances of the central banks of major countries, etc. According to him, the coin's rate closely follows the indicators of global liquidity, and the current economic cycle should once again conclude with massive growth in the money supply. Therefore, bitcoin is preparing for growth. In the analyst's view, the logarithmic growth curve indicator, which ignores short-term asset fluctuations, indicates that the leading cryptocurrency will reach a level of $140,000 by 2025.
"I will note that this is a very rough approximation, based on specific parameters of the indicator and the steepness of the momentum," warned TechDev. The analyst also noted that such an indicator as Bollinger Bands is in a very narrow range. The last time bitcoin exited such a range, a full-scale bull trend began.
Next in our top 3 is venture capitalist and billionaire Tim Draper, who stated in an interview with FOX Business that sooner or later, the entire world will embrace the first cryptocurrency. "It's only a matter of time before retailers realize they can save 2% by accepting bitcoin. They don't have to pay banks and credit card manufacturers," he explained. Draper repeated his forecast for the first cryptocurrency's growth to $250,000, predicting this would happen by 2025. (It's worth noting that the investor had already mentioned this price back in 2018, though at that time he referred to 2022 as the "Hour X." As we can see, the billionaire was mistaken.)
And finally, the gold step of the podium of honor this time goes to BitMEX co-founder Arthur Hayes. He published an article in which he forecasted the flagship cryptocurrency's surge to $760,000. In his opinion, the integration of Artificial Intelligence (AI) projects into the BTC blockchain will sharply increase the coin's appeal as a foundational asset of the ecosystem.
Hayes believes that ethereum should demonstrate a similar development model. If AI-based projects are integrated into this altcoin, the investment attractiveness of ETH, the main transaction instrument in the network, will sharply intensify. In this case, the altcoin may appreciate by 1,556%. In other words, the BitMEX co-founder does not rule out that ETH may soar to $31,063.
Another factor stimulating the growth of ETH over the next five years, according to Hayes, will be the expansion of the decentralized finance (DeFi) market. Most protocols of this ecosystem are based on ethereum, and their popularity continues to grow. An increase in the number of users of decentralized exchanges (DEX) will lead to a growth in transaction volumes with ETH and, consequently, to a rise in the price of the altcoin.
A survey was conducted among industry experts on the financial platform Finder to assess the future prospects of ethereum. The experts forecasted that ETH would be valued at an average of $2,400 by the end of 2023. They also predict that the price of ethereum will reach $5,845 by the end of 2025, and $16,414 by the end of 2030. It's worth noting that 56% of the experts believe that now is the most opportune time to buy ETH, while 41% advise holding the cryptocurrency, and a mere 4% recommend selling it.
PwC, the world's second-largest consulting firm, conducted a survey involving representatives from both cryptocurrency and traditional hedge funds. 93% of those surveyed believe that the market has already hit bottom, and they expect the cryptocurrency market to grow by the end of 2023. Among cryptocurrencies, they continue to favour bitcoin and ethereum. However, 72% think that ethereum has no chance of ever surpassing bitcoin in market capitalization. Of the remaining 28% who believe in the altcoin's victory, the majority expect that it will occur within the next 2 to 5 years.
A recent report from CME Group showed that ETH/BTC exhibits almost zero correlation with changes in interest rates, gold futures, and crude oil. However, it is significantly influenced by factors such as the strength of the dollar, changes in the market supply of bitcoin, and the dynamics of technology company stocks. The research indicates that ETH is more vulnerable to the strength of the USD, and changes in BTC supply have more influence on ETH/BTC than changes in ETH supply. At the same time, ETH often grows relative to BTC on days when technology company stocks (S&P 500 and Nasdaq-100 Tech indices) are on the rise.
As of the time of writing this overview, on the evening of Friday, August 4, BTC/USD is trading around $28,950, ETH/USD is around $1,820, and ETH/BTC is at 0.0629. The total market capitalization of the crypto market continues to decline and stands at $1.157 trillion ($1.183 trillion a week ago). The Crypto Fear & Greed Index remains in the Neutral zone at a mark of 54 points (52 points a week ago).
Gold Glides Lower; Has the Summer Lull Taken Over?
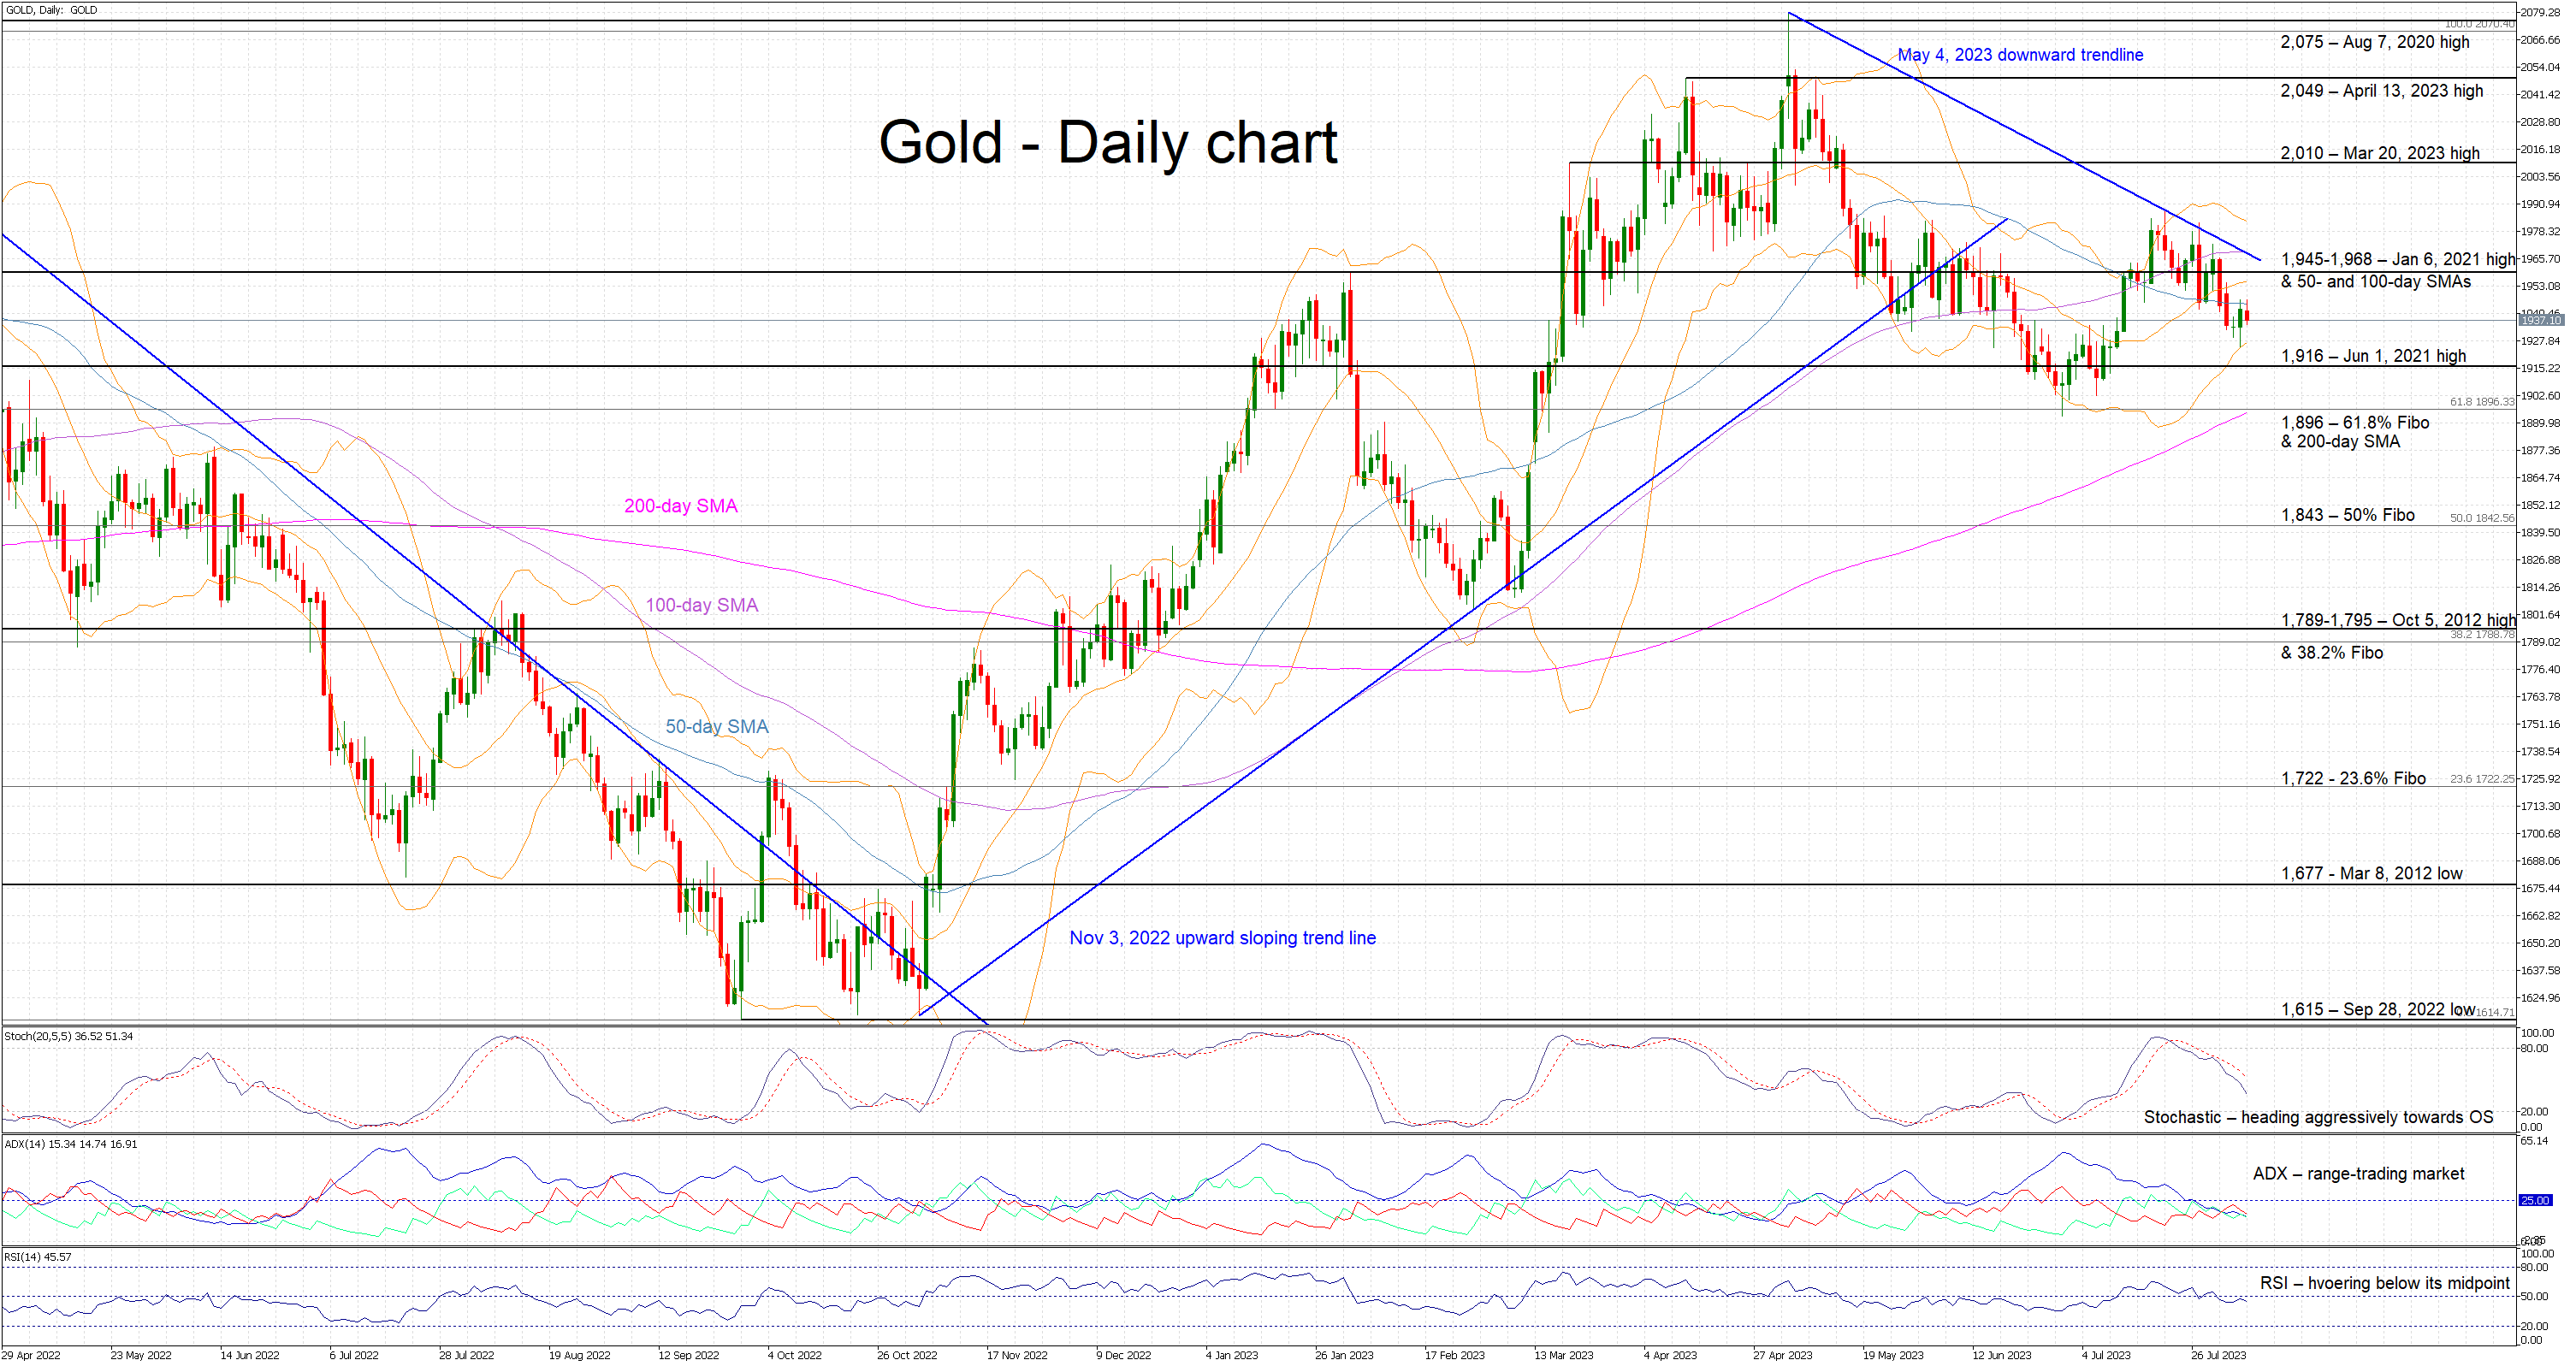
Gold is trading lower today, a tad below its 50-day simple moving average (SMA). Gold has actually been on a downward path since the May 4, 2023 high of 2,079 with the bears most likely trying to achieve a new low, below the June 29, 2023 trough of 1,893, and hence continue the recent bearish series of lower lows and lower highs.
The momentum indicators are still mostly on the bears’ side. The RSI is hovering below its midpoint again, and the stochastic oscillator is aggressively moving lower, building a good gap from its moving average. The stochastic appears determined to reach its oversold territory, where it can stay for a while before making a comeback. On the flip side, the Average Directional Movement Index (ADX) seems far less excited with the recent move as it is trading well below its 25-threshold and thus pointing to a trendless market.
Should the bears decide to push the gold price even lower, they would quickly try to break the June 1, 2021 high at the 1,916 level. If successful, they would be able to record a new 5-month low, provided that they overcome the support set by the much busier 1,896 level defined by the 61.8% Fibonacci retracement of March 8, 2022 – September 28, 2022 downtrend and the 200-day SMA respectively.
On the other hand, the bulls are anxiously trying to push Gold above the busy 1,945-1,968 range that is populated by the January 6, 2021 high and the 50-day SMA, and break above the May 4, 2023 downward sloping trendline. They could have the chance of registering a higher high and then set their eyes on a higher prize, the 2,000 threshold.
To sum up, with ample support from momentum indicators the bears are carefully pushing gold lower. However, a more vigorous move is needed to overcome the key support area at 1,916 and gradually open the door for the 1,900 area.
EUR/AUD Daily Outlook
Daily Pivots: (S1) 1.6677; (P) 1.6723; (R1) 1.6810; More...
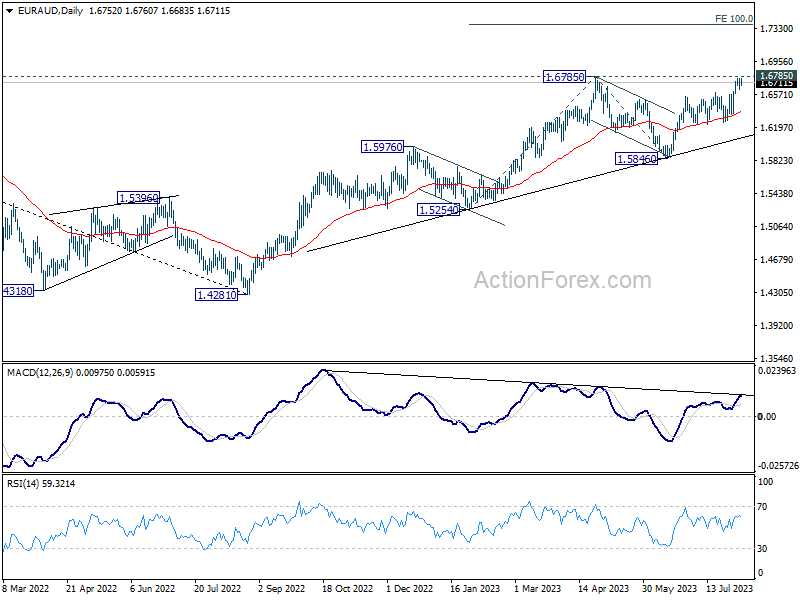
Intraday bias in EUR/AUD remains neutral for the moment, with focus on 1.6785 resistance. Decisive break there will confirm resumption of larger up trend, and target 1.7377 projection level next. On the downside, break of 1.6577 resistance turned support will turn bias back to the downside for 1.6259 support, to extend the corrective pattern from 1.6785.
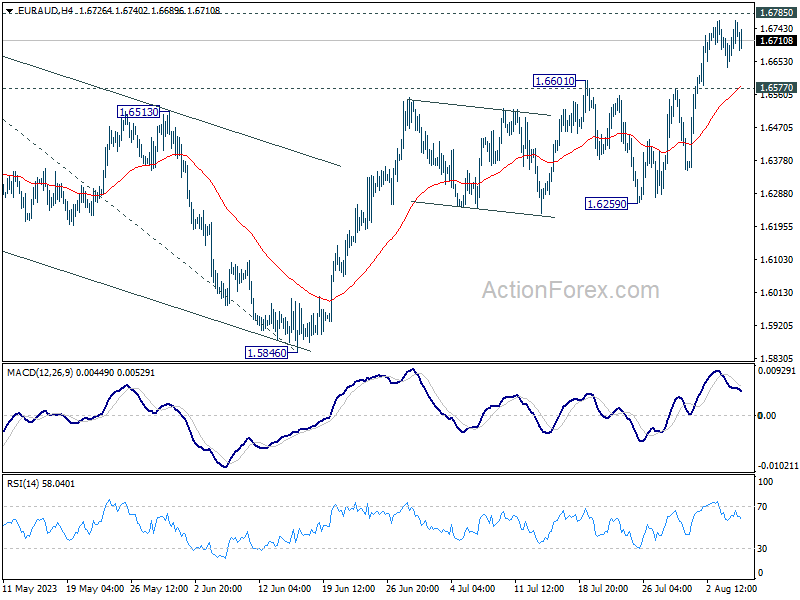
In the bigger picture, the rise from 1.4281 (2022 low) is in progress. Firm break of 1.6785 will confirm resumption for 100% projection of 1.5254 to 1.6785 from 1.5846 at 1.7377. For now, outlook will stay bullish as long as 1.5846 support holds, even in case of another pull back.
EUR/GBP Daily Outlook
Daily Pivots: (S1) 0.8609; (P) 0.8628; (R1) 0.8656; More...
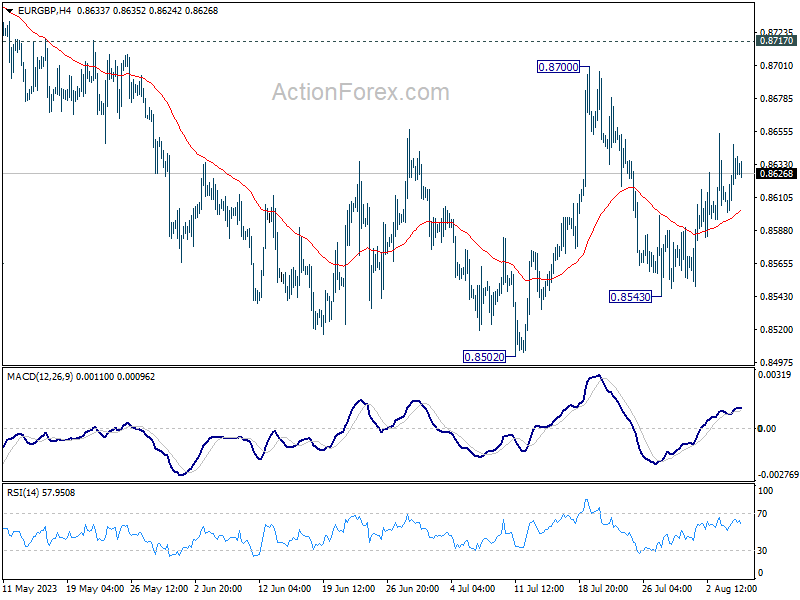
Intraday bias in EUR/GBP remains neutral for the moment as sideway trading continues. On the downside, below 0.8543 will target a test on 0.8502 low. Decisive break there will resume larger decline from 0.8977. On the upside firm break of 0.8717 resistance will suggest larger reversal and target 0.8874 resistance next.
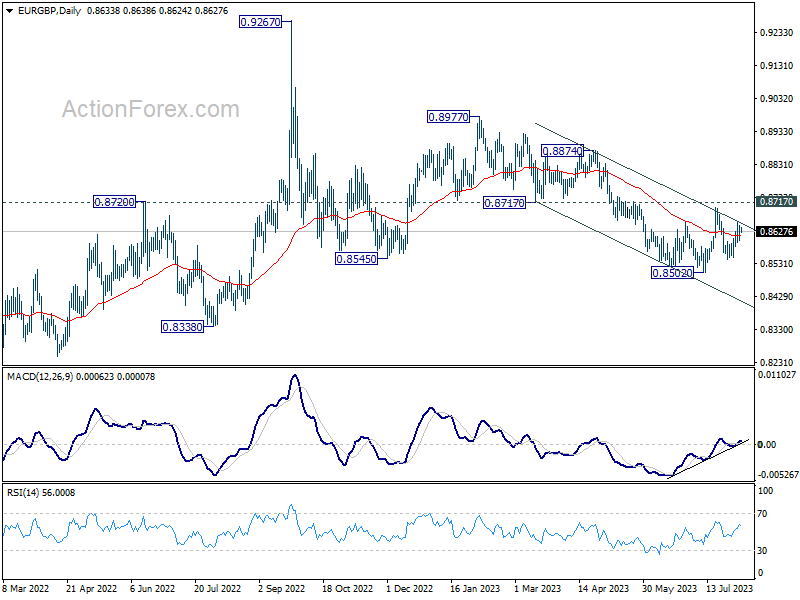
In the bigger picture, the down trend from 0.9267 (2022 high) is seen as part of the long term range pattern from 0.9499 (2020 high). Firm break of 0.8717 support turned resistance will argue that it has completed with three waves down to 0.8502. Further break of 0.8977 will bring retest of 0.9267 high. Nevertheless, rejection by 0.8717, followed by break of 0.8502 will resume the decline towards 0.8201 (2022 low).
EUR/JPY Daily Outlook
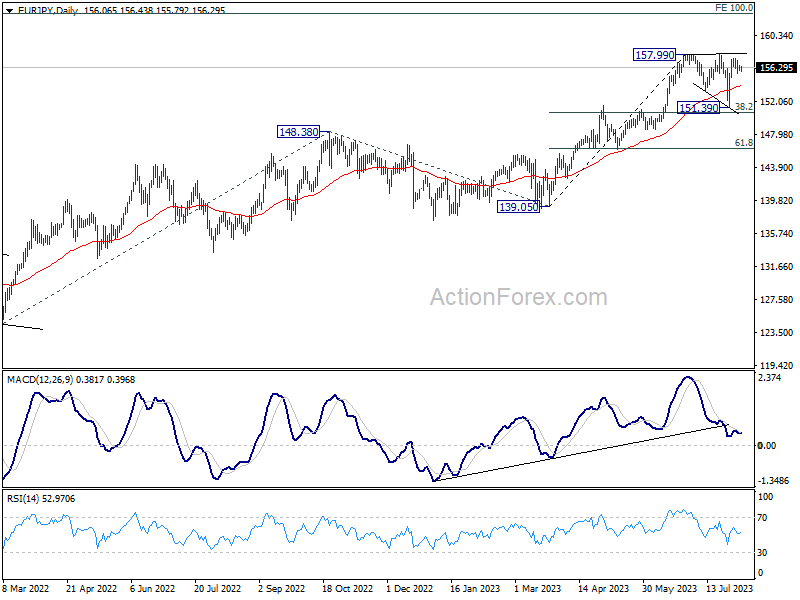
Daily Pivots: (S1) 155.80; (P) 156.21; (R1) 156.53; More....
Intraday bias in EUR/JPY remains neutral at this point. On the upside, decisive break of 157.99/158.03 will resume larger up trend to 162.82 projection level next. However, break of 155.10 will extend the corrective pattern from 157.99 with another falling leg instead.
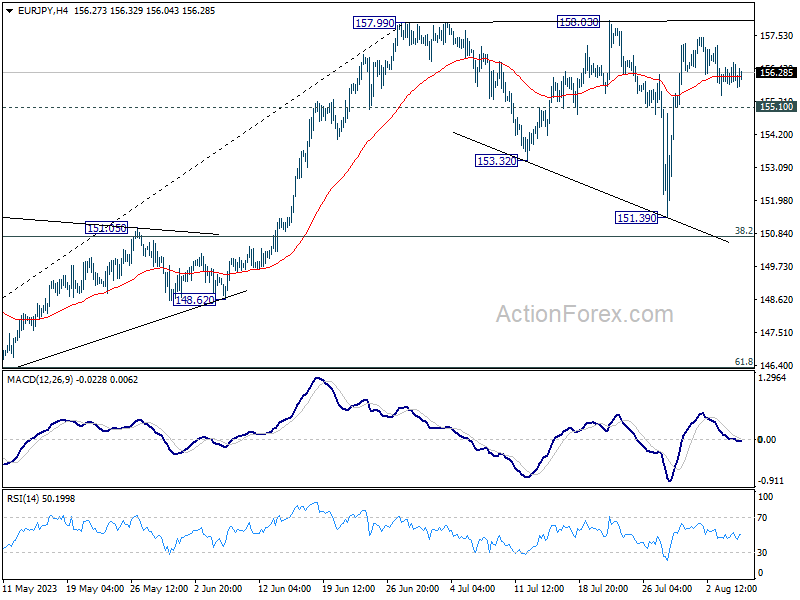
In the bigger picture, as long as 151.60 resistance turned support holds, rise from 114.42 (2020 low) is in progress. On resumption, next target is 100% projection of 124.37 to 148.38 from 138.81 at 162.82. Nevertheless, sustained break of 151.60 will argue that larger correction is already underway. Deeper decline would be seen to 55 W EMA (now at 145.94).
GBP/JPY Daily Outlook
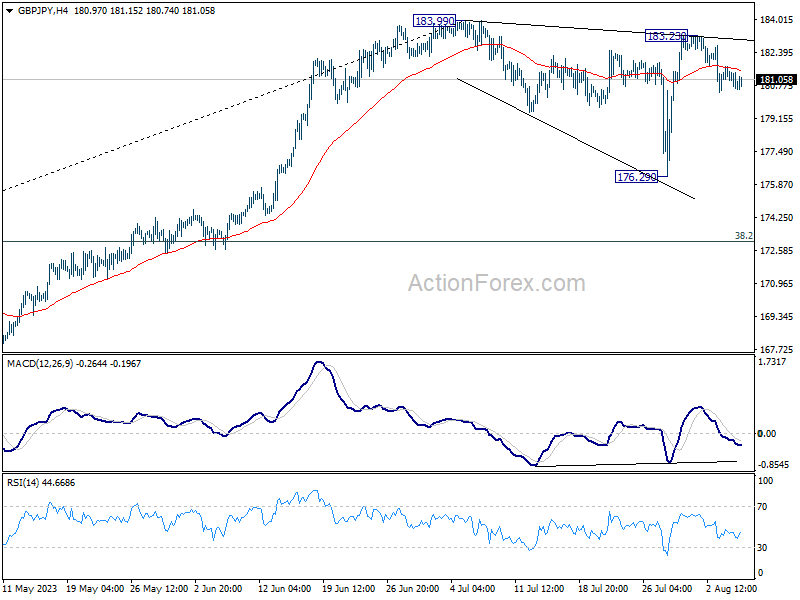
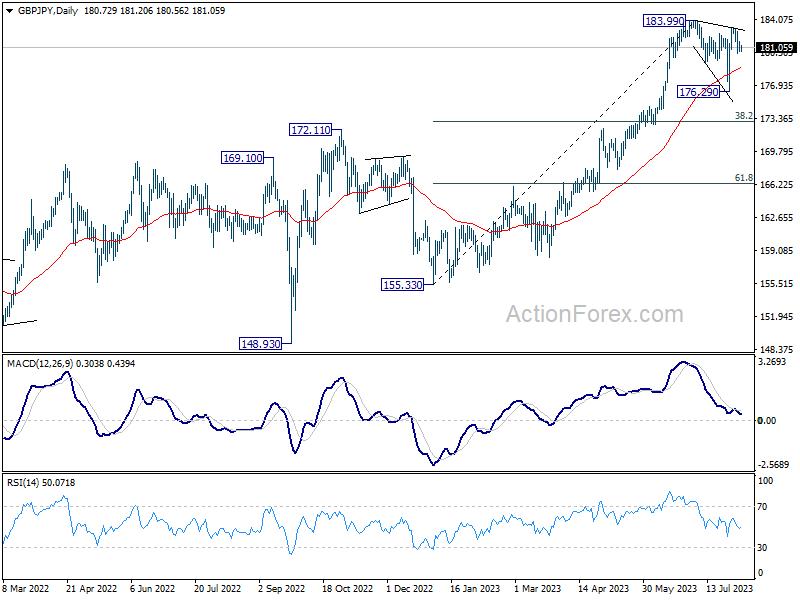
Daily Pivots: (S1) 180.36; (P) 181.05; (R1) 181.45; More...
Intraday bias in GBP/JPY stays mildly on the downside at this point. Fall from 183.23 could be another leg in the corrective pattern from 183.99. Deeper decline would be seen back towards 176.29 support. Nevertheless, on the upside, decisive break of 183.99 will resume larger up trend.
In the bigger picture, as long as 172.11 resistance turned support holds, up trend from 123.94 (2020 low) is expected to continue through 183.99 at a later stage, towards 195.86 (2015 high). Nevertheless, firm break of 172.11 will argue that larger correction is already underway.
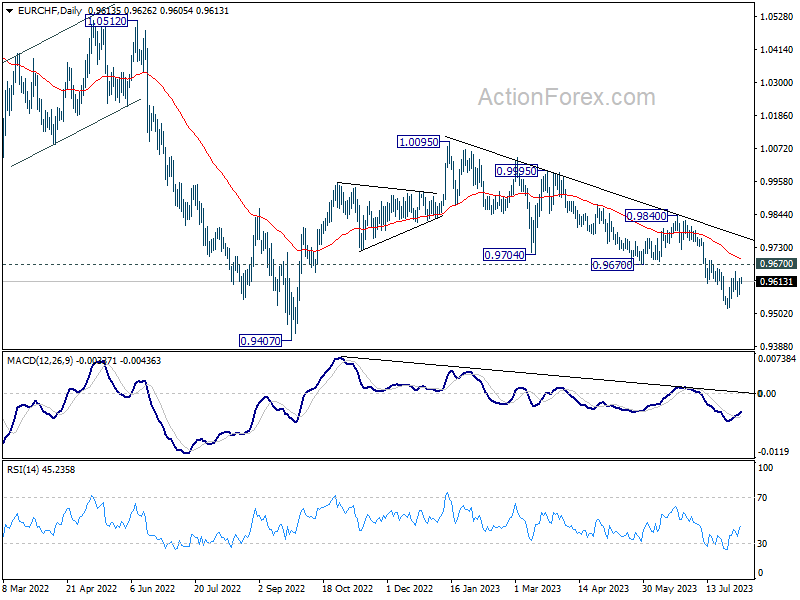
EUR/CHF Daily Outlook
Daily Pivots: (S1) 0.9577; (P) 0.9600; (R1) 0.9632; More...
Intraday bias in EUR/CHF stays neutral at this point. Further decline is in favor as long as 0.9670 holds. On the downside, break of 0.9520 will resume the whole fall from 1.0095 towards 0.9407 low. Nevertheless, sustained break of 0.9670 will be the first sign of bullish reversal and target 0.9840 resistance for confirmation.
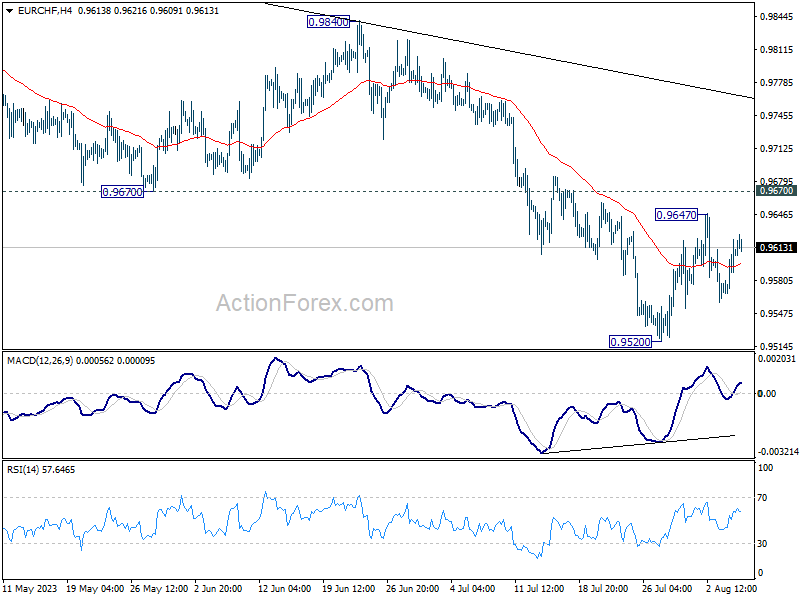
In the bigger picture, medium term outlook is staying bearish as the pair is capped well below falling 55 W EMA (now at 0.9860). Down trend from 1.2004 (2018 high) is in favor to continue. Sustained break of 0.9407 will target 61.8% projection of 1.1149 to 0.9407 from 1.0095 at 0.9018. For now, this will remain the favored case as long as 0.9840 resistance holds, in case of strong rebound.