

Sample Category Title
BoJ opinions: Flexible YCC needed while maintaining monetary easing
In the Summary of Opinions at the July 27-28 meeting, BoJ reinforced its commitment to monetary easing but highlighted a pressing need for more "flexibility" in its yield curve control approach policy.
The bank's primary stance was evident among board members: Achieving a 2% price stability target "has not yet come in sight", necessitating continued monetary easing and the preservation of the current YCC framework.
"There is still a significantly long way to go before revising the negative interest rate policy, and the framework of yield curve control needs to be maintained," one member noted.
However, there will be potential market disruptions by strictly capping 10-year JGB yields at 0.5%, another opinion noted.
Also, given the "increasingly significant upside and downside risks" to prices outlook, flexible YCC is needed for allowing market-driven interest rates, ensuring liquidity, and preventing abrupt rate shifts.
The bank also remarked on the current inflation trends, suggesting they primarily stem from import inflation. A rise in earning power, especially for small and medium-sized firms, was emphasized as crucial before instituting broader YCC flexibility.
At the meeting, BoJ permitted a rise in the 10-year yield beyond its usual 0.5% limit, reaching up to 1%.
Fed Bowman: Additional rate hikes likely needed
Fed Governor Michelle Bowman projected the necessity of further rate hikes during a weekend speech, asserting they are likely needed to push inflation back down to the Fed's 2% target.
Bowman expressed her support for Fed's rate hike in July and stated, "I also expect that additional rate increases will likely be needed to get inflation on a path down to the FOMC's 2 percent target."
However, Bowman was careful to emphasize that Fed policy is "not on a preset course". Further decisions will be based on "incoming data and its implications for the economic outlook," she stated.
She said, "We should remain willing to raise the federal funds rate at a future meeting if the incoming data indicate that progress on inflation has stalled."
While recent lower inflation reading was seen as positive, Bowman asserted the necessity of consistent evidence of inflation moving meaningfully toward the 2% goal when contemplating additional rate hikes and the duration of restrictive federal funds rates.
Dollar Dominates Amid Bond Market Turbulence; Sterling and Commodity Currencies Lag
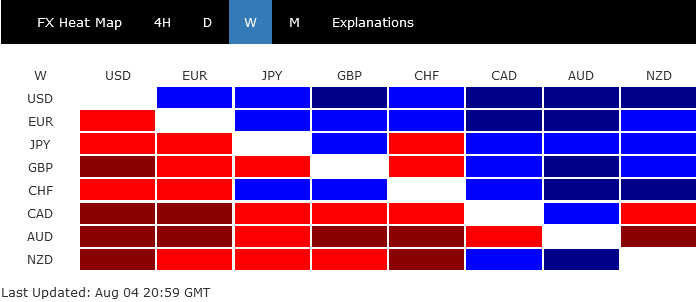
Last week ended with Dollar taking center stage as the best performer, driven by significant turbulence in the bond markets that sent long-end yields sharply higher and provided a mid-week uplift. Although the greenback experienced a notable pullback following non-farm payroll report, it still stands poised for potential further gains, should the selloff in stocks and treasuries continue.
However, the prospects for an extended Dollar rally are laden with uncertainties. The path towards further gains is tethered to a big "if," with market conditions and sentiments being highly fluid. The real reversal in Dollar might materialize only at a later stage after another dip, depending on how market sentiments develop.
Elsewhere in the currency ranks, Euro finished as the second strongest, followed by Swiss Franc and Japanese Yen—a pattern that is not uncommon in a risk-averse environment. On the other side of the spectrum, Sterling was marked as the weakest among the European majors, a status accentuated by the surprising dovish tilt in BoE's rate decision.
Commodity currencies found themselves at the bottom of the performance chart, with Australian Dollar leading the descent. Aussie's fall was notably influenced by RBA's decision to keep interest rates on hold, and the communications that suggested it could be already in a phase of prolonged pause.
Turbulence in US treasury market overshadows heavy data week
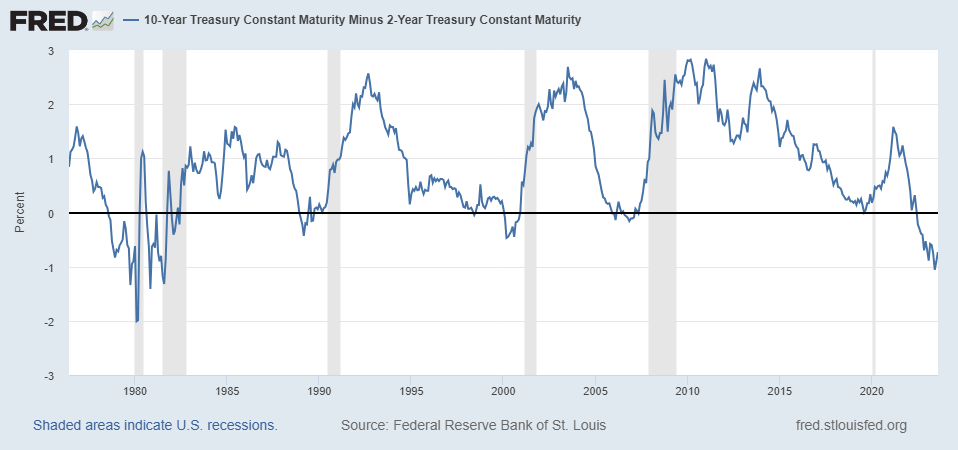
The high volatility in US Treasury somewhat stole the show from heavy data last week. In particular, yields in the long end surged sharply, with 10-year and 30-year yield hitting hitting new highs of the year. More importantly, inversion of 2- and 10-yr yield, once hit the worst level since 1981 in July, reversed notably.
The moves was firstly in reaction to surprised action by Fitch to downgrade US sovereign rating from AAA to AA+, citing "steady deterioration in standards of governance over the last 20 years". Then, bonds were sold off further after US Treasury said it would it would boost its issuance of long-term debt this quarter, in order to fill the growing gap between tax revenue and government spending.
10-year yield hit as high as 4.206 before being knocked down after non-farm payroll report, and at 4.060. But the overall development further affirmed the case that medium term consolidation from 4.333 has completed with three waves down to 3.253. While some retreat could be seen in the near term, there is no threat to the rally from 3.253 as long as 55 D EMA (now at 3.829) holds.
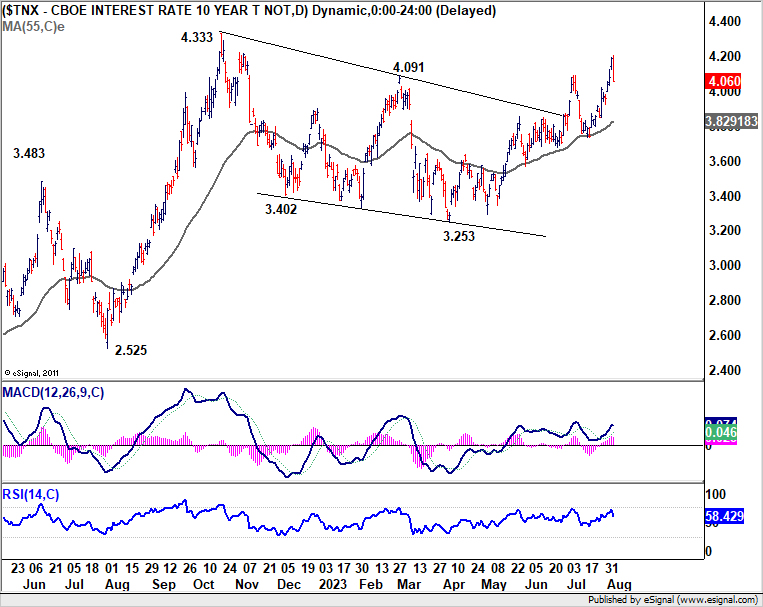
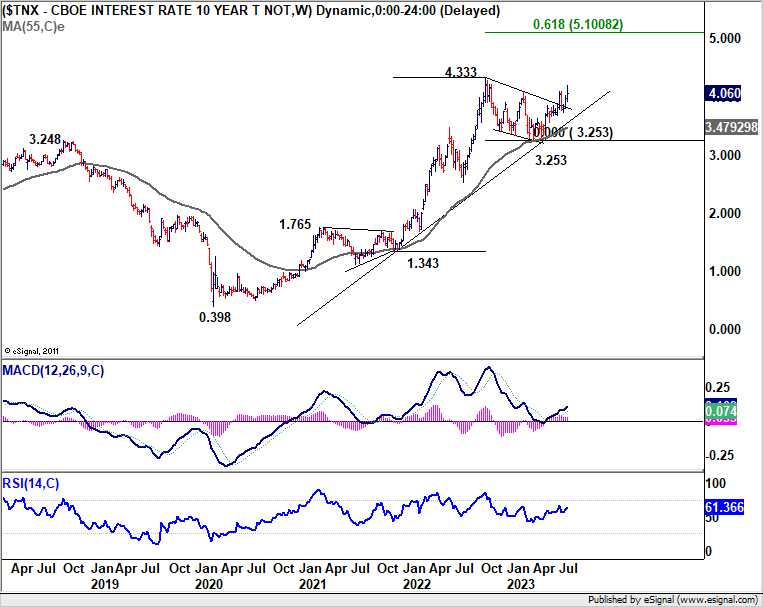
The bigger question is whether current rise represents resumption of the long term up trend from 0.398 (2020 low). If that's the case, firm break of 4.333 would set the stage for TNX to head through 5% handle towards 61.8% projection of 1.343 to 4.333 from 3.253 at 5.100.
An accompanied development was the normalization of US 2- to 10-year yield curve, which reverted back the shallowest level since early June. Increasing expectations that Fed is nearing the peak of the tightening cycle,even if not peaked, will cap yields in the short end. Hence there is prospect of further normalization if selloff in 10-year and 30-year bonds is going to continue in the months ahead.
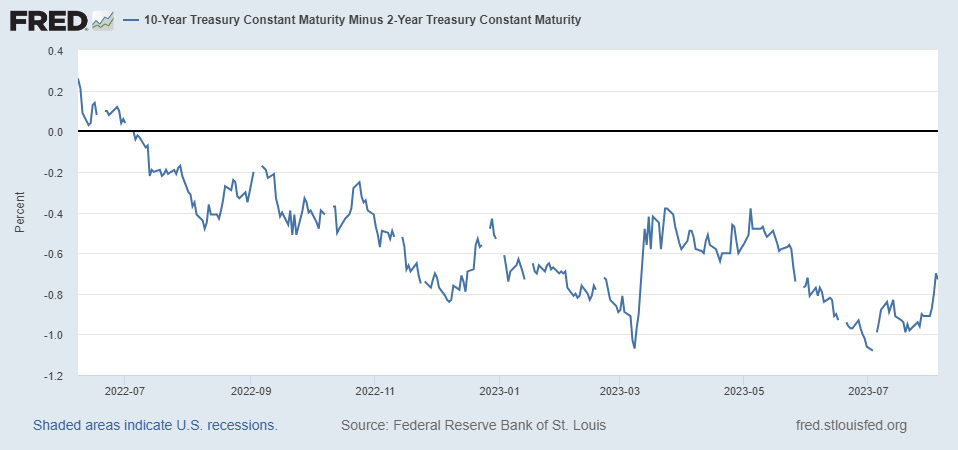
Since the early 90s, the US economy always entered into recession just months after yield curve inversion was fully normalized. That includes relatively brief period of inversion in 2019 and the subsequent short pandemic recession in 2020. Considering the depth and time of the current curve inversion that's not seen until early 80s, it seems that another recession is inevitable ahead, probably just in a matter of months away.
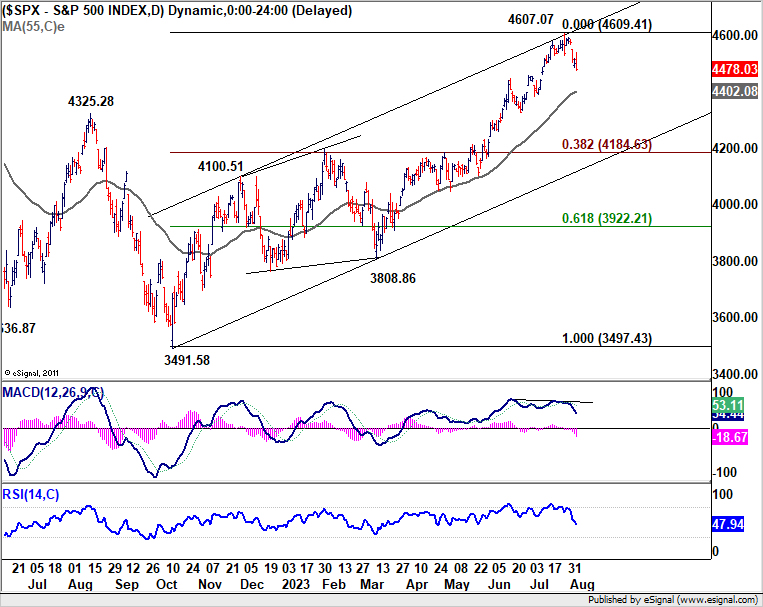
Let's now turn to risk sentiment in the markets. S&P 500 ended -2.27% lower last week, its biggest weekly decline since March 10. A short term top should be formed at 4607.07, considering mild bearish divergence condition in D MACD. Deeper pull back is in favor to 55 D EMA (now at 4402.08).
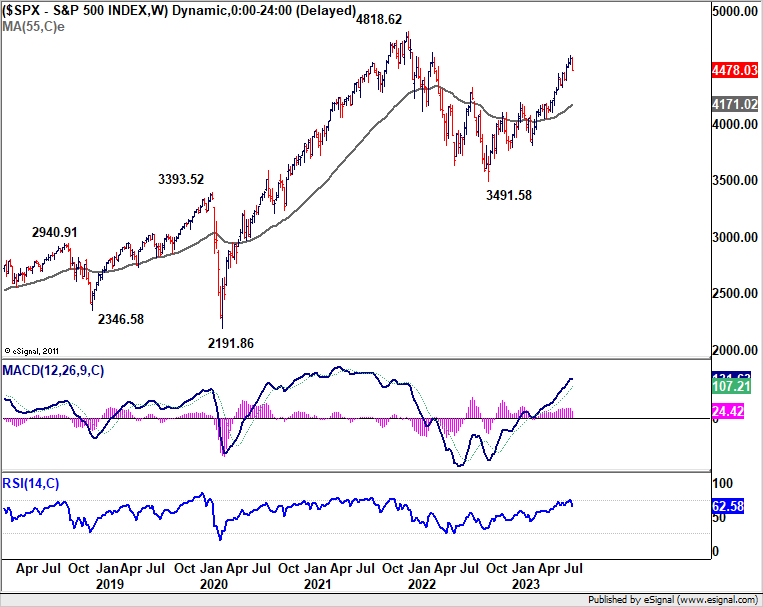
It's premature to predict a bearish trend reversal in S&P 500. However, if the rise from 3491.58 (2022 low) represents the second leg of the pattern from 4818.62 (2022 high), then it's actually about time. Even if SPX could notch another high, it should start to feel heavy as it approaches 4818.62. Indeed, firm break of 55 D EMA (now at 4402.08) would be an important warning of reversal, and would likely bring deeper fall to 55 W EMA (now at 4171.02) at the very least.
So beware that the markets are setting themselves up for an "October Crash", or even a September one.
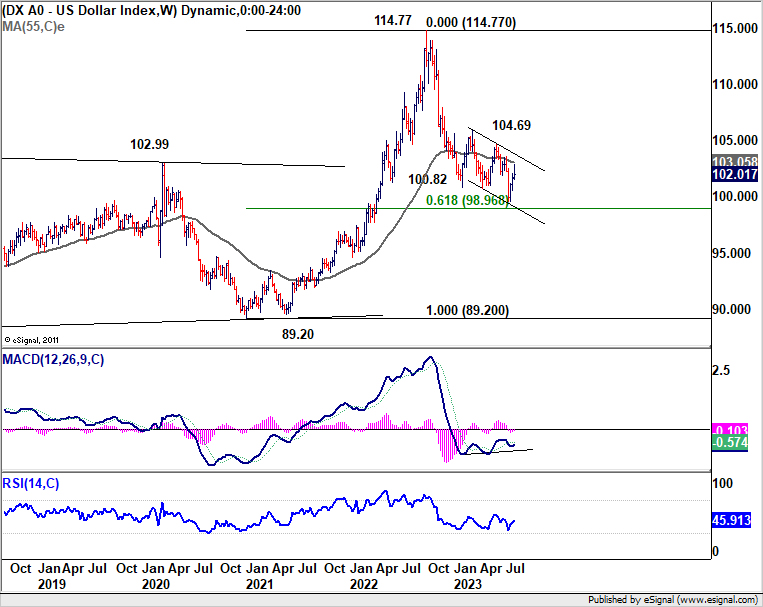
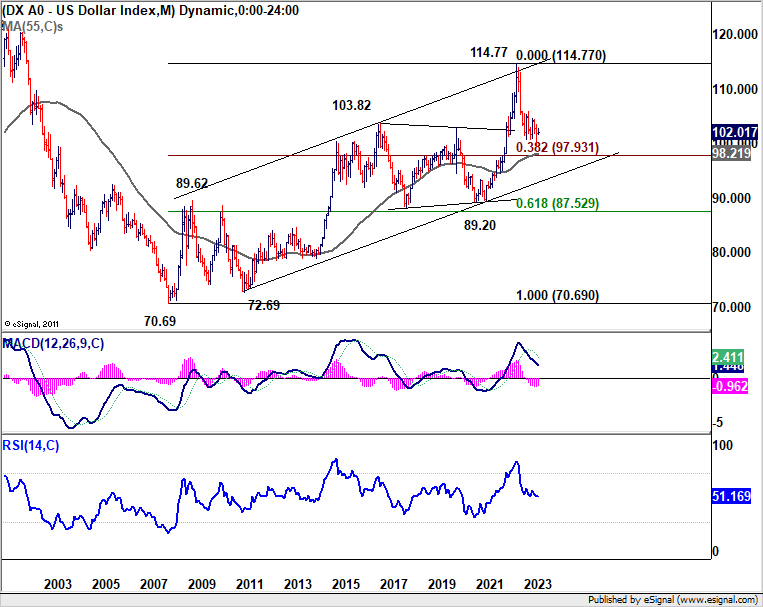
As for Dollar Index, the strong breaks of 101.92 support turned resistance as well as 55 D EMA (now at 102.11) were bullish signals. Yet, the structure and momentum of the rise from 99.57 don't warrant that it's a substantial impulsive move. Nevertheless, further rally will now be mildly in favor as long as 100.55 support holds, towards trend line resistance at around 103.80.
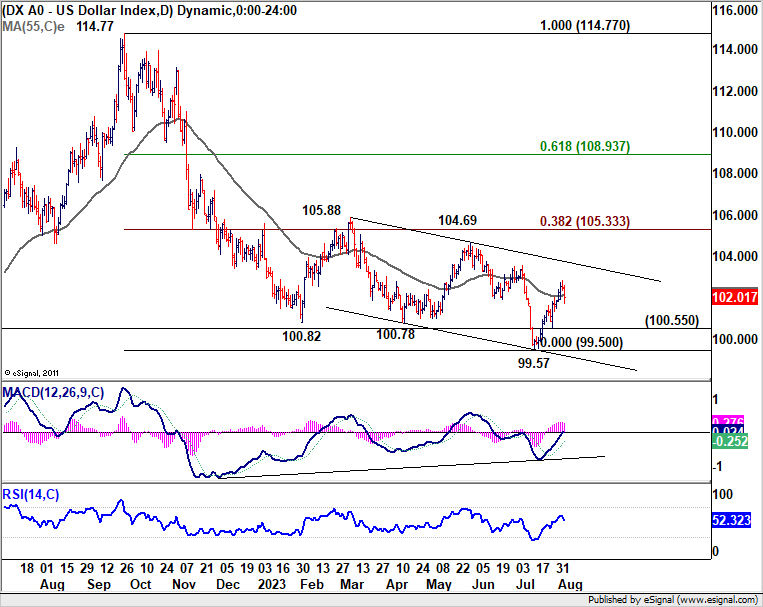
Meanwhile, it should be pointed out that even in case of down trend resumption through 99.57, strong support level is expected at around 98 to contain downside, and bring reversal. This support zone represents 61.8% retracement of 89.20 (2021 low) to 114.77 at 98.96, 55 M EMA at 98.21, and 38.2% retracement of 70.69 to 114.77 at 97.93.
So it's should be just a matter if Dollar is already reversing, or after another fall. That would be subject to developments in bond and stock markets as mentioned above.
Aussie struggles while Sterling pressured, what's next for GBP/AUD?
Australian Dollar concluded as the weakest performer last we, burdened by growing expectations of a prolonged pause after RBA kept interest rates unchanged at 4.10%. Such expectations were reinforced by the quarterly Statement on Monetary Policy, which indicated the central bank's increasing confidence in returning in inflation to the target band without further tightening. Aussie faced additional pressures from risk-off sentiment and reversal in Copper prices.
Sterling emerged as the worst performer among European majors, experiencing a selloff following BoE's 25bps rate hike to 5.25%. The voting wasn't exactly dovish, with two Monetary Policy Committee members advocating for a 50bps hike while a known dove voted for no change. But the communications were probably starting to set up market expectations for a pause. Speculations are now rife that BoE's interest rates may not reach the previously anticipated 6% mark, with potentially only one or two more 25bps hikes in the pipeline.
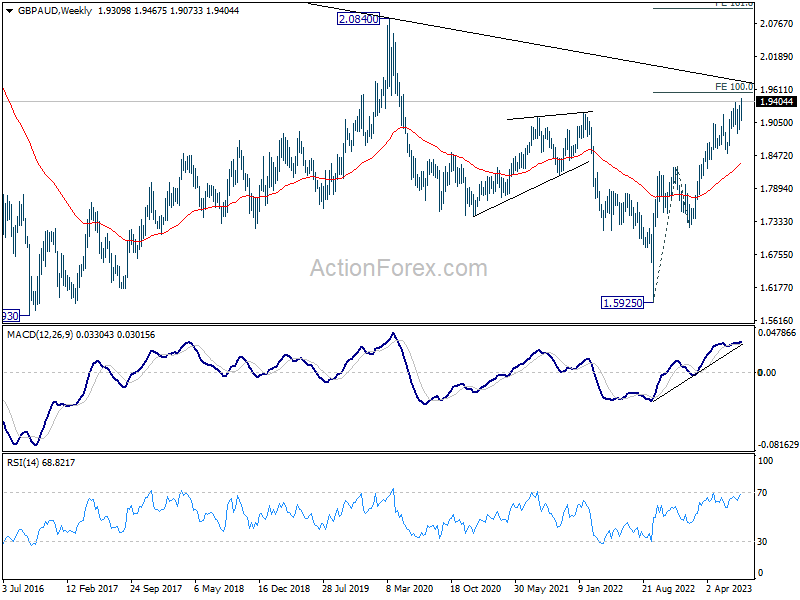
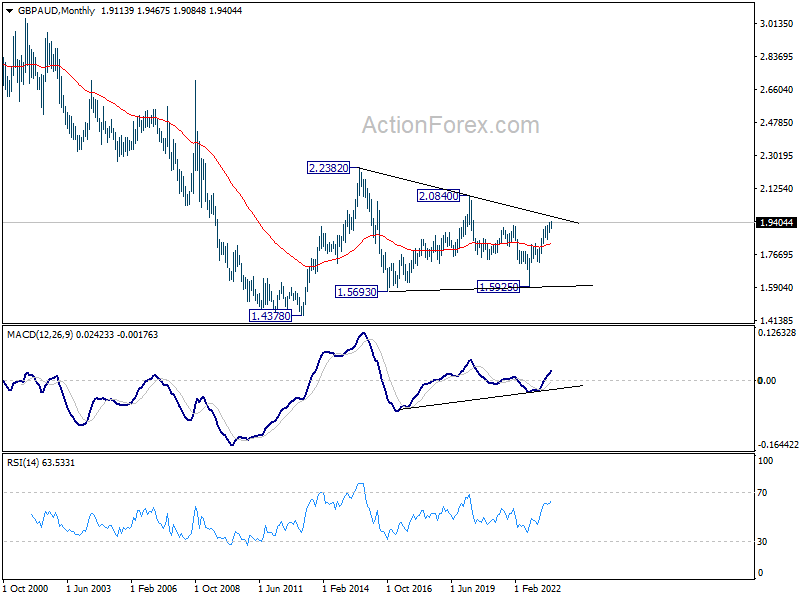
GBP/AUD extended its recent uptrend to 1.9467, but upside momentum seems restrained by bearish divergence condition in D MACD. The cross is now edging closer to the 100% projection of 1.5925 to 1.8272 from 1.7218 at 1.9565, as well as the long-term falling trendline resistance around 1.9766. Consequently, the risk of a correction is starting to loom.
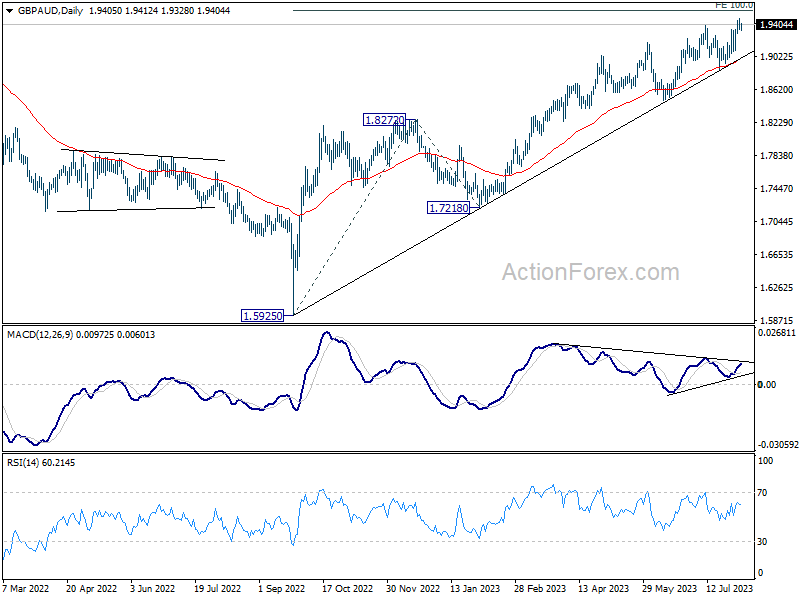
On the downside, break of 1.8847 support level would signal that a medium-term top has formed, potentially leading to a pullback to 55 W EMA (now at 1.8318). If this scenario plays out, it would more likely coincide with a deeper selloff in Sterling across other currency pairs, including against both Dollar and Euro, rather than a solid rebound in Aussie.
USD/CAD Weekly Outlook
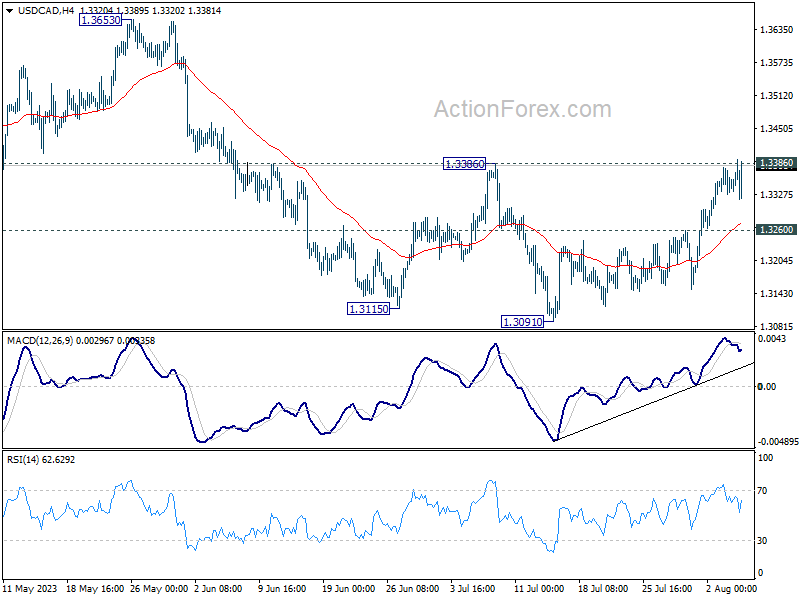
USD/CAD's rebound from 1.3091 extended higher last week and it's now pressing 1.3386 resistance. Sustained break of 1.3386 will argue that whole correction from 1.3976 has completed with three waves down to 1.3091. Further rally would then be seen to 1.3653 resistance next. Nevertheless, rejection by 1.3386, followed by break of 1.3260 minor support, should resume larger decline through 1.3091 low.
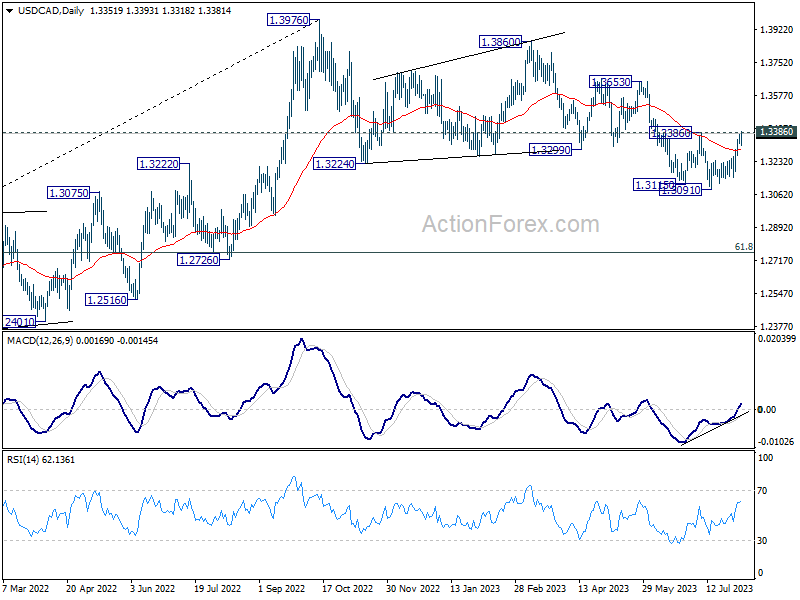
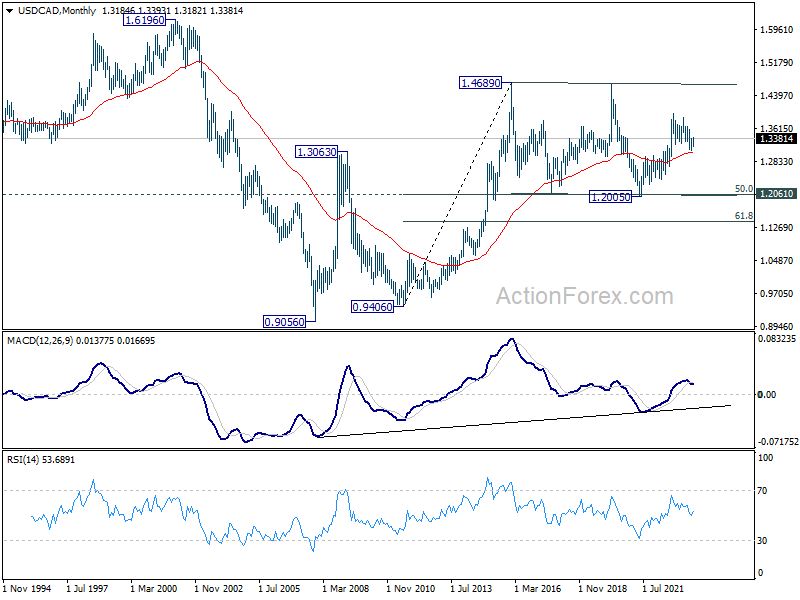
In the bigger picture, price actions from 1.3976 are viewed as a corrective fall only. Upon completion, rise from 1.2005 (2021 low) would resume through 1.3976 towards 1.4667/89 long term resistance zone. In case of another fall, downside should be contained by 61.8% retracement of 1.2005 to 1.3976 at 1.2758.
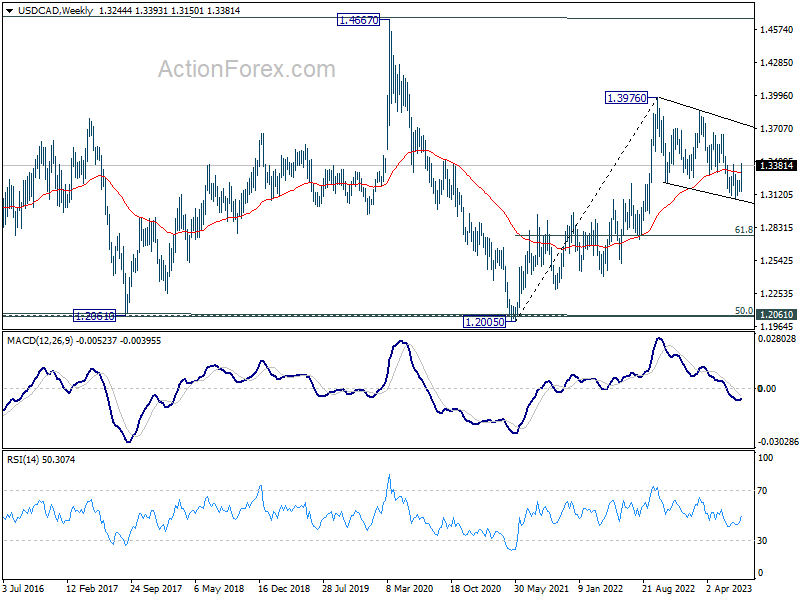
In the longer term picture, price actions from 1.4689 (2016 high) are seen as a consolidation pattern only, which might have completed at 1.2005. That is, up trend from 0.9506 (2007 low) is expected to resume at a later stage. This will remain the favored case as 55 M EMA (now at 1.3057) holds.
EUR/USD Weekly Outlook
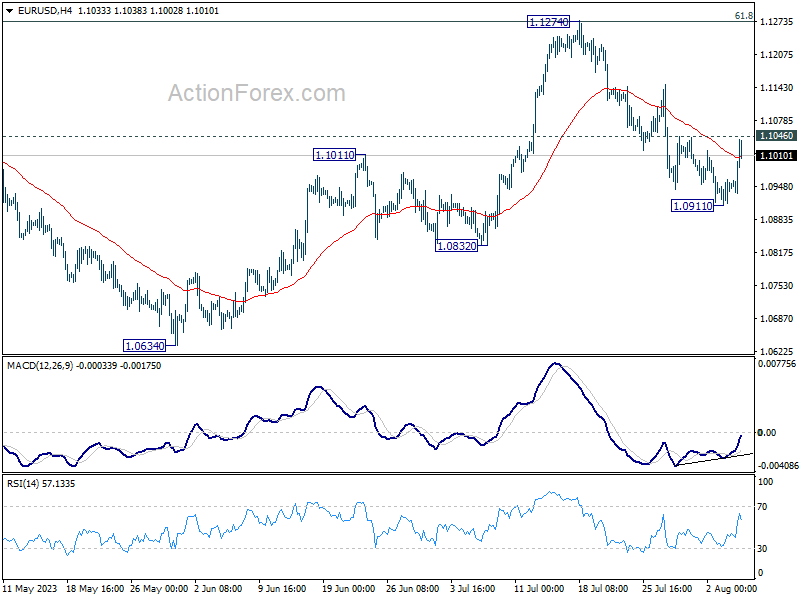
EUR/USD recovered after falling to 1.0911 last week and initial bias stays neutral this week first. On the downside, break of 1.0911 will resume the decline from 1.1274 to 1.0832 support. Sustained trading below there will target 1.0609/34 cluster support. However, firm break of 1.1046 minor resistance will argue that pull back from 1.1274 has completed, and bring stronger rebound.
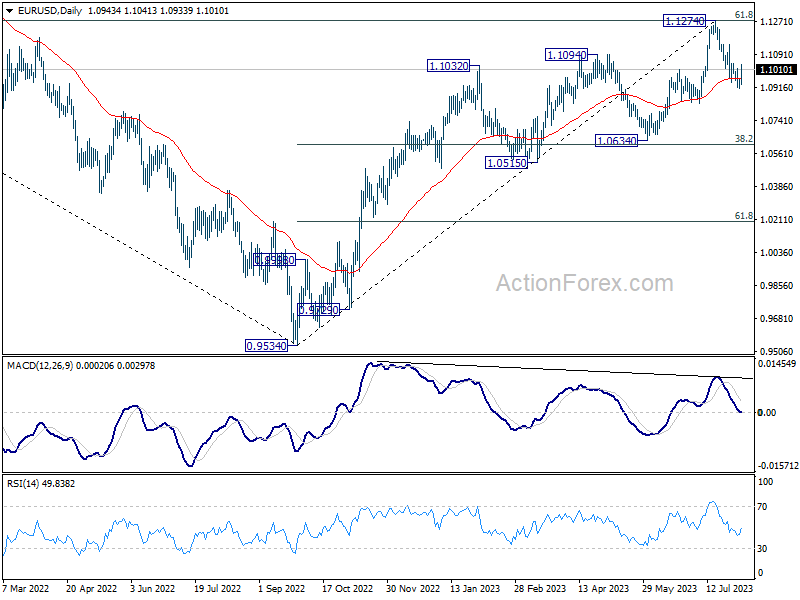
In the bigger picture, a medium term top could be formed at 1.1274, after failing to break through 61.8% retracement of 1.2348 (2021 high) to 0.9534 at 1.1273 decisively, on bearish divergence condition in D MACD. Sustained trading below 55 D EMA (now at 1.0965) will bring deeper correction to 1.0634 cluster support (38.2% retracement of 0.9534 to 1.1274 at 1.0609). Strong support could be seen there, at least on first attempt, to set the range for consolidation.
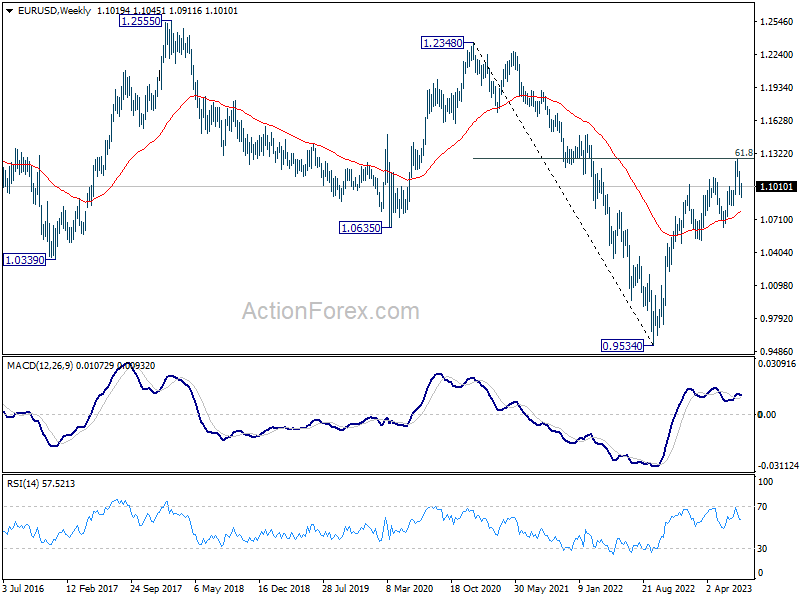
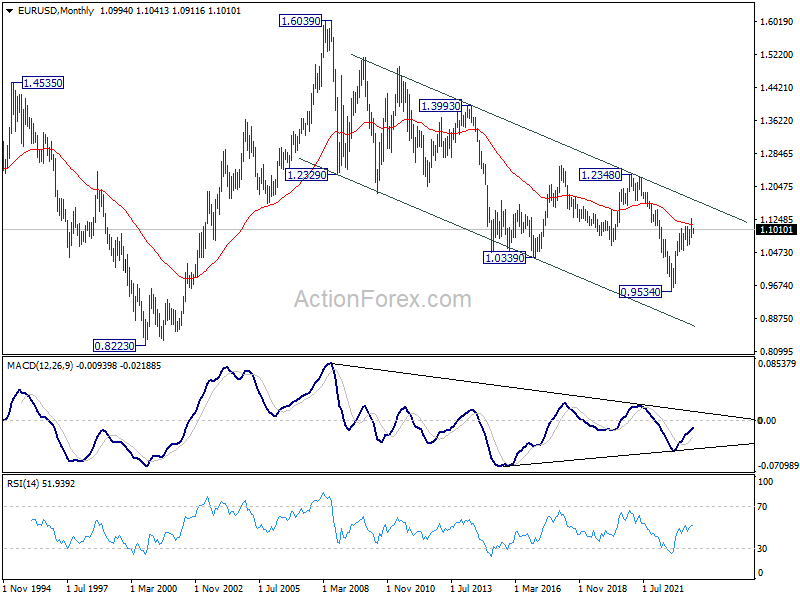
In the long term picture, focus stays on 55 M EMA (now at 1.1132). Rejection by this EMA will revive long term bearishness. However, sustained break above here will be affirm the case of long term bullish reversal and target 1.2348 resistance for confirmation.
USD/JPY Weekly Outlook
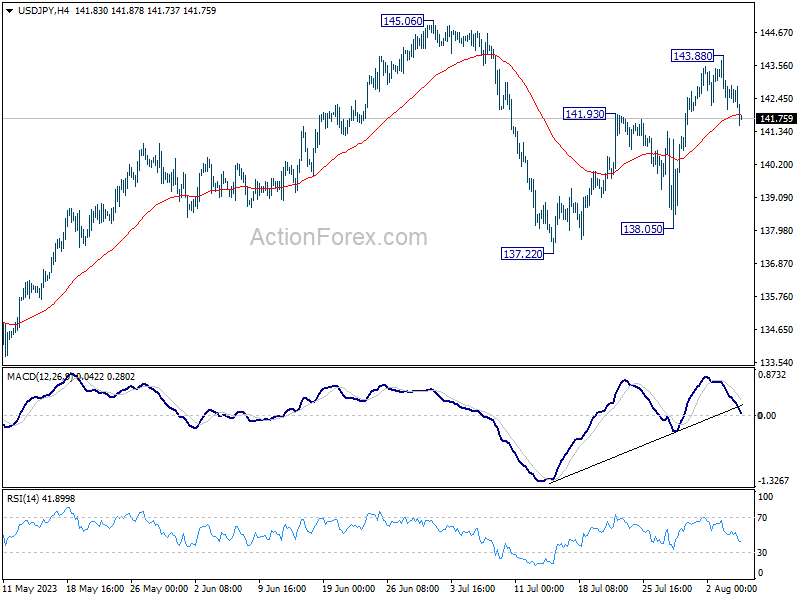
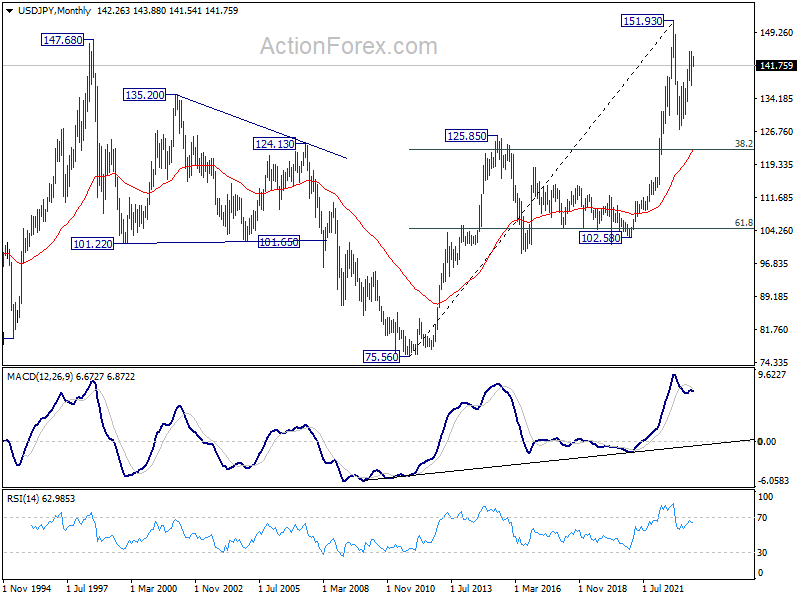
USD/JPY rebounded further to 143.88 last week but reversed since then. The development argues that rise from 137.22 has completed, and fall from 143.88 is probably the third leg of the pattern from 145.06. Initial bias is mildly on the downside this week for 55 D EMA (now at 140.43). On the upside, though, above 143.88 will resume the rise to retest 145.06 resistance instead.
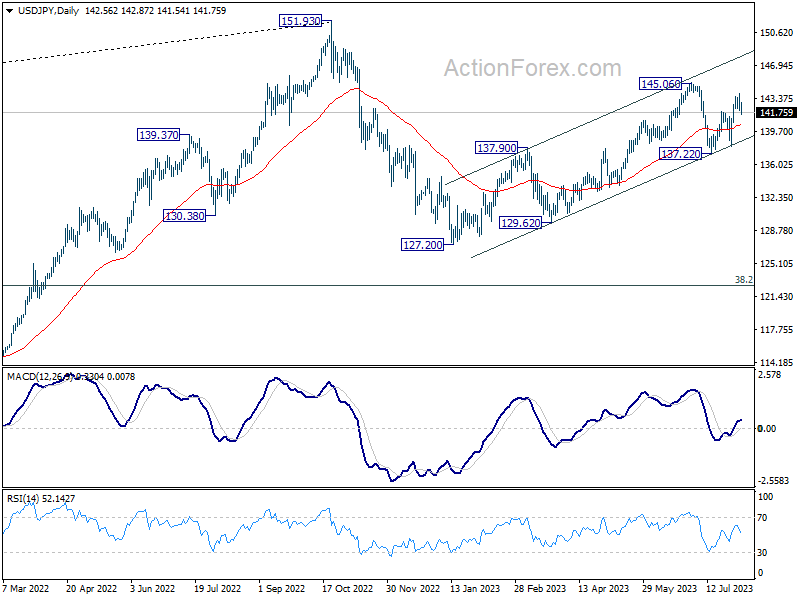
In the bigger picture, overall price actions from 151.93 (2022 high) are views as a corrective pattern. Rise from 127.20 is seen as the second leg of the pattern and could still be in progress. But even in case of extended rise, strong resistance should be seen from 151.93 to limit upside. Meanwhile, break of 137.22 support should confirm the start of the third leg to 127.20 (2023 low) and below.
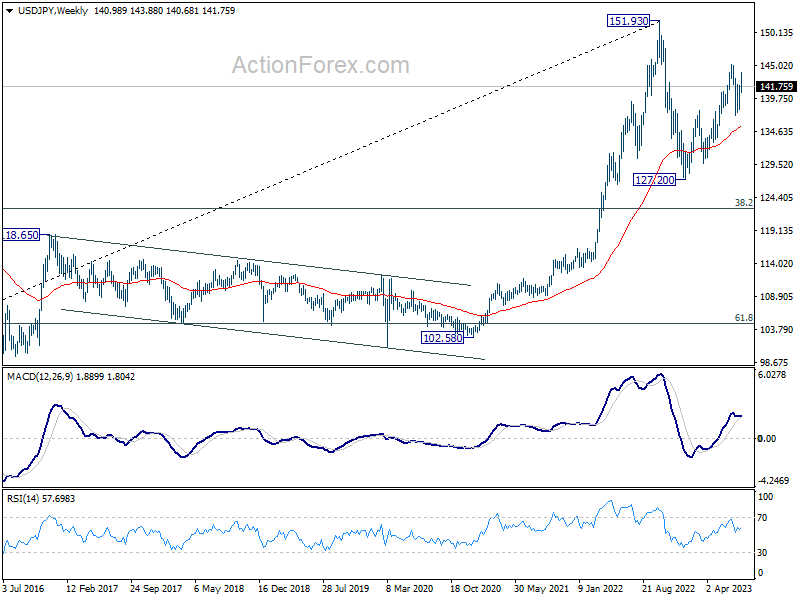
In the long term picture, price action from 151.93 is seen as developing into a corrective pattern to up trend from 75.56 (2011 low). While deeper decline cannot be ruled out, downside should be contained by 38.2% retracement of 75.56 to 151.93 at 122.75.
GBP/USD Weekly Outlook
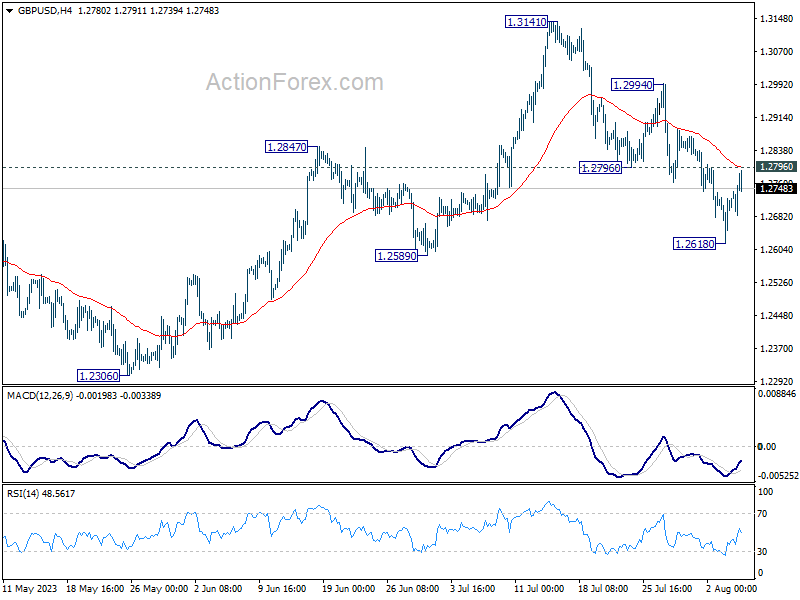
GBP/USD fall further to 1.2618 last week but recovered since then. Initial bias is neutral this week first. On the downside, below 1.2618, and sustained trading below 1.2678 resistance turned support will argue that it's already in a larger correction. Deeper decline would then be seen to 1.2306 support next. Nevertheless, firm break of 1.2796 will indicate that the pull back has completed, and turn bias back to the upside for stronger rebound.
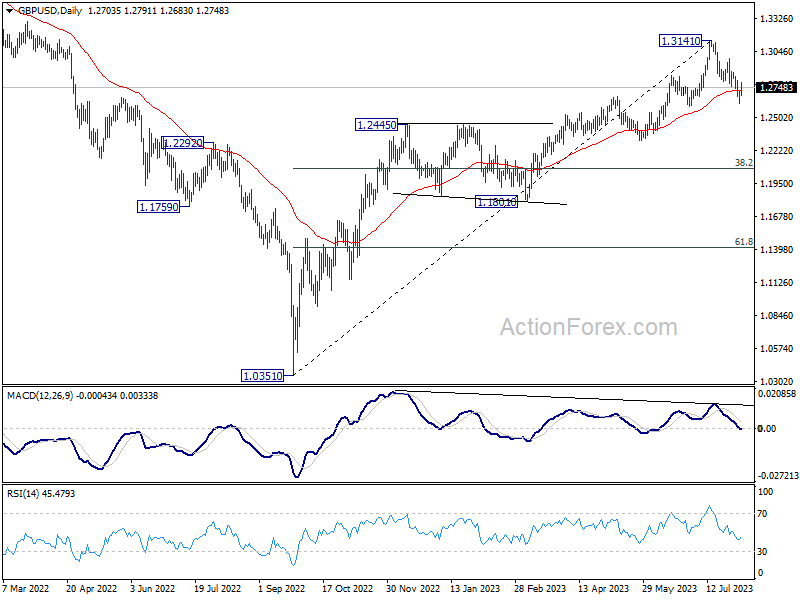
In the bigger picture, a medium term top could be in place at 1.3141 already, on bearish divergence condition in D MACD. Sustained trading below 55 D EMA (now at 1.2724) should confirm this case, and bring deeper fall to 38.2% retracement of 1.0351 to 1.3141 at 1.2075, as a correction to up trend from 1.0351 (2022 low). For now, rise will stay mildly on the downside as long as 1.3141 resistance holds, in case of strong rebound.
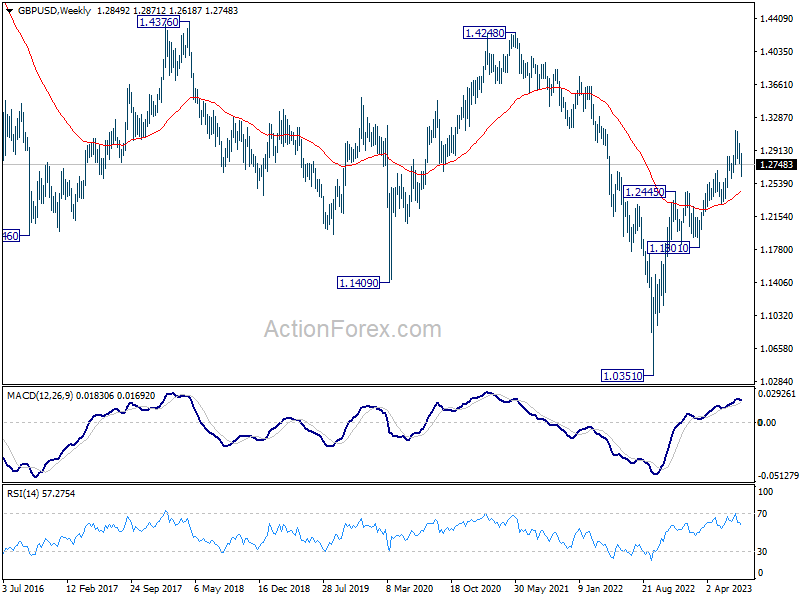
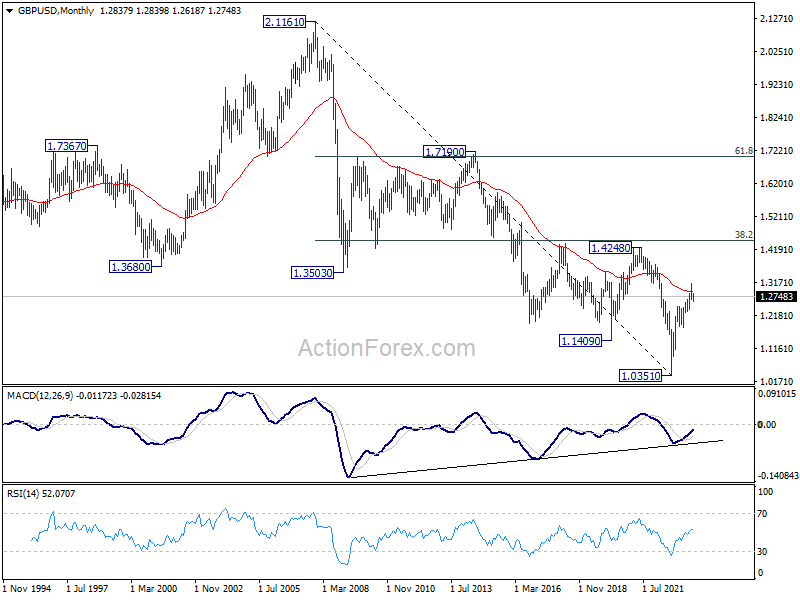
In the long term picture, sustained trading above 55 M EMA (now at 1.2902) will add to the case of long term bullish reversal, and target 1.4248 cluster resistance (38.2% retracement of 2.1161 (2007 high) to 1.0351 at 1.4480) for confirmation. Nevertheless, rejection by 55 M EMA will maintain long term bearishness for downside resumption at a later stage.
USD/CHF Weekly Outlook
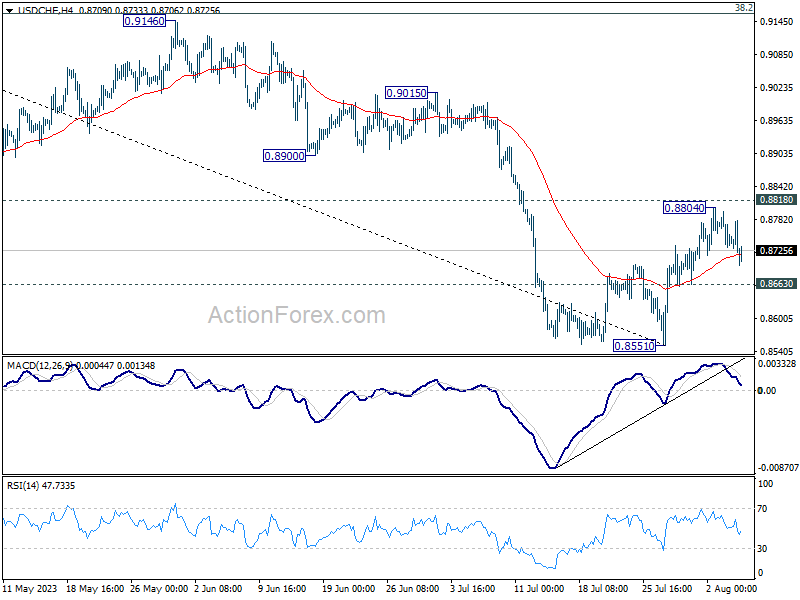
USD/CHF rebounded further to 0.8804 last week but failed to break through 0.8818 resistance. Initial bias remains neutral this week first. On the downside break of 0.8663 minor support should confirm rejection by 0.8818 and turn intraday bias back to the downside for retesting 0.8551 first. Nevertheless, decisive break of 0.8818 will carry larger bullish implication, and target 0.9146 cluster resistance next.
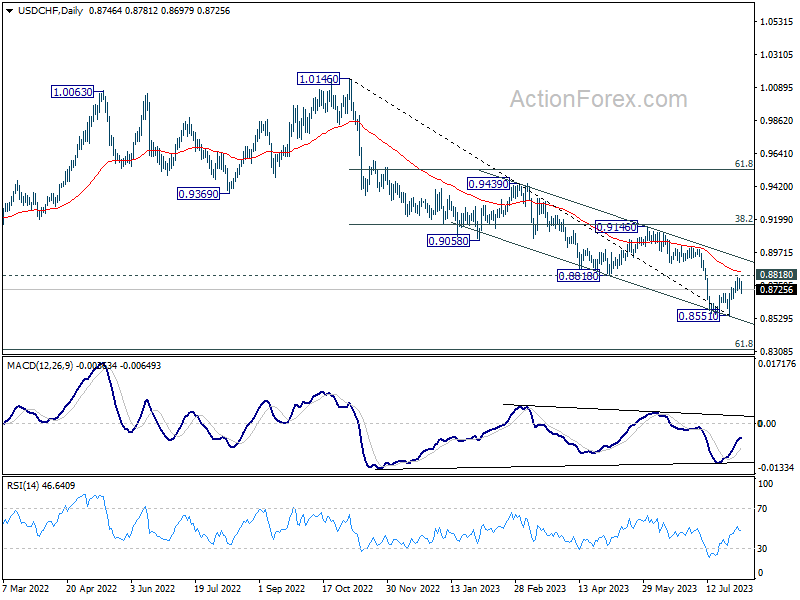
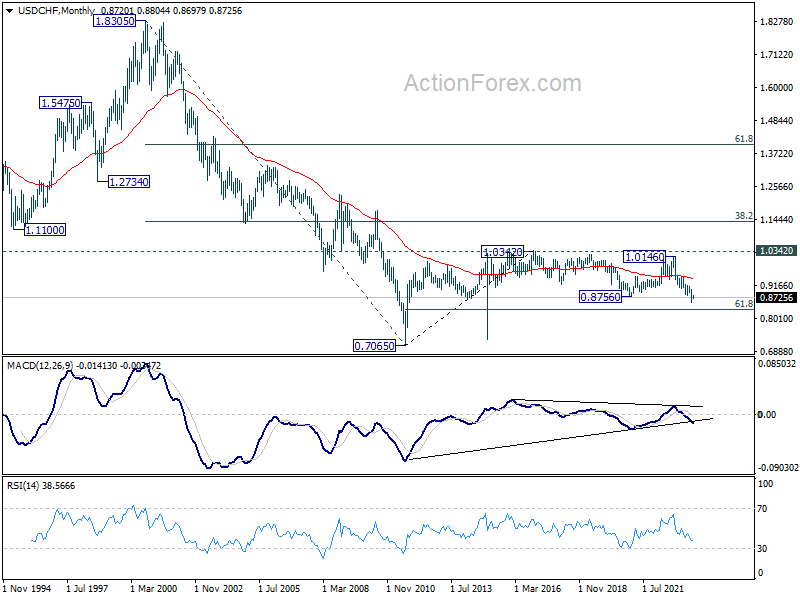
In the bigger picture, down trend from 1.0146 is seen as in progress as long as 0.8188 support turned resistance holds. Next target is 61.8% retracement of 0.7065 (2011 low) to 1.0342 (2016 high) at 0.8317. However, sustained break of 0.8818 should indicate medium term bottoming, and bring stronger rise back to 0.9146 cluster resistance (38.2% retracement of 1.0146 to 0.8551 at 0.9160), even as a correction.
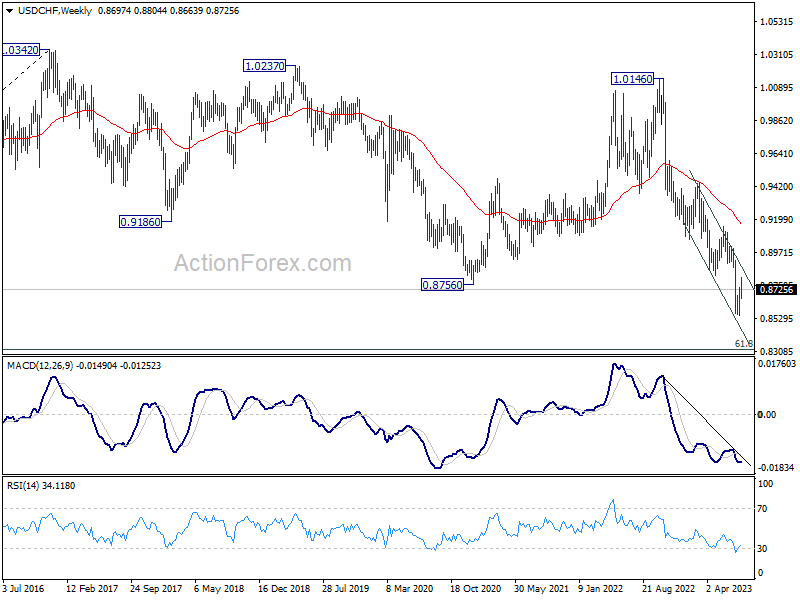
In the long term picture, there is no clear sign that down trend from 1.8305 (2000 high) has completed. With 38.2% retracement of 1.8305 to 0.7065 at 1.1359 intact, outlook is neutral at best. Sustained break of 61.8% retracement of 0.7065 (2011 low) to 1.0342 (2016 high) at 0.8317 will bring retest of 0.7065 low.
AUD/USD Weekly Report
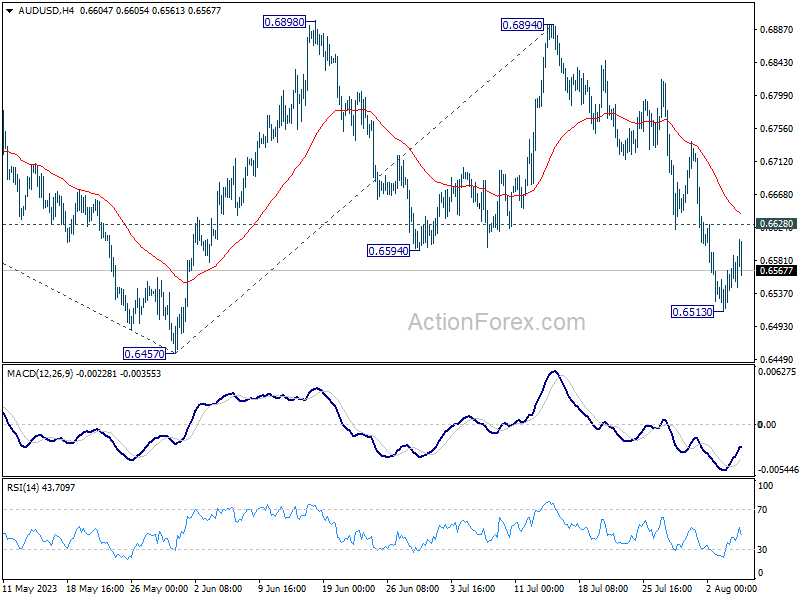
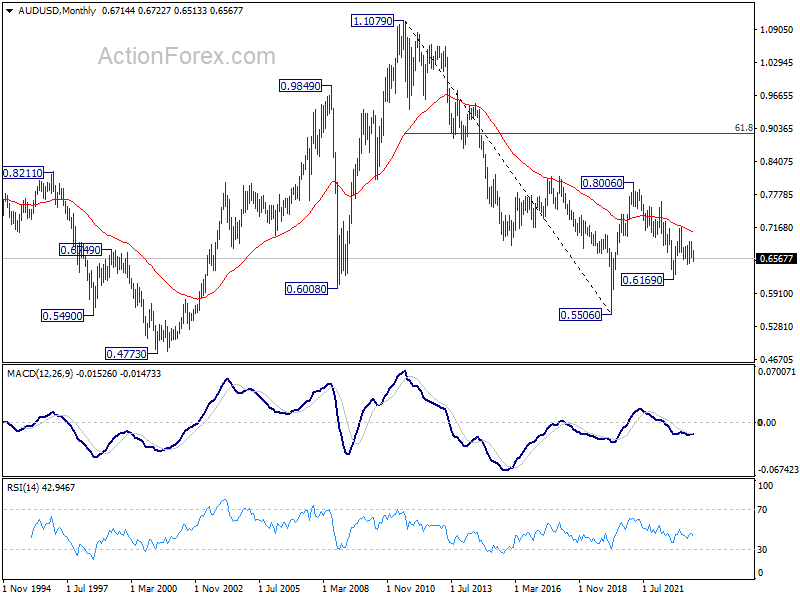
AUD/USD fell to as low as 0.6513 last week but recovered ahead of 0.6457 support. Initial bias remains neutral this week first. Current development argues that larger fall from 0.7156 is still in progress. Below 0.6513 will bring retest of 0.6457 support first. Firm break there will confirm this case and target 100% projection of 0.7156 to 0.6457 from 0.6894 at 0.6195. Nevertheless, on the upside, above 0.6628 minor resistance will mix up the outlook and turn bias back to the upside for stronger rebound.
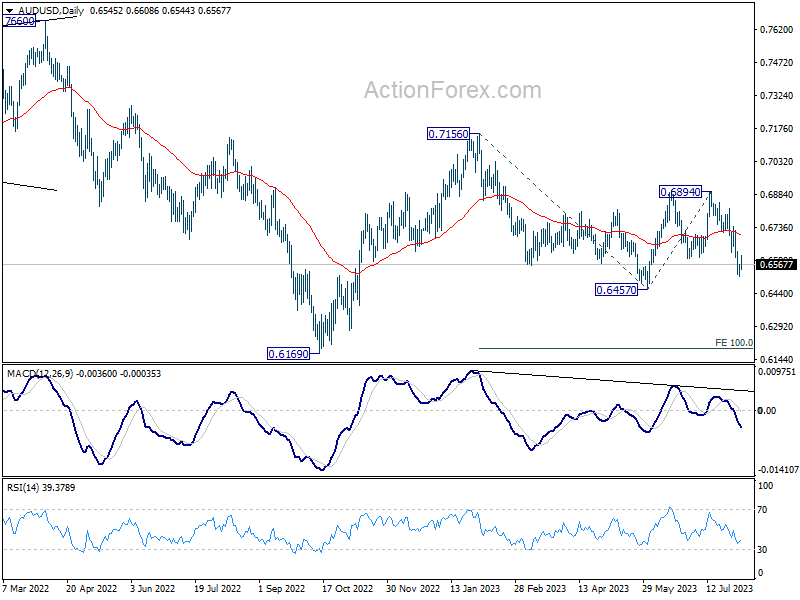
In the bigger picture, outlook is mixed for now as AUD/USD failed to sustain above both 55 D EMA (now at 0.6701) and 55 W EMA (now at 0.6784). On the upside, break of 0.6894 resistance will solidify the case that down trend from 0.8006 (2021 high) has already completed, and target 0.7156 resistance for confirmation. However, break of 0.6457 will likely resume the down trend through 0.6169 (2022 low).
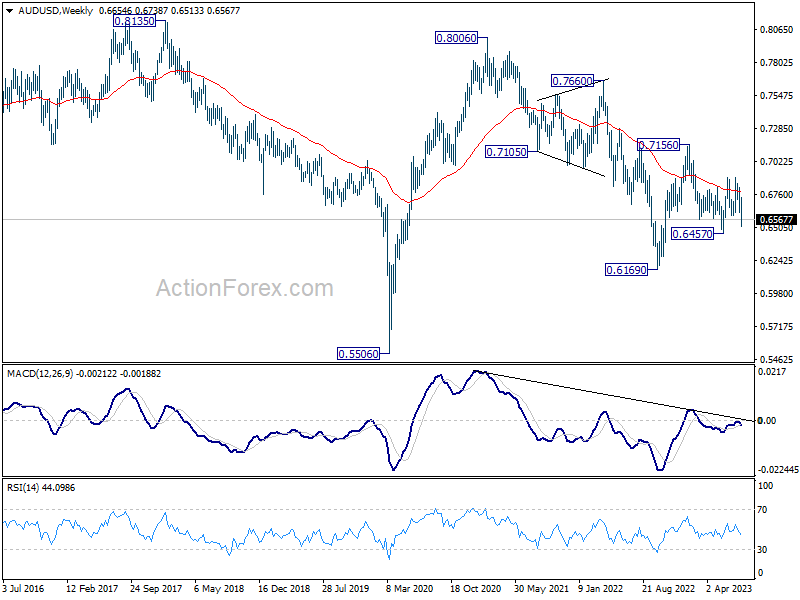
In the long term picture, fall from 0.8006 is seen as a corrective move to up rise from 0.5506 (2020 low). This correction could have completed at 0.6169. Sustained trading above 55 M EMA (now at 0.7070) will affirm this case, and indicate that rise from 0.5506 is ready to resume. However, firm break of 0.6169 will revive long term bearishness and turn focus back to 0.5506 low.
USD/CAD Weekly Outlook
USD/CAD's rebound from 1.3091 extended higher last week and it's now pressing 1.3386 resistance. Sustained break of 1.3386 will argue that whole correction from 1.3976 has completed with three waves down to 1.3091. Further rally would then be seen to 1.3653 resistance next. Nevertheless, rejection by 1.3386, followed by break of 1.3260 minor support, should resume larger decline through 1.3091 low.
In the bigger picture, price actions from 1.3976 are viewed as a corrective fall only. Upon completion, rise from 1.2005 (2021 low) would resume through 1.3976 towards 1.4667/89 long term resistance zone. In case of another fall, downside should be contained by 61.8% retracement of 1.2005 to 1.3976 at 1.2758.
In the longer term picture, price actions from 1.4689 (2016 high) are seen as a consolidation pattern only, which might have completed at 1.2005. That is, up trend from 0.9506 (2007 low) is expected to resume at a later stage. This will remain the favored case as 55 M EMA (now at 1.3057) holds.