Sample Category Title
EUR/USD Mid-Day Outlook
Daily Pivots: (S1) 1.0920; (P) 1.0941; (R1) 1.0971; More...
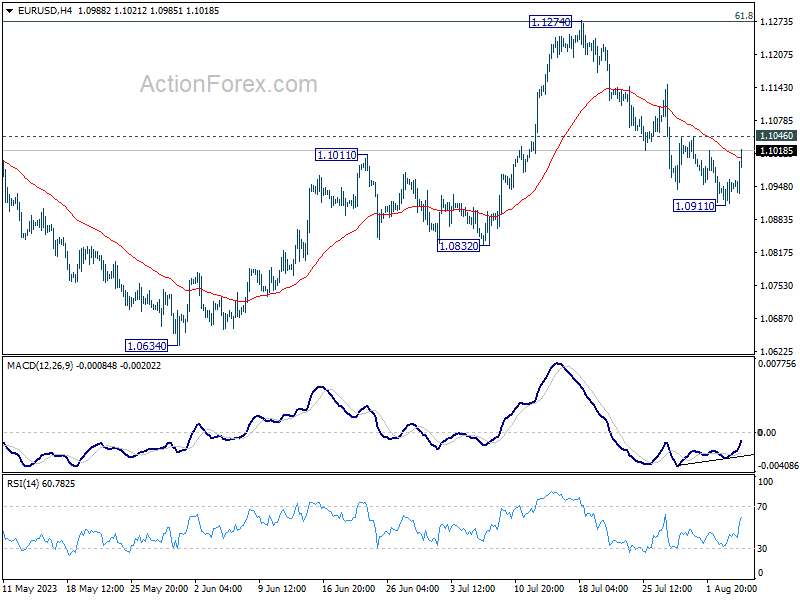
Intraday bias in EUR/USD is turned neutral first with current recovery. Break of 1.1046 minor resistance will argue that pull back from 1.1274 has completed at 1.0911. Intraday bias will be back on the upside for retesting 1.1274. On the downside, break of 1.0911 will resume the decline to 1.0832 support. Sustained trading below there will target 1.0609/34 cluster support.
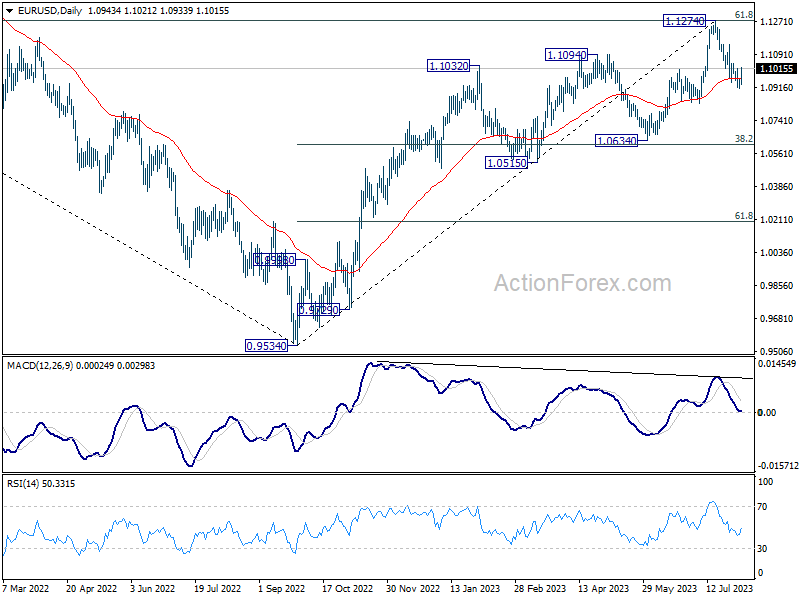
In the bigger picture, a medium term top could be formed at 1.1274, after failing to break through 61.8% retracement of 1.2348 (2021 high) to 0.9534 at 1.1273 decisively, on bearish divergence condition in D MACD. Sustained trading below 55 D EMA (now at 1.0963) will bring deeper correction to 1.0634 cluster support (38.2% retracement of 0.9534 to 1.1274 at 1.0609). Strong support could be seen there, at least on first attempt, to set the range for consolidation.
Dollar Dips Following Non-Farm Payroll Disappointment
Dollar falls broadly in early US session following slightly below-expectation non-farm payroll job growth. However, the downside is currently limited, thanks to stronger-than-expected wage growth. The market behavior seems to suggest that traders are merely lightening their positions ahead of the weekend and CPI data release next week, rather than initiating any significant position reversals.
Meanwhile, Canadian Dollar is showing a slightly steeper decline following disappointing employment data. For the moment, Australian and New Zealand Dollars are reaping the most benefits, bolstered by US futures indicating a higher open. However, their recoveries may prove to be fragile if risk-off sentiment resurfaces later in the session.
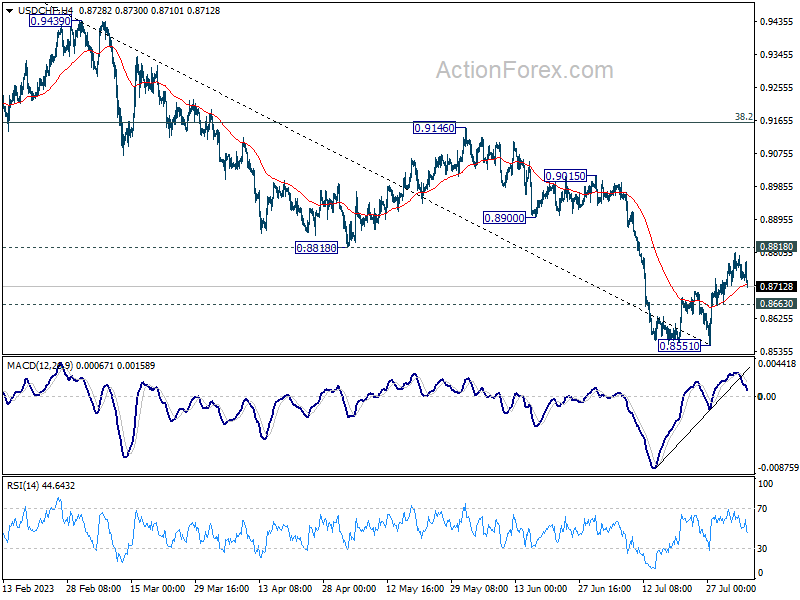
Technically, near term focus in USD/CHF will be back on 0.8663 minor support if the current pull back extends. Firm break there will confirm rejection by 0.8818 support turned resistance, and thus retain near term bearishness in the pair. In other words, larger down trend from 1.0146 could be ready to resume through 0.8551 low if that happens.
In Europe, at the time of writing, FTSE is down -0.29%. DAX is down -0.32%. CAC is up 0.17%. Germany 10-year yield is up 0.0074 at 2.611. Earlier in Asia, Nikkei rose 0.10%. Hong Kong HSI rose 0.61%. China Shanghai SSE rose 0.23%. Singapore Strait Times dropped -0.35%. Japan 10-year JGB yield dropped -0.0077 to 0.646.
US NFP rose 187k in Jul, missed expectations
US non-farm payroll employment rose 187k in July, below expectation of 200k. That's also notably lower than the average monthly gain of 312k over the prior 12 months.
Unemployment rate ticked down from 3.6% to 3.5%, below expectation of 3.6%. Unemployment rate has been ranging between 3.4% and 3.7% since March 2022. Labor force participation rate was unchanged at 62.6% for the fifth consecutive month.
Average hourly earnings rose 0.4% mom, above expectation of 0.3% mom. Over the past 12 months, average hourly earnings has increased by 4.4% yoy. Average workweek fell slightly by -0.1 hour to 34.3 hours.
Canada employment down -6.4k in Jul, unemployment rate rose to 5.5%
Canada employment fell -6.4k in July, below expectation of 15.5k growth.
Unemployment rate rose from 5.4% to 5.5%, matched expectations, and marked the third consecutive monthly increase
Average hourly wages growth jumped from 4.2% yoy to 5.0% yoy. Total hours worked was virtually unchanged over the month, and up 2.1% yoy.
Eurozone retail sales down -0.3% mom in Jun, EU down -0.2% mom
Eurozone retail sales dropped -0.3% mom in June, much worse than expectation of 0.3% mom. Volume of retail trade decreased by -0.3% for food, drinks and tobacco and by -0.2% for non-food products, while it increased by 1.0% for automotive fuels.
EU retail sales fell -0.2% mom. Among Member States for which data are available, the largest monthly decreases in the total retail trade volume were registered in the Slovenia (-2.6%), Romania (-1.9%) and Portugal (-1.6%). The highest increases were observed in Luxembourg (+2.6%), Netherlands (+1.5%) and Belgium (+1.2%).
RBA downgrades 2023 CPI and GDP forecasts slightly
In the quarterly Statement on Monetary Policy, RBA reiterated that "some further tightening of monetary policy may be required". This decision, however, would hinge on the incoming data and the evolving assessment of risks. Economic forecasts remain largely unchanged, with a slight downgrade in 2023 CPI forecast as well as 2023 and 2024 GDP projections.
The central bank's outlook for inflation remains more or less steady as compared to three months ago. "CPI inflation is forecast to continue to decline, to be around 3¼ per cent at the end of 2024 and back within the 2–3 per cent target range in late 2025," the statement highlighted. The Board maintains that the risks around the inflation outlook are "broadly balanced".
While the labour market remains tight, conditions have seen slight relaxation. The bank notes, "In response to the tight labour market and high inflation, wage growth picked up to its highest rate in a decade."
The economic growth perspective appears somewhat muted, with the statement acknowledging that "Growth in economic activity has been subdued this year." Looking ahead, the central bank remains cautious, predicting that "Growth in the economy is expected to remain subdued over the period ahead."
New economic forecasts
CPI inflation at (vs previous forecast):
- 4.25% in Dec 2023 (down from 4.50%).
- 3.50% in June 2024 (unchanged).
- 3.25% in Dec 2024 (unchanged).
- 300% in Jun 2025 (unchanged).
- 2.75% in Dec 2025 (new).
Trimmed mean CPI inflation at:
- 4.00% in Dec 2023 (unchanged).
- 3.25% in Jun 2024 (unchanged).
- 3.00% in Dec 2024 (unchanged).
- 3.00% in Jun 2025 (unchanged).
- 2.75% in Dec 2025 (new).
Year-average GDP growth at:
- 1.50 in 2023 (down from 1.75%).
- 1.25% in 2024 (down from 1.50%).
- 2.00% in 2025 (new).
EUR/USD Mid-Day Outlook
Daily Pivots: (S1) 1.0920; (P) 1.0941; (R1) 1.0971; More...
Intraday bias in EUR/USD is turned neutral first with current recovery. Break of 1.1046 minor resistance will argue that pull back from 1.1274 has completed at 1.0911. Intraday bias will be back on the upside for retesting 1.1274. On the downside, break of 1.0911 will resume the decline to 1.0832 support. Sustained trading below there will target 1.0609/34 cluster support.
In the bigger picture, a medium term top could be formed at 1.1274, after failing to break through 61.8% retracement of 1.2348 (2021 high) to 0.9534 at 1.1273 decisively, on bearish divergence condition in D MACD. Sustained trading below 55 D EMA (now at 1.0963) will bring deeper correction to 1.0634 cluster support (38.2% retracement of 0.9534 to 1.1274 at 1.0609). Strong support could be seen there, at least on first attempt, to set the range for consolidation.
Economic Indicators Update
| GMT | Ccy | Events | Actual | Forecast | Previous | Revised |
|---|---|---|---|---|---|---|
| 01:30 | AUD | RBA Monetary Policy Statement | ||||
| 06:00 | EUR | Germany Factory Orders M/M Jun | 7.00% | -2.00% | 6.40% | 6.20% |
| 06:45 | EUR | France Industrial Output M/M Jun | -0.90% | -0.30% | 1.20% | 1.10% |
| 08:00 | EUR | Italy Industrial Output M/M Jun | 0.50% | 0.00% | 1.60% | 1.70% |
| 08:30 | GBP | Construction PMI Jul | 51.7 | 48.2 | 48.9 | |
| 09:00 | EUR | Eurozone Retail Sales M/M Jun | -0.30% | 0.30% | 0.00% | 0.60% |
| 12:30 | USD | Nonfarm Payrolls Jul | 187K | 200K | 209K | |
| 12:30 | USD | Unemployment Rate Jul | 3.50% | 3.60% | 3.60% | |
| 12:30 | USD | Average Hourly Earnings M/M Jul | 0.40% | 0.30% | 0.40% | |
| 12:30 | CAD | Net Change in Employment Jul | -6.4K | 15.5K | 59.9K | |
| 12:30 | CAD | Unemployment Rate Jul | 5.50% | 5.50% | 5.40% | |
| 14:00 | CAD | Ivey PMI Jul | 50.2 |
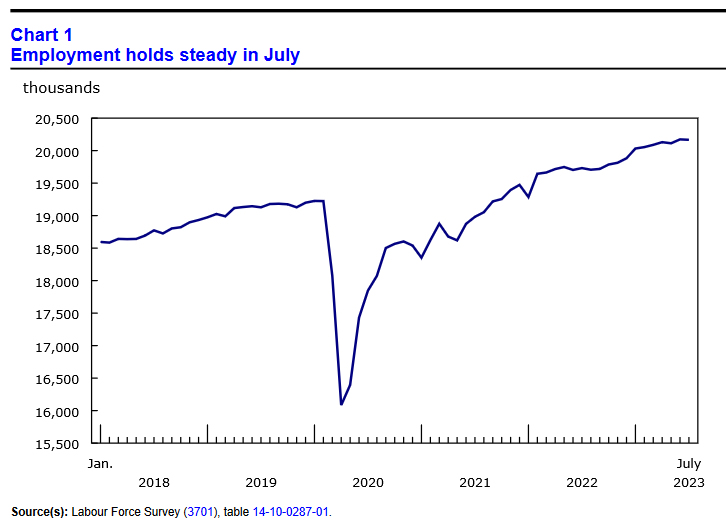
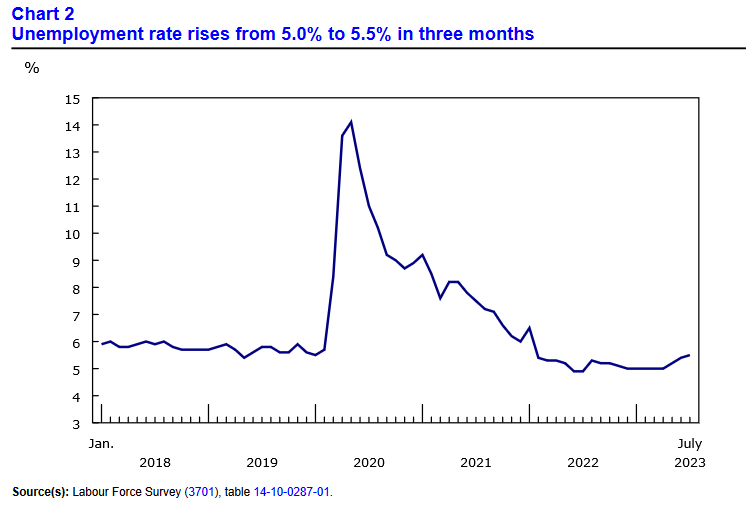
Canada employment down -6.4k in Jul, unemployment rate rose to 5.5%
Canada employment fell -6.4k in July, below expectation of 15.5k growth.
Unemployment rate rose from 5.4% to 5.5%, matched expectations, and marked the third consecutive monthly increase.
Average hourly wages growth jumped from 4.2% yoy to 5.0% yoy. Total hours worked was virtually unchanged over the month, and up 2.1% yoy.
US NFP rose 187k in Jul, missed expectations
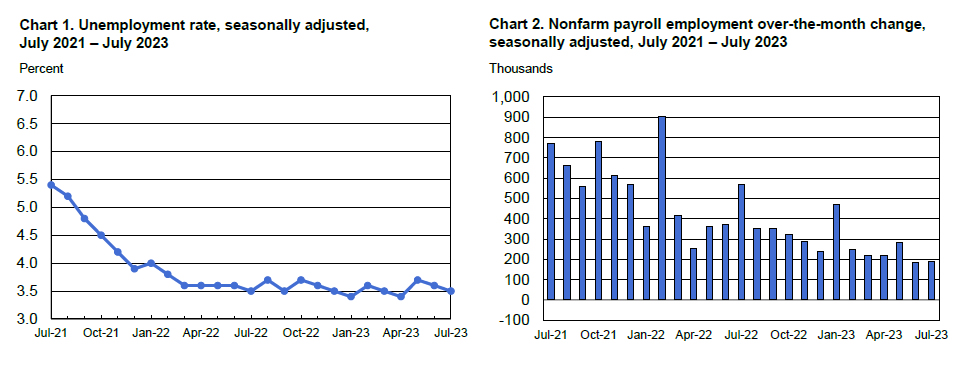
US non-farm payroll employment rose 187k in July, below expectation of 200k. That's also notably lower than the average monthly gain of 312k over the prior 12 months.
Unemployment rate ticked down from 3.6% to 3.5%, below expectation of 3.6%. Unemployment rate has been ranging between 3.4% and 3.7% since March 2022. Labor force participation rate was unchanged at 62.6% for the fifth consecutive month.
Average hourly earnings rose 0.4% mom, above expectation of 0.3% mom. Over the past 12 months, average hourly earnings has increased by 4.4% yoy. Average workweek fell slightly by -0.1 hour to 34.3 hours.
Labor Market Data May Send The USD Down
To properly examine the likely outcome of the Labour data release and the NFP (Non-farm Payrolls), I will be correlating the USD with the value of gold. That said, gold is at a critical juncture as the US Dollar strengthens and Treasury yields rise. The week has been marked by risk-off sentiment due to Fitch's downgrade of the US sovereign debt credit rating. Investors are concerned about increasing US debt and higher borrowing costs. The benchmark 10-year note is climbing towards 4.20%, and the short end of the curve is stable as the market believes the Federal Reserve is nearing the end of its tightening cycle. Despite these headwinds, gold has held up relatively well, but its performance may be undermined if the challenges persist.
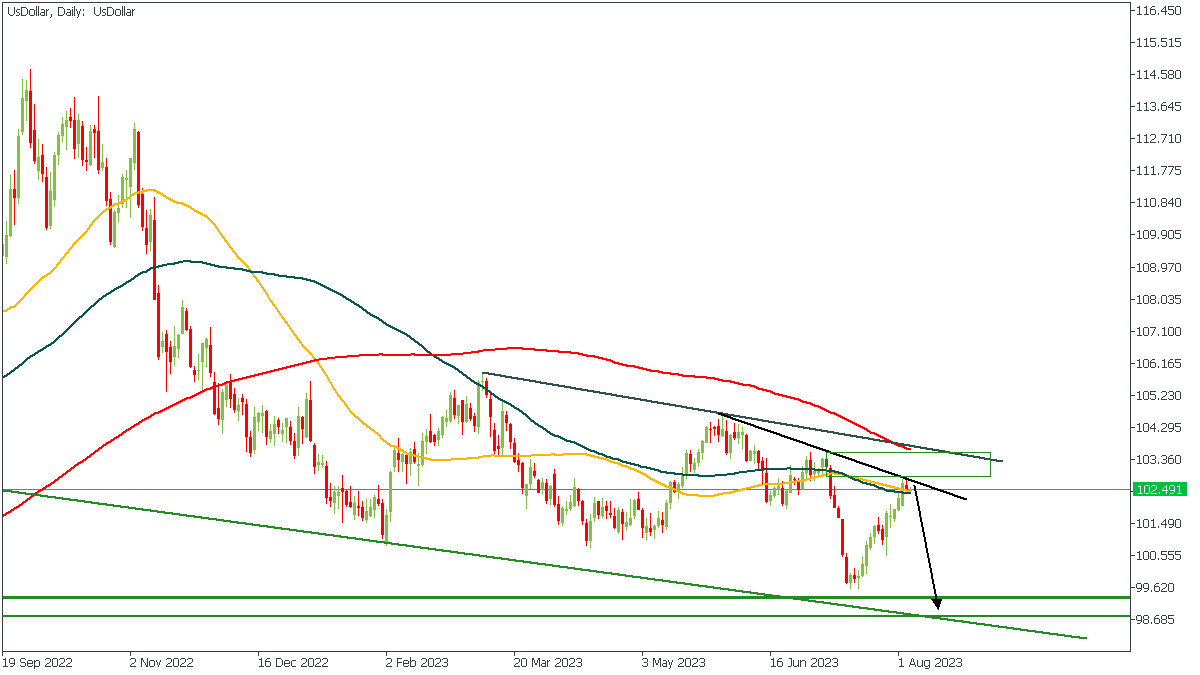
US Dollar - D1 Timeframe
The US Dollar recently bounced off the pivot zone at the bottom of the equidistant channel and has returned to the 50 and 100 moving averages. In this case, the moving averages are expected to act as a resistance and push prices back down, together with confluences from the rally-base-drop supply zone, resistance trendline, and the bearish moving average array. I will still be looking forward to a rejection from that zone to confirm the onset of the bearish movement.
Analyst’s Expectations:
- Direction: Bearish
- Target: 100.132
- Invalidation: 103.539
EURUSD - D1 Timeframe
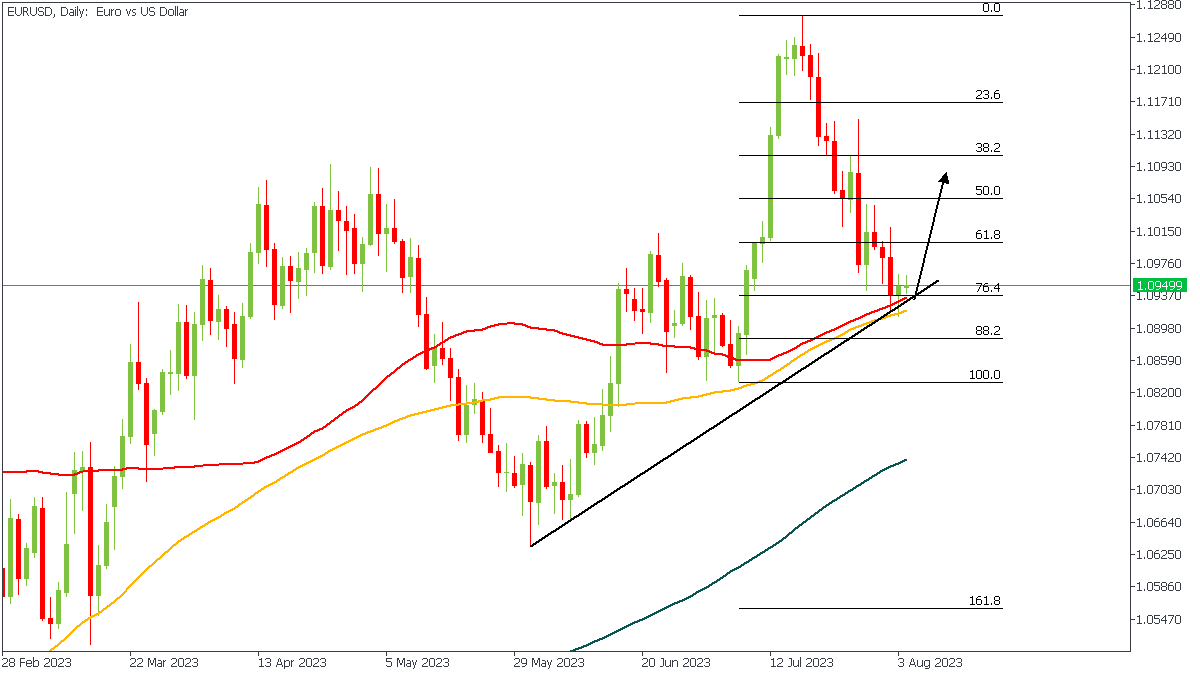
EURUSD, on the daily timeframe, has just bumped into the 50 and 100 moving averages right on top of the 76% of the Fibonacci retracement tool and trendline support. These are expected to provide the much-needed support that would push prices back up toward 38% of the Fibonacci tool, at the very least. In any case, a lot is yet to be seen as we await the data from the US later today.
Analyst’s Expectations:
- Direction: Bullish
- Target: 1.10845
- Invalidation: 1.08294
GBPUSD - D1 Timeframe
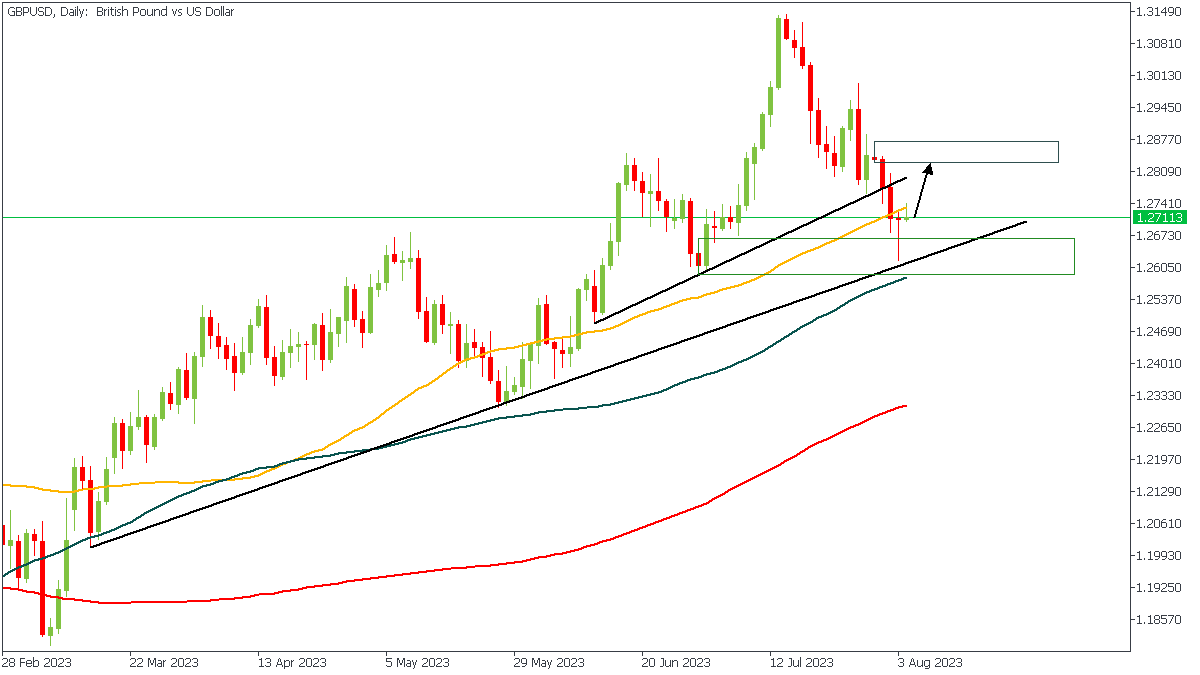
GBPUSD has recently been rejected off the demand zone at the trendline support. We also can see that the moving averages are arrayed clearly bullishly, indicating that we are still in an uptrend. The final confluence here is that the 50-day moving average is the pivotal support level in this case, which is expected to push prices back up to the highlighted supply zone. In any case, due diligence must be done to screen out your entry scenario.
Analyst’s Expectations:
- Direction: Bullish
- Target: 1.28247
- Invalidation: 1.25872
CONCLUSION
The trading of CFDs comes at a risk. Thus, to succeed, you have to manage risks properly. To avoid costly mistakes while you look to trade these opportunities, be sure to do your due diligence and manage your risk appropriately.
Eurozone retail sales down -0.3% mom in Jun, EU down -0.2% mom
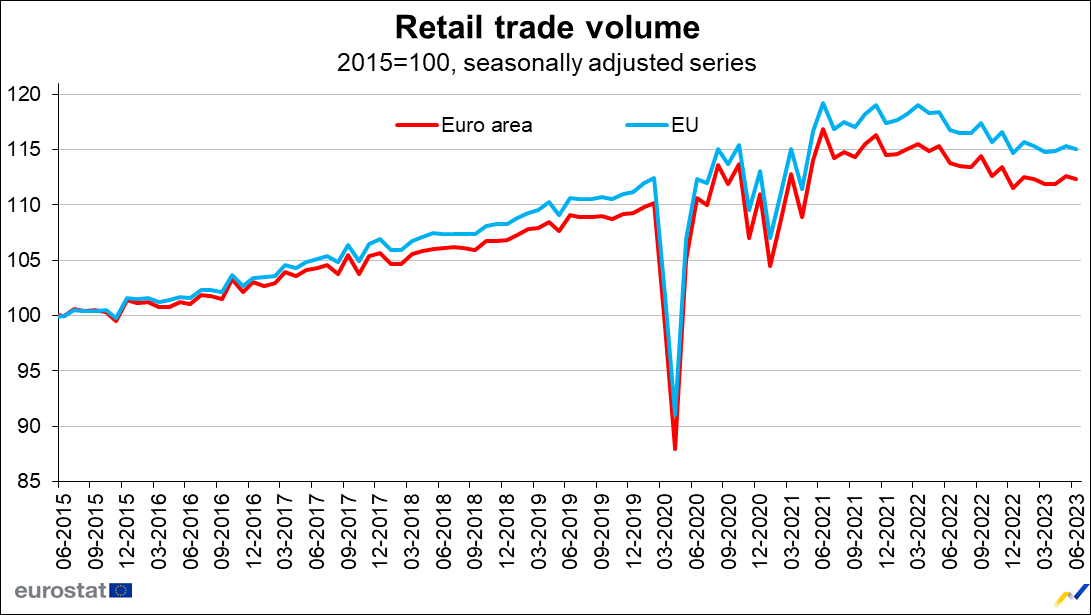
Eurozone retail sales dropped -0.3% mom in June, much worse than expectation of 0.3% mom. Volume of retail trade decreased by -0.3% for food, drinks and tobacco and by -0.2% for non-food products, while it increased by 1.0% for automotive fuels.
EU retail sales fell -0.2% mom. Among Member States for which data are available, the largest monthly decreases in the total retail trade volume were registered in the Slovenia (-2.6%), Romania (-1.9%) and Portugal (-1.6%). The highest increases were observed in Luxembourg (+2.6%), Netherlands (+1.5%) and Belgium (+1.2%).
WTI Oil Forms Bullish Continuation Pattern
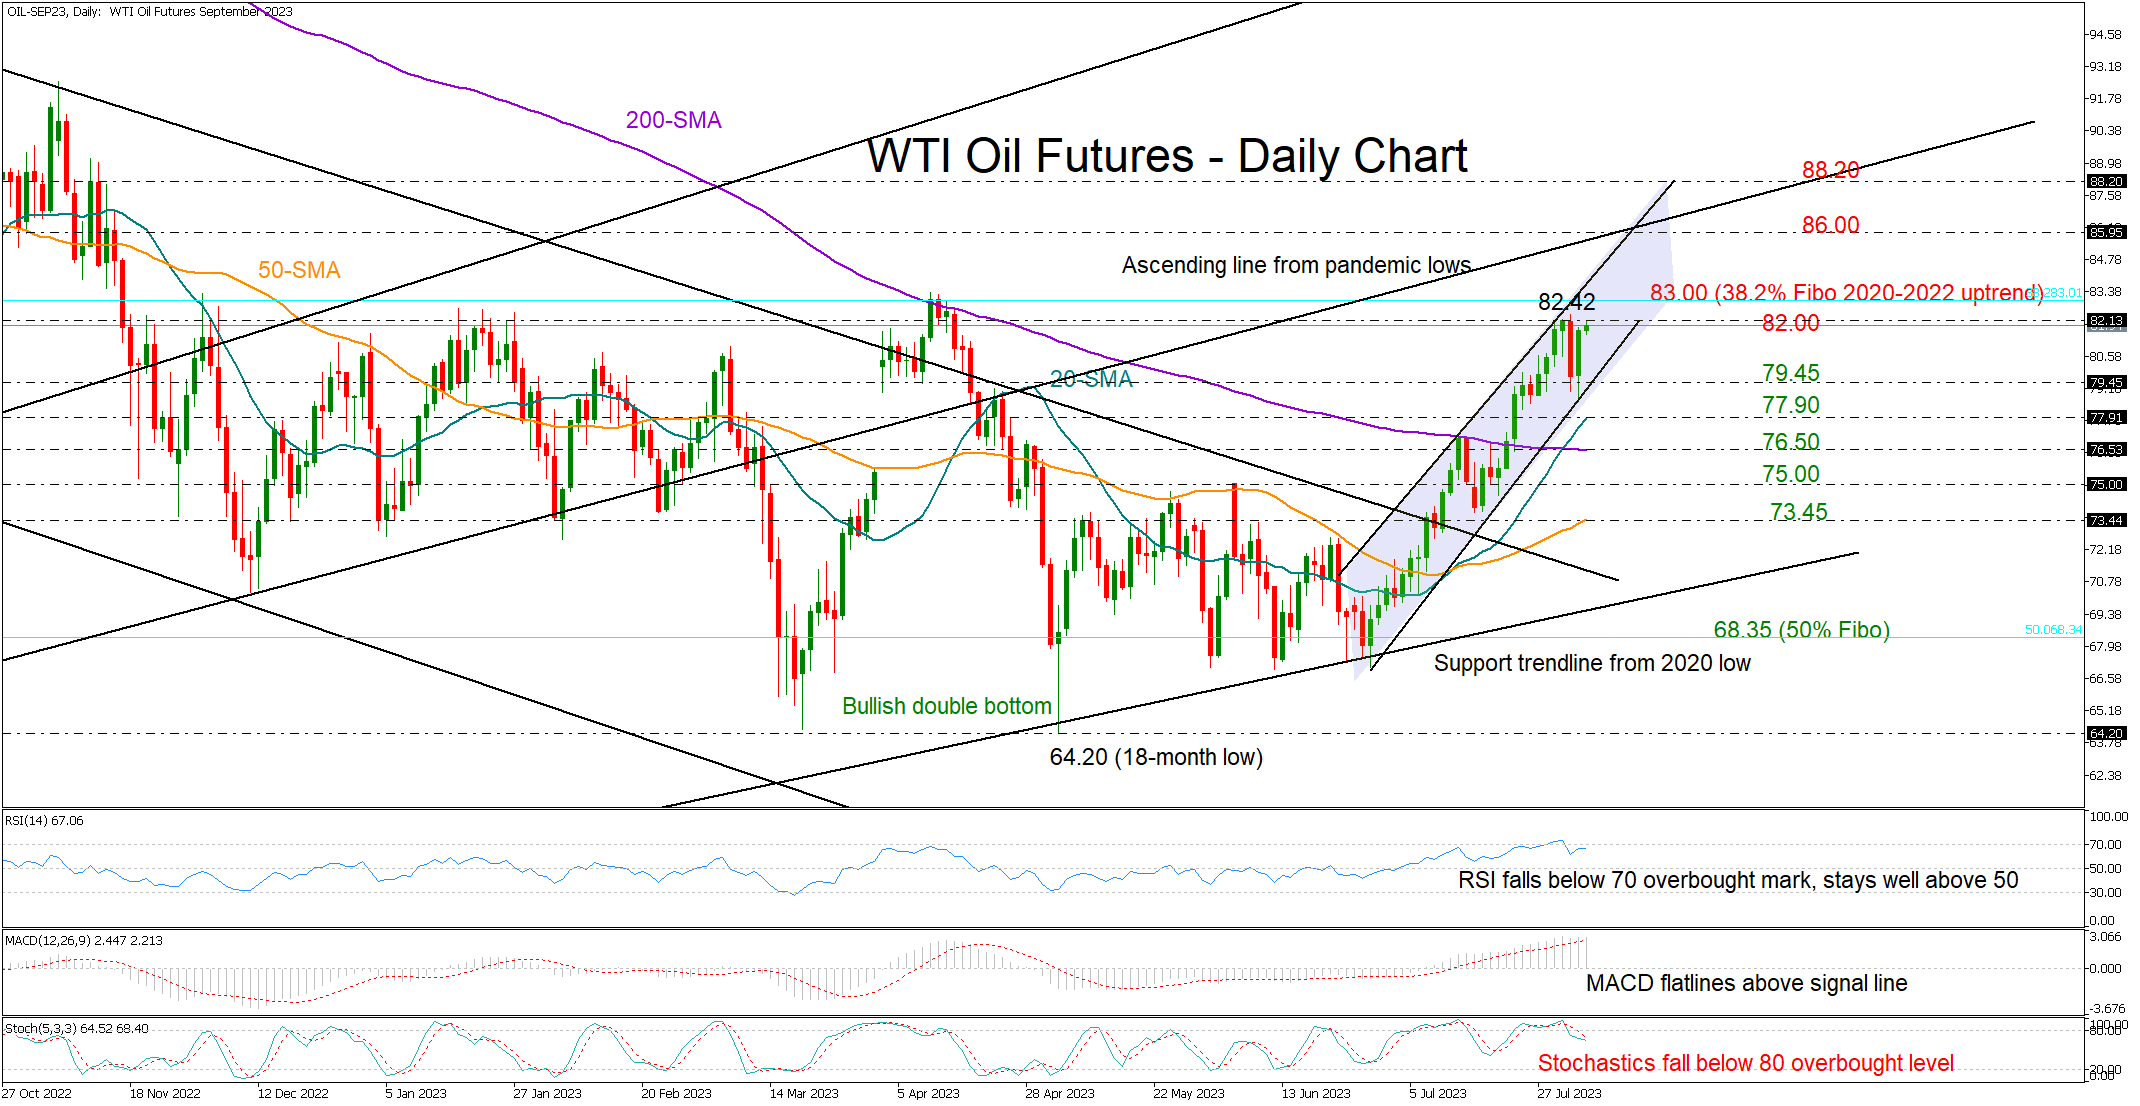
WTl oil futures (September delivery) won back Wednesday’s loss to retest the 82.00 resistance area after pivoting at the bottom of a tight bullish channel.
Oil prices are on the rise for the sixth consecutive week and a downside correction cannot be excluded, as the RSI and the Stochastic oscillator are showing signs of weakness following their peaks in their overbought zones.
Still, with the RSI standing comfortably above its 50 neutral mark and the MACD holding above its red signal line, the market might become bullish again in the short-term picture. Besides, Wednesday’s red candlestick seems to be part of a bullish three strike candlestick pattern, which is considered a positive signal of continuation.
In trend signals, the 20-day simple moving average (SMA) has strengthened above the 200-day SMA for the first time since October 2020, leading to optimism that the bullish wave could stretch beyond the 83.00 level and April’s ceiling of 83.40. If efforts prove successful and the price exits the tight upward-sloping channel above 83.60, the door could open for the 86.00 barrier. The long-term ascending line from April 2020 is passing through this area. Therefore, a move higher could add more fuel to the rally, shifting the spotlight to 88.00.
In the bearish scenario, where the price slides below the channel and the 79.45 level, the 20- and 200-day SMAs could immediately come to the rescue near 77.90 and 76.50, respectively. A move below the latter could ignite fresh selling towards the 75.00 mark and then down to the 50-day SMA at 73.45.
All in all, although WTI oil futures have stabilized after the peak at 82.42 earlier this week, only a drop below the short-term channel and the 79.45 area could reduce hopes for a bullish continuation.
EUR/USD Flat Ahead of Nonfarm Payroll Report
- German Factory Orders jump 7.0%
- US nonfarm payrolls expected to dip to 200,000
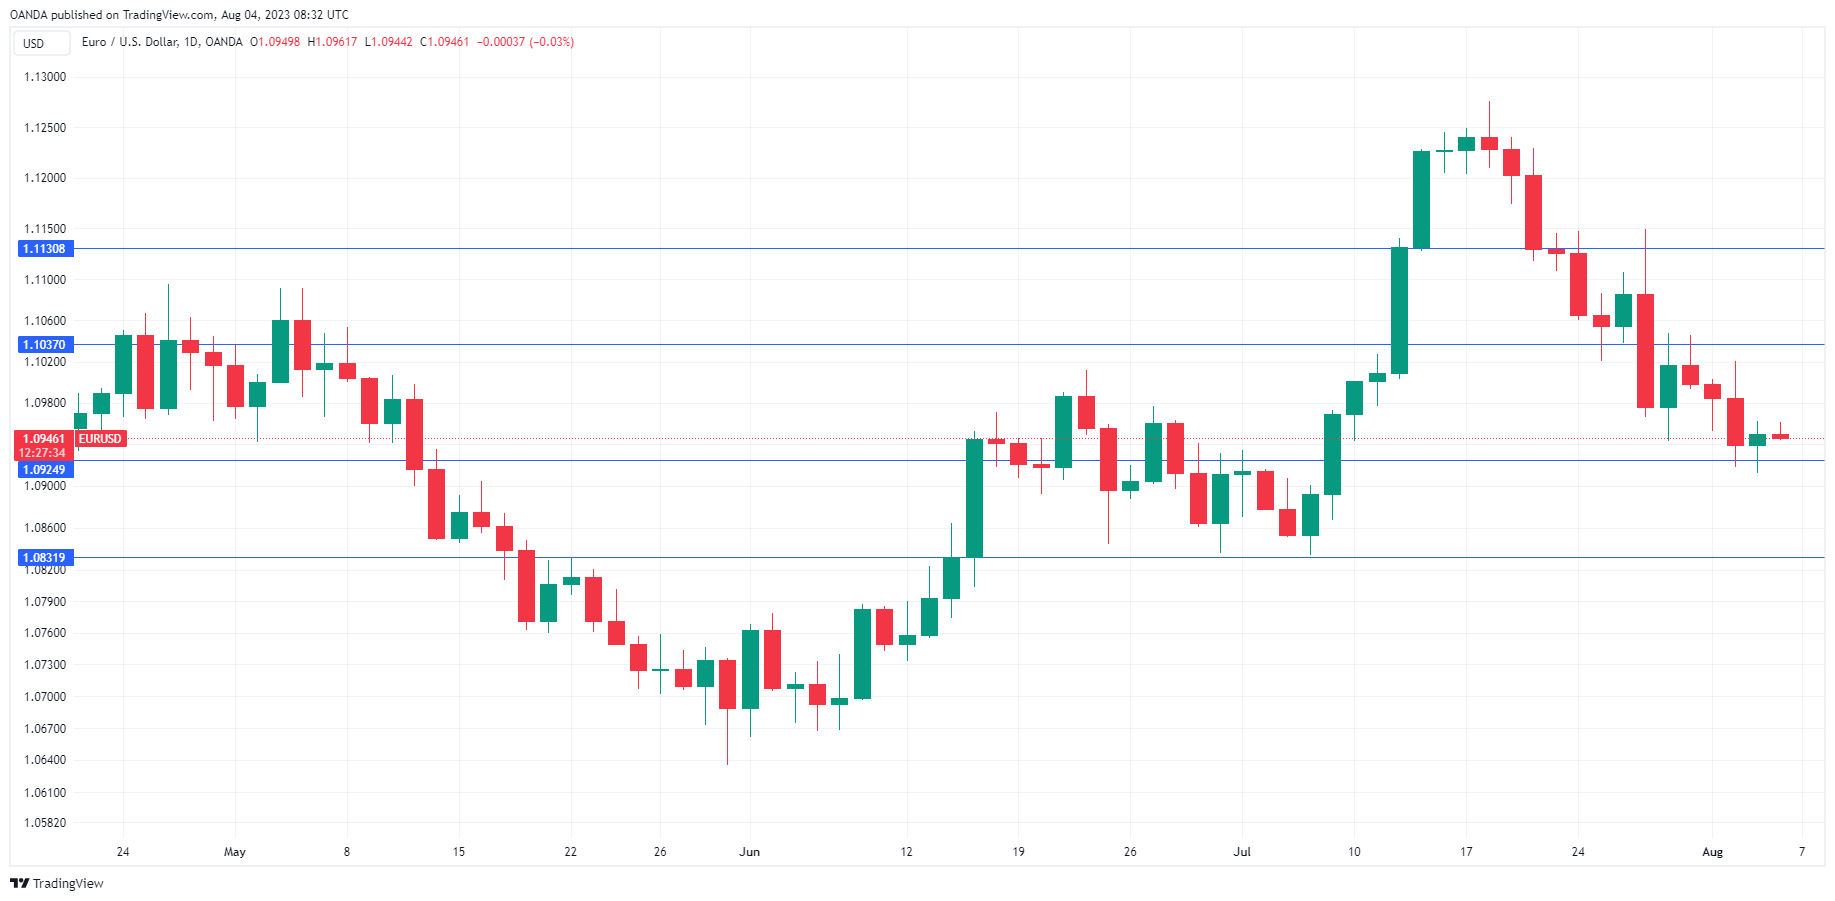
The euro is almost unchanged on Friday, trading at 1.0952. We could see some movement in the North American session, with the release of US nonfarm payrolls.
The euro has shown sharp swings lately. EUR/USD climbed to 1.1275 on July 18th, its highest level since February 2022. It has been all downhill since then, with the euro tumbling over 300 basis points.
Soft German PMIs reflective of weak eurozone economy
It hasn’t been the best week for Germany, the largest economy in the eurozone and the bellwether of the bloc. The July PMIs pointed to deceleration in both services and manufacturing. The Services PMI remained in expansion territory but slipped from 54.1 to 52.3, its lowest level since February. Manufacturing is in terrible shape, with the PMI falling from 40.6 to 38.8, its weakest reading since May 2020. German retail sales declined 0.8% in June, down from 1.9% in May.
The week did end with some good news, as German Factory Orders jumped 7.0% m/m in June, up from 6.2% in May and blowing past the consensus estimate of -2.0%. We’ll get a look at German Industrial Production on Monday and CPI on Tuesday.
For the ECB, the weak numbers out of Germany are an indication that the central bank’s tightening cycle is working, but what comes next is a tricky question. Inflation has slowed to 5.5%, but that is much higher than the 2% target. The ECB hasn’t paused its rate hikes since the tightening cycle began in July 2022 but there is some pressure on the ECB to take a break at the September meeting in order to avoid a recession.
ECB President Lagarde is keeping mum, saying that a pause or a hike are both on the table. With no guidance from the ECB, about all investors can do is keep an eye on inflation and employment releases, which will be crucial to the ECB’s decision at the next meeting.
Markets expect soft US nonfarm payrolls
All eyes are on nonfarm payrolls, one of the most important US releases. In June, a massive ADP employment report fuelled expectations that nonfarm payrolls would also soar. In the end, nonfarm payrolls fell to 209,000, down sharply from a downwardly revised 306,000. ADP again soared this week with a reading of 324,000. We’ll have to wait and see if nonfarm payrolls come in around the consensus estimate of 200,000 or follow ADP and move sharply higher.
EUR/USD Technical
- 1.0924 remains under pressure in support. Below, there is support at 1.0831
- There is resistance at 1.1037 and 1.1130
Gold and Crude Oil: Long-Term Outlook
Gold price could restart a steady increase above the $1,990 resistance. Crude oil price is rising and it could climb further higher toward $85.
Important Takeaways for Gold and Oil Prices Analysis Today
- Gold price corrected lower from $2,080 and tested $1,900 against the US Dollar.
- A key bullish trend line is forming with support at $1,940 on the daily chart of gold at FXOpen.
- Crude oil prices are moving higher above the $76.75 resistance zone.
- There was a break above a key contracting triangle with resistance near $71.00 on the daily chart of XTI/USD at FXOpen.
Gold Price Technical Analysis
On the daily chart of Gold at FXOpen, the price started a downside correction from the $2,080 zone. The price traded below the $2,050 and $1,990 levels.
Finally, the bulls appeared near the $1,900 level. A low was formed near $1,900 and the price is now attempting a fresh increase. There was a move above the 23.6% Fib retracement level of the downward move from the $2,080 swing high to the $1,900 low.
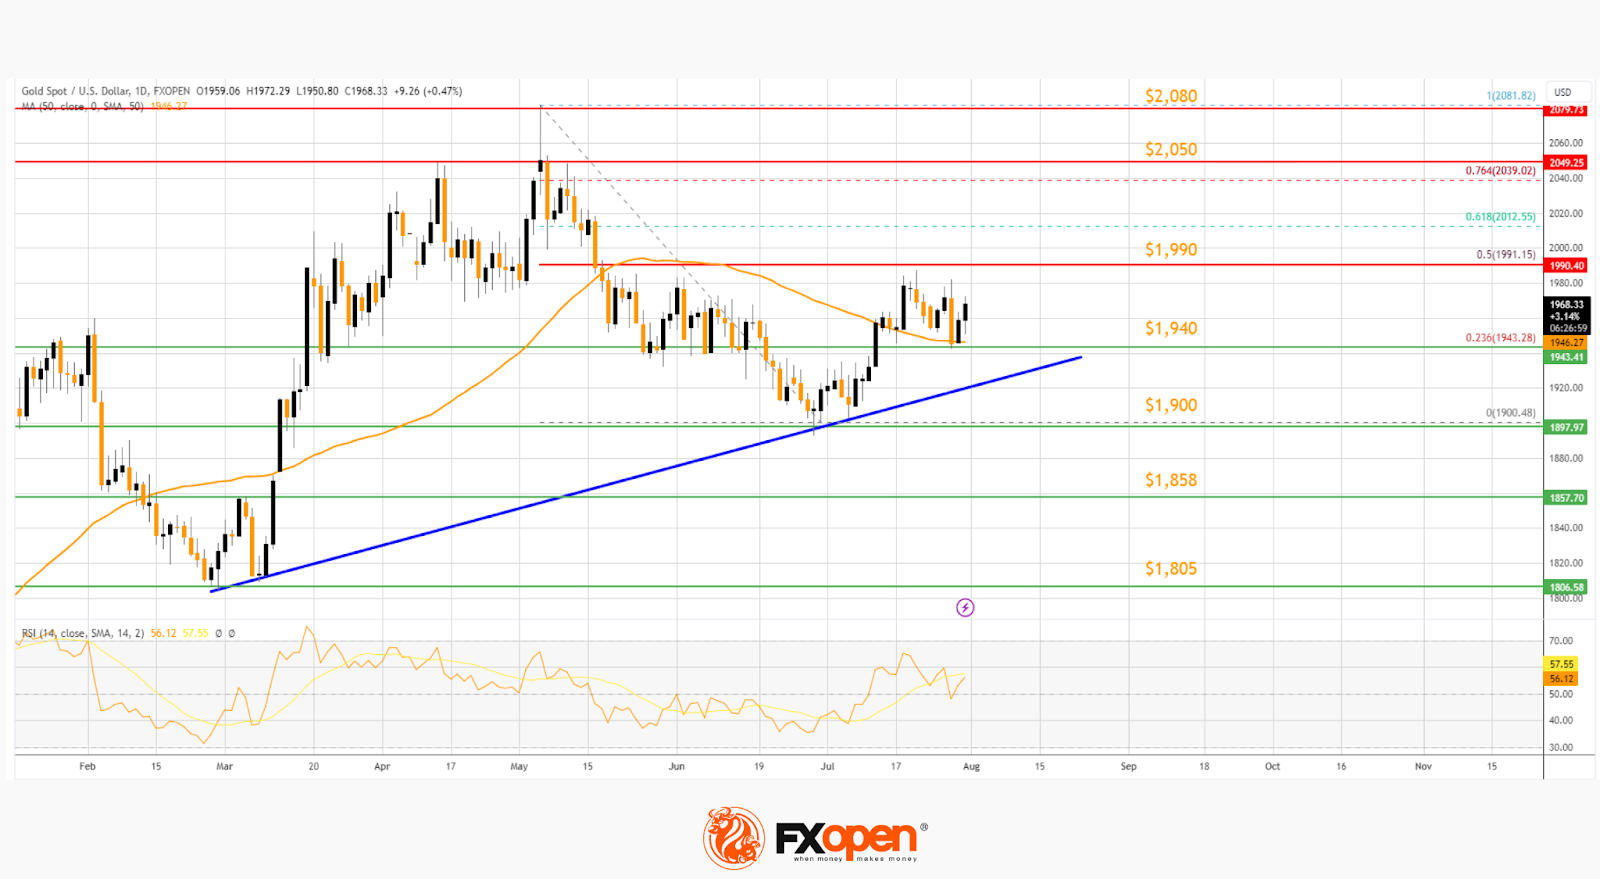
The price is now trading above the 50-day simple moving average. There is also a key bullish trend line forming with support at $1,940.
Immediate resistance is near the 50% Fib retracement level of the downward move from the $2,080 swing high to the $1,900 low at $1,990. The next major resistance is near $2,000. An upside break above $2,000 could send Gold price toward $2,050. Any more gains may perhaps set the pace for an increase toward the $2,080 level.
Initial support on the downside is near the $1,940 level. The first major support is near $1,900. If there is a downside break below $1,900, the price might decline further. In the stated case, XAU/USD might drop toward $1,805.
Oil Price Technical Analysis
On the daily chart of WTI Crude Oil at FXOpen, the price started a decent increase against the US Dollar. The price gained bullish momentum after it broke the $71.00 resistance.
Besides, there was a break above a key contracting triangle with resistance near $71.00. The price climbed above the $75.00 pivot level as mentioned in the previous analysis. Finally, the bulls pushed the price above the 61.8% Fib retracement level of the downward move from the $84.53 swing high to the $63.90 low.
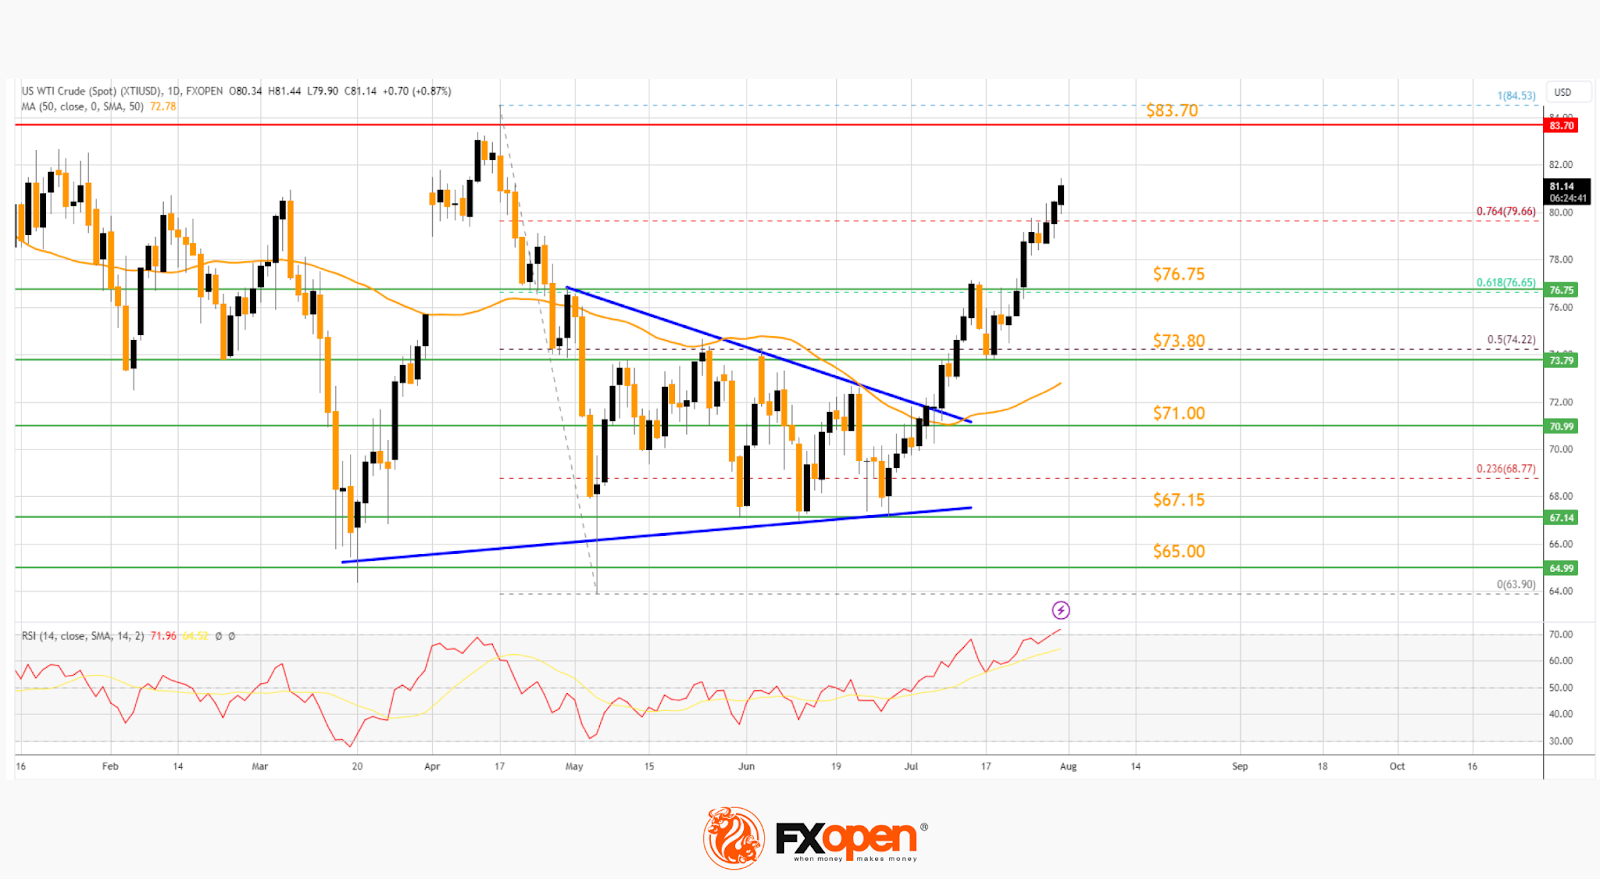
The price is now trading above the 50-day simple moving average, and the 76.4% Fib retracement level of the downward move from the $84.53 swing high to the $63.90 low.
It seems like the bulls are aiming for a test of $83.70. If the price climbs further higher, it could face resistance near $85.00. Any more gains might send the price toward the $88.00 level.
Conversely, the price might correct gains and test the $76.75 support. The first major support is near the 50-hour simple moving average or $73.80. The next major support on the WTI crude oil chart is near $71.00.
If there is a downside break, the price might decline toward $67.15. Any more losses may perhaps open the doors for a move toward the $65.00 support zone.
Start trading commodities with tight spreads. Open your trading account now or learn more about trading commodity CFDs with FXOpen.
This article represents the opinion of the Companies operating under the FXOpen brand only. It is not to be construed as an offer, solicitation, or recommendation with respect to products and services provided by the Companies operating under the FXOpen brand, nor is it to be considered financial advice.
USDCAD Rebounds Strongly, Crucial Trendline in Sight
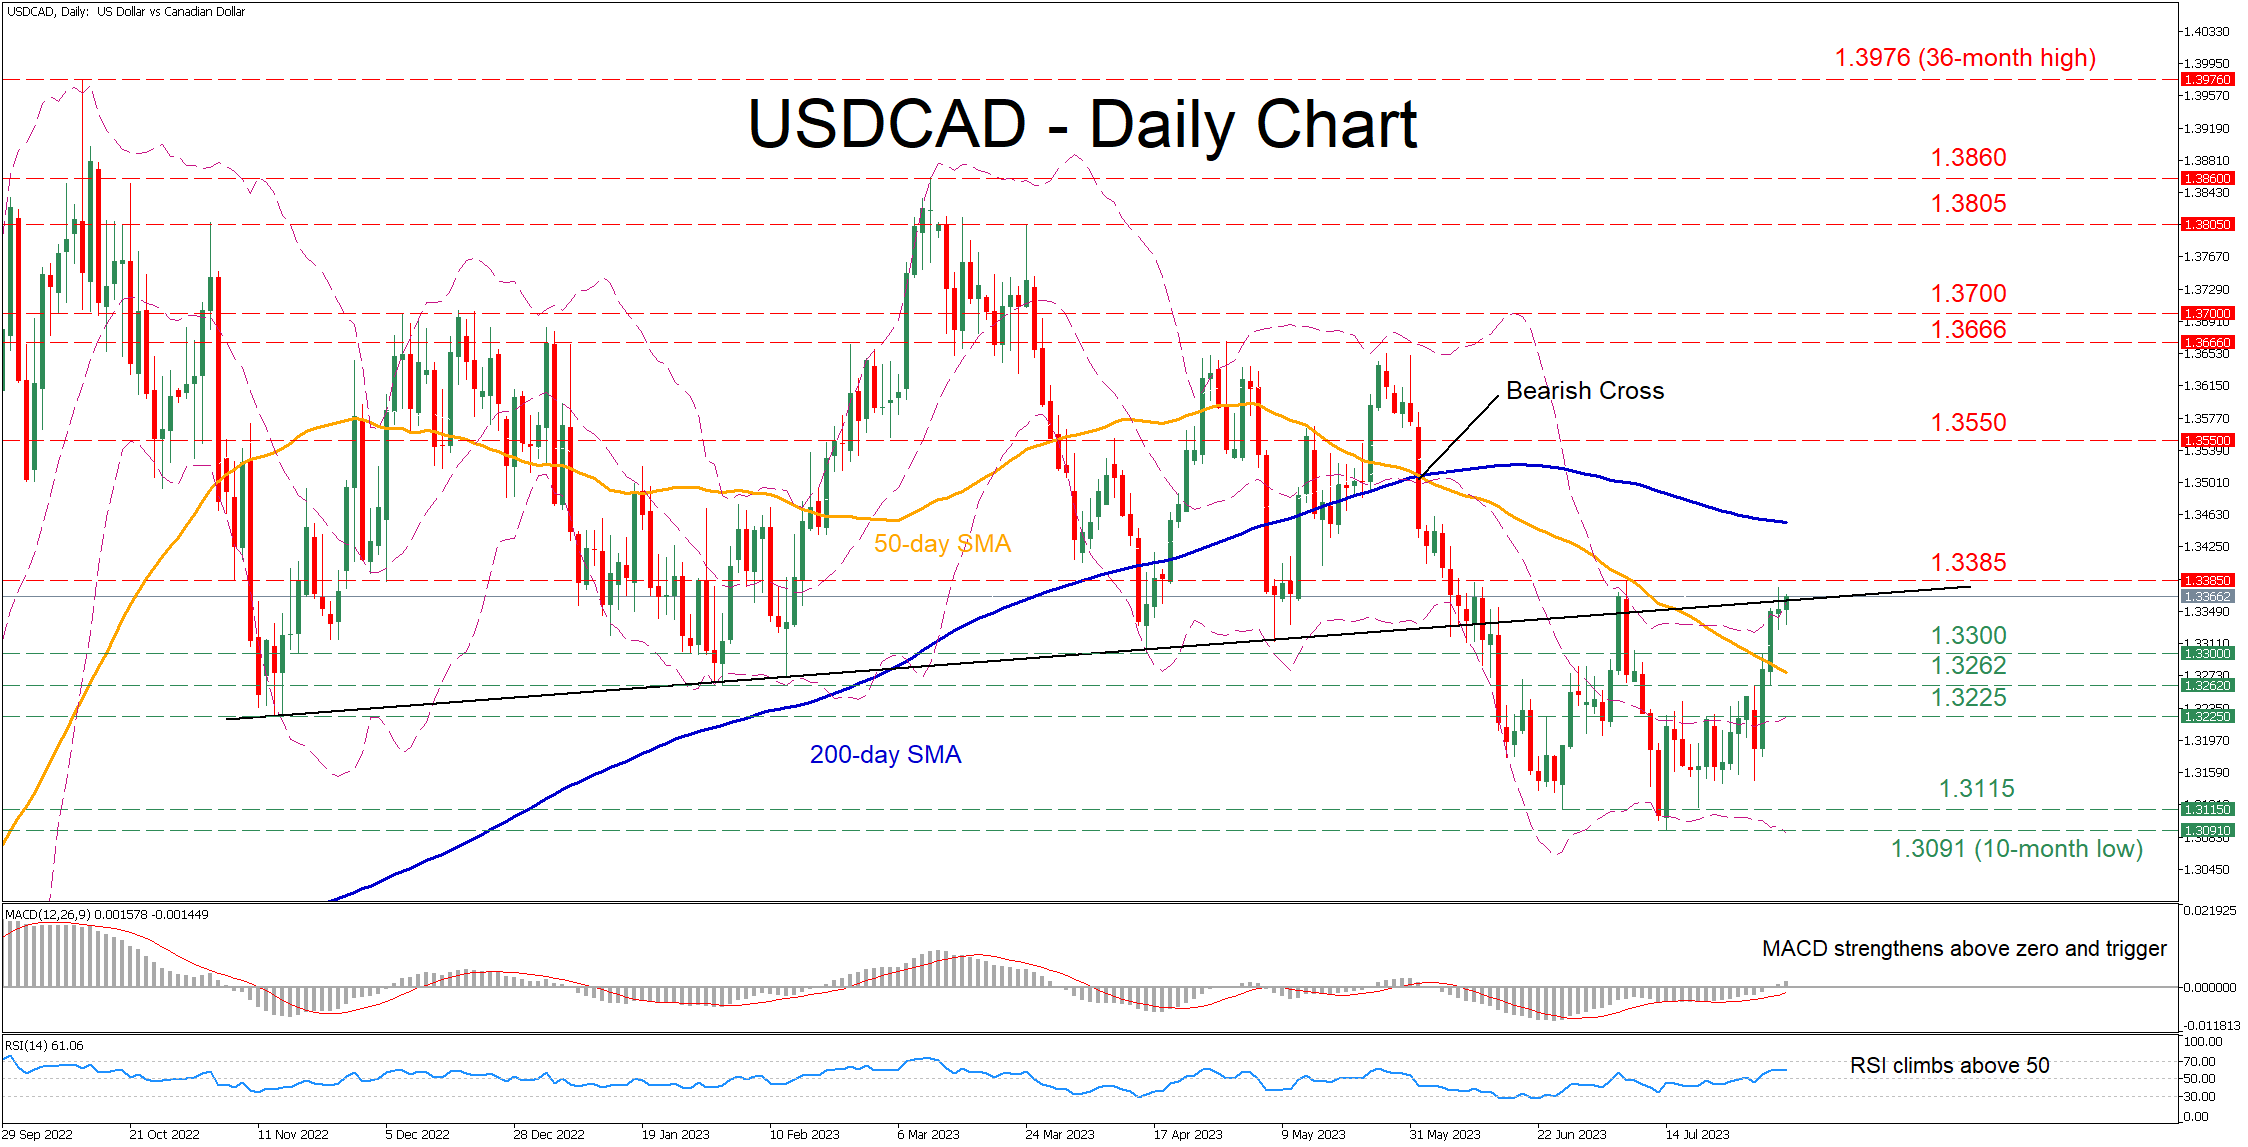
USDCAD had been in a steady downtrend since early March, generating a clear structure of lower lows. However, the pair found its feet at the 10-month bottom of 1.3091 and attempted to recoup some losses, with the price testing the ascending trendline that connects the pair's higher lows from November 2022 until early May.
The momentum indicators are endorsing this latest rebound. Specifically, the MACD is strengthening above zero and its red signal line at its highest level since June 1, while the RSI jumped above its 50-neutral threshold.
Should the price extend its advance above the upward sloping trendline, initial resistance could be found at the July peak of 1.3385. Piercing through that wall, the pair could face 1.3550 before the April peak of 1.3666 appears on the radar. If the latter fails, the spotlight could turn to the 1.3700 psychological mark, which held strong in December 2022.
Alternatively, should the recent rebound fizzle out, the price may retrace lower to test the April bottom of 1.3330 before a series of lows that constitute the ascending trendline come under examination. Thus, a drop below that region could trigger a decline towards the February low of 1.3262 ahead of the August 2022 bottom of 1.3225. Even lower, the 1.3115 hurdle could provide downside protection.
In brief, USDCAD has been staging a mild recovery after its steep decline came to a halt at a fresh 2023 low. For that rebound to continue, the price needs to decisively cross above the ascending trendline.