Sample Category Title
GBP/USD Daily Outlook
Daily Pivots: (S1) 1.2644; (P) 1.2686; (R1) 1.2751; More...
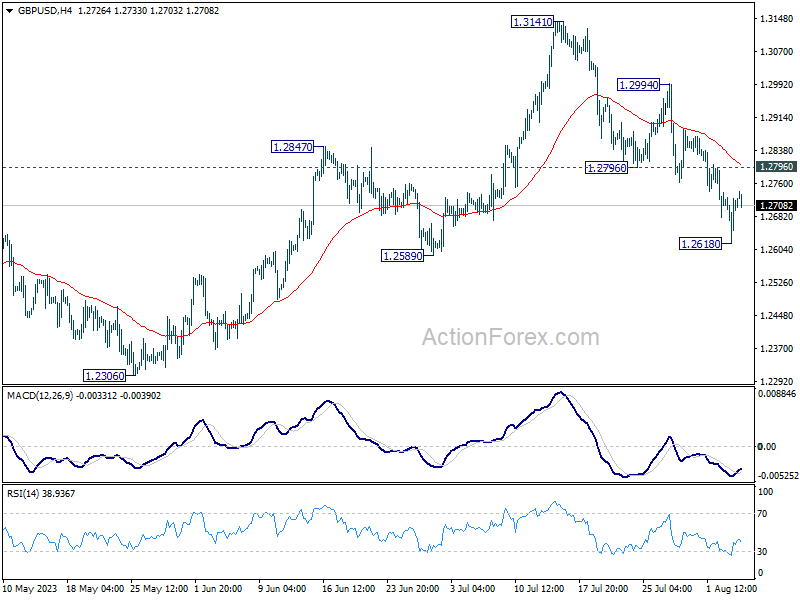
GBP/USD recovered after hitting 1.2618 and intraday bias is turned neutral first. On the downside, break of 1.2618 and sustained trading below 1.2678 resistance turned support will argue that it's already in a larger correction and target 1.2306 support next. Nevertheless, strong rebound from current level, followed by break of 1.2796 resistance, will retain near term bullishness and turn bias back to the upside.
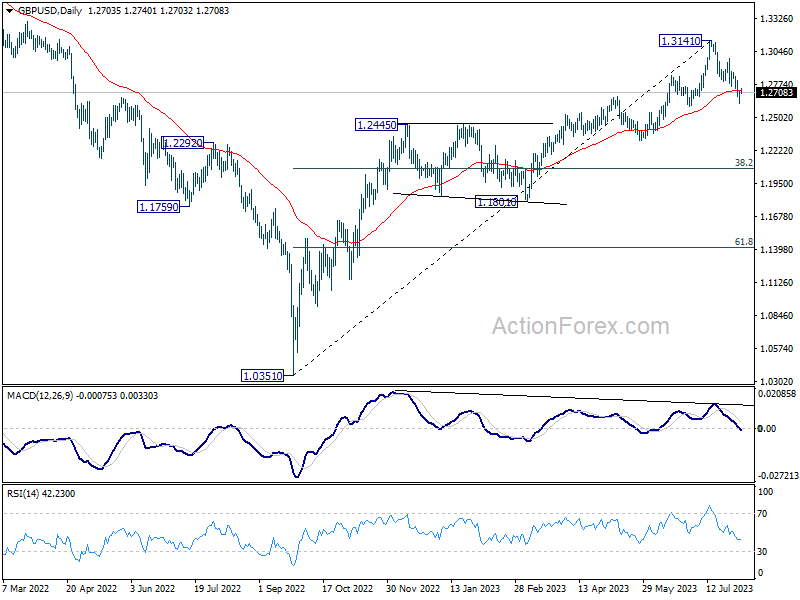
In the bigger picture, the break of 55 D EMA (now at 1.2724) is raising the chance of medium term topping at 1.3141. This is also supported by bearish divergence condition in D MACD. Sustained trading below 1.2678 will indicate that fall from 1.3141 is at least correcting whole up trend from 1.0351, with risk of bearish reversal. Deeper fall would be seen back to 38.2% retracement of 1.0351 to 1.3141 at 1.2075.
USD/JPY Daily Outlook
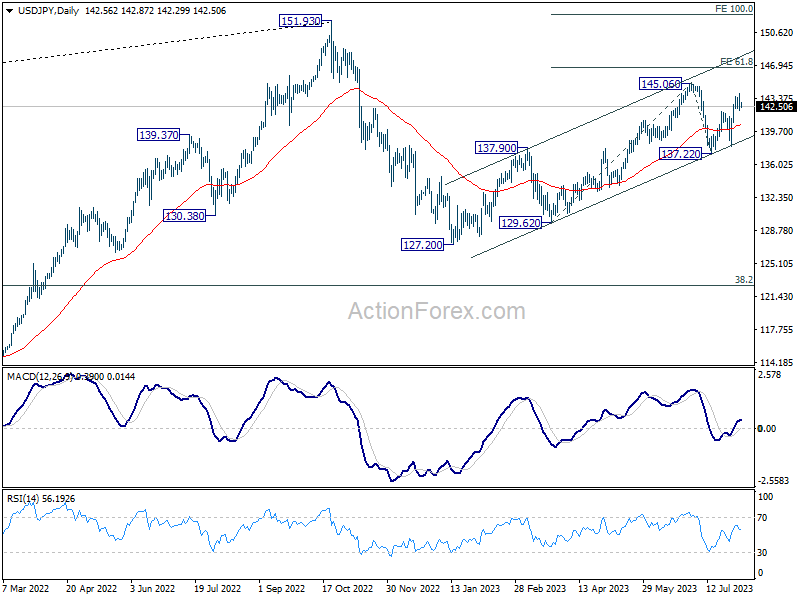
Daily Pivots: (S1) 142.56; (P) 143.01; (R1) 143.79; More...
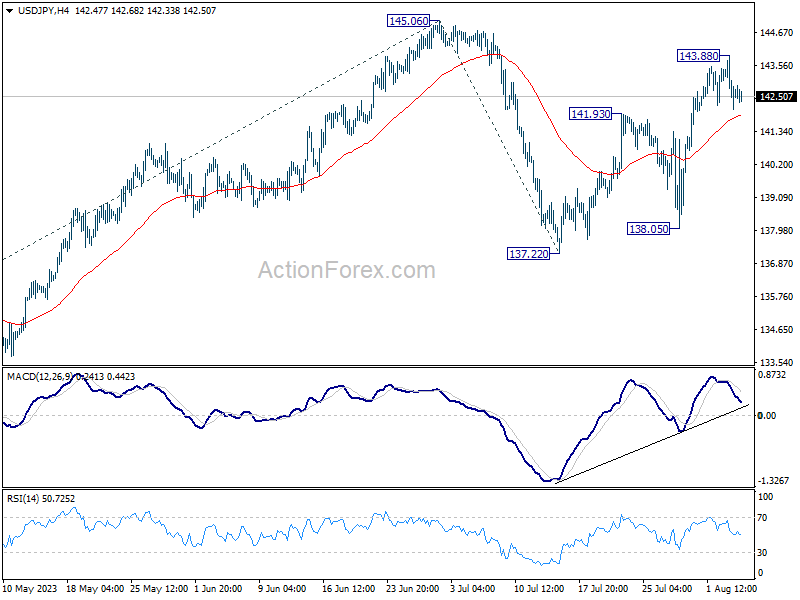
Intraday bias in USD/JPY stays neutral at this point. On the upside, above 143.88 will target a retest on 145.60 resistance first. Decisive break there will resume whole rally from 172.20. Next target is 61.8% projection of 129.62 to 145.06 from 137.22 at 146.76. However, sustained trading below 55 4H EMA (now at 141.87) will turn bias back to the downside for 137.22/138.05 support zone instead.
In the bigger picture, overall price actions from 151.93 (2022 high) are views as a corrective pattern. Rise from 127.20 is seen as the second leg of the pattern and could still be in progress. But even in case of extended rise, strong resistance should be seen from 151.93 to limit upside. Meanwhile, break of 137.22 support should confirm the start of the third leg to 127.20 (2023 low) and below.
CHFJPY Pullbacks Are Expected To Remain Supported
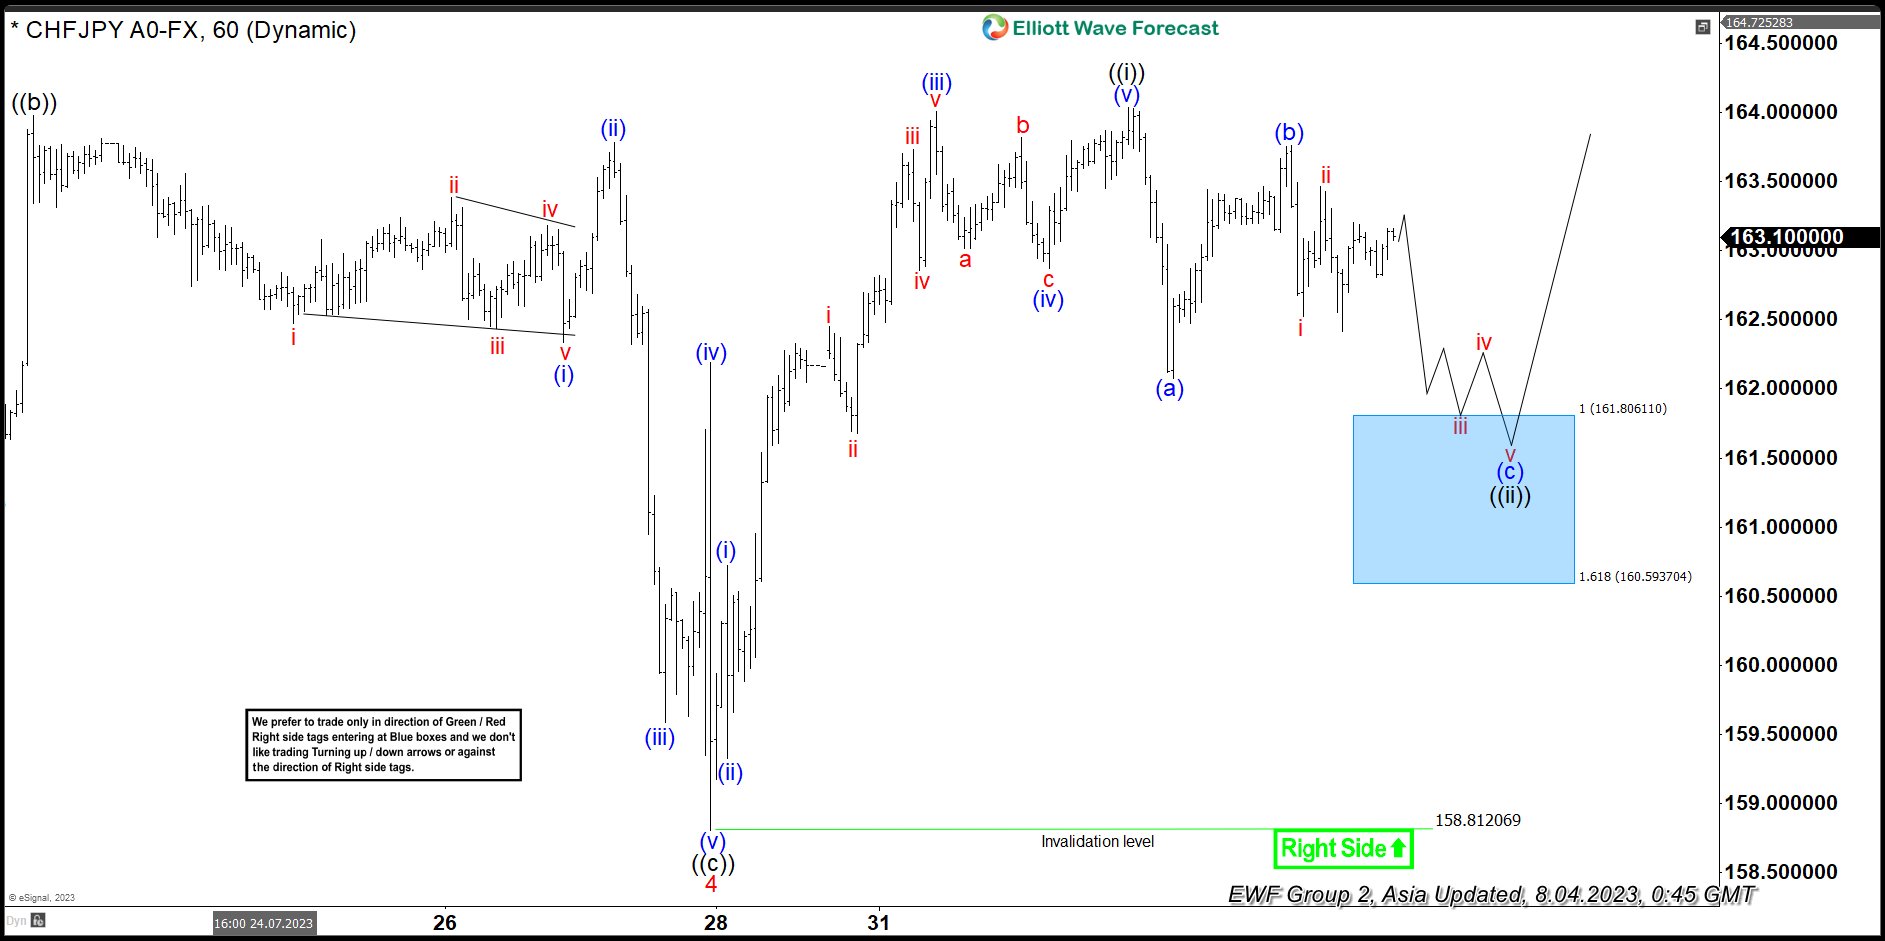
The Elliott wave view in the CHFJPY suggests that the pair should remain supported in 3, 7, or 11 swings & extend higher. Because the main cycle from the 13 January 2023 low is having a higher high impulse sequence favoring more upside to take place. Within the short-term sequence, the pullback in wave 4 unfolded as an expanded flat correction where wave ((a)) ended at 161.28 low. Wave ((b)) bounce ended at 163.98 high and ((c)) ended in a lesser degree 5 waves at 158.81 low.
Up from there, the pair rallied higher once again & managed to see a break above the 163.98 high. Thus confirming the next extension higher in the pair. The rally unfolded in an impulse sequence within wave ((i)) where lesser degree wave (i) ended at 160.72 high. Wave (ii) ended at 159.32 low, and wave (iii) ended at 164 high. Then wave (iv) ended at 162.87 low, and wave (v) ended at 164.03 high. Down from there, the pair is doing a wave ((ii)) pullback to correct the cycle from 7.28.2023 low. The internals of that pullback is unfolding as a zigzag structure where wave (a) ended at 162.07. Wave (b) ended at 163.76 high and wave (c) is expected to reach 161.80- 160.59 100%-161.8% Fibonacci extension area of (a)-(b). From there, the pair is expected to resume the upside or should produce a 3-wave bounce at least.
CHFJPY 1 Hour Elliott Wave Chart From 8.04.2023
CHFJPY Elliott Wave Video
https://www.youtube.com/watch?v=MNXjvgwpnDg
China Announced Several Measures to Rejuvenate Its Capital Markets
Markets
And another sell-off in core bonds yesterday. US Treasuries underperformed, especially at the long end. Yields shot up between 0.3 (2-y) and 11.6 (30-y) bps. It’s an extension of what has been happening all week, with the US Treasury ramping up supply and a strong ADP job report on Wednesday serving as the latest catalyst. The 30-y at some point was less than 10 bps away from its October 2022 cycle high. The US services ISM fell slightly below expectations (52.7 vs 53.1, down from 53.9) but new orders (55.0) were solid. And more importantly: prices paid rose from 54.1 to 56.8. It’s the biggest one-month jump since August 2021 and the first increase since October last year, barring the negligible rise in April this year. German yields rose 2.1-7.0 bps in a further dis-inversion of the curve. Rising oil prices also helped yield higher. The Saudi’s (1m barrels) and Russia (300k) decided to extend the voluntary production cut into September with the former hinting at deeper production curbs. Brent recovered from an intraday low at $82.36 to close above $85. Higher energy/commodity prices could spell trouble for central bank’s inflation battle. For all the bond violence, moves on other markets were muted. European stocks underperformed (SX5E -0.7%, Wall Street no more than -0.25%). The dollar was unable to profit with EUR/USD leaving eventually leaving the lows behind to close at 1.0949. The trade-weighted DXY took a breather around 102.54 after the recent surge. Sterling initially extended losses post-BoE amid a 10 bps UK yield collapse (2-y). But as rates recovered in line with global market moves, EUR/GBP eventually finished only marginally higher, north of 0.86.
China this morning announced several measures to rejuvenate its capital markets. It is part of a series of other decisions it took earlier this week in the broader context of kickstarting the ailing economy. The country also said additional support is coming up. Chinese stocks were thrilled at first but have been paring gains as the session evolved. They currently add up to 1.4%, still outperforming regional peers though. The yuan gapped higher but couldn’t maintain gains. USD/CNY moved from 7.15 to 7.18. The dollar generally eases against most of the G10 counterparts, extending yesterday’s pause. The core bond massacre also slow with US yields stabilizing around yesterday’s closing levels. Today’s US payrolls are the next big thing for markets. Consensus expects a solid 200k job growth. There are risks on both sides. ADP’s job report on Wednesday calls for an upside surprise but yesterday’s employment component (50.7 from 53.1) in the US services ISM offers some counterbalance. After the recent dramatic US yield surge markets may be more sensitive to a (slight) miss than a beat. The weekend and next week’s July CPI reading looming could also be a good enough reason for markets to hold a more cautious bias today. Support for the 10-y yield kicks in at 4.08/4.09%. The dollar in the same vein will probably find it difficult to build on recent strong gains. EUR/USD 1.1033/47 is the first reference to the topside.
News and views
The Czech koruna lost significant ground after yesterday’s CNB meeting. EUR/CZK seared from below 24 to a close of 24.24, the highest (CZK weakest) level since the start of the year. The sharp move came as the central bank at its meeting officially shelved its FX intervention tool since it hasn’t been using it Since October last year. With it, the CNB removed a backstop that put a solid floor below the CZK. It is perhaps also viewed by markets as a first (baby) step towards the monetary easing cycle. The new CNB forecasts project inflation to ease significantly in 2024 (2.1%) and 2025 (1.7%). But in setting the rate, the board uses alternative scenarios with upside inflation risks. To that end, the CNB continues to push back against premature rate cutting bets by markets and as suggested by its own model from September on. Instead it favours the policy rate to remain at the current level for a bit longer. The debate on rate cuts may not start before the fall, governor Michl (and others recently) said. KBC Economics expect a first 50 bps cut in Q4 this year without excluding a postponement until early 2024.
Technical Outlook and Review
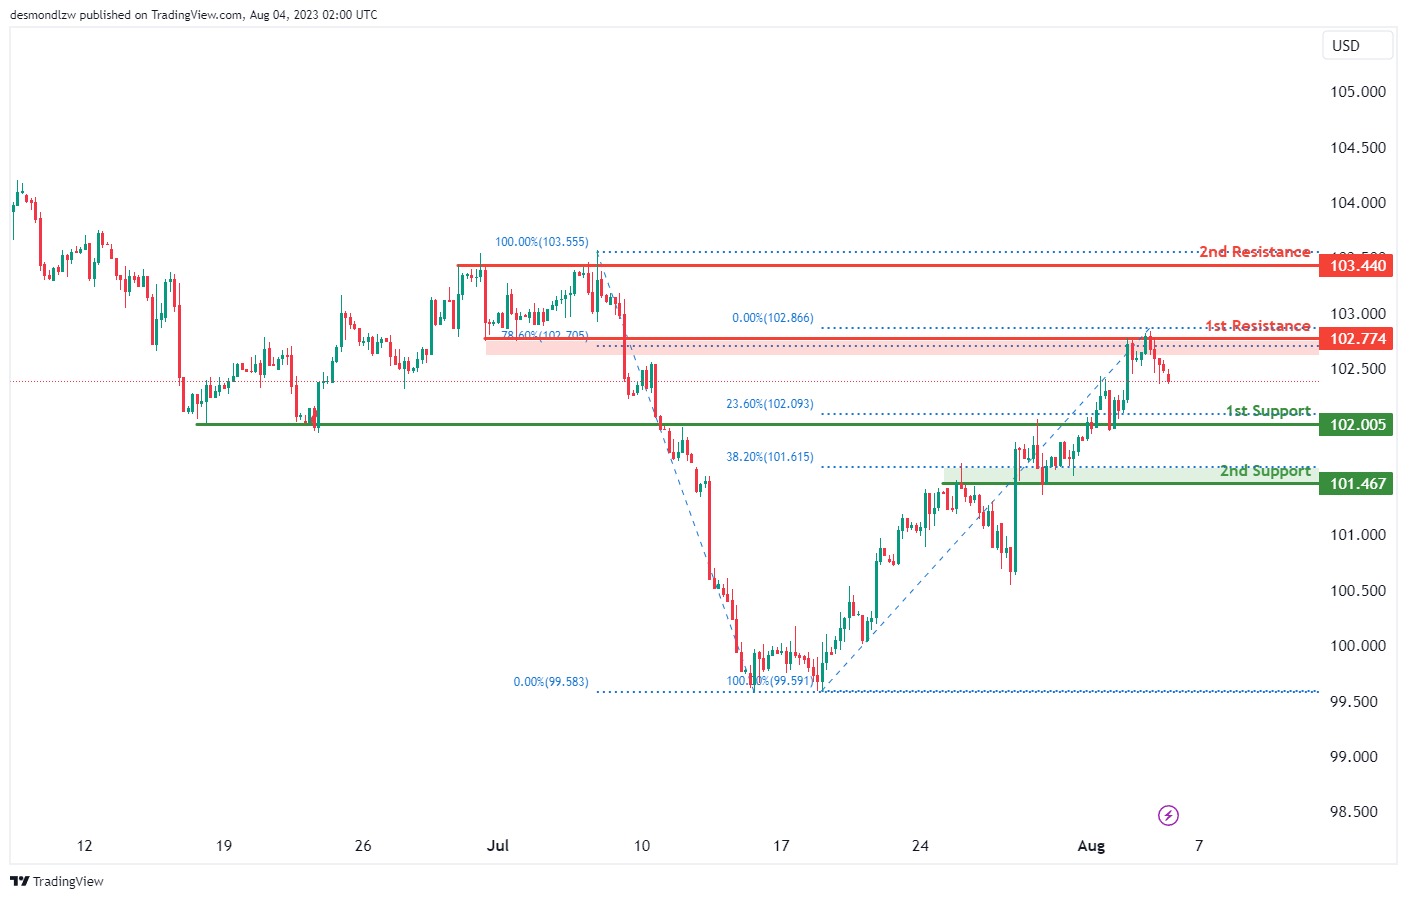
DXY:
The DXY instrument is currently in a bearish trend, with a potential for a bearish continuation towards the 1st support level at 102.00. This support level serves as a pullback support and aligns with the 23.60% Fibonacci Retracement level.
If the price declines past the 1st support, the 2nd support level at 101.46, also acting as an overlap support, is expected to prevent further decline. This level aligns with the 38.20% Fibonacci Retracement.
On the other hand, if the price starts to rise, the 1st resistance at 102.77, functioning as an overlap resistance, might hinder bullish progression. This level coincides with the 78.60% Fibonacci Retracement. If the price surges past this resistance, the 2nd resistance at 103.44, which corresponds to a multi-swing high resistance, could pose an additional obstacle.
EUR/USD:
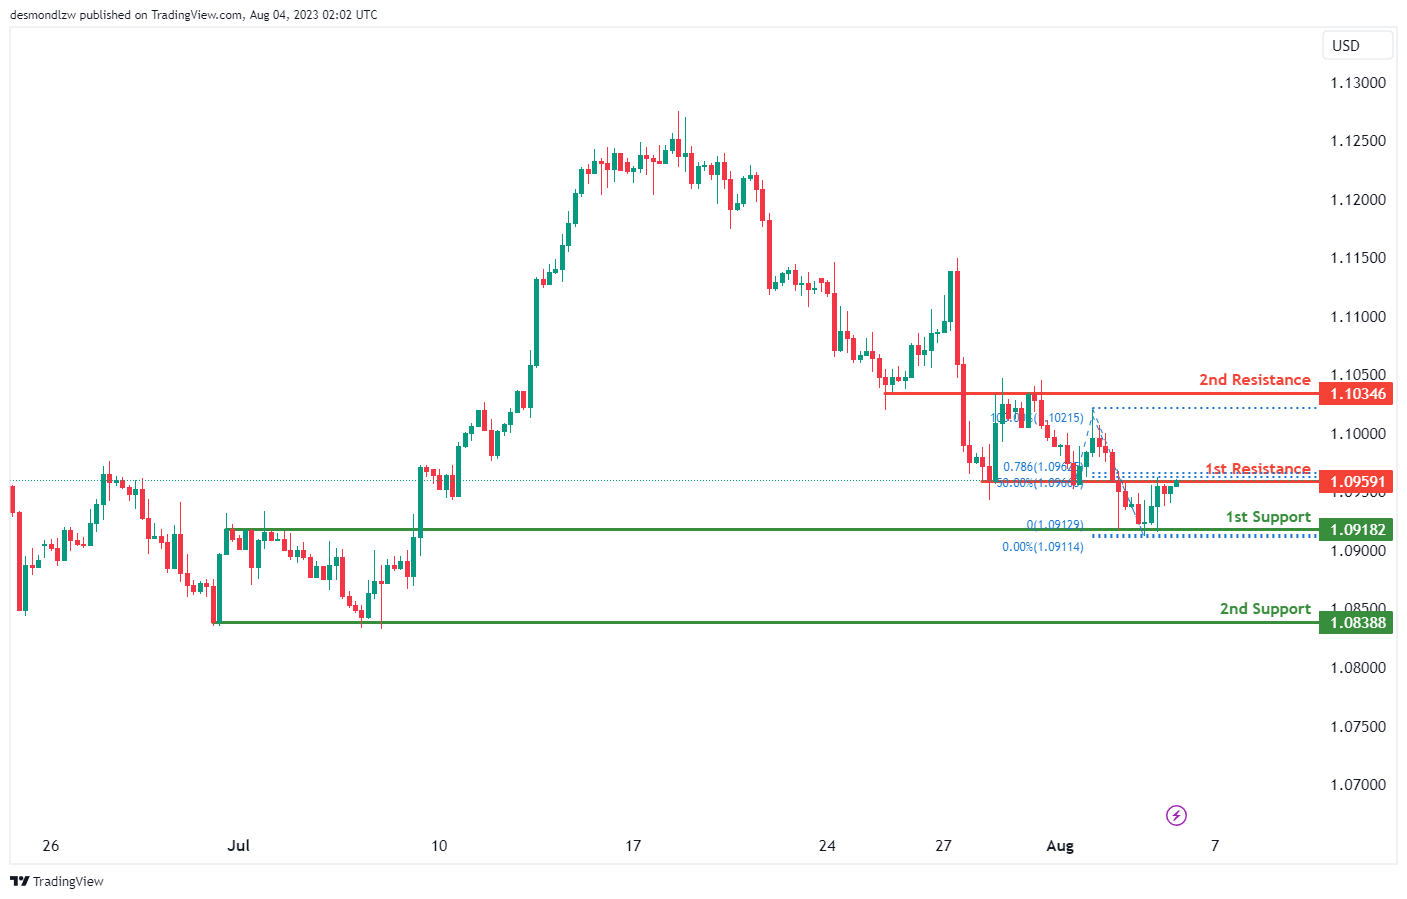
The EUR/USD pair is currently showing a bullish trend. However, in the short term, we could potentially see a drop towards the 1st support level at 1.0918. This support level acts as an overlap support which may hold the price.
If the price breaks below the 1st support level, we can expect the 2nd support at 1.0838 (a multi-swing low support) to act as a strong barrier to prevent further decline.
If the price bounces off from the support levels, the 1st resistance to challenge the bulls would be at 1.0959. This level serves as an overlap resistance and is also in line with the 78.60% Fibonacci Projection level.
Should the price move beyond this point, the 2nd resistance at 1.1034 (also an overlap resistance) could pose a further obstacle to upward price movement.
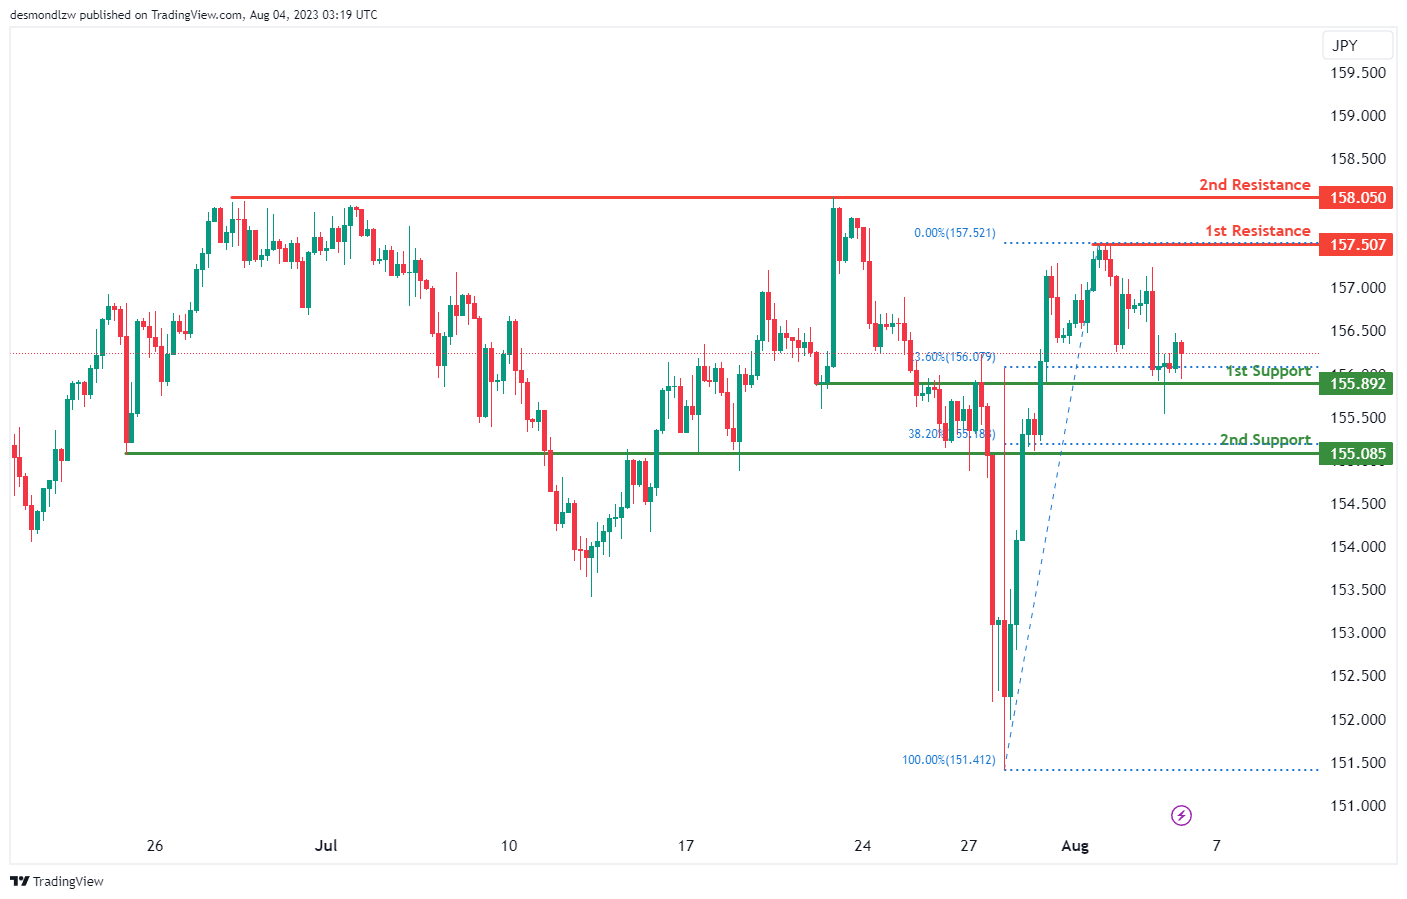
EUR/JPY:
EUR/JPY exhibits a bullish momentum on the chart and there is potential for a bullish bounce off the 1st support and a move towards the 1st resistance.
The 1st support level is at 155.89 and can be identified as an overlap support, which coincides with the 23.60% Fibonacci retracement level, potentially providing a strong base for the price.
If the price drops further, the 2nd support level at 155.08, being a pullback support and aligning with the 38.20% Fibonacci retracement level, could provide a strong floor for the price.
On the upside, the 1st resistance is at 157.50. This level serves as a multi-swing high resistance and is in line with the 100% Fibonacci projection level, indicating a significant level for potential price reversal.
Should the bullish momentum continue, the 2nd resistance level to watch would be at 158.05. This level is a multi-swing high resistance and could provide another target for buyers.
EUR/GBP:
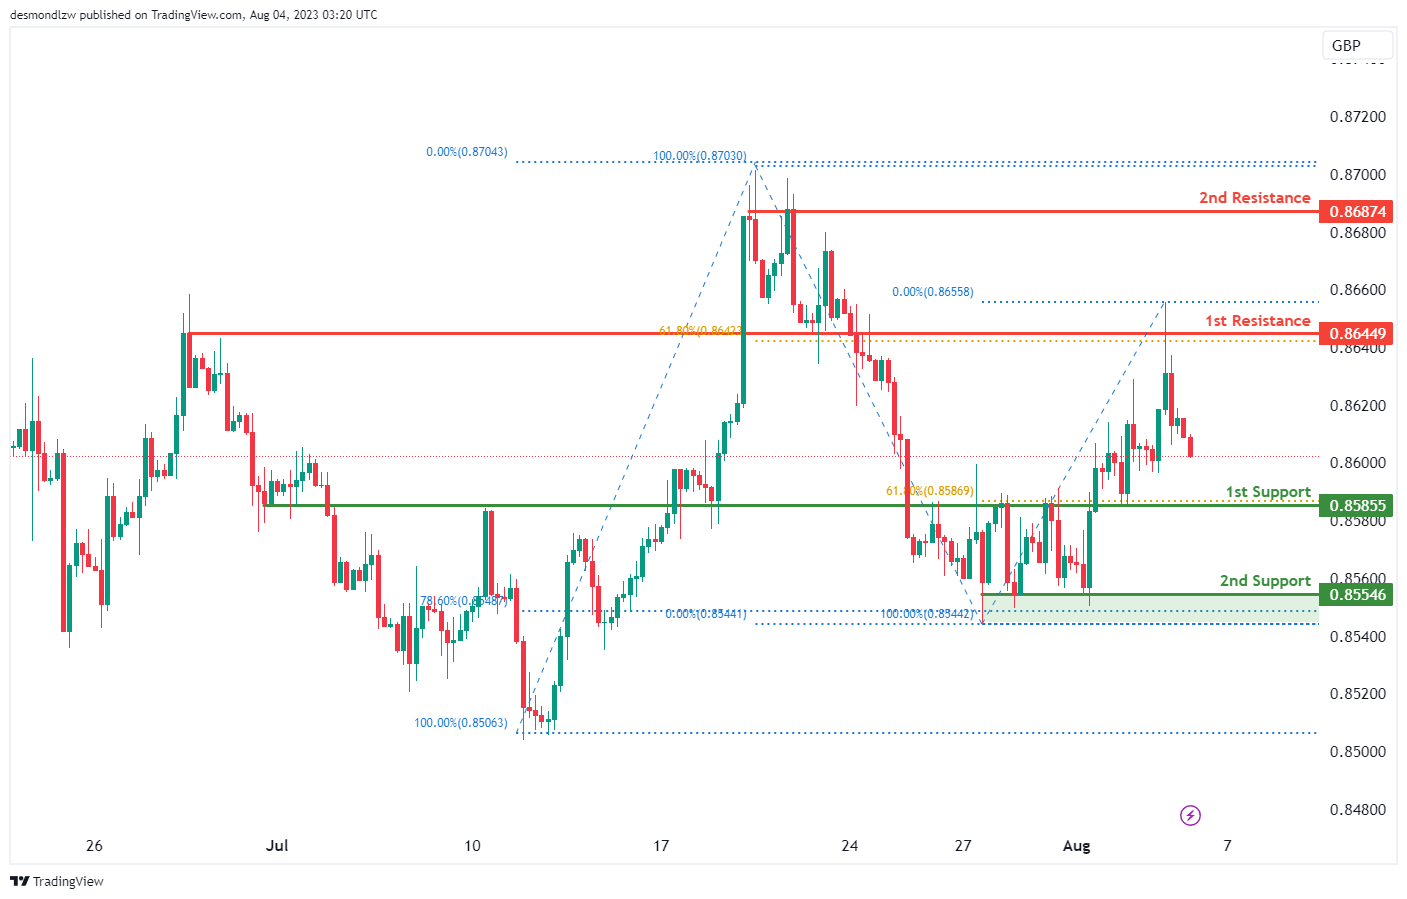
The EUR/GBP chart exhibits a bearish momentum and there is potential for a bearish continuation towards the 1st support.
The 1st support level is at 0.8585 and it can be identified as an overlap support, coinciding with the 61.80% Fibonacci retracement level. This confluence could potentially provide a strong floor for the price.
Should the price decline further, the 2nd support level is at 0.8554. This level, being a multi-swing low support and aligning with the 38.20% Fibonacci retracement level, could provide another base for the price.
On the upside, the 1st resistance level is at 0.8644. This level serves as an overlap resistance and coincides with the 61.80% Fibonacci retracement level, indicating a significant level for potential price rejection.
Should the bearish momentum stall and a reversal occur, the 2nd resistance level to watch would be at 0.8687.
GBP/USD:
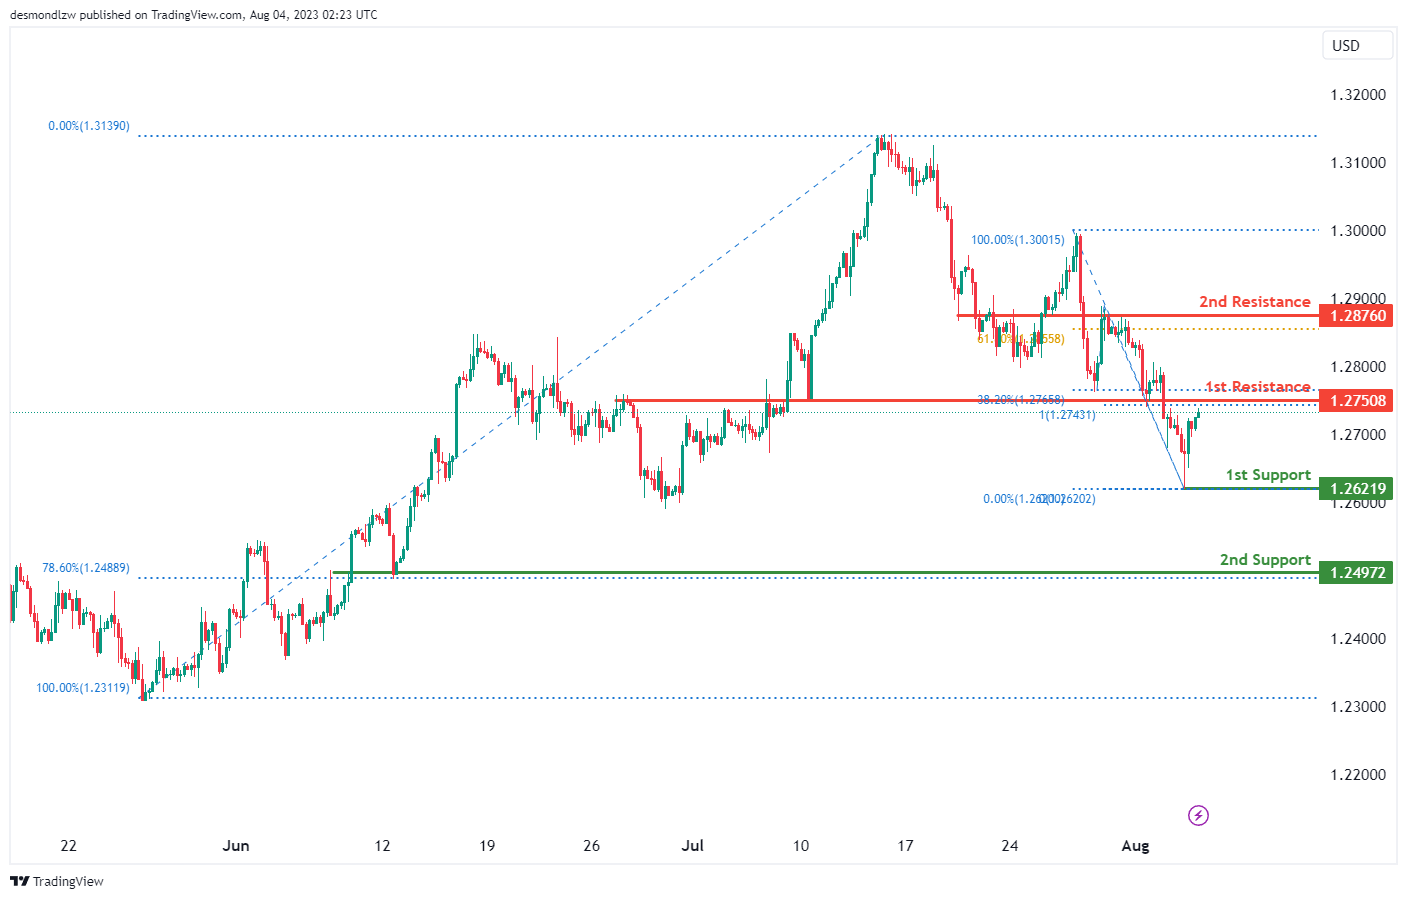
The GBP/USD pair currently shows a bullish trend. However, in the short term, we might see a drop towards the 1st support level at 1.2621, which serves as a swing low support, before it bounces back towards the resistance levels.
If the price dips below the 1st support level, the next potential floor is the 2nd support at 1.2497. This is an overlap support and also corresponds to the 78.60% Fibonacci retracement level, providing a solid barrier against further price decline.
On the other hand, if the price rebounds off from the support levels and starts ascending, the 1st resistance level at 1.2750 could pose a challenge to the bulls. This level acts as an overlap resistance and aligns with the 38.20% Fibonacci retracement and 100% Fibonacci projection levels, indicating a potential area of Fibonacci confluence.
Should the price momentum remain bullish and break through the 1st resistance, the 2nd resistance at 1.2876 (an overlap resistance corresponding to the 61.80% Fibonacci retracement level) could stand as the next hurdle for the bulls.
GBP/JPY:
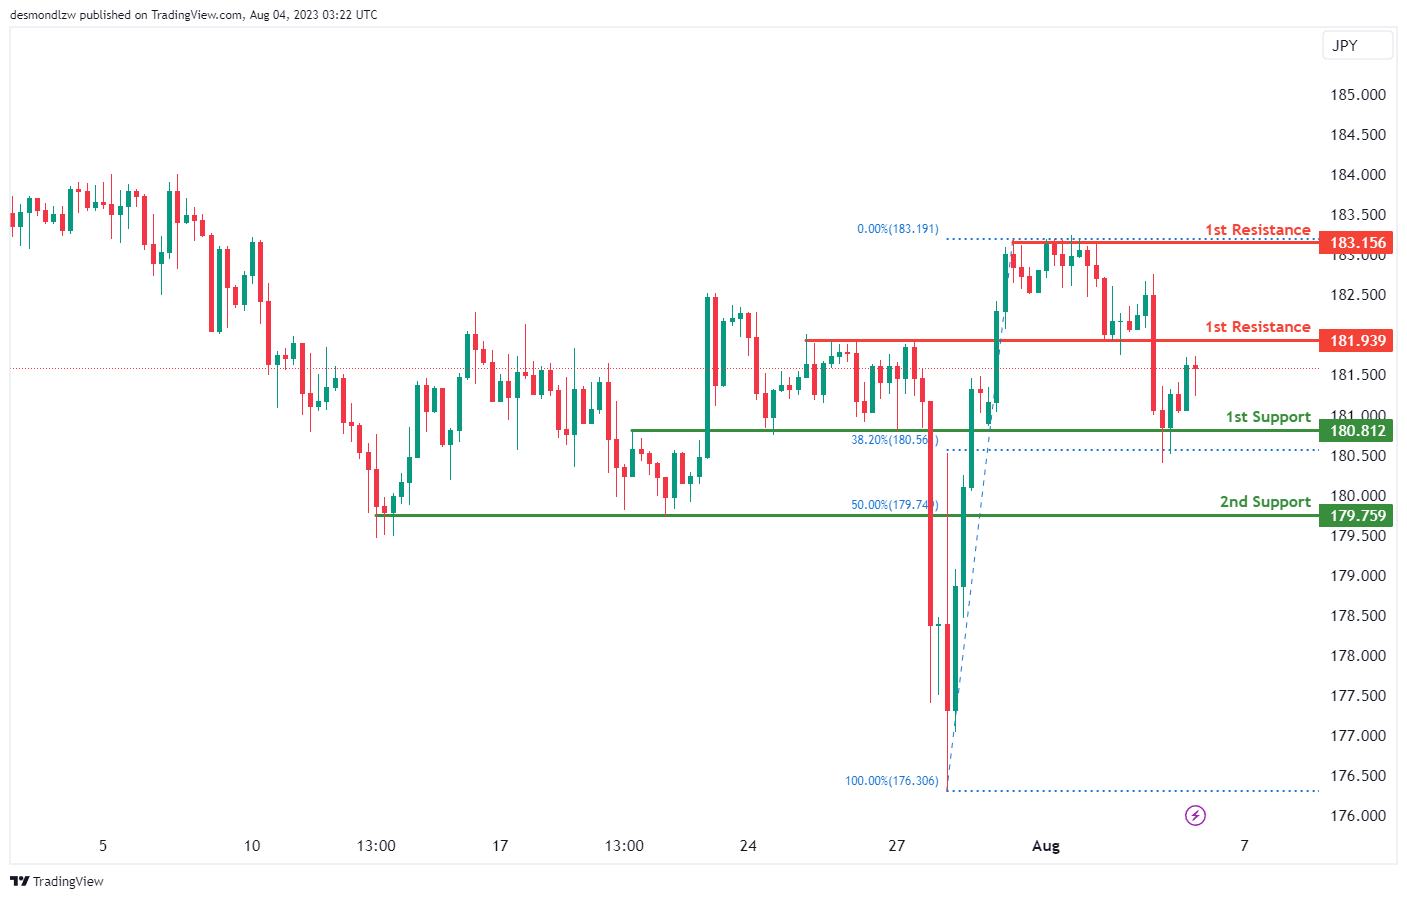
The GBP/JPY chart shows a bullish momentum, indicating potential for a bullish continuation towards the 1st resistance.
The 1st support level is at 180.81. This overlap support level aligns with the 38.20% Fibonacci retracement, making it a significant price level.
If the price drops further, the 2nd support level is at 179.75. This is considered a pullback support and coincides with the 50% Fibonacci retracement, providing another substantial price floor.
On the upside, the 1st resistance level is at 181.93. This pullback resistance could serve as an initial barrier for the price on its upward path.
If the bullish momentum continues and the price breaks through the 1st resistance, the 2nd resistance to watch is at 183.15. This multi-swing high resistance level could potentially halt the price rise or induce a price reversal.
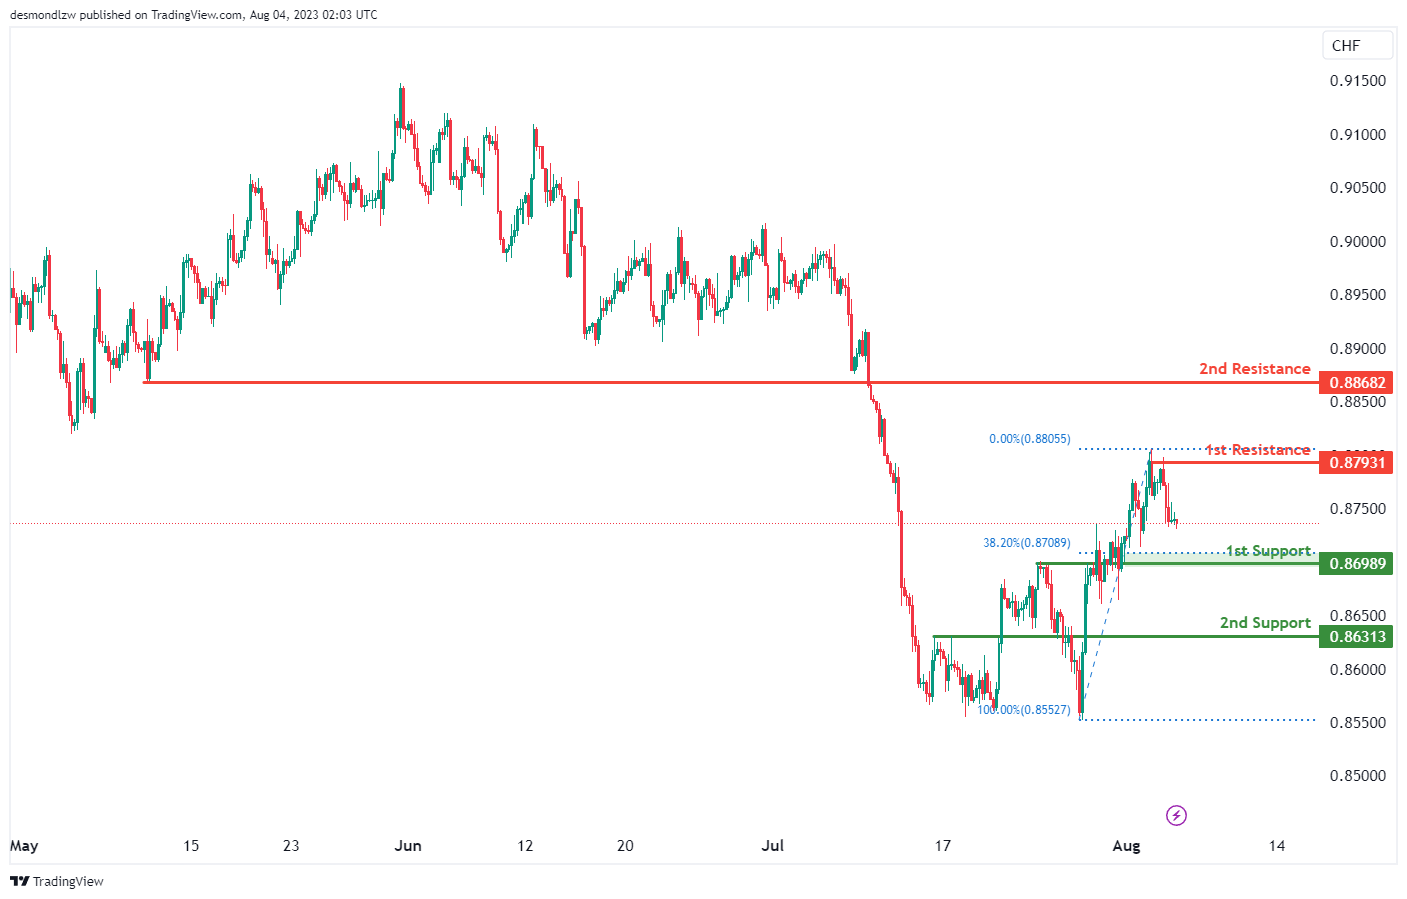
USD/CHF:
The USD/CHF pair is currently on a bearish trend, which suggests that the price might continue to decline towards the 1st support level.
The 1st support level is at 0.8698, which serves as a pullback support, and also coincides with the 38.20% Fibonacci retracement level. This creates a potentially strong barrier against the further downward movement of the price.
If the price manages to break below the 1st support, the next key level to watch would be the 2nd support at 0.8631, which is also a pullback support.
In the event of a trend reversal and the price starts to rise, it may encounter resistance at the 1st resistance level of 0.8793. This level is considered as a swing high resistance, which could halt the upward movement of the price.
Should the upward momentum continue to the point of surpassing the 1st resistance, the next hurdle would be at the 2nd resistance level at 0.8868, which serves as a pullback resistance.
USD/JPY:
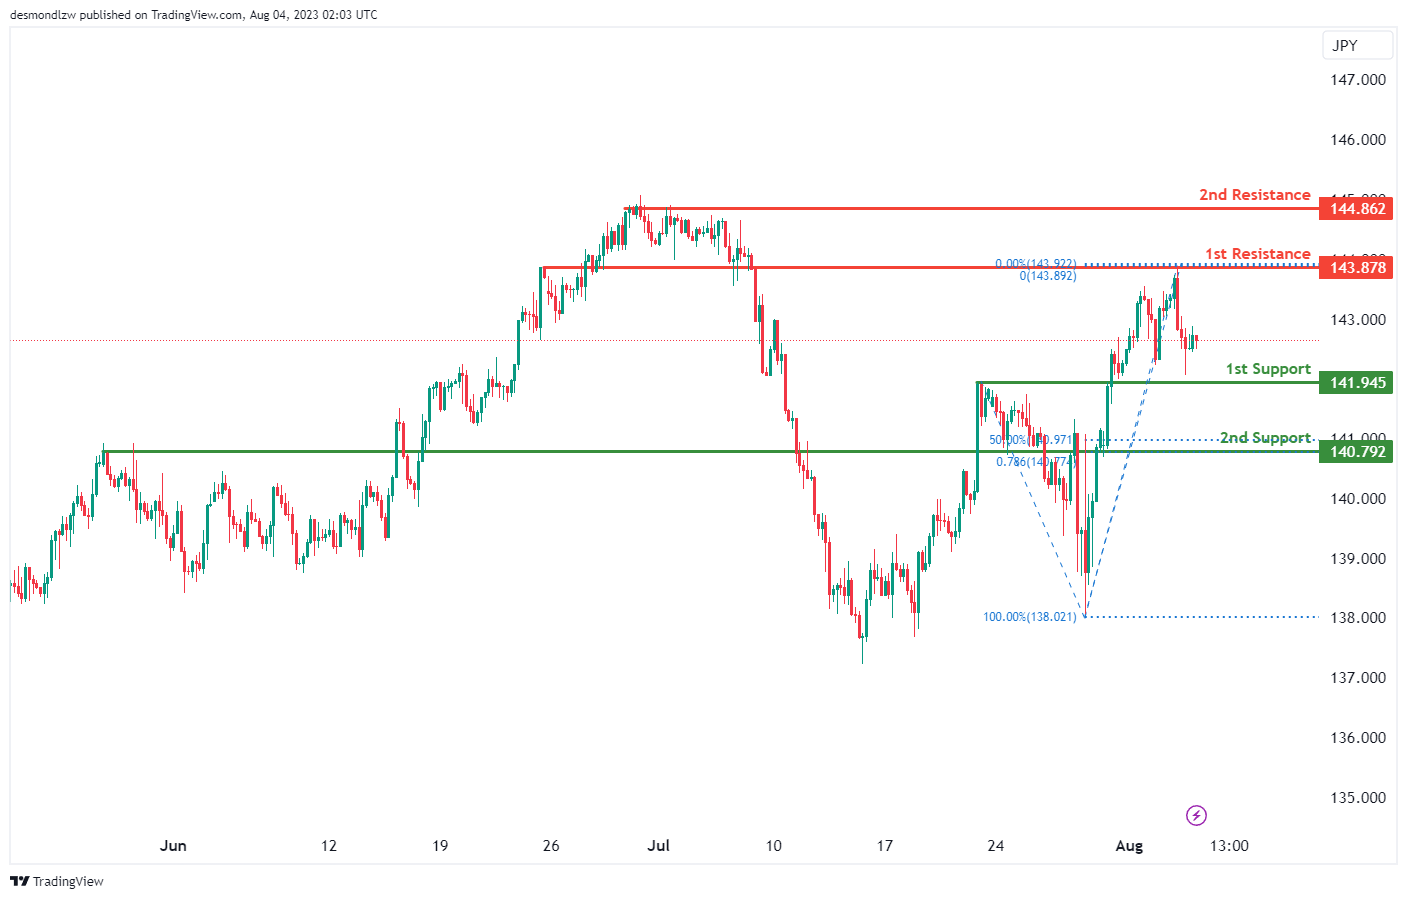
The USD/JPY pair is currently demonstrating a bearish trend, suggesting a continuation of this trend towards the 1st support level.
The 1st support level is at 141.94 and this has been determined as an overlap support, which has proven to be a strong barrier in the past, making it a significant level for traders to observe.
If the price breaks through this 1st support, the 2nd support level is at 140.79. This level is a pullback support and aligns with both the 50% Fibonacci retracement and 78.6% Fibonacci expansion. This confluence of Fibonacci levels adds to the credibility of this support level.
On the flip side, if there is a reversal of trend and the price begins to rise, the 1st resistance level is at 143.86, which is an overlap resistance. This could prove to be a significant obstacle for upward price movement.
Should the price manage to breach this 1st resistance, the 2nd resistance at 144.86 could come into play.
USD/CAD:
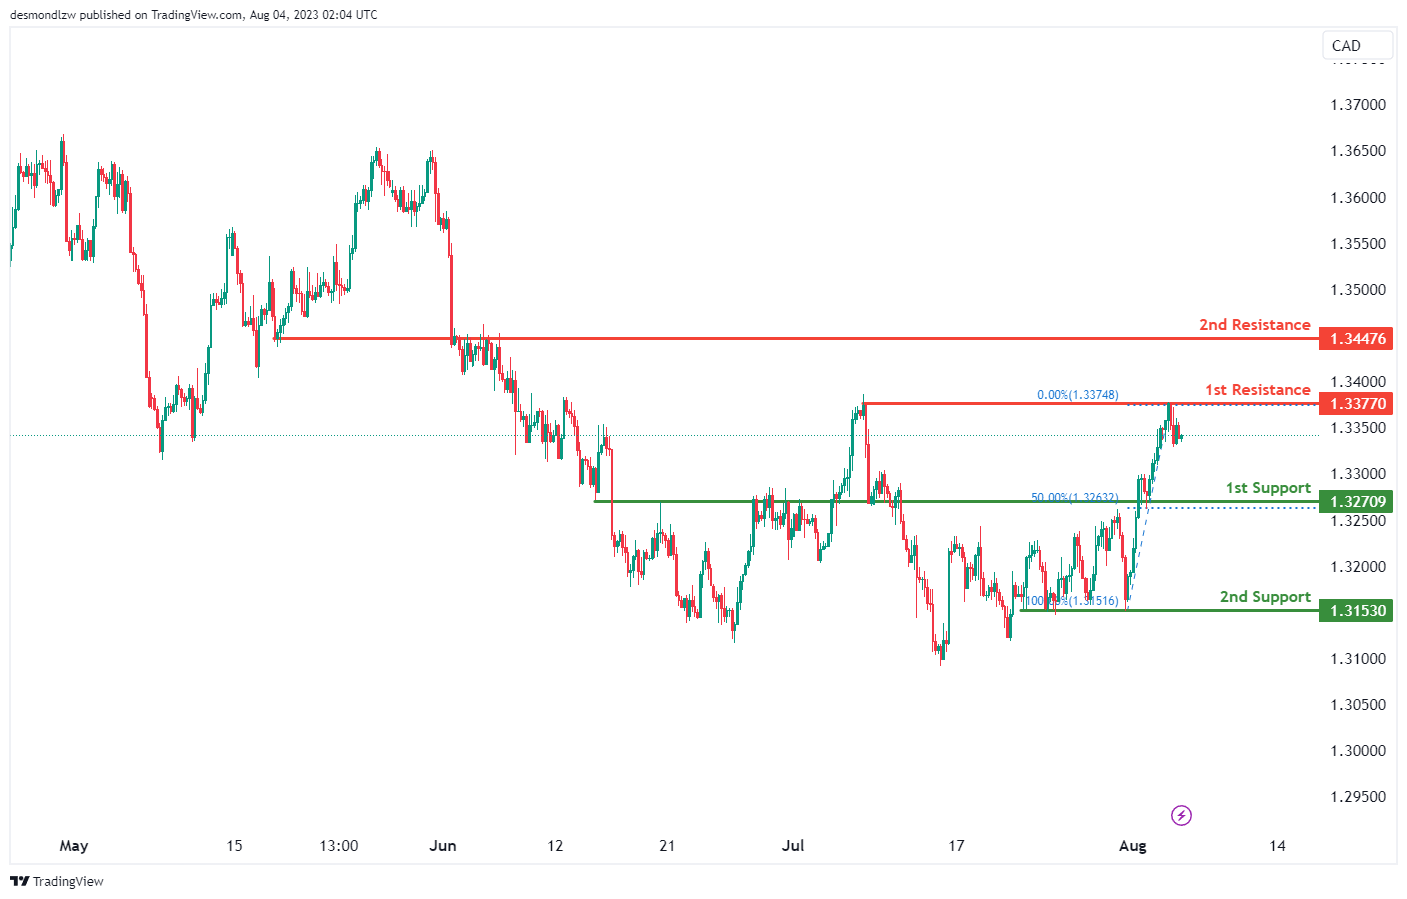
The USD/CAD pair is currently in a bearish trend, indicating a possible continuation of this trend towards the 1st support level.
The 1st support level is at 1.3270, identified as a pullback support. This is additionally reinforced by the 50% Fibonacci retracement level, suggesting it could be a significant level for traders to watch.
If the price breaks below this level, the 2nd support level is at 1.3253. This level has been recognized as a multi-swing low support, adding to its potential credibility.
On the other hand, if the trend reverses and the price starts to rise, the 1st resistance level is at 1.3377. This level is identified as a swing high resistance, making it a potential obstacle for an upward price movement.
Should the price break above this level, the 2nd resistance at 1.3447 may come into play. This level is an overlap resistance and could prove challenging for the bullish momentum to
AUD/USD:
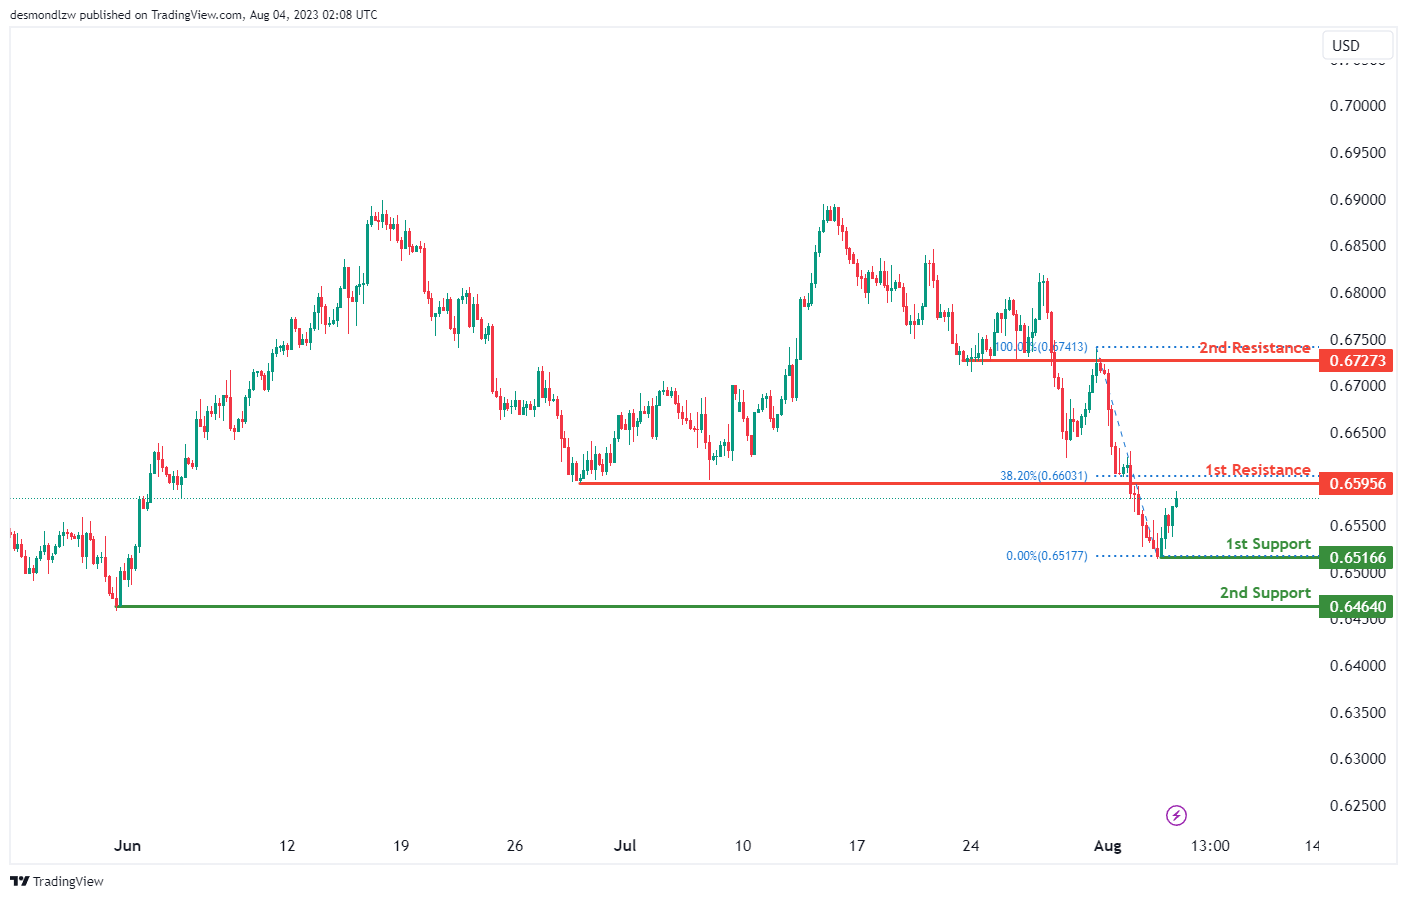
The AUD/USD pair is currently demonstrating a bearish trend. The expectation is for a bearish reaction off the 1st resistance level leading to a drop to the 1st support level.
The 1st support level is at 0.6595, recognized as a pullback support. This level might see an increase in buying pressure if the price continues to fall.
If the price breaches this level, the 2nd support level is at 0.6464. This level has been identified as a swing low support, indicating it could be a significant level for traders to monitor.
On the contrary, if the trend reverses and the price starts to rise, the 1st resistance level is at 0.6595. This level is identified as a swing high resistance and further reinforced by the 38.20% Fibonacci retracement level. This means it could be a challenging hurdle for an upward price movement.
Should the price break above this level, the 2nd resistance at 0.6727 may come into focus. This level is recognized as an overlap resistance, potentially presenting an obstacle for bullish momentum to continue.
NZD/USD
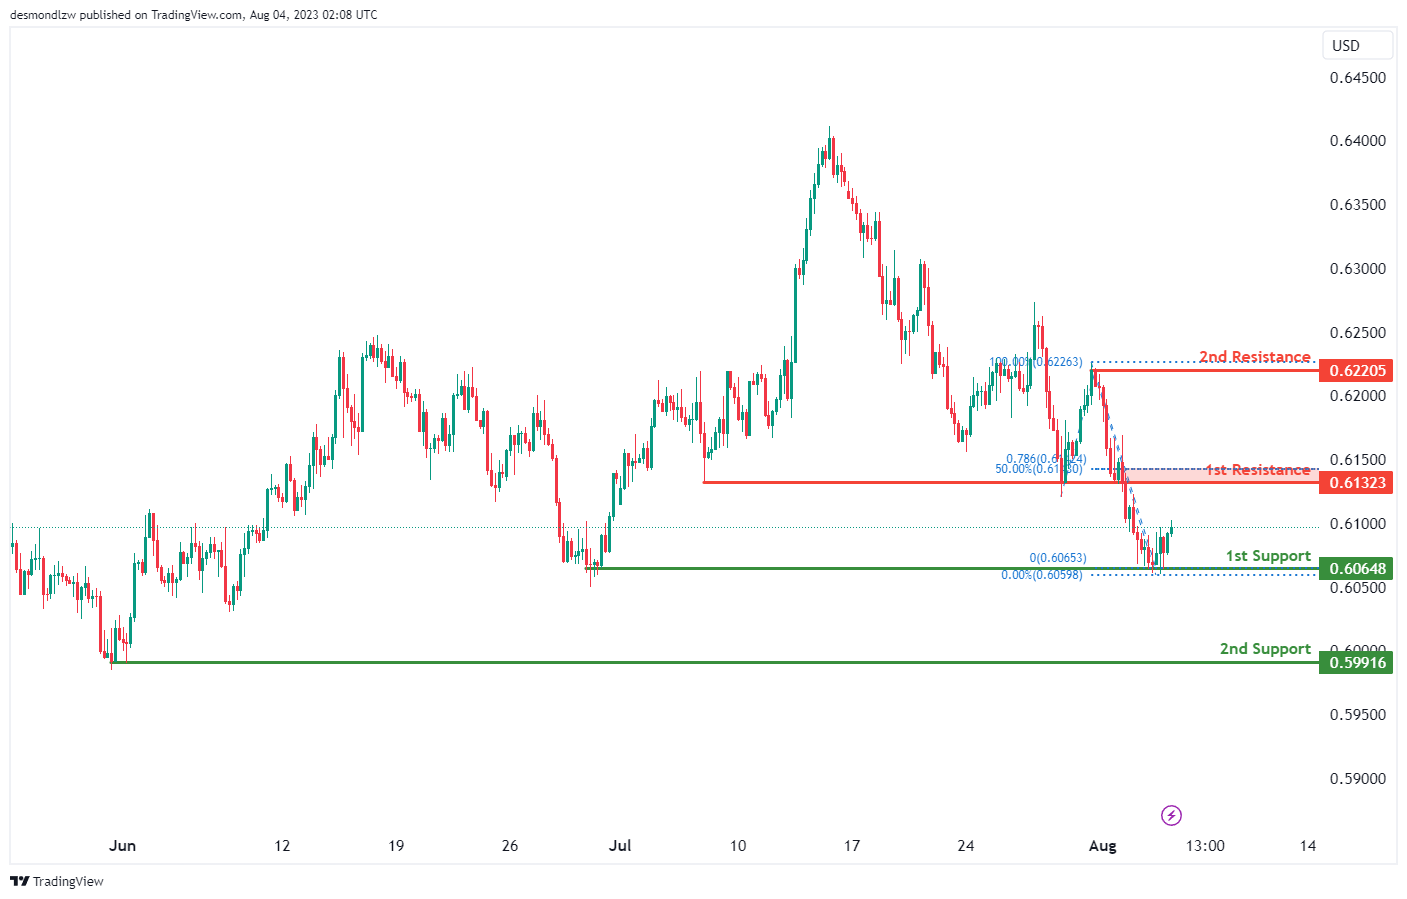
The NZD/USD pair is currently showing a bullish trend. The expectation is for a bullish continuation towards the 1st resistance level.
The 1st support level is at 0.6064. This level is identified as a multi-swing low support, suggesting that this level might attract buying interest if the price retreats.
If the price breaches this level, the 2nd support level is at 0.5991. This level has been identified as another multi-swing low support, indicating it could be a significant level for traders to monitor if the 1st support level is broken.
On the other hand, if the bullish trend continues, the 1st resistance level is at 0.6132. This level is identified as a pullback resistance and is further reinforced by the 50% Fibonacci retracement and 78.60% Fibonacci expansion levels, indicating a strong Fibonacci confluence. This means it could pose a challenge for the price to break through.
Should the price surpass this level, the 2nd resistance is at 0.6220. This level is recognized as a swing high resistance, suggesting that it could be a tough level for the bullish momentum to overcome.
DJ30:
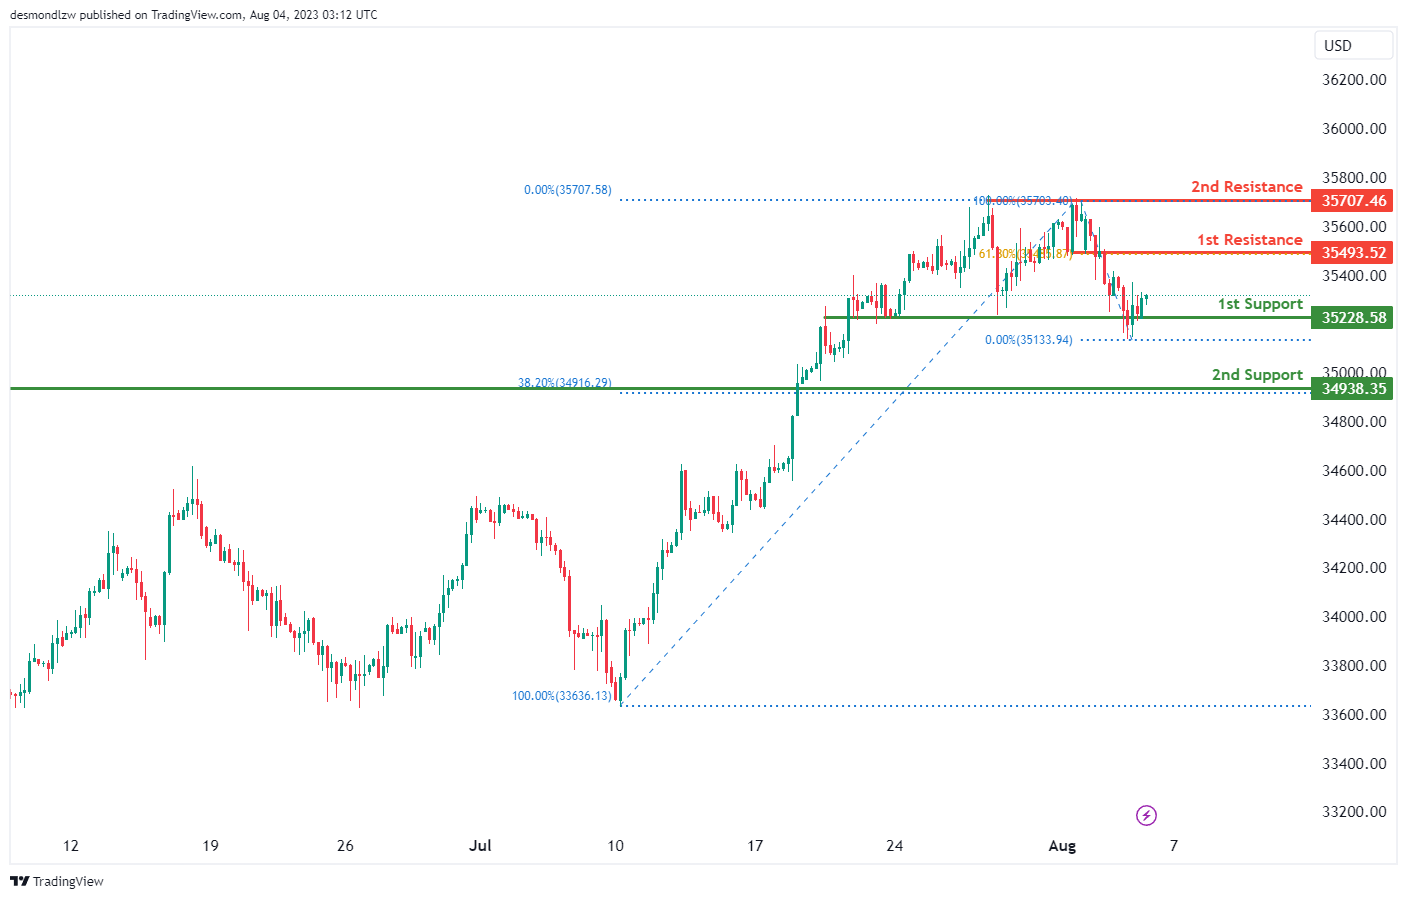
The DJ30 chart exhibits a bullish momentum, and there is potential for a bullish continuation towards the 1st resistance.
The 1st support level is at 35228.58 and is identified as an overlap support. This level could potentially provide a firm base for the price.
If the price retreats further, the 2nd support level is at 34938.35. This level, being a pullback support and aligning with the 38.20% Fibonacci retracement level, could offer another significant floor for the price.
On the upside, the 1st resistance level is at 35493.52. This level coincides with the 61.80% Fibonacci retracement level, indicating a significant level for potential price rejection or reversal.
Should the bullish momentum continue, the 2nd resistance level to watch would be at 35707.46
GER30:
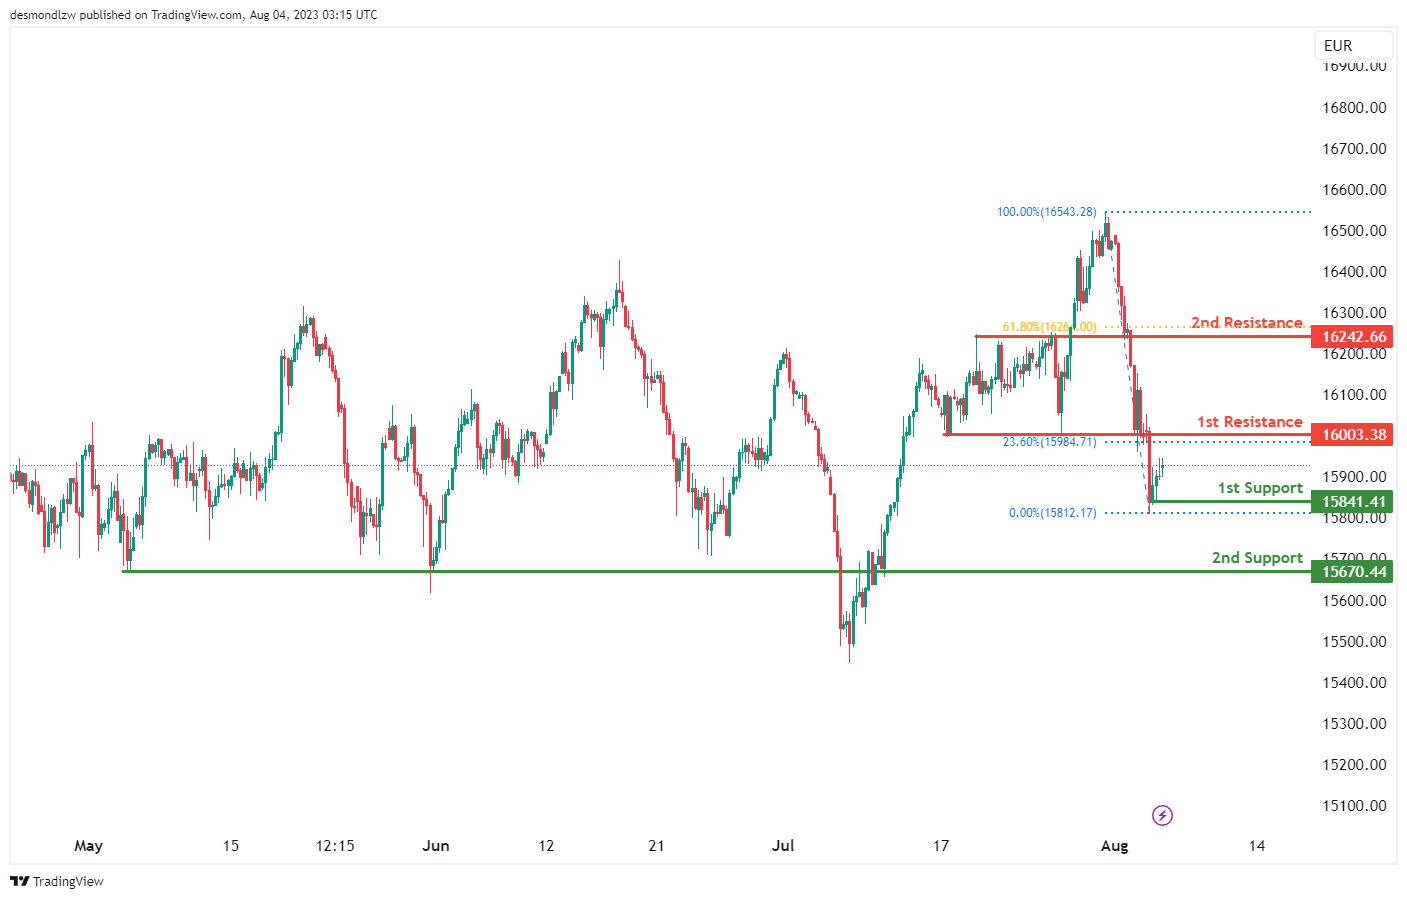
The GER30 chart shows a bullish momentum, and there is potential for a bullish continuation towards the 1st resistance.
The 1st support level is at 15841.41 and is identified as a swing low support. This level could potentially provide a firm base for the price.
If the price retreats further, the 2nd support level is at 15670.44. This level is identified as a pullback support and could offer another significant floor for the price.
On the upside, the 1st resistance level is at 16003.38. This level is a pullback resistance and may act as a hurdle for the price to overcome on its way up.
Should the bullish momentum continue, the 2nd resistance level to watch would be at 16242.66. This level is also a pullback resistance and aligns with the 61.80% Fibonacci retracement level, making it a significant level for potential price rejection or reversal.
US500
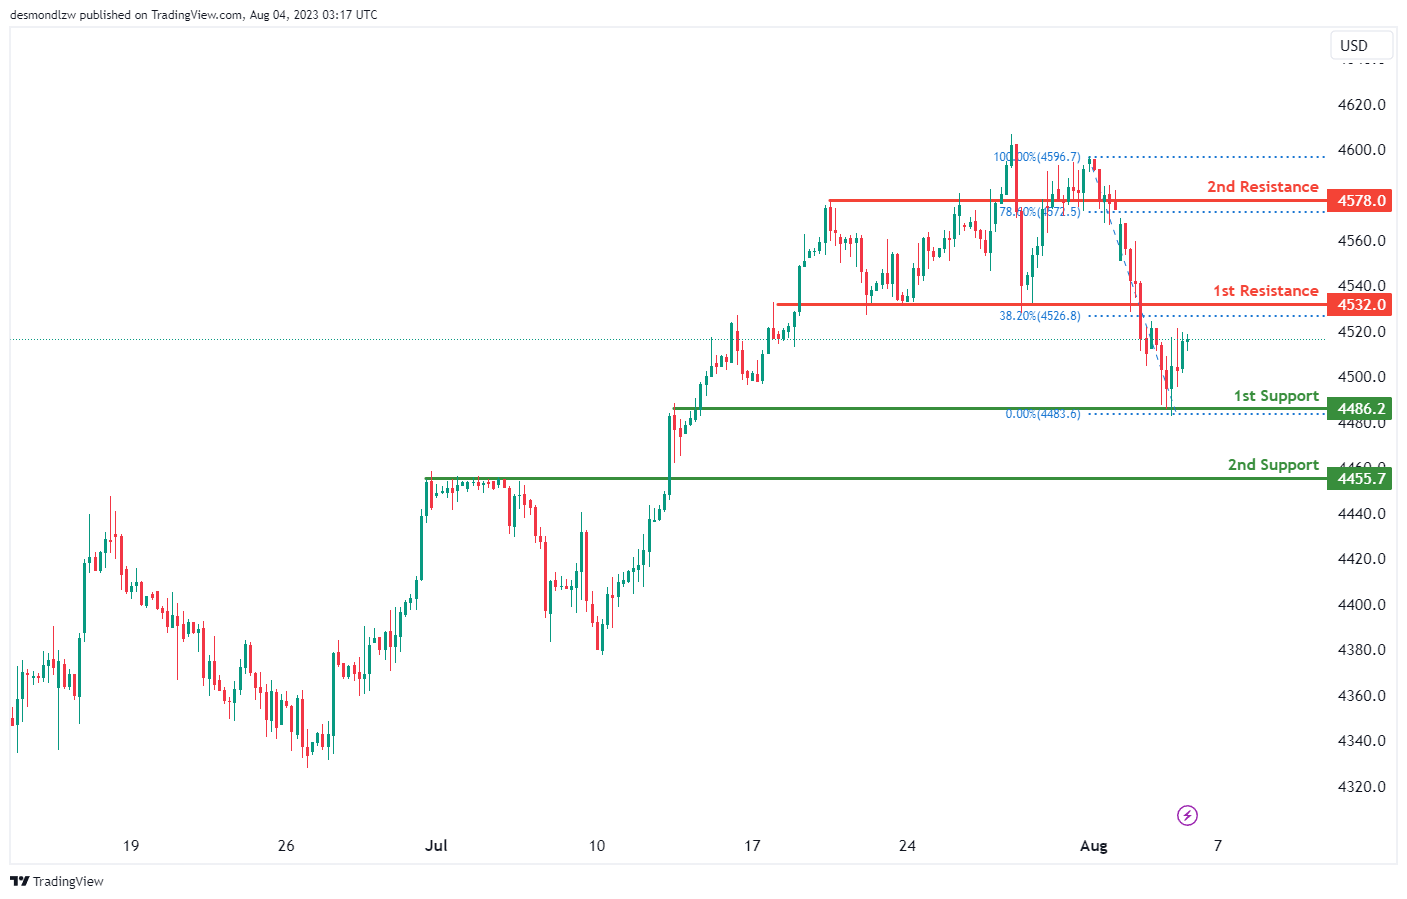
The US500 chart shows a bullish momentum, indicating potential for a bullish continuation towards the 1st resistance.
The 1st support level is at 4486.2. This level, recognized as an overlap support, could potentially provide a strong foundation for the price.
If the price moves down further, the 2nd support level is at 4455.7. This pullback support could offer another significant floor for the price, preventing further downward movement.
Looking at the upside, the 1st resistance level is at 4532.0. Identified as an overlap resistance, this could act as an obstacle for the price to overcome on its way up.
If the bullish momentum continues, the 2nd resistance level to watch would be at 4578.0. This is a pullback resistance and it coincides with the 78.60% Fibonacci retracement level,
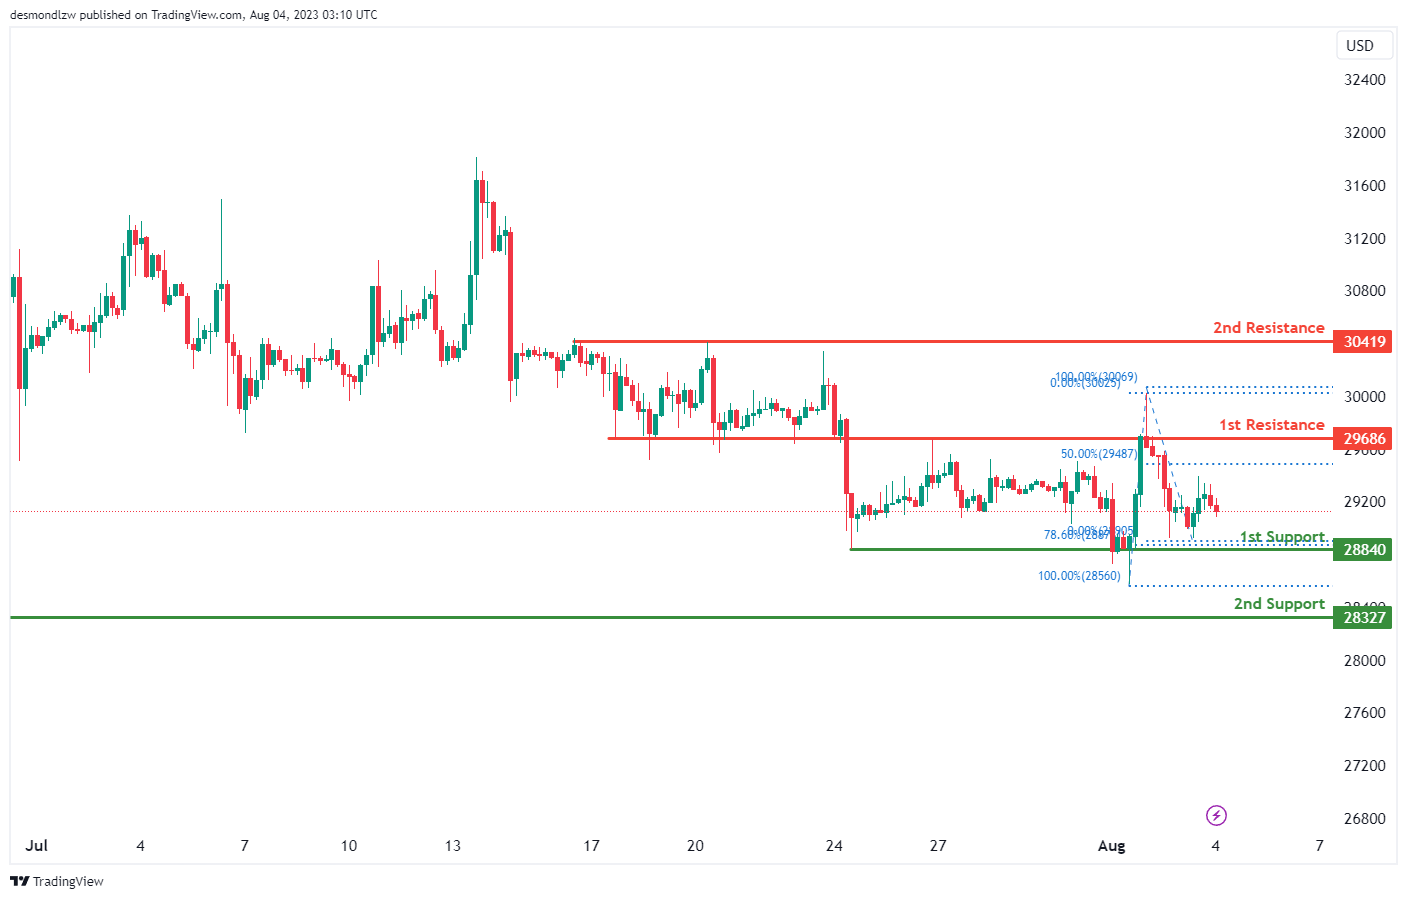
BTC/USD:
The BTC/USD chart shows a bearish momentum, which could potentially lead to a bearish continuation towards the 1st support.
The 1st support level is at 28840. This level is marked by a pullback support and also corresponds with the 78.60% Fibonacci retracement level. This combination makes it a strong support area.
If the price breaks below the 1st support, the 2nd support is at 28327, also marked as a pullback support, providing an additional safeguard against further decline.
On the upside, the 1st resistance level is at 29686. This is recognized as a pullback resistance and coincides with the 50% Fibonacci retracement level, potentially making it a tough level for the price to break.
If the price manages to push beyond the 1st resistance, the 2nd resistance level is at 30419, which is marked by a multi-swing high resistance
ETH/USD:
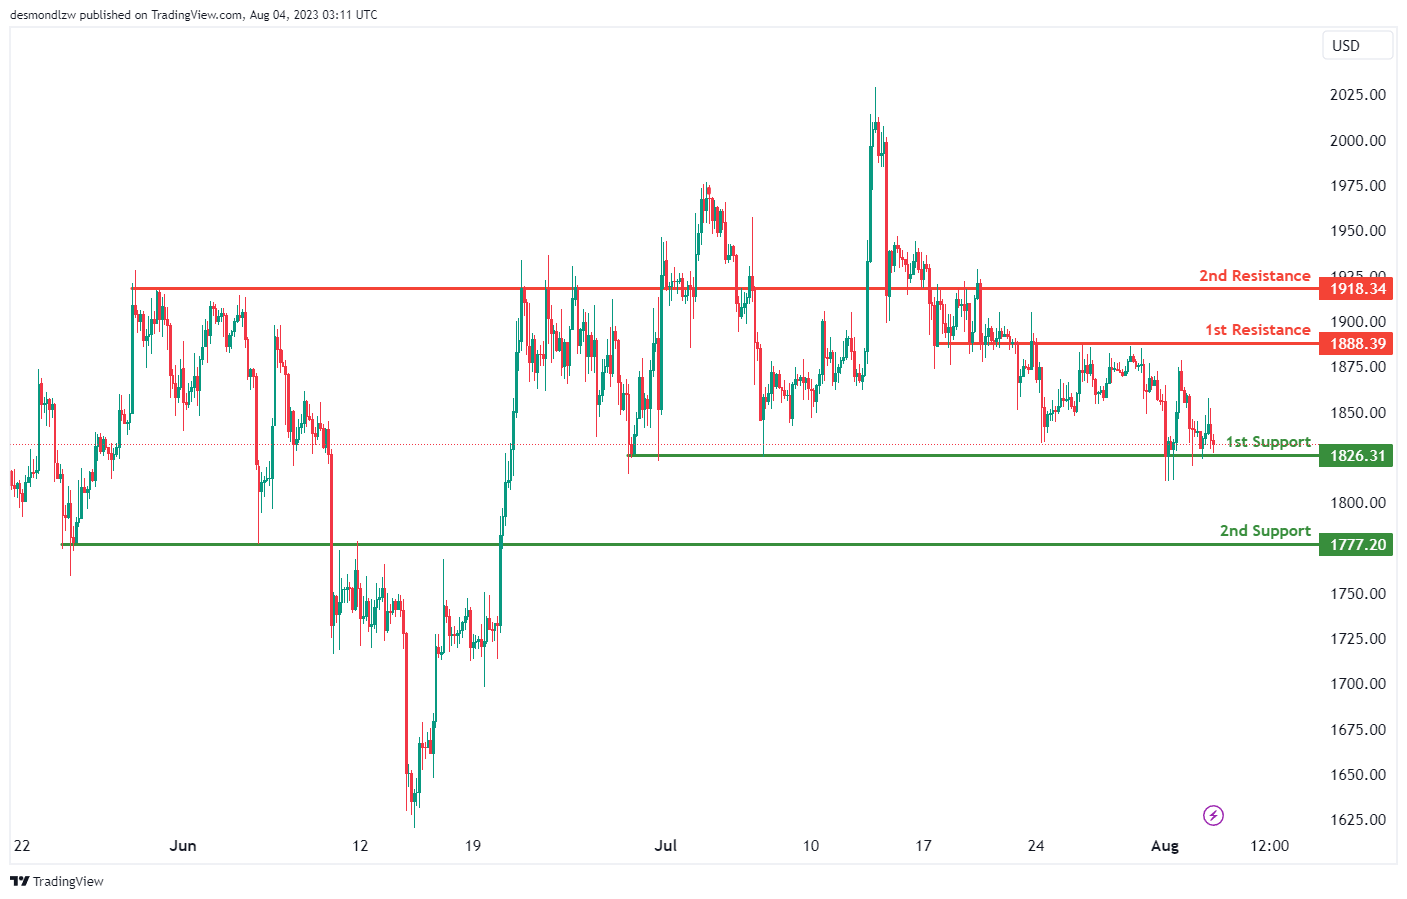
The ETH/USD chart currently shows a bearish momentum, however, the price could potentially make a bullish bounce off the 1st support and head towards the 1st resistance.
The 1st support level is at 1826.31, recognized as a multi-swing low support level. This is a level where the price has bounced off of in the past, making it a significant point to watch for a potential bounce back.
Should the price break below this level, the 2nd support is found at 1777.20, marked as a pullback support. This area could provide an additional level of protection against a further price drop.
On the upside, the 1st resistance level is at 1888.39. This level is an overlap resistance, a level that has previously acted as both support and resistance. This could potentially pose a challenge for bullish movement.
If the price manages to surpass this resistance, the next level to watch out for is at 1918.34, considered a pullback resistance
WTI/USD:
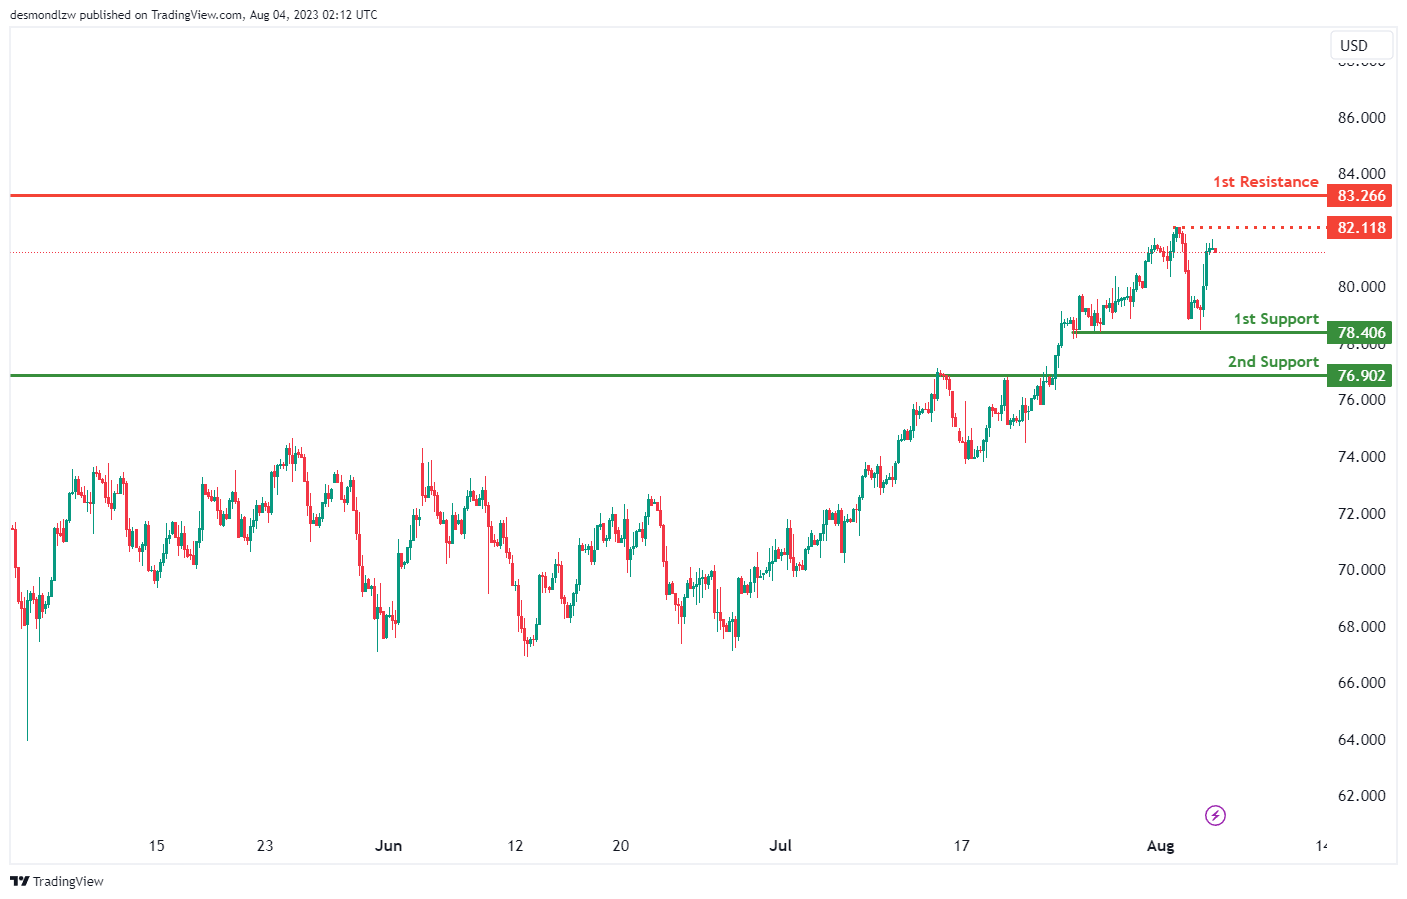
The WTI Crude Oil (West Texas Intermediate) is currently demonstrating a bullish trend. It is anticipated that this trend could potentially continue towards the 1st resistance level.
The 1st support level is situated at $78.40. This level represents a multi-swing low support, which has been confirmed by several tests in the past.
Should the price fall below the 1st support level, the 2nd support is at $76.90. This level serves as a pullback support and could potentially be a point for the price to rebound from.
An intermediate resistance level lies at $82.11. This has been identified as a swing high resistance. If the bullish momentum continues, this could be a potential target.
Beyond this point, the 1st resistance level is at $83.26. This level is a multi-swing high resistance and has been tested multiple times in the past. If the price reaches this level, it could face resistance. However, a breakthrough at this level could indicate strong bullish momentum.
XAU/USD (GOLD):
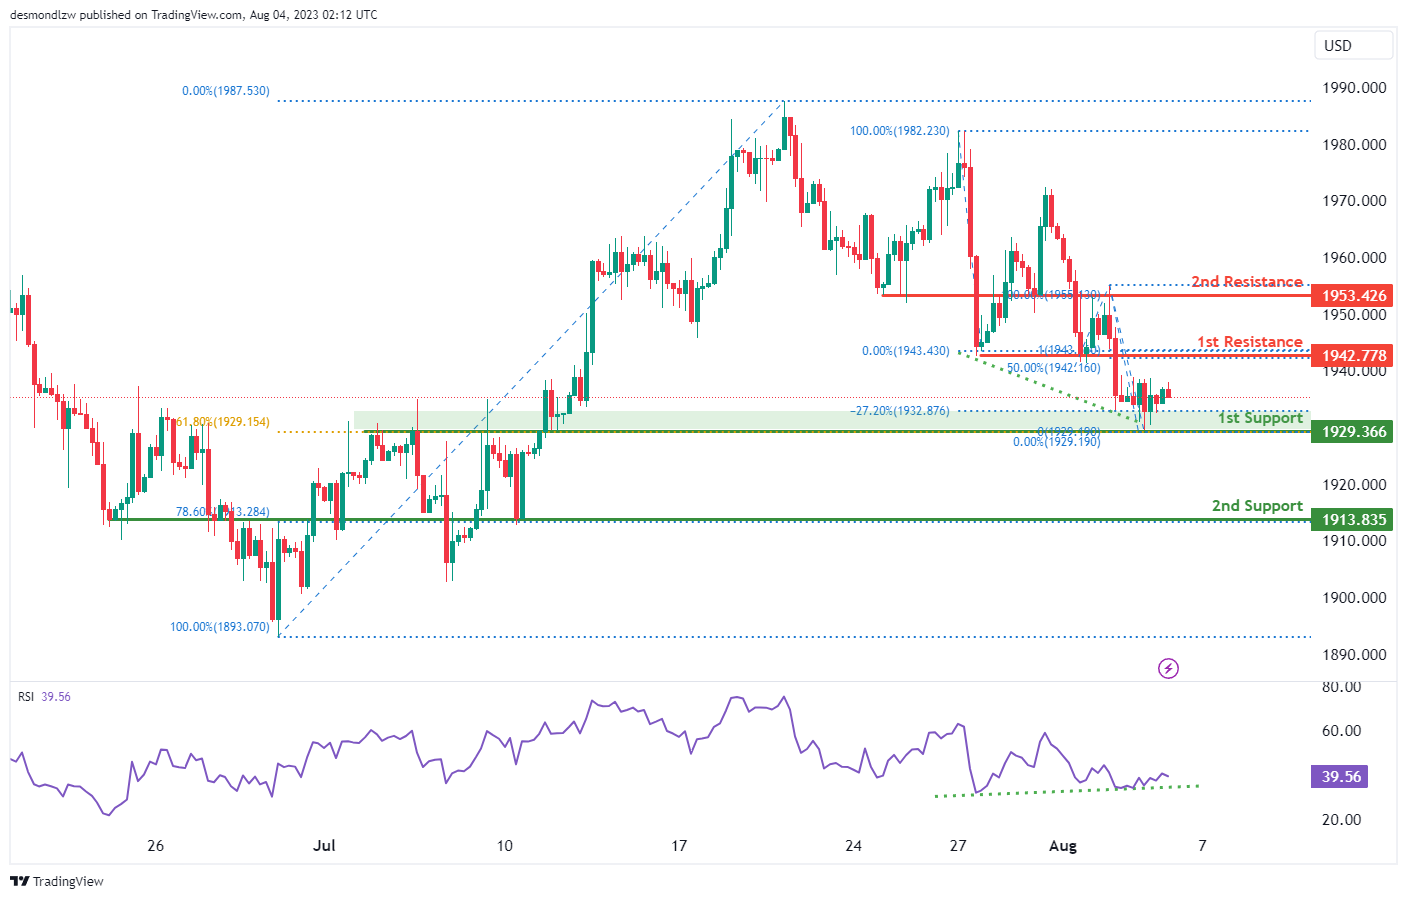
Gold (XAU/USD) currently exhibits a bullish trend on the chart, and it could potentially continue towards the 1st resistance level.
The 1st support level is established at 1929.36. This has been identified as an overlap support level, which also coincides with the 61.80% Fibonacci retracement level and the -27% Fibonacci expansion level. This confluence of Fibonacci levels could potentially make it a strong level of support.
If the price declines further, the 2nd support is at 1913.83. This is another overlap support and corresponds to the 78.60% Fibonacci retracement level, adding to its strength.
In the bullish scenario, the 1st resistance is at 1942.77. This level has been determined as an overlap resistance, aligning with both the 100% Fibonacci projection and the 50% Fibonacci retracement level. This confluence could make it a substantial hurdle for the price to overcome.
Should the bullish momentum continue beyond this point, the next resistance level to watch would be at 1953.42. This level serves as another overlap resistance, providing an additional target for the bulls.
EUR/USD Technical Analysis
On the hourly chart of EUR/USD at FXOpen, the pair started a fresh decline from the 1.1050 zone. The Euro declined below the 1.1020 and 1.1000 support levels against the US Dollar.
The pair settled below the 50-hour simple moving average and tested 1.0965. It is now consolidating losses and showing bearish signs. Immediate resistance is near 1.0965 and a connecting bearish trend line. A clear move above 1.0965 might send the pair toward 1.1020.
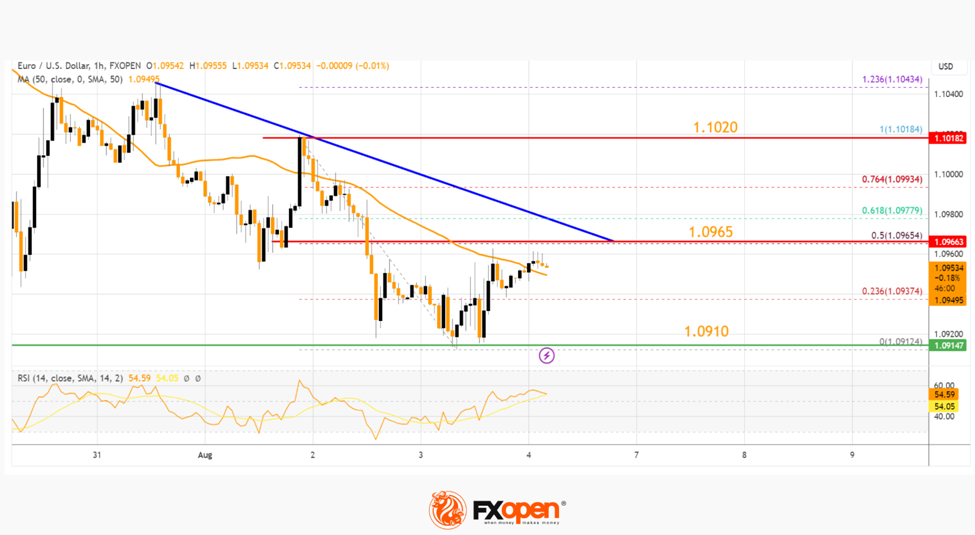
The next major resistance is near 1.1050. Any more gains might send the pair toward 1.1080 or even 1.1120 in the near term.
Conversely, the pair might continue to move down below 1.0910. The next major support is near 1.0880, below which EUR/USD could test the 1.0840 support. Any more losses could send the pair toward 1.0800.
This article represents the opinion of the Companies operating under the FXOpen brand only. It is not to be construed as an offer, solicitation, or recommendation with respect to products and services provided by the Companies operating under the FXOpen brand, nor is it to be considered financial advice.
USD/CHF Daily Outlook
Daily Pivots: (S1) 0.8717; (P) 0.8758; (R1) 0.8783; More....
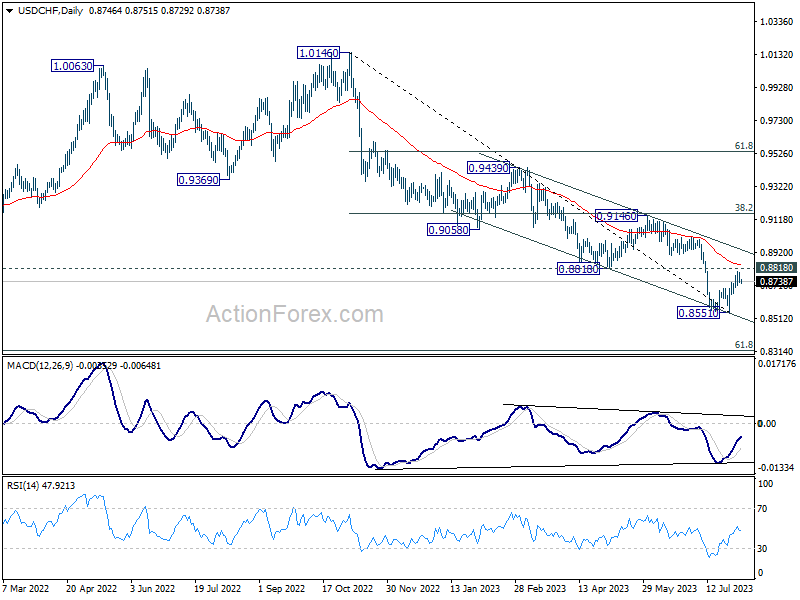
Intraday bias in USD/CHF remains neutral for the moment. Near term outlook stays bearish for now, with 0.8818 support turned resistance intact. On the downside, break of 0.8663 minor support should confirm rejection by 0.8818 and turn intraday bias back to the downside for retesting 0.8551 first. Nevertheless, decisive break of 0.8818 will carry larger bullish implication, and target 0.9146 cluster resistance next.
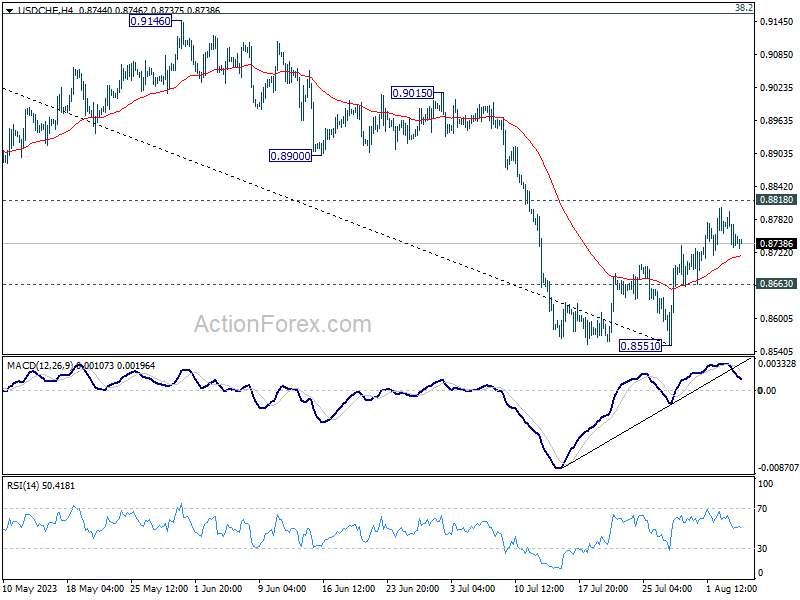
In the bigger picture, down trend from 1.0146 is seen as in progress as long as 0.8188 support turned resistance holds. Next target is 61.8% retracement of 0.7065 (2011 low) to 1.0342 (2016 high) at 0.8317. However, sustained break of 0.8818 should indicate medium term bottoming, and bring stronger rise back to 0.9146 cluster resistance (38.2% retracement of 1.0146 to 0.8551 at 0.9160), even as a correction.
Dollar Losing Momentum as Markets Anticipate the Dual-Faced Impacts of NFP
Dollar maintains its position as the week's strongest major currency, although momentum has noticeably started to wane. The release of today's non-farm payroll report is poised to be a critical determinant in whether the greenback can sustain its near-term rally. However, market reactions could be complex, given that robust numbers could be seen as both a blessing and a curse, contingent on interpretation. The challenge lies in navigating the thin line of an optimal outcome for both the US economy and Fed, the so-called "goldilocks" scenario.
In the rest of the forex markets, Swiss Franc and Euro are trailing closely behind Dollar as the next strongest currencies. Conversely, Australian Dollar currently sits at the bottom of the performance spectrum, with only a recovery in Copper prices breathing some life back into the currency. Following closely in terms of weakness is New Zealand Dollar, with Sterling securing the third weakest spot, despite regaining some ground from the post-BoE selloff. Canadian Dollar's performance remains mixed as it awaits its own employment data, while Yen continues to display near-term consolidation patterns.
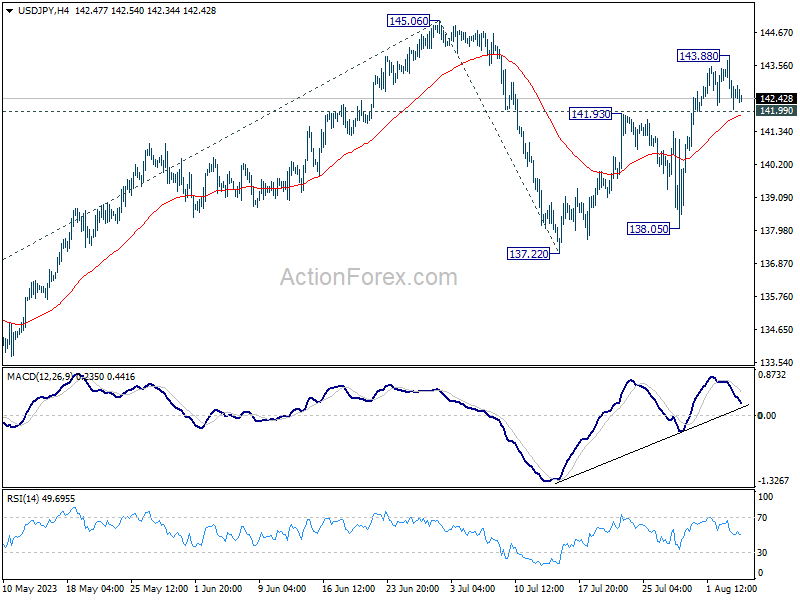
In a technical examination, USD/JPY has clearly experienced a slowdown in its upward momentum, ahead of 145.06 high. Even the surge in US 10-year yield, which broke a critical near-term structural resistance and reached its highest level since November, provided limited support. As it stands, further gains seem likely as long as 141.99 minor support remains intact. A rise beyond 143.88 would revive the rally and push for a retest of 145.06 high. However, strong break of 141.99 could indicate that the corrective pattern from 145.06 is commencing its third leg, possibly falling back towards 137.22/138.05 support zone.
In Asia, at the time of writing, Nikkei is down -0.05%. Hong Kong HSI is up 1.22%. China Shanghai SSE is up 0.66%. Singapore Strait Times is down -0.20%. Japan 10-year JGB yield is down slightly by -0.0007 at 0.653. Overnight, DOW dropped -0.19%. S&P 500 dropped -0.25%. NASDAQ dropped -0.10%. 10-year yield rose 0.111 to 4.189.
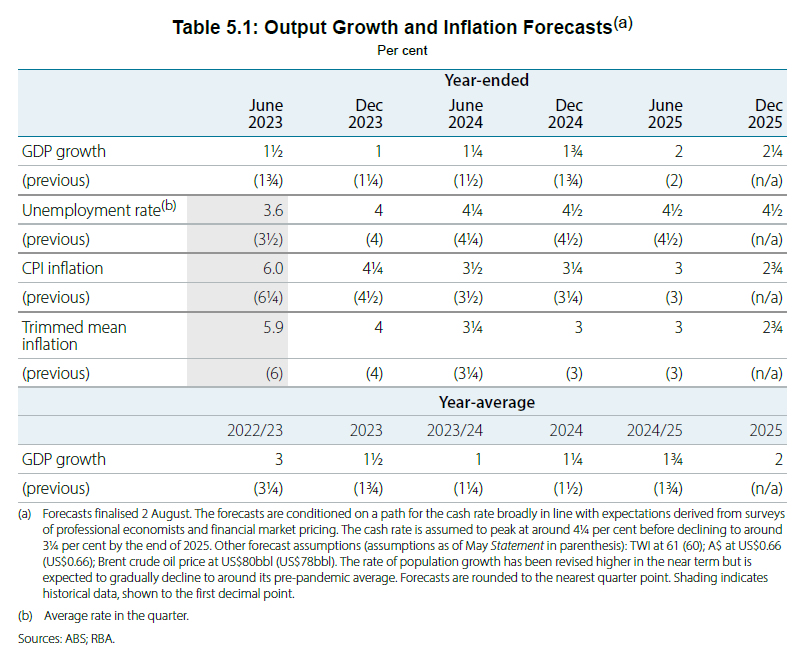
RBA downgrades 2023 CPI and GDP forecasts slightly
In the quarterly Statement on Monetary Policy, RBA reiterated that "some further tightening of monetary policy may be required". This decision, however, would hinge on the incoming data and the evolving assessment of risks. Economic forecasts remain largely unchanged, with a slight downgrade in 2023 CPI forecast as well as 2023 and 2024 GDP projections.
The central bank's outlook for inflation remains more or less steady as compared to three months ago. "CPI inflation is forecast to continue to decline, to be around 3¼ per cent at the end of 2024 and back within the 2–3 per cent target range in late 2025," the statement highlighted. The Board maintains that the risks around the inflation outlook are "broadly balanced".
While the labour market remains tight, conditions have seen slight relaxation. The bank notes, "In response to the tight labour market and high inflation, wage growth picked up to its highest rate in a decade."
The economic growth perspective appears somewhat muted, with the statement acknowledging that "Growth in economic activity has been subdued this year." Looking ahead, the central bank remains cautious, predicting that "Growth in the economy is expected to remain subdued over the period ahead."
New economic forecasts
CPI inflation at (vs previous forecast):
- 4.25% in Dec 2023 (down from 4.50%).
- 3.50% in June 2024 (unchanged).
- 3.25% in Dec 2024 (unchanged).
- 300% in Jun 2025 (unchanged).
- 2.75% in Dec 2025 (new).
Trimmed mean CPI inflation at:
- 4.00% in Dec 2023 (unchanged).
- 3.25% in Jun 2024 (unchanged).
- 3.00% in Dec 2024 (unchanged).
- 3.00% in Jun 2025 (unchanged).
- 2.75% in Dec 2025 (new).
Year-average GDP growth at:
- 1.50 in 2023 (down from 1.75%).
- 1.25% in 2024 (down from 1.50%).
- 2.00% in 2025 (new).
NFP: Where's the balance between job growth and wage inflation?
The imminent NFP report today poses a potential quandary for both Fed and market participants. On one hand, steady job growth aligns with Fed's intention to engineer a soft landing for the US economy. On the other, elevated wages growth due to tight labor market could compel Fed to maintain its tightening course, potentially complicating the soft landing strategy.
Expectations are set for a 200k job increase in July, while unemployment rate is predicted to hold steady at 3.6%. Average hourly earnings are projected to climb 0.3% month-on-month.
Based on recent developments, economists are gradually warming to the idea that Fed might achieve its "soft-landing" scenario for the economy. Consistent job growth around the 200,000 region per month would provide further support for this possibility.
However, uncertainties loom regarding wage growth. With an expected 0.3% mom growth, the annual rate could comfortably remain above 4% yoy - a figure significantly higher than the levels consistent with Fed's 2% inflation target. A strong report will certainly spark debates in the market about whether Fed will need to tighten its monetary policy further toward a peak of 6%, up from the current 5.25-5.50%.
Relevant employment data presents a mixed bag. ISM Services Employment index was at 50.7 in July, down -2.4 points from 53.1 in June. Meanwhile, ISM Manufacturing Employment was lower at 44.4, marking a decline of -3.7 points from 48.1 in June. In contrast, ADP reported private payrolls at 324k against forecast of 195k and prior month's stronger 455k.
Elsewhere
Germany factor orders, France industrial output, Eurozone retail sales and UK construction PMI will be released in European session. Later in the day, Canada will also publish employment data and Ivey PMI.
USD/CHF Daily Outlook
Daily Pivots: (S1) 0.8717; (P) 0.8758; (R1) 0.8783; More....
Intraday bias in USD/CHF remains neutral for the moment. Near term outlook stays bearish for now, with 0.8818 support turned resistance intact. On the downside, break of 0.8663 minor support should confirm rejection by 0.8818 and turn intraday bias back to the downside for retesting 0.8551 first. Nevertheless, decisive break of 0.8818 will carry larger bullish implication, and target 0.9146 cluster resistance next.
In the bigger picture, down trend from 1.0146 is seen as in progress as long as 0.8188 support turned resistance holds. Next target is 61.8% retracement of 0.7065 (2011 low) to 1.0342 (2016 high) at 0.8317. However, sustained break of 0.8818 should indicate medium term bottoming, and bring stronger rise back to 0.9146 cluster resistance (38.2% retracement of 1.0146 to 0.8551 at 0.9160), even as a correction.
Economic Indicators Update
| GMT | Ccy | Events | Actual | Forecast | Previous | Revised |
|---|---|---|---|---|---|---|
| 01:30 | AUD | RBA Monetary Policy Statement | ||||
| 06:00 | EUR | Germany Factory Orders M/M Jun | -2.00% | 6.40% | ||
| 06:45 | EUR | France Industrial Output M/M Jun | -0.30% | 1.20% | ||
| 08:00 | EUR | Italy Industrial Output M/M Jun | 0.00% | 1.60% | ||
| 08:30 | GBP | Construction PMI Jul | 48.2 | 48.9 | ||
| 09:00 | EUR | Eurozone Retail Sales M/M Jun | 0.30% | 0.00% | ||
| 12:30 | USD | Nonfarm Payrolls Jul | 200K | 209K | ||
| 12:30 | USD | Unemployment Rate Jul | 3.60% | 3.60% | ||
| 12:30 | USD | Average Hourly Earnings M/M Jul | 0.30% | 0.40% | ||
| 12:30 | CAD | Net Change in Employment Jul | 15.5K | 59.9K | ||
| 12:30 | CAD | Unemployment Rate Jul | 5.50% | 5.40% | ||
| 14:00 | CAD | Ivey PMI Jul | 50.2 |
NFP: Where’s the balance between job growth and wage inflation?
The imminent NFP report poses a potential quandary for both Fed and market participants. On one hand, steady job growth aligns with Fed's intention to engineer a soft landing for the US economy. On the other, elevated wages growth due to tight labor market could compel Fed to maintain its tightening course, potentially complicating the soft landing strategy.
Expectations are set for a 200k job increase in July, while unemployment rate is predicted to hold steady at 3.6%. Average hourly earnings are projected to climb 0.3% month-on-month.
Based on recent developments, economists are gradually warming to the idea that Fed might achieve its "soft-landing" scenario for the economy. Consistent job growth around the 200,000 region per month would provide further support for this possibility.
However, uncertainties loom regarding wage growth. With an expected 0.3% mom growth, the annual rate could comfortably remain above 4% yoy - a figure significantly higher than the levels consistent with Fed's 2% inflation target. A strong report will certainly spark debates in the market about whether Fed will need to tighten its monetary policy further toward a peak of 6%, up from the current 5.25-5.50%.
Relevant employment data presents a mixed bag. ISM Services Employment index was at 50.7 in July, down -2.4 points from 53.1 in June. Meanwhile, ISM Manufacturing Employment was lower at 44.4, marking a decline of -3.7 points from 48.1 in June. In contrast, ADP reported private payrolls at 324k against forecast of 195k and prior month's stronger 455k.
RBA downgrades 2023 CPI and GDP forecasts slightly
In the quarterly Statement on Monetary Policy, RBA reiterated that "some further tightening of monetary policy may be required". This decision, however, would hinge on the incoming data and the evolving assessment of risks. Economic forecasts remain largely unchanged, with a slight downgrade in 2023 CPI forecast as well as 2023 and 2024 GDP projections.
The central bank's outlook for inflation remains more or less steady as compared to three months ago. "CPI inflation is forecast to continue to decline, to be around 3¼ per cent at the end of 2024 and back within the 2–3 per cent target range in late 2025," the statement highlighted. The Board maintains that the risks around the inflation outlook are "broadly balanced".
While the labour market remains tight, conditions have seen slight relaxation. The bank notes, "In response to the tight labour market and high inflation, wage growth picked up to its highest rate in a decade."
The economic growth perspective appears somewhat muted, with the statement acknowledging that "Growth in economic activity has been subdued this year." Looking ahead, the central bank remains cautious, predicting that "Growth in the economy is expected to remain subdued over the period ahead."
New economic forecasts
CPI inflation at (vs previous forecast):
- 4.25% in Dec 2023 (down from 4.50%).
- 3.50% in June 2024 (unchanged).
- 3.25% in Dec 2024 (unchanged).
- 300% in Jun 2025 (unchanged).
- 2.75% in Dec 2025 (new).
Trimmed mean CPI inflation at:
- 4.00% in Dec 2023 (unchanged).
- 3.25% in Jun 2024 (unchanged).
- 3.00% in Dec 2024 (unchanged).
- 3.00% in Jun 2025 (unchanged).
- 2.75% in Dec 2025 (new).
Year-average GDP growth at:
- 1.50 in 2023 (down from 1.75%).
- 1.25% in 2024 (down from 1.50%).
- 2.00% in 2025 (new).