

Sample Category Title
EUR/USD Daily Outlook
Daily Pivots: (S1) 1.0949; (P) 1.0995; (R1) 1.1056; More...
Intraday bias in EUR/USD stays neutral for the moment. On the downside, break of 1.0911 will resume the decline from 1.1274 to 1.0832 support. Sustained trading below there will target 1.0609/34 cluster support. However, firm break of 1.1046 minor resistance will argue that pull back from 1.1274 has completed, and bring stronger rebound.
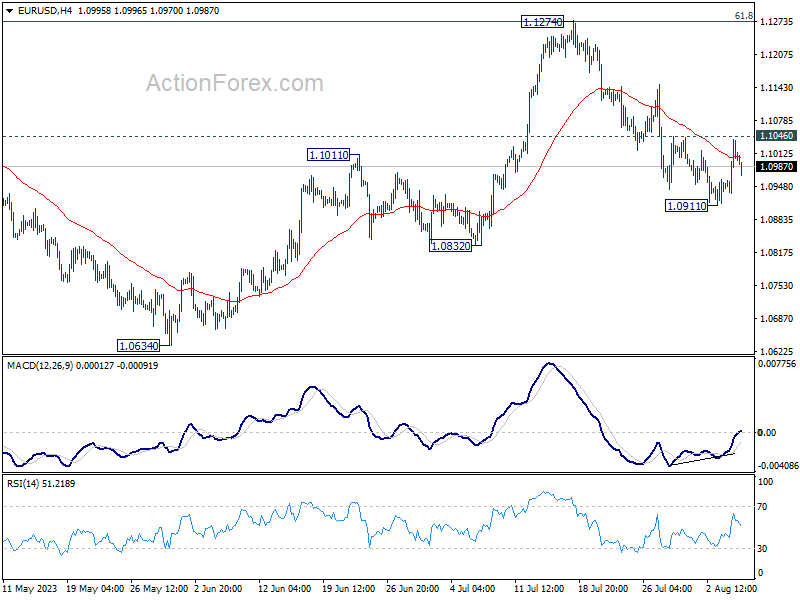
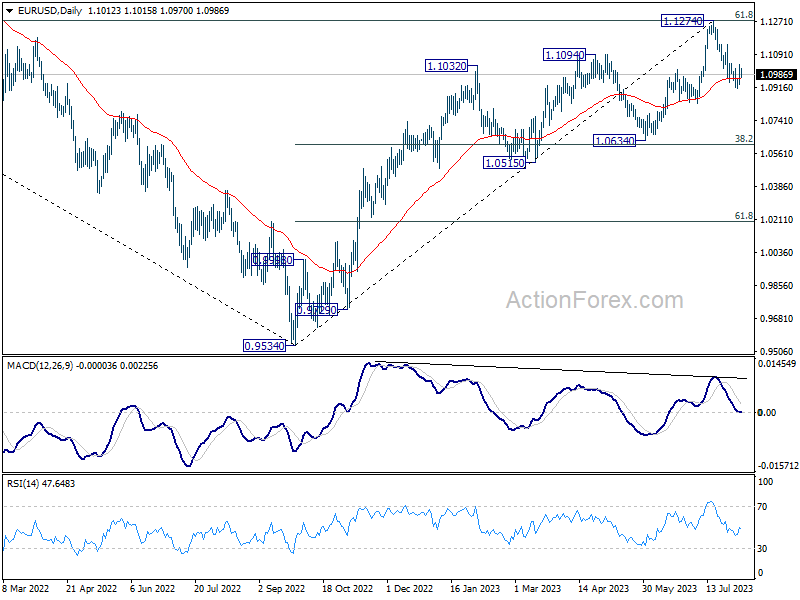
In the bigger picture, a medium term top could be formed at 1.1274, after failing to break through 61.8% retracement of 1.2348 (2021 high) to 0.9534 at 1.1273 decisively, on bearish divergence condition in D MACD. Sustained trading below 55 D EMA (now at 1.0966) will bring deeper correction to 1.0634 cluster support (38.2% retracement of 0.9534 to 1.1274 at 1.0609). Strong support could be seen there, at least on first attempt, to set the range for consolidation.
GBP/USD Daily Outlook
Daily Pivots: (S1) 1.2695; (P) 1.2743; (R1) 1.2797; More...
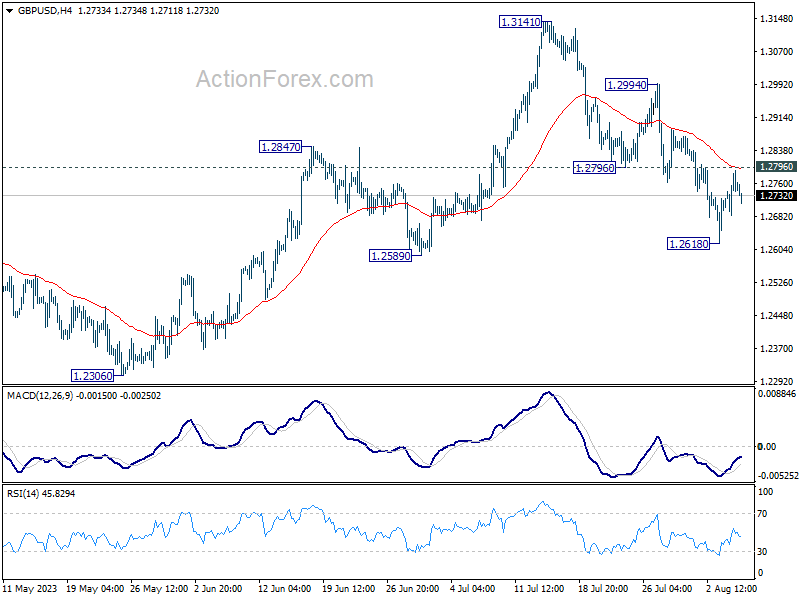
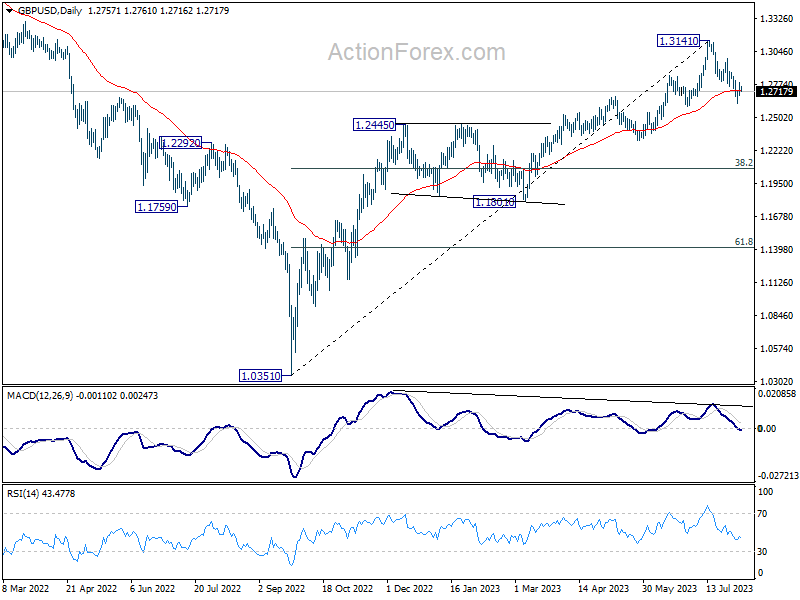
Intraday bias in GBP/USD stays neutral at this point. On the downside, below 1.2618, and sustained trading below 1.2678 resistance turned support will argue that it's already in a larger correction. Deeper decline would then be seen to 1.2306 support next. Nevertheless, firm break of 1.2796 will indicate that the pull back has completed, and turn bias back to the upside for stronger rebound.
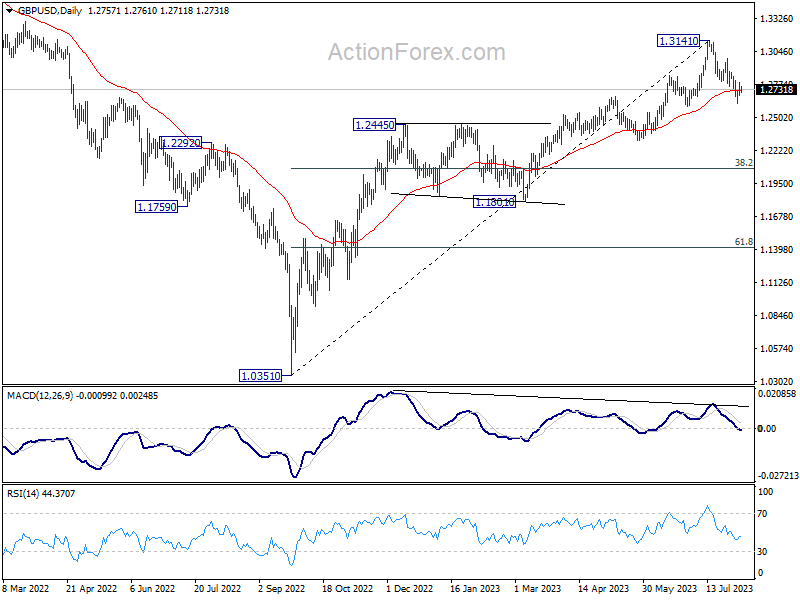
In the bigger picture, a medium term top could be in place at 1.3141 already, on bearish divergence condition in D MACD. Sustained trading below 55 D EMA (now at 1.2726) should confirm this case, and bring deeper fall to 38.2% retracement of 1.0351 to 1.3141 at 1.2075, as a correction to up trend from 1.0351 (2022 low). For now, rise will stay mildly on the downside as long as 1.3141 resistance holds, in case of strong rebound.
USD/CHF Daily Outlook
Daily Pivots: (S1) 0.8692; (P) 0.8737; (R1) 0.8775; More....
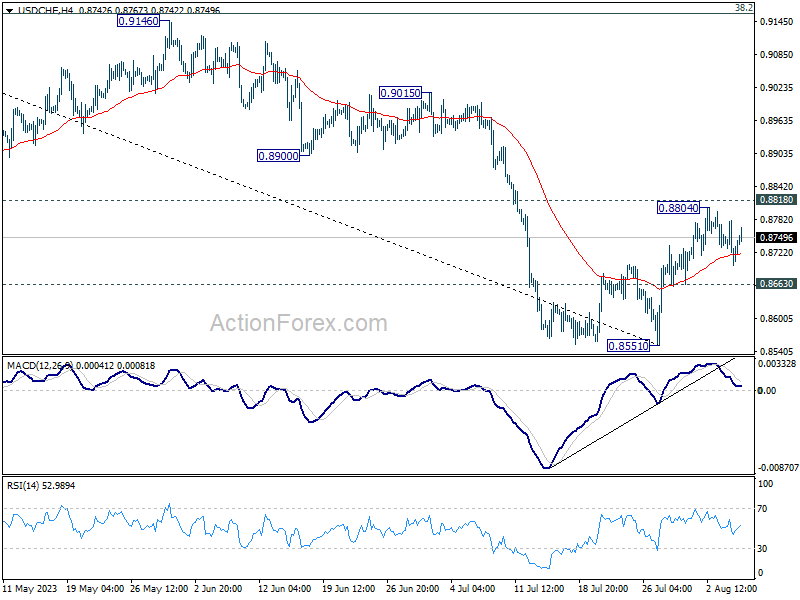
Intraday bias in USD/CHF stays neutral for the moment. Initial bias remains neutral this week first. On the downside break of 0.8663 minor support should confirm rejection by 0.8818 and turn intraday bias back to the downside for retesting 0.8551 first. Nevertheless, decisive break of 0.8818 will carry larger bullish implication, and target 0.9146 cluster resistance next.
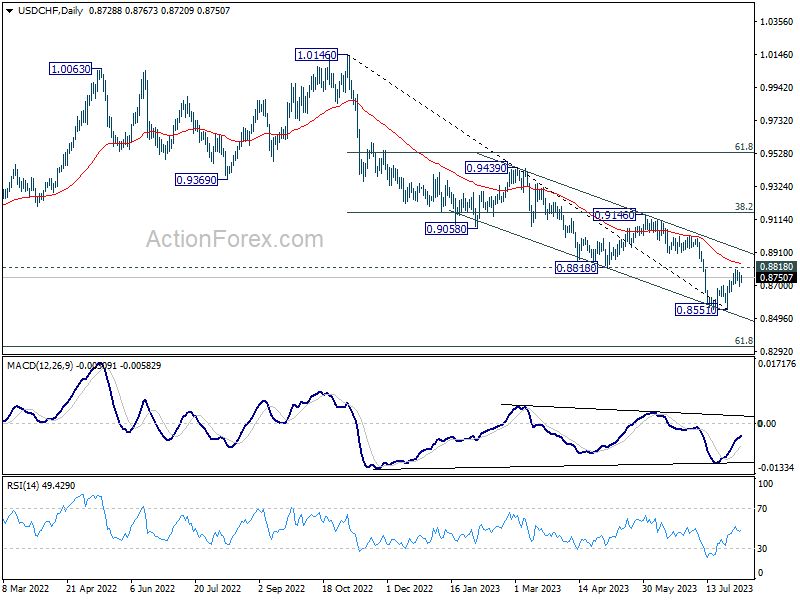
In the bigger picture, down trend from 1.0146 is seen as in progress as long as 0.8188 support turned resistance holds. Next target is 61.8% retracement of 0.7065 (2011 low) to 1.0342 (2016 high) at 0.8317. However, sustained break of 0.8818 should indicate medium term bottoming, and bring stronger rise back to 0.9146 cluster resistance (38.2% retracement of 1.0146 to 0.8551 at 0.9160), even as a correction.
USD/JPY Daily Outlook
Daily Pivots: (S1) 141.26; (P) 142.07; (R1) 142.59; More...
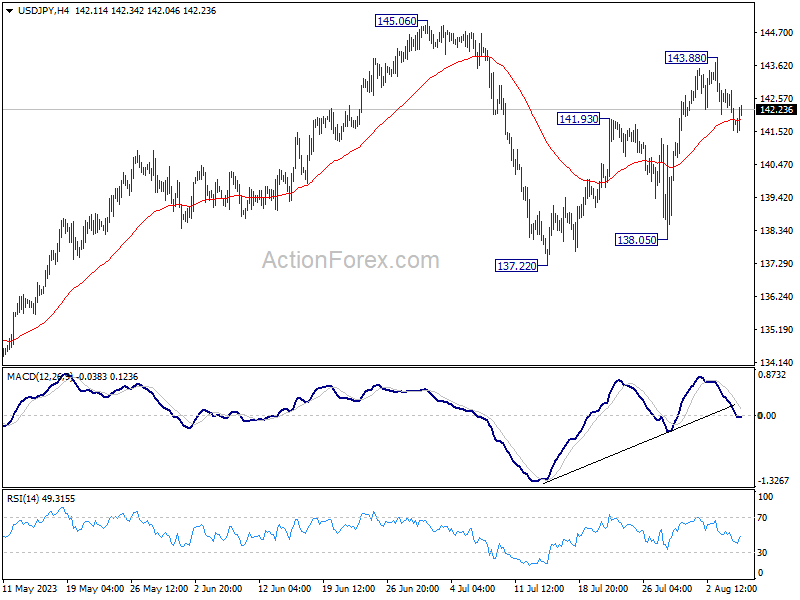
Intraday bias in USD/JPY is mildly on the downside. Fall from 143.88 could be the third leg of the pattern from 145.06. Deeper fall would be seen to 55 D EMA (now at 140.50). On the upside, though, above 143.88 will resume the rise from 137.22 to retest 145.06 resistance instead.
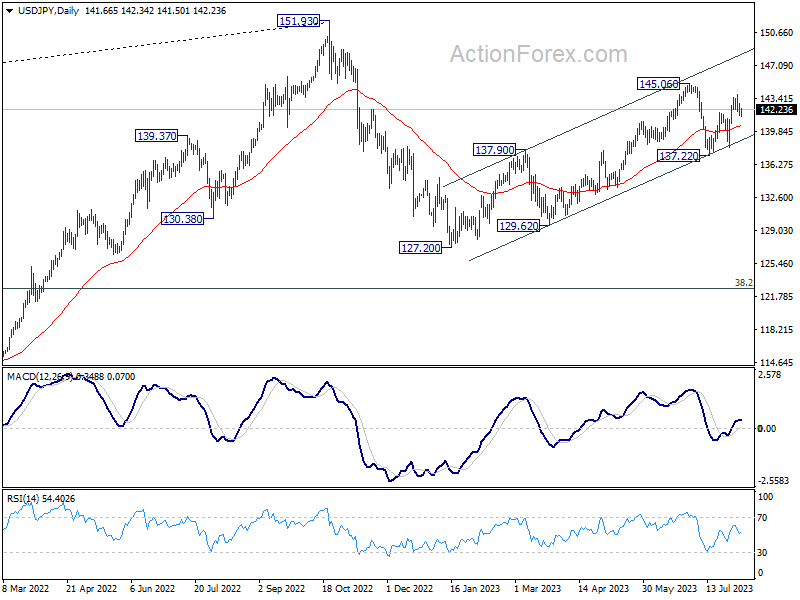
In the bigger picture, overall price actions from 151.93 (2022 high) are views as a corrective pattern. Rise from 127.20 is seen as the second leg of the pattern and could still be in progress. But even in case of extended rise, strong resistance should be seen from 151.93 to limit upside. Meanwhile, break of 137.22 support should confirm the start of the third leg to 127.20 (2023 low) and below.
USD/CAD Daily Outlook
Daily Pivots: (S1) 1.3336; (P) 1.3365; (R1) 1.3410; More....
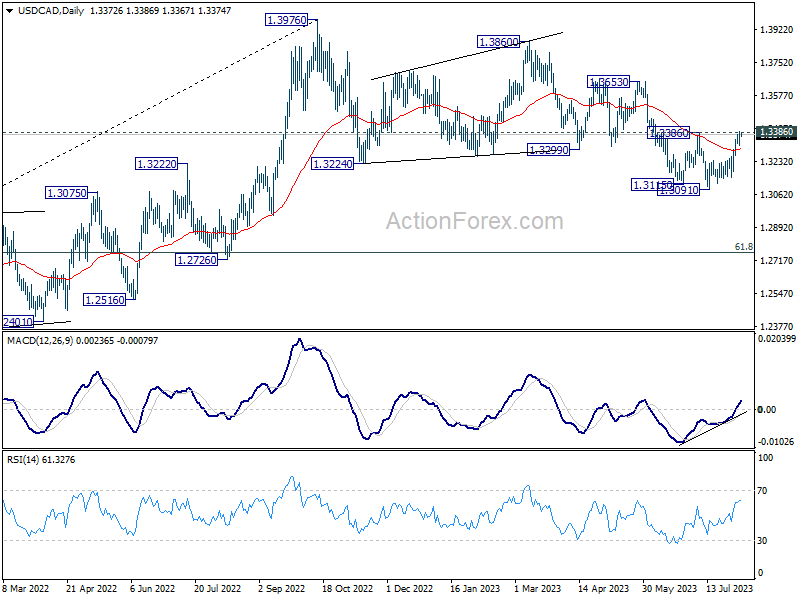
Immediate focus stays on 1.3386 resistance in USD/CAD. Sustained break of 1.3386 will argue that whole correction from 1.3976 has completed with three waves down to 1.3091. Further rally would then be seen to 1.3653 resistance next. Nevertheless, rejection by 1.3386, followed by break of 1.3260 minor support, should resume larger decline through 1.3091 low.
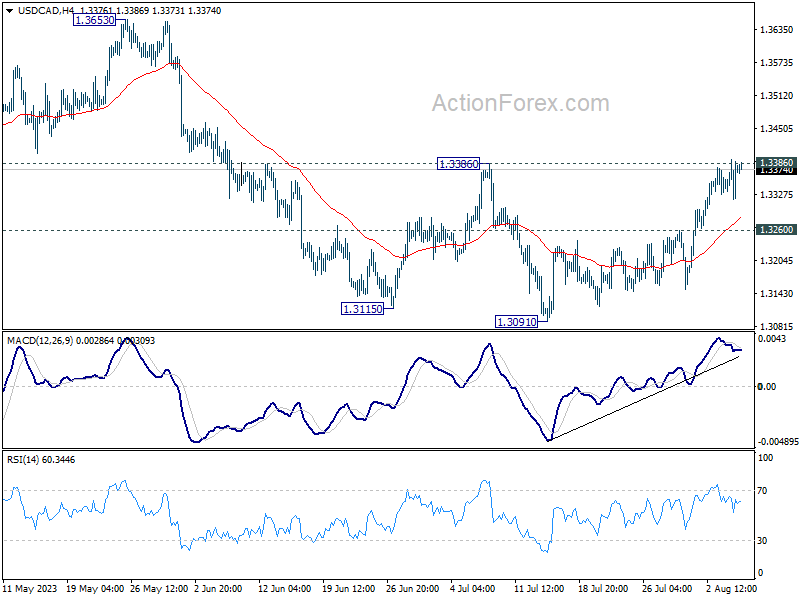
In the bigger picture, price actions from 1.3976 are viewed as a corrective fall only. Upon completion, rise from 1.2005 (2021 low) would resume through 1.3976 towards 1.4667/89 long term resistance zone. In case of another fall, downside should be contained by 61.8% retracement of 1.2005 to 1.3976 at 1.2758.
AUD/USD Daily Report
Daily Pivots: (S1) 0.6536; (P) 0.6573; (R1) 0.6605; More...
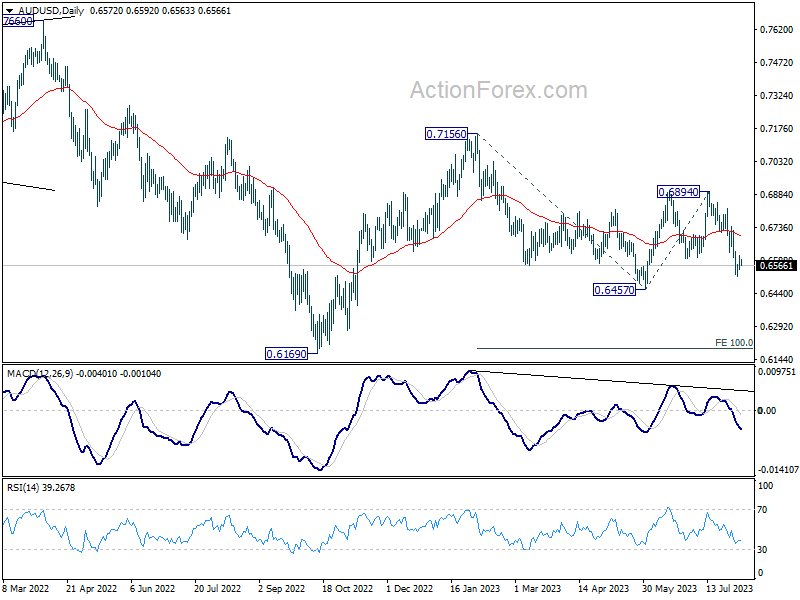
Intraday bias in AUD/USD remains neutral for consolidation above 0.6513. Current development argues that larger fall from 0.7156 is still in progress. Below 0.6513 will bring retest of 0.6457 support first. Firm break there will confirm this case and target 100% projection of 0.7156 to 0.6457 from 0.6894 at 0.6195. Nevertheless, on the upside, above 0.6628 minor resistance will mix up the outlook and turn bias back to the upside for stronger rebound.
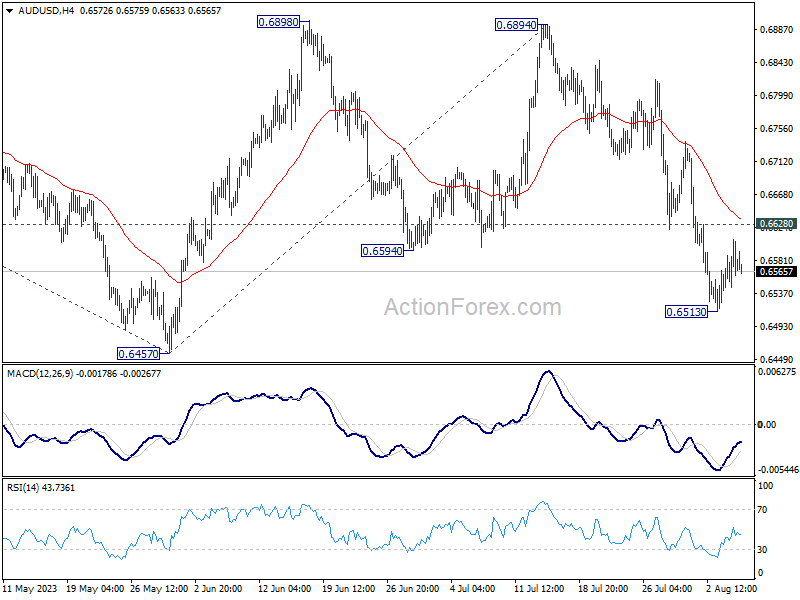
In the bigger picture, outlook is mixed for now as AUD/USD failed to sustain above both 55 D EMA (now at 0.6696) and 55 W EMA (now at 0.6769). On the upside, break of 0.6894 resistance will solidify the case that down trend from 0.8006 (2021 high) has already completed, and target 0.7156 resistance for confirmation. However, break of 0.6457 will likely resume the down trend through 0.6169 (2022 low).
Market Awaits Clear Direction Amid Market Lull
As we are now in the traditional summer quiet period, market activities appear largely subdued, a pattern expected to persist into first half of the week. US Dollar is attempting to gain momentum to revive its recent rally, but it's still kept way off last week's peak against other major currencies. Definitive direction for the greenback might only materialize after Thursday's release of US CPI data, unless a notable surge in risk market volatility precedes this.
GBP/USD is in the spotlight this week, considering the anticipation surrounding US inflation and UK GDP data releases. From a technical viewpoint, the pair is currently seeking support from the 55 D EMA. A robust rebound from the current level would indicate that the pullback from 1.3141 is merely a correction to the rise from 1.1801.
However, sustained trading period below 55 D EMA could signal that the pair is correcting the overall uptrend from 1.0351, thereby increasing the risk of a sharp fall back into the 1.1801/2445 support zone.
In Asia, Nikkei closed up 0.19%. Hong Kong HSI is down -0.14%. China Shanghai SSE is down -0.84%. Singapore Strait Times is up 0.50%. Japan 10-year JGB yield is down -0.0124 at 0.634.
Fed Bowman: Additional rate hikes likely needed
Fed Governor Michelle Bowman projected the necessity of further rate hikes during a weekend speech, asserting they are likely needed to push inflation back down to the Fed's 2% target.
Bowman expressed her support for Fed's rate hike in July and stated, "I also expect that additional rate increases will likely be needed to get inflation on a path down to the FOMC's 2 percent target."
However, Bowman was careful to emphasize that Fed policy is "not on a preset course". Further decisions will be based on "incoming data and its implications for the economic outlook," she stated.
She said, "We should remain willing to raise the federal funds rate at a future meeting if the incoming data indicate that progress on inflation has stalled."
While recent lower inflation reading was seen as positive, Bowman asserted the necessity of consistent evidence of inflation moving meaningfully toward the 2% goal when contemplating additional rate hikes and the duration of restrictive federal funds rates.
BoJ opinions: Flexible YCC needed while maintaining monetary easing
In the Summary of Opinions at the July 27-28 meeting, BoJ reinforced its commitment to monetary easing but highlighted a pressing need for more "flexibility" in its yield curve control approach policy.
The bank's primary stance was evident among board members: Achieving a 2% price stability target "has not yet come in sight", necessitating continued monetary easing and the preservation of the current YCC framework.
"There is still a significantly long way to go before revising the negative interest rate policy, and the framework of yield curve control needs to be maintained," one member noted.
However, there will be potential market disruptions by strictly capping 10-year JGB yields at 0.5%, another opinion noted.
Also, given the "increasingly significant upside and downside risks" to prices outlook, flexible YCC is needed for allowing market-driven interest rates, ensuring liquidity, and preventing abrupt rate shifts.
The bank also remarked on the current inflation trends, suggesting they primarily stem from import inflation. A rise in earning power, especially for small and medium-sized firms, was emphasized as crucial before instituting broader YCC flexibility.
At the meeting, BoJ permitted a rise in the 10-year yield beyond its usual 0.5% limit, reaching up to 1%.
US inflation data in the spotlight
As we move into a new week, US inflation data emerges as a critical highlight, with implications for Fed's monetary policy. In a shift of focus, Fed officials are anticipated to pay closer attention to the monthly core CPI gains, besides the headline numbers. This measure, which strips out the volatile components of food and energy, is considered a more pertinent indicator of the underlying inflation trend, offering a clearer view devoid of base effect distortions.
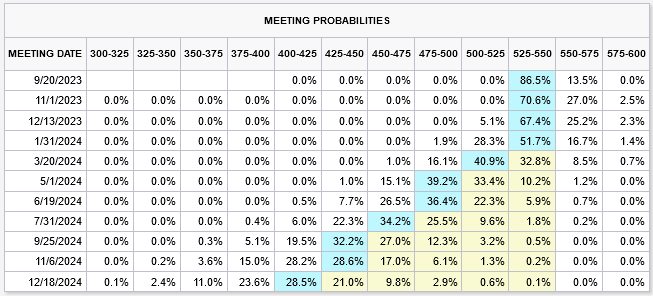
Currently, Fed funds futures are pricing in a less than 30% likelihood of further Fed rate hikes going forward. Market participants will be closely eyeing the forthcoming CPI data, hoping for solid evidence to reinforce these expectations.
However, the week's economic calendar isn't just confined to US inflation data. Other significant indicators on the radar will include UK's GDP figures and Eurozone's Sentix investor confidence index.
Down Under, Australian consumer sentiment and business confidence figures are due for release. Meanwhile, New Zealand's inflation expectations will be another focal point. Lastly, investors will be keeping an eye on China's CPI and PPI data too.
Here are some highlights for the week:
- Monday: BoJ Summary of Opinions, Japan leading indicators; Swiss unemployment rate, foreign currency reserves; Germany industrial production; Eurozone Sentix investor confidence.
- Tuesday: Japan average cash earnings, household spending, current account; Australia Westpac consumer sentiment, NAB business confidence; China trade balance; Germany CPI final; France trade balance; Canada trade balance; US trade balance.
- Wednesday: China CPI, PPI; New Zealand inflation expectations; Canada building permits.
- Thursday: Japan PPI; ECB monthly bulletin; US CPI, jobless claims;.
- Friday: New Zealand BusinessNZ manufacturing index; UK GDP, production, trade balance; US PPI, U of Michigan consumer sentiment.
AUD/USD Daily Report
Daily Pivots: (S1) 0.6536; (P) 0.6573; (R1) 0.6605; More...
Intraday bias in AUD/USD remains neutral for consolidation above 0.6513. Current development argues that larger fall from 0.7156 is still in progress. Below 0.6513 will bring retest of 0.6457 support first. Firm break there will confirm this case and target 100% projection of 0.7156 to 0.6457 from 0.6894 at 0.6195. Nevertheless, on the upside, above 0.6628 minor resistance will mix up the outlook and turn bias back to the upside for stronger rebound.
In the bigger picture, outlook is mixed for now as AUD/USD failed to sustain above both 55 D EMA (now at 0.6696) and 55 W EMA (now at 0.6769). On the upside, break of 0.6894 resistance will solidify the case that down trend from 0.8006 (2021 high) has already completed, and target 0.7156 resistance for confirmation. However, break of 0.6457 will likely resume the down trend through 0.6169 (2022 low).
Economic Indicators Update
| GMT | Ccy | Events | Actual | Forecast | Previous | Revised |
|---|---|---|---|---|---|---|
| 05:00 | JPY | Leading Economic Index Jun P | 108.9 | 108.9 | 109.2 | |
| 06:00 | EUR | Germany Industrial Production M/M Jun | -1.50% | -0.40% | -0.20% | -0.10% |
| 07:00 | CHF | Foreign Currency Reserves (CHF) Jul | 725B | |||
| 08:30 | EUR | Eurozone Sentix Investor Confidence Aug | -25 | -22.5 |
Weaker than Expected NFP
Market movers today
The most important data release this week is US CPI for July due on Thursday. The lower than expected June number played a big role in the improving risk sentiment we saw last month and in lowering rate expectations. Also Norway, Denmark and Switzerland, and several euro area countries, will release CPI data this week, but not Sweden.
Today, the two voting FOMC members Michelle Bowman and Raphael Bostic speak at a "Fed Listens" event in Atlanta, Georgia, and US consumer credit data for June is released at 21.00 CET. In the euro area, we get the Sentix investor confidence survey for August. We will also get June manufacturing data for Germany and Norway this morning.
The 60 second overview
US labour market report: Overall, the US labour market report was slightly weaker than expected. The non-farm payrolls came in at 187k (consensus: 200k, prior: 209k), while private payrolls were at 172k (consensus: 180k, prior: 149k). Unemployment rate ticked lower at 3.5%. Average hourly earnings at 0.4% m/m (consensus: 0.3%, prior: 0.4%), while the y/y figure was at 4.4% (consensus: 4.2%, prior: 4.4%). Overall, the first of two job reports before Fed's September meeting indicates a gradually cooling US labour market, supporting the soft-landing narrative that has gained traction lately. As such, no need for further hikes on the back of this report, but there is still one jobs report and two inflation prints before the September meeting. Fed speakers on the back of the US labour market report are split with Bowman saying that further rate hikes is 'likely' while Bostic and Goolsbee argue for more patience.
Central bank meetings this summer: Major central banks have held their policy meetings in the past two weeks. Both Fed, ECB and BoE hiked their policy rates by 25bp, while the BoJ and RBA were unchanged on the policy rate path. A common approach from Fed and ECB is the continued data dependent approach, while 'patience' has featured in recent BoE and ECB comments from monetary policy members. BoJ took a small step towards policy normalisation with a greater flexibility to its yield curve control, see links to reviews below.
FI: Global yields dropped sharply on the back of weaker than anticipated US labour market report. 10y Germany fell 8bp to 2.56%, while the 2y point declined 6bp. ECB is priced to hike another 18bp, while the Fed by only 8bp. Most of last week was characterized by a bearish steepening of the yield curves with 2s10s EUR swap almost 15bp higher on Thursday compared to Monday morning. The US labour market report reversed 5bp of that move on Friday afternoon alone.
FX: The USD weakened across the board after the US payrolls data, while simultaneously the SEK and the NOK strengthened also vs the EUR. These responses were fundamental in the sense that they were in line with repricing of relative yields. As such and after a streak of weak sessions, the SEK made a sizeable comeback through the end of last week. Risk sentiment and low liquidity will probably continue to play a part for the Scandies, though.
Technical Outlook and Review
DXY:
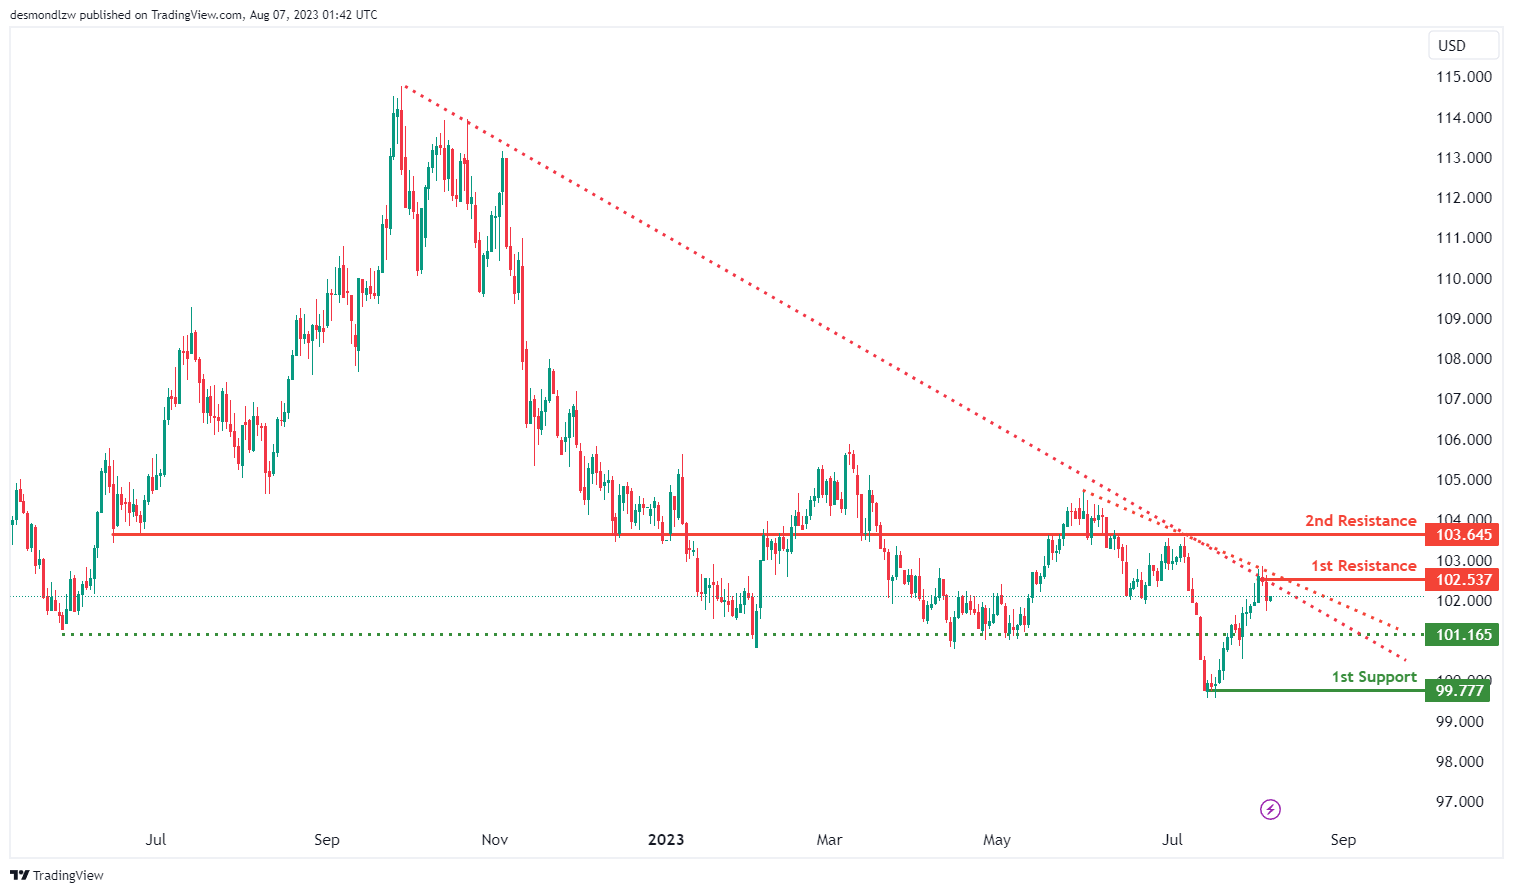
The DXY (US Dollar Index) is currently demonstrating a bearish momentum on the chart, which is driven by its position below a major descending trend line, indicating a potential continuation of the bearish movement.
Considering the prevailing bearish momentum, the price has the potential to further decline, potentially reaching the first support level at 99.77. This support level gains significance as it corresponds to a multi-swing low, making it an essential level to watch.
An intermediate support is also in place at 101.16, supported by its role as a pullback support, which could potentially provide some temporary relief during the downward movement.
On the other side, the market faces resistance levels that may hinder any significant upward movement. The first resistance level stands at 102.53 and holds importance due to its identification as a swing high resistance point.
Furthermore, a 2nd resistance level is observed at 103.64, which gains strength from its status as an overlap resistance level.
EUR/USD:
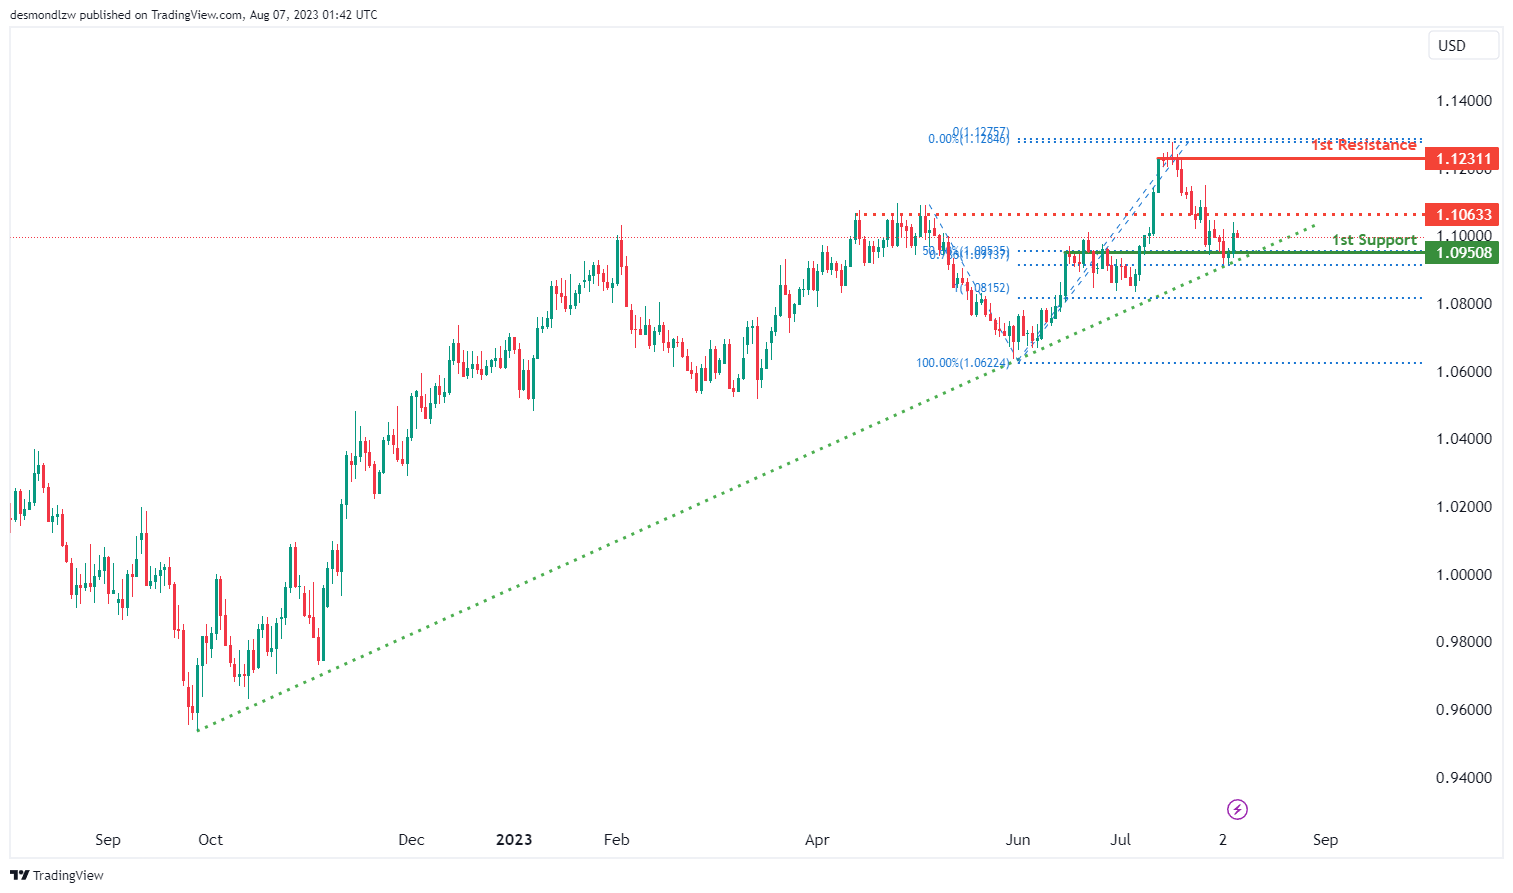
The EUR/USD currency pair is currently experiencing a bullish momentum, as indicated by its position above a rising trendline, suggesting the potential for upward movement in the price.
In the short term, there might be a pullback, and the first support level to watch is at 1.0950. This support level is significant due to its “Fibonacci confluence,” which means that multiple Fibonacci levels converge at this point, reinforcing its strength as a potential support level.
Upon recovery from the pullback, the price may target the intermediate resistance at 1.1063. This resistance level is characterized by “overlap protection,” indicating the presence of historical price levels or technical indicators clustering at this point, making it an important barrier to further price advances.
The first resistance level at 1.1231 is another key level to watch, known for its “high multi-swing resistance.” This level has acted as a strong barrier to price movement during various bullish swings in the past, making it a significant reference point for potential profit-taking or consolidation signals.
EUR/JPY:
The EUR/JPY chart is currently showing a bullish momentum, and this is attributed to the fact that the price is positioned above the bullish Ichimoku cloud, which indicates positive sentiment.
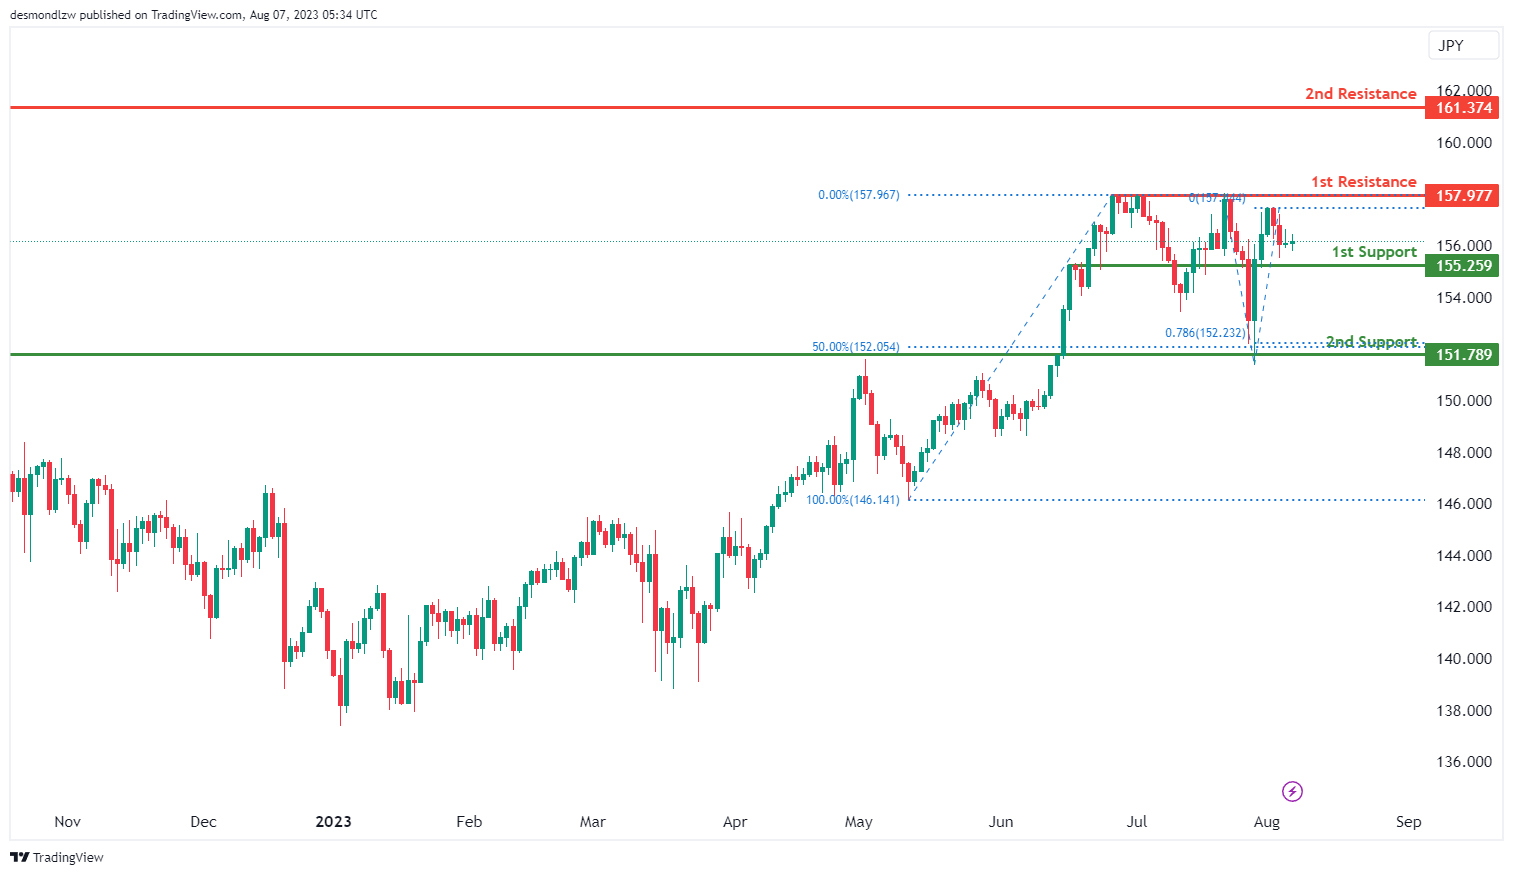
There is a potential for a bullish continuation towards the first resistance level. The first support at 155.25 is considered strong due to its overlap support. Additionally, the 2nd support at 151.78 is reinforced by being a pullback support and coinciding with the 50% Fibonacci Retracement level, making it an important level of interest.
On the resistance side, the first level at 157.97 is significant as it represents a multi-swing high resistance, indicating potential selling pressure at that level. The 2nd resistance at 161.37 is also noteworthy, being an overlap resistance, suggesting potential obstacles to further price movement beyond this point.
EUR/GBP:
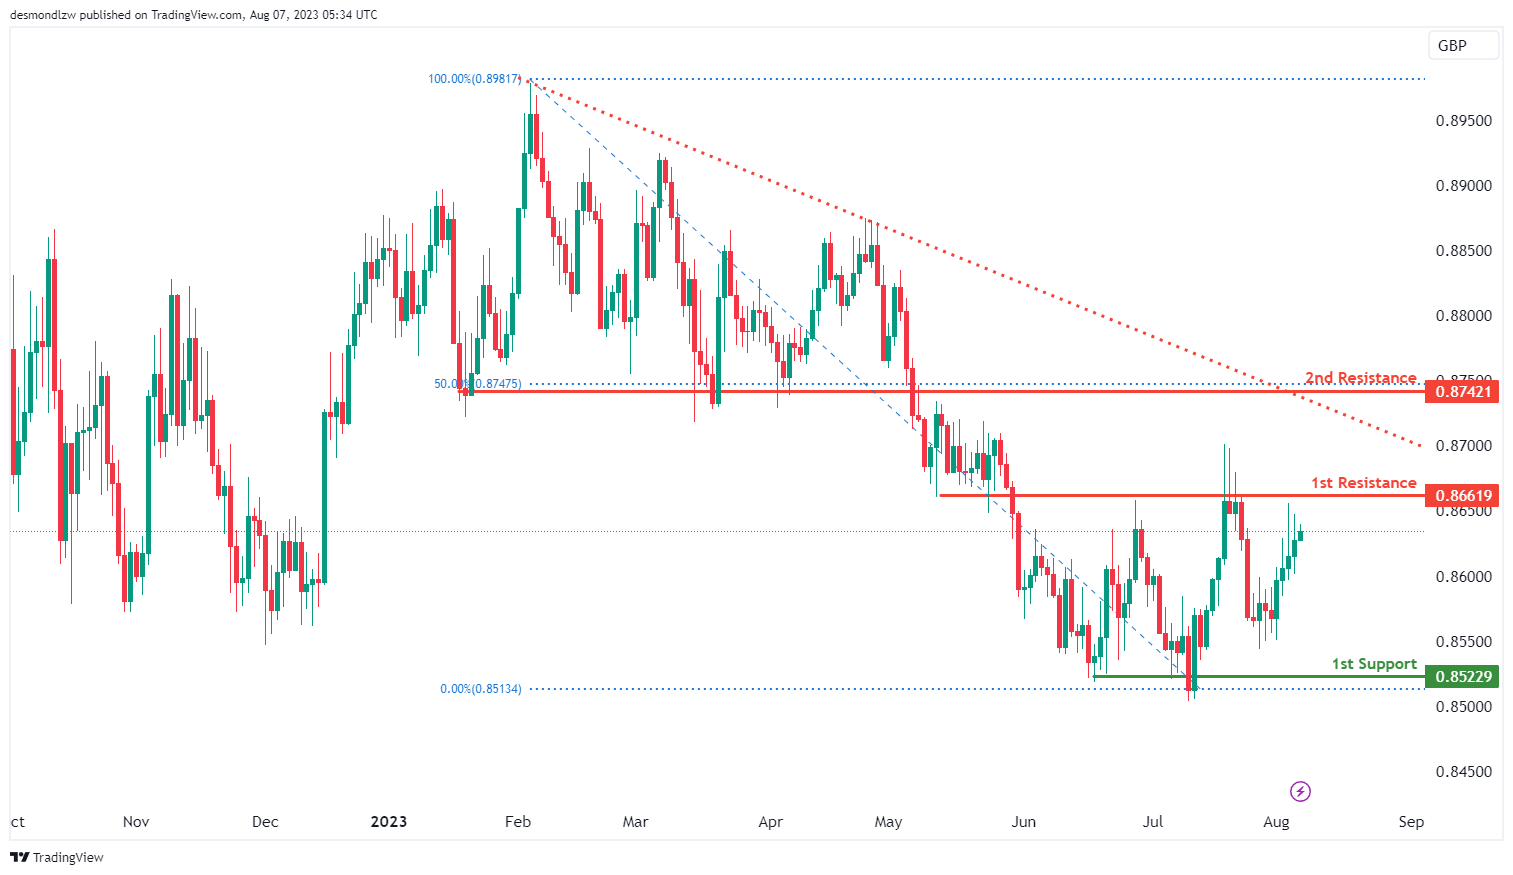
The EUR/GBP instrument is currently showing a bearish overall momentum on the chart. The price could potentially make a bearish reaction off the first resistance level at 0.8661 and drop to the first support level at 0.8522.
The first support level at 0.8522 is notable due to its role as a multi-swing low support. The 2nd support, located at 0.8393, is identified as an overlap support.
On the resistance side, the first resistance level at 0.8661 is significant because of its role as a pullback resistance. The 2nd resistance, situated at 0.8742, is marked by a pullback resistance and aligns with a 50% Fibonacci Retracement.
GBP/USD:
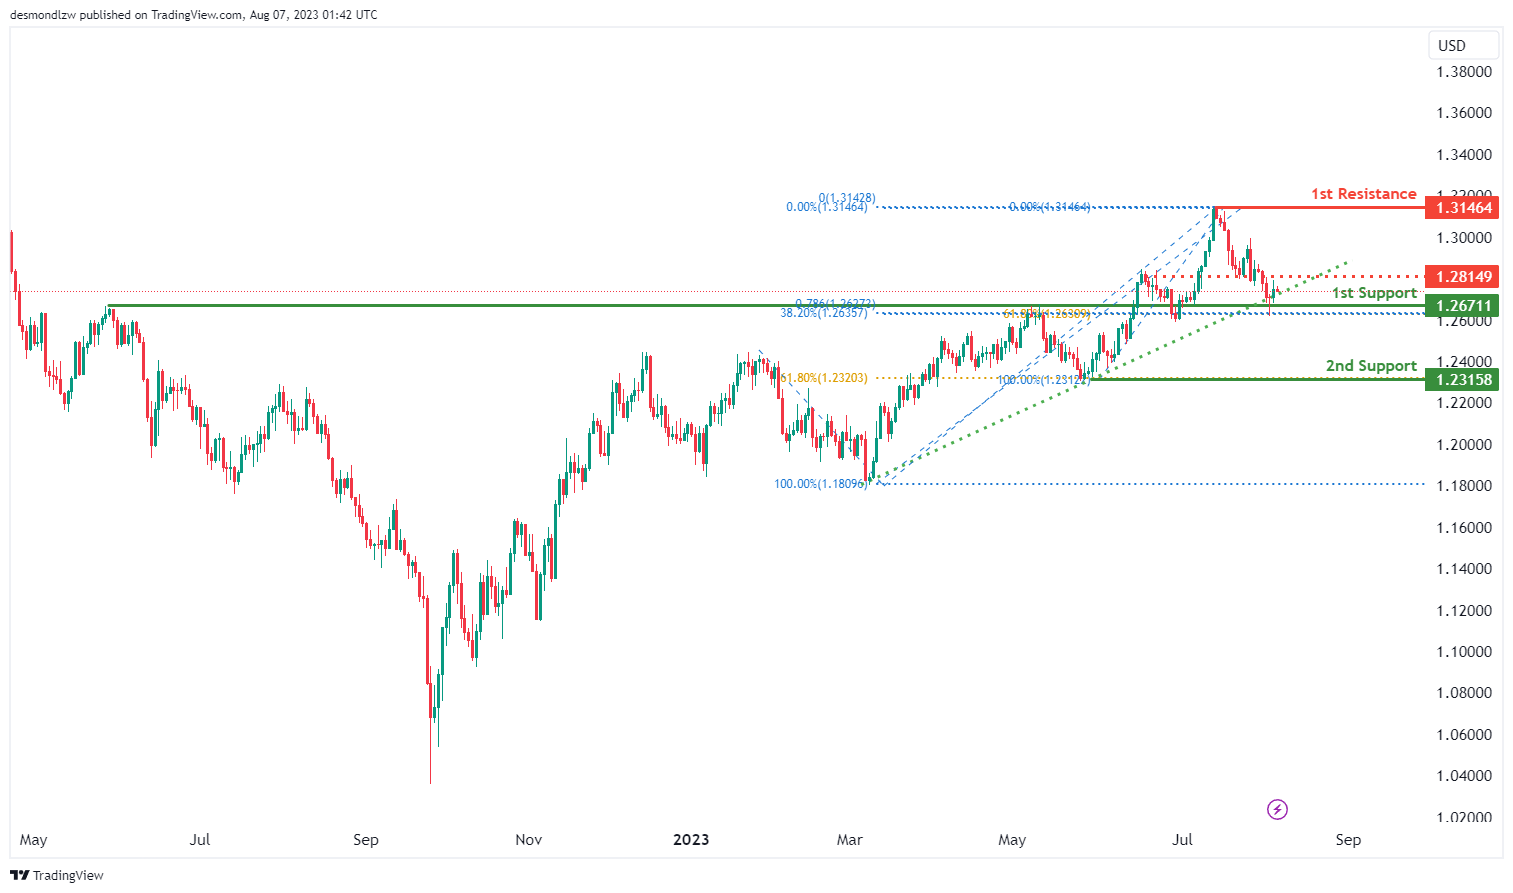
The GBP/USD chart currently displays a bullish momentum, which is supported by a rising trend line, indicating a positive trend in the price movement.
On the support side, there are two crucial levels to watch. The first support level is at 1.2671, and it holds significance as it aligns with both the “38.20% Fibonacci retracement” and the “61.80% Fibonacci projection.” This convergence of Fibonacci levels reinforces the strength of this support level
The 2nd support level is at 1.2315 and is characterized by both “low swing support” and a “61.80% Fibonacci retracement.” This level has previously provided support during bullish swings, making it a key area to watch for potential price reactions.
On the resistance side, two significant levels stand out. The first resistance level is at 1.3146 and is identified as a “multi-swing high.” This level has acted as a strong barrier to price movement during various bullish swings in the past, adding to its importance as a resistance level.
Additionally, an intermediate resistance is observed at 1.2814, characterized by “overlap resistance.” This level is significant because it indicates the presence of historical price levels or technical indicators clustering at this point, potentially acting as another barrier to further price advances.
GBP/JPY:
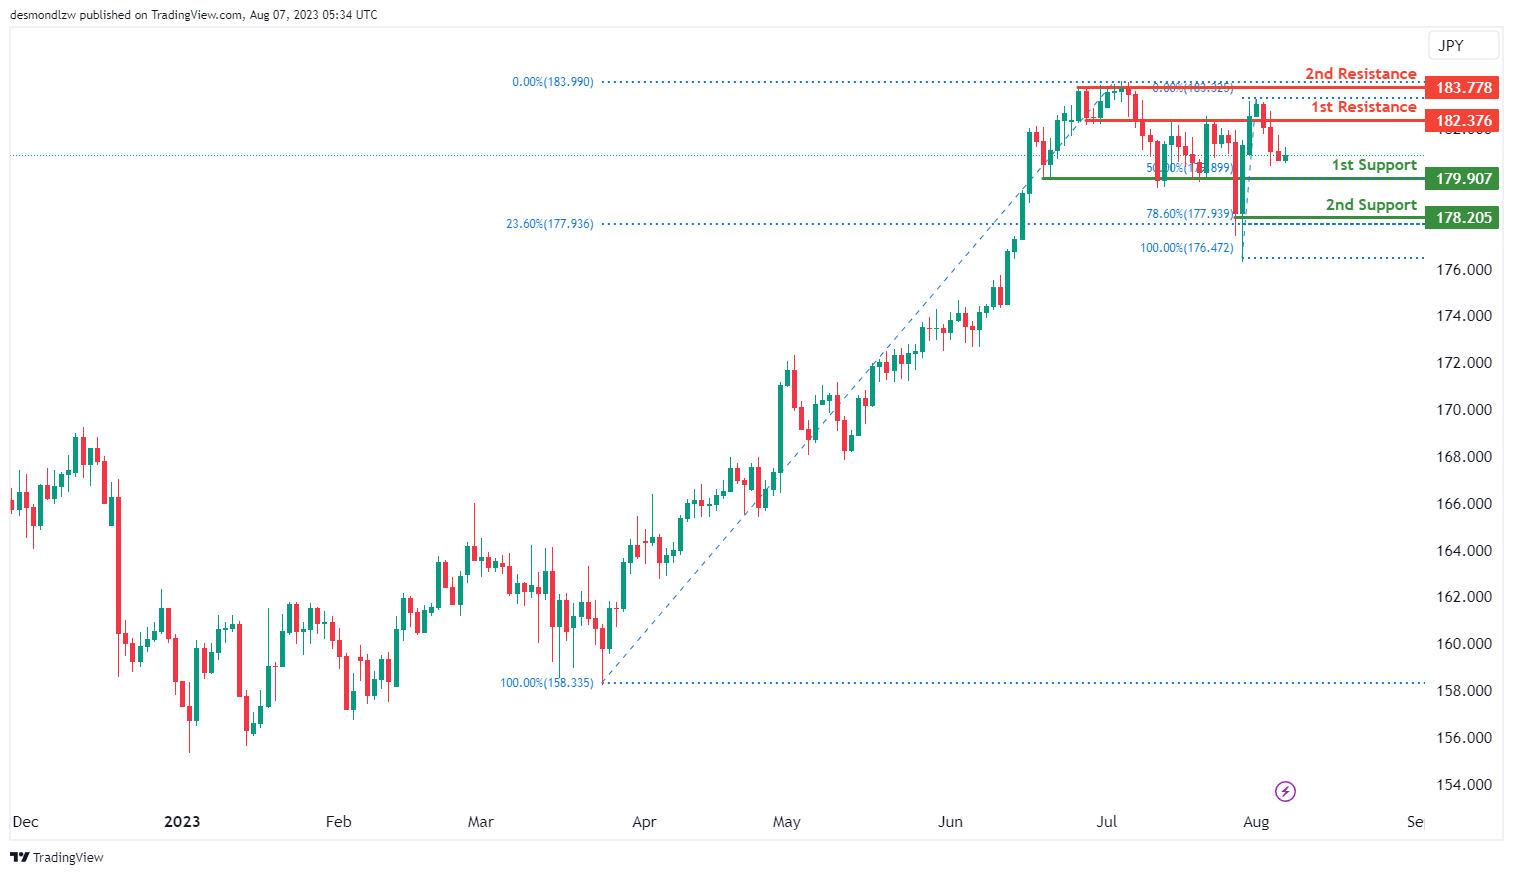
The GBP/JPY chart is showing a bullish overall momentum, suggesting a positive sentiment in the market.
There is a potential for a bullish continuation towards the first resistance level. The first support at 179.90 is considered strong as it represents an overlap support and aligns with the 50% Fibonacci Retracement level, making it a significant level for potential buyers.
Additionally, the 2nd support at 178.20 is reinforced by being a swing low support, and it also coincides with the confluence of the 78.60% and 23.60% Fibonacci Retracement levels, further enhancing its importance as a support level.
On the resistance side, the first level at 182.37 is significant due to its overlap resistance, indicating potential selling pressure at that level. The 2nd resistance at 183.77 is also noteworthy as it represents a multi-swing high resistance and is further strengthened by being at the 50% Fibonacci Retracement level, suggesting a potential obstacle to further price movement beyond this point.
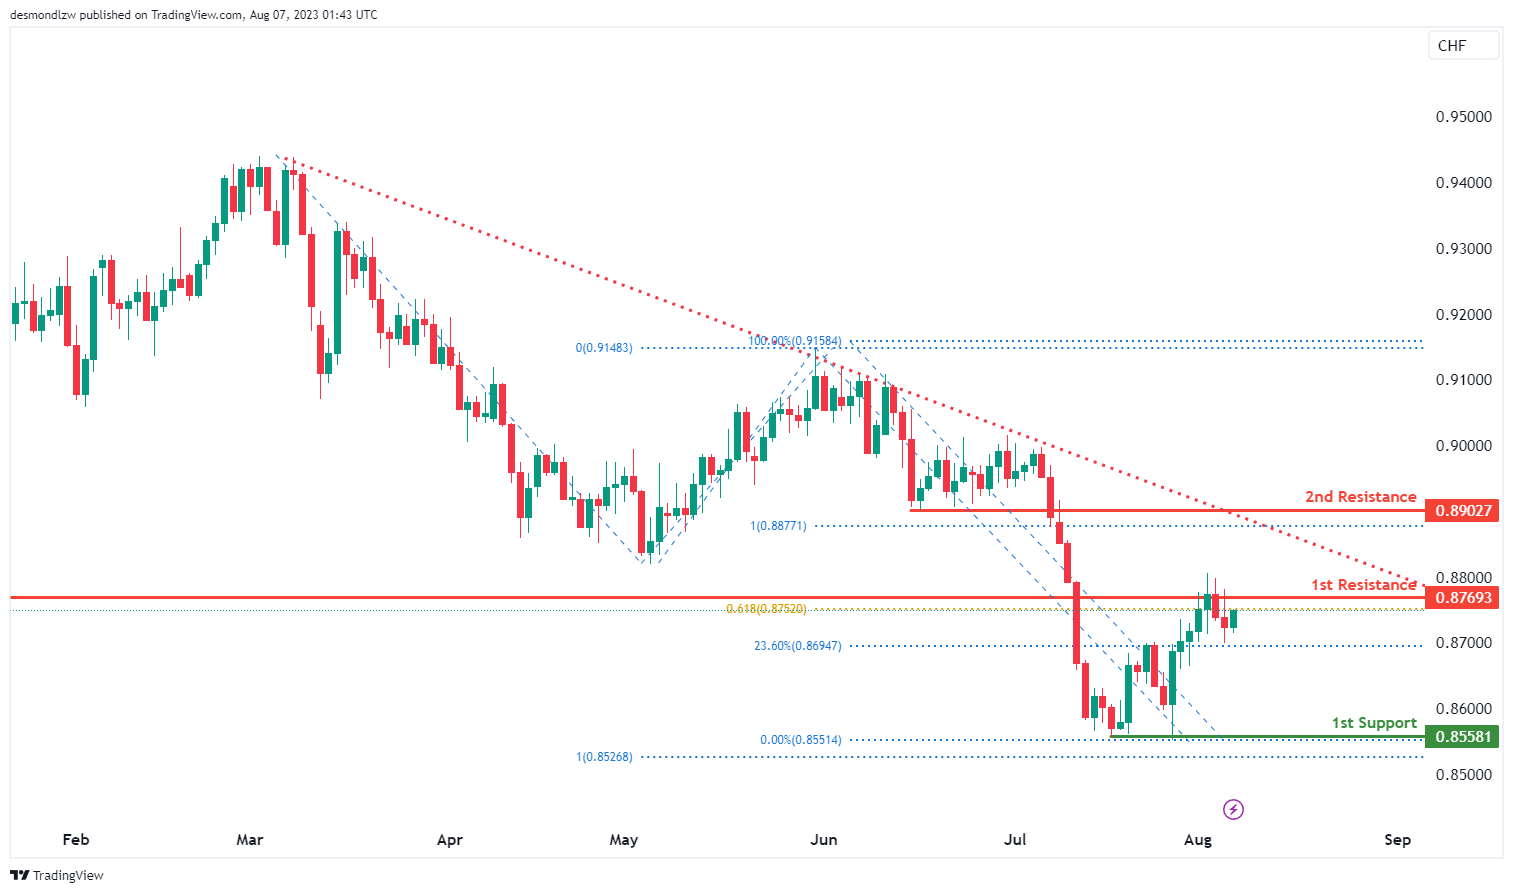
USD/CHF:
The USD/CHF’s overall momentum is bearish, with the price below a significant declining trend line, indicating an imminent bearish momentum.
Price is expected to potentially make the following moves: a bearish reaction off the first resistance and drop to the first support level.
This support level at 0.8558 is considered significant due to “Low multi-swing support.” It has previously acted as a reliable support during various bearish swings, making it an essential level to watch for potential price reactions.
The first resistance level at 0.8769 is noteworthy for two reasons. Firstly, it has a “Fibonacci projection” with a “61.80% overlap resistance.” The presence of historical price convergence and technical significance at this level suggests it may act as a strong barrier to further price advances.
The 2nd resistance level at 0.8902 is significant due to its “Fibonacci retracement resistance of 100% projection.” This level’s technical significance implies that it may serve as a formidable barrier to price movement during bullish swings.
USD/JPY:
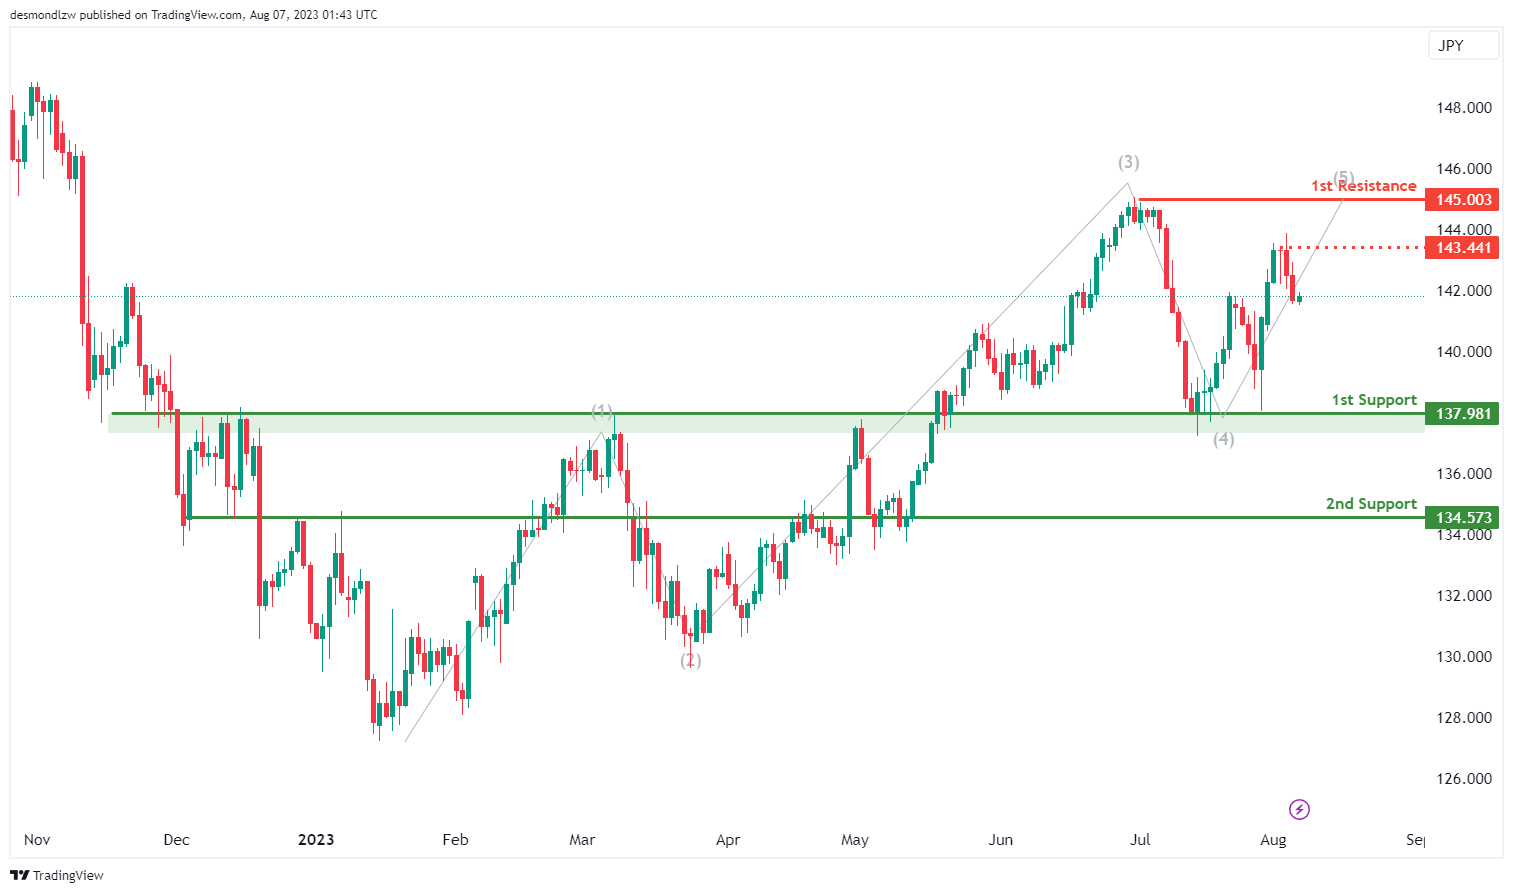
The USD/JPY’s overall momentum is bullish, indicating a positive trend in the price movement.
Price is expected to potentially make a bullish continuation towards the first resistance level.
This support level at 137.98 is considered significant due to “Overlap assistance.” Historical price convergence and technical indicators align at this point, reinforcing its strength as a reliable support level..
The 2nd support level at 134.57 holds importance as “Pullback assistance.” This level has shown its ability to provide support during price pullbacks in the past..
The first resistance level at 145.00 is noteworthy due to its status as a “High resistance swing.” This level has acted as a strong barrier to price movement during previous bullish swings.The 2nd resistance level at 143.44 is significant as a “High multi-swing resistance.” In the past, this level has proved to be a formidable barrier during various bullish swings
USD/CAD:
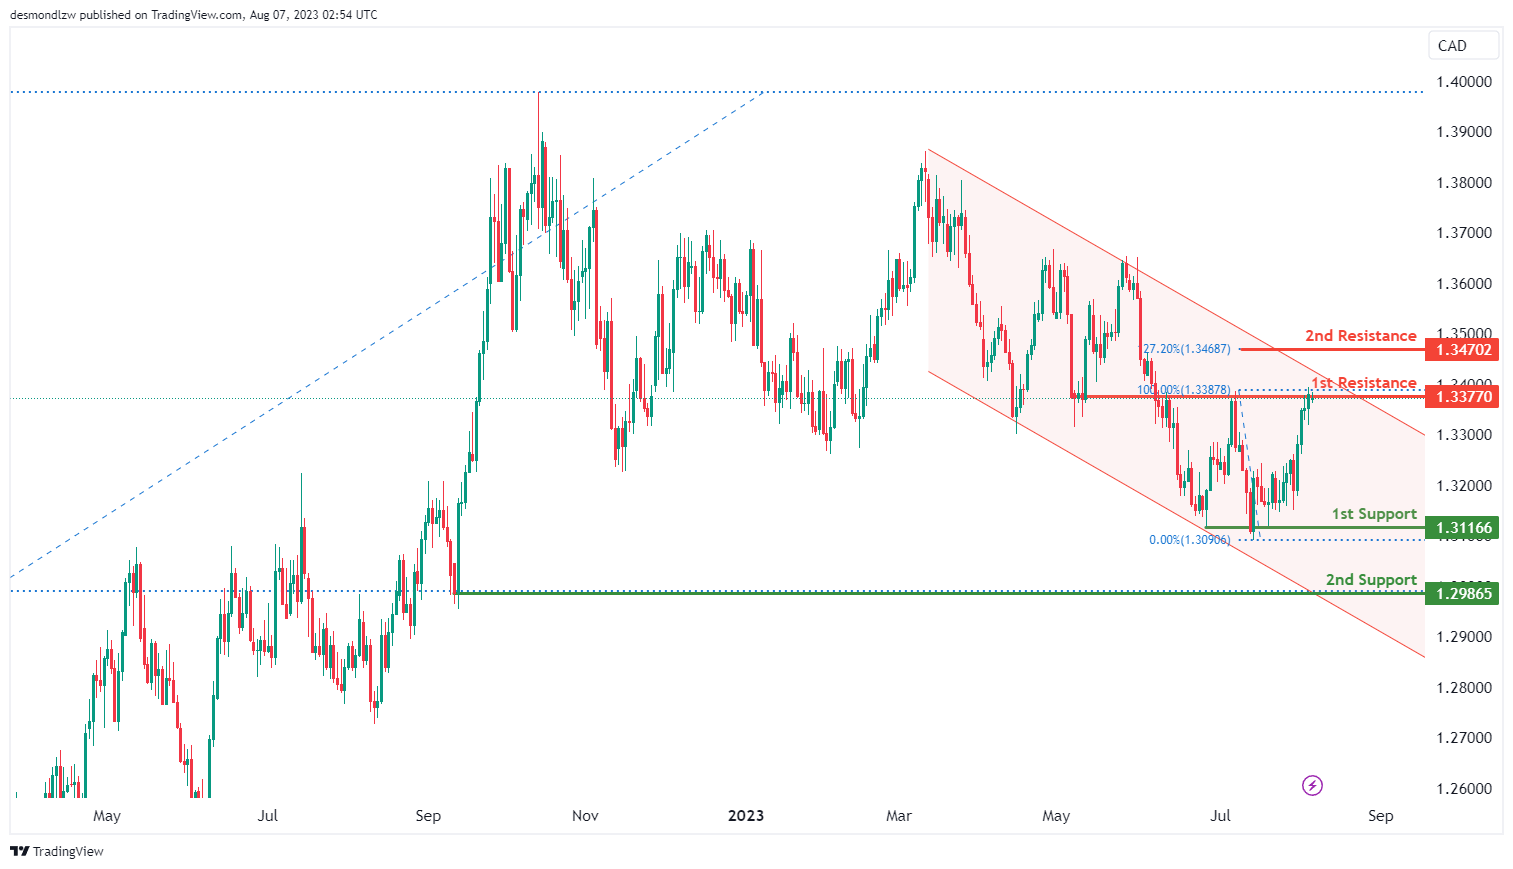
The USD/CAD pair is currently displaying a bearish momentum, indicating a possible bearish reaction off the first resistance and then dropping to the first support level.
The first support level is at 1.3117, identified as an overlap support where price has previously found both support in the past. The 2nd support level at 1.2987 which represents a pullback support that is reinforced by the 50% Fibonacci retracement level.
On the upside, the first resistance level is at 1.3377 which is identified as an overlap resistance, making it a potential obstacle for an upward price movement. Should the price break above this level, the 2nd resistance at 1.3470 may come into play. This is a resistance level that aligns with the 127.20% Fibonacci extension level which could potentially act as a barrier for further upside movement.
AUD/USD:
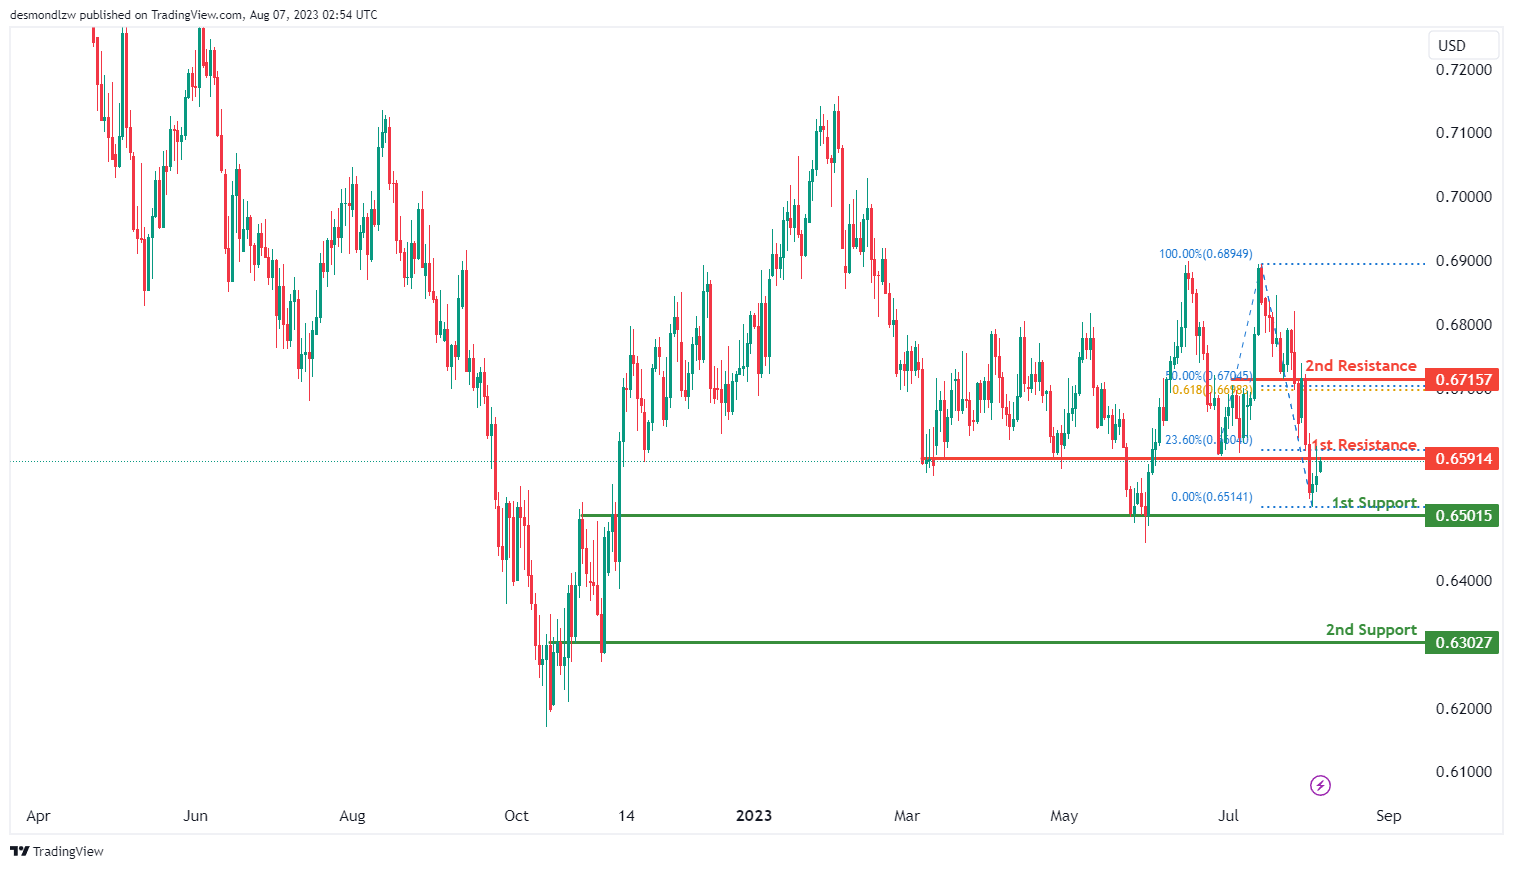
The AUD/USD pair is currently demonstrating a weak bullish trend with low confidence. The expectation is for a bullish break through off the first resistance level leading towards the 2nd resistance level.
The first resistance level at 0.6591 is an overlap resistance that aligns with the 23.60% Fibonacci retracement level. Should the price break above this level, the 2nd resistance at 0.6716 may come into focus. This level is recognized as an overlap resistance that aligns with a confluence of Fibonacci levels i.e. the 50.00% retracement and 61.80% projection levels.
To the downside, the first support level at 0.6502 is recognized as an overlap support. If the price breaches this level, the 2nd support level is at 0.6303. This level has also been identified as an overlap support.
NZD/USD
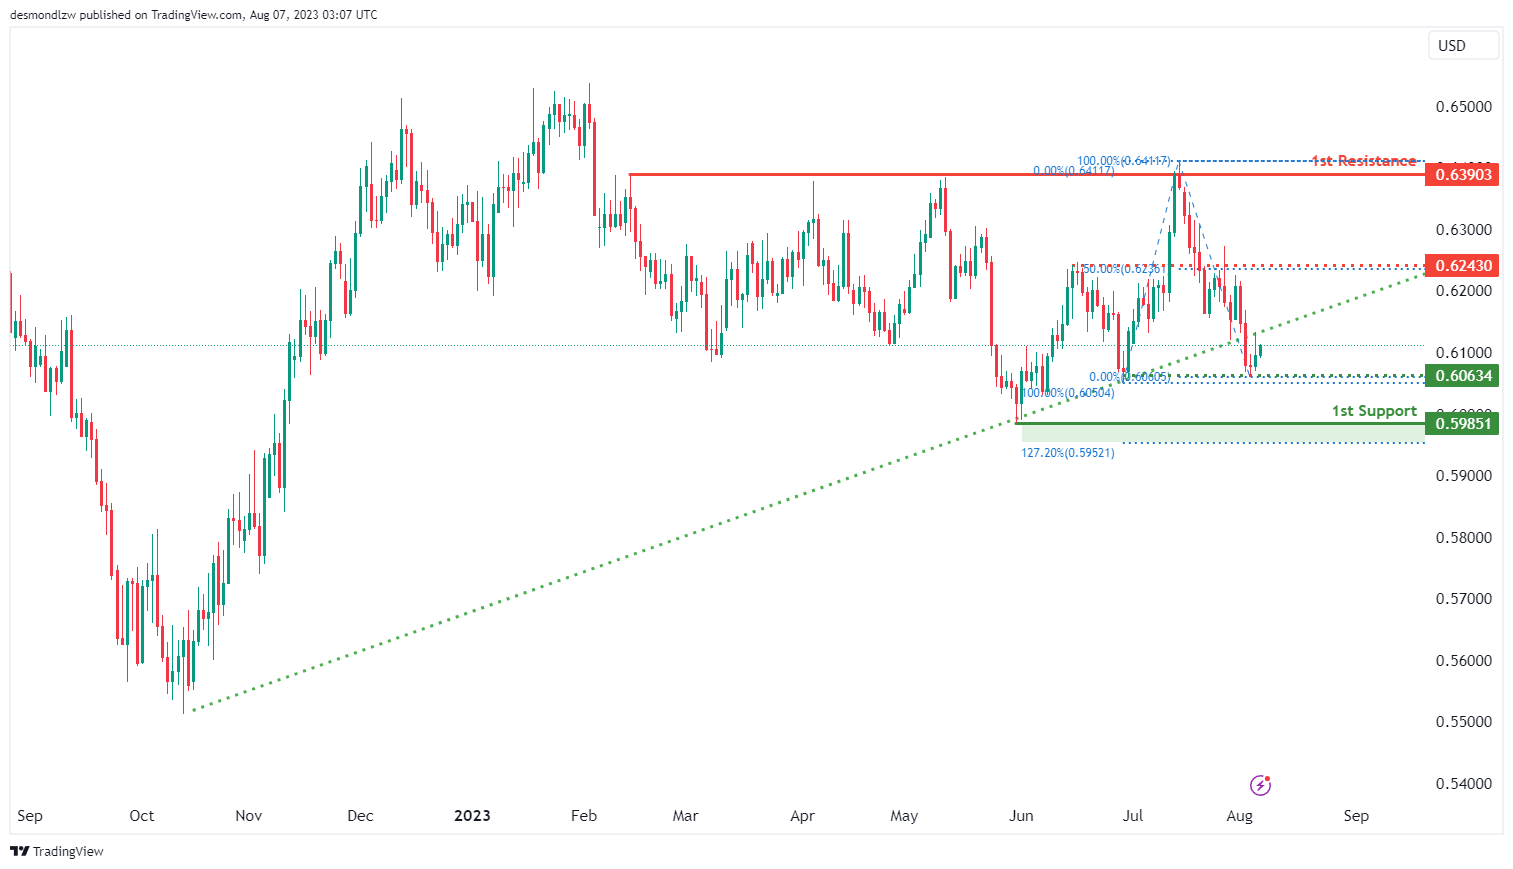
The NZD/USD pair is currently demonstrating a weak bullish trend with low confidence. Price has bounced off the intermediate support level and the expectation is for a bullish break above the ascending trendline.
The intermediate support level at 0.6063 is an overlap support level. Should price breach this level, the
first support level is at 0.5985. This level is identified as a swing-low support that aligns close to the 127.20% Fibonacci extension level, suggesting a significant support barrier.
On the other hand, if the bullish trend continues, the intermediate resistance level is at 0.6243. This level is identified as a pullback resistance and is further reinforced by the 50% Fibonacci retracement level. Should the price surpass this level, the first resistance is at 0.6390. This level is recognized as an overlap resistance, suggesting that it could be a tough level for the bullish momentum to overcome.
DJ30:
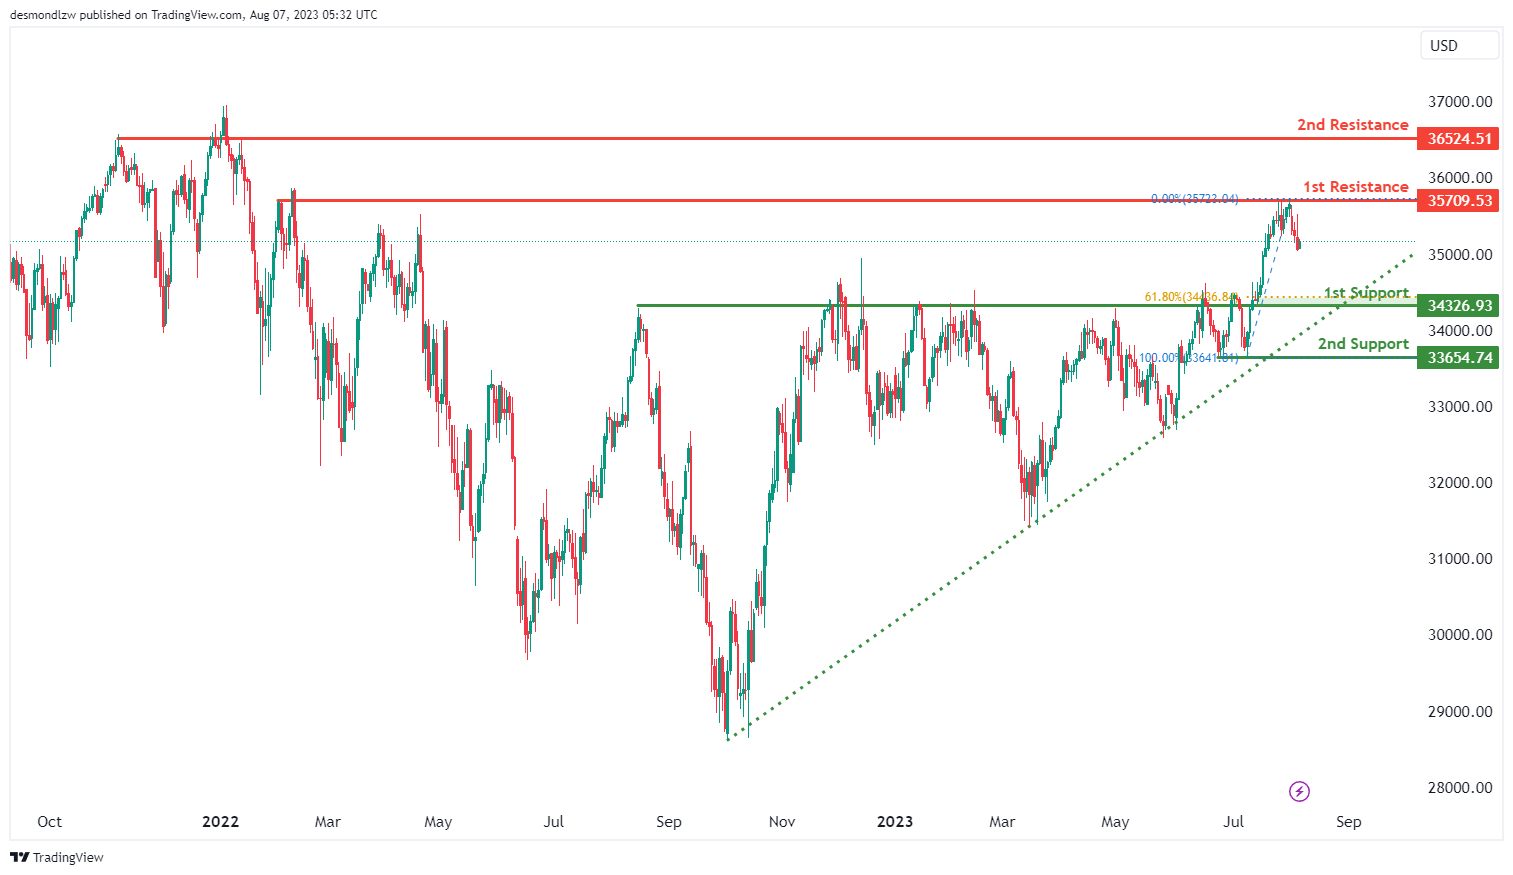
The DJ30 instrument is currently showing a bullish overall momentum on the chart. One of the factors contributing to this momentum is that the price is above the bullish Ichimoku cloud. In the short term, the price could potentially drop further to the first support level at 34326.93 before bouncing from there and rising to the first resistance level at 35709.53.
The first support level at 34326.93 is significant as it acts as a pullback support and corresponds with a 61.80% Fibonacci Retracement. The 2nd support, located at 33654.74, is identified by a multi-swing low support.
On the resistance side, the first resistance level at 35709.53 is notable due to its status as a multi-swing high resistance. The 2nd resistance, situated at 36524.51, is marked by an overlap resistance.
GER30:
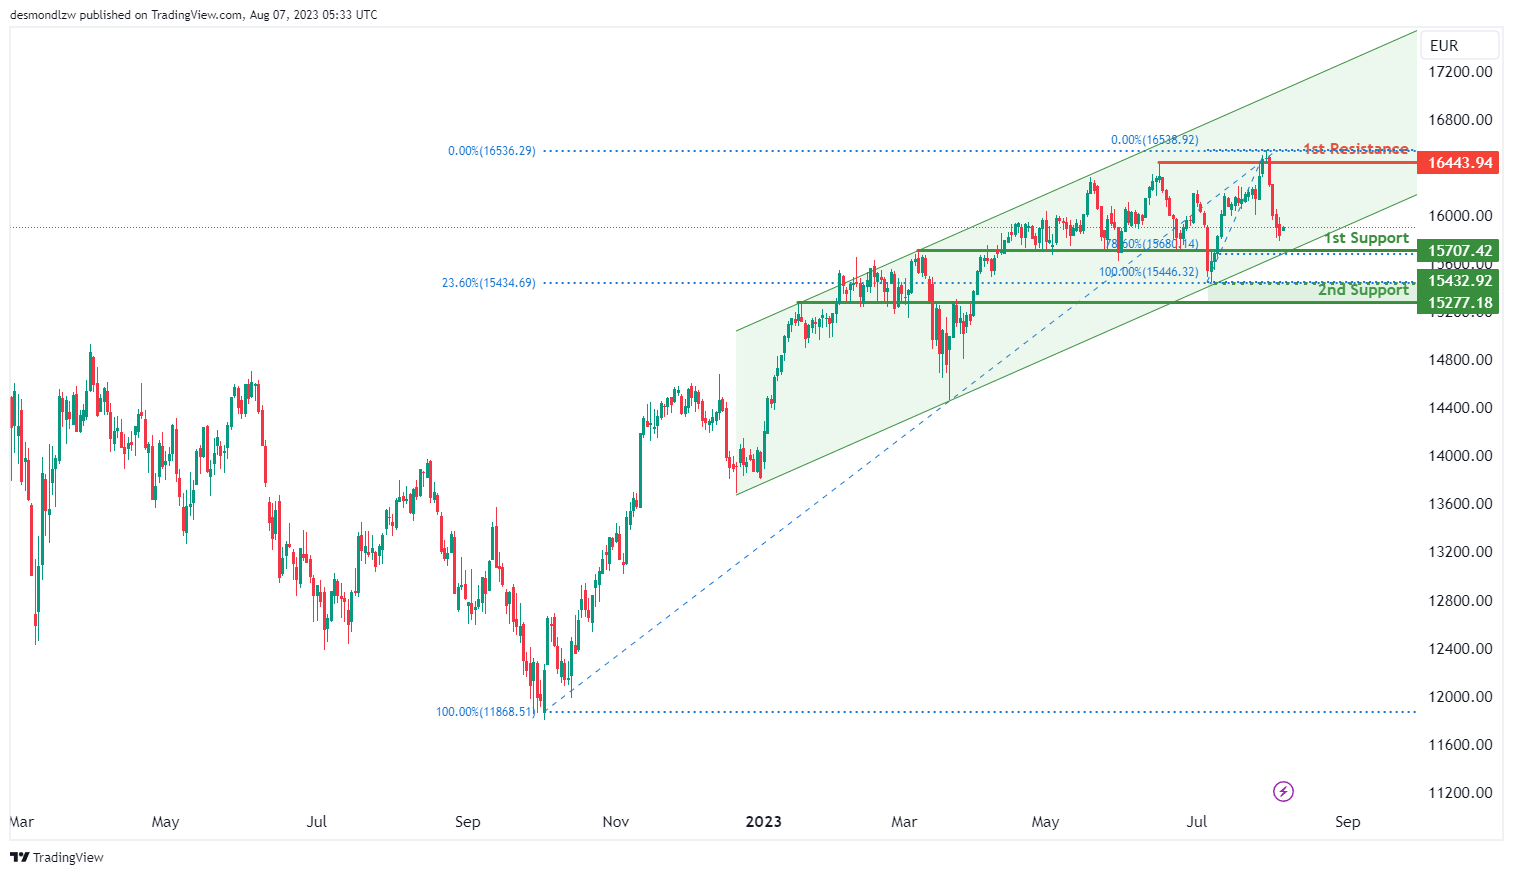
The GER30 instrument is currently showing a bullish overall momentum on the chart. The price could potentially make a bullish bounce off the first support level at 15707.42 and head towards the first resistance level at 16443.94.
The first support level at 15707.42 is notable for its role as an overlap support and coincides with a 78.60% Fibonacci Retracement. The 2nd support, located at 15277.18, is also identified as an overlap support and is at a 23.60% Fibonacci Retracement.
On the resistance side, the first resistance level at 16443.94 is marked by a multi-swing high resistance. Additionally, an intermediate support level at 15432.92 is worth noting for its role as a swing low support.
US500
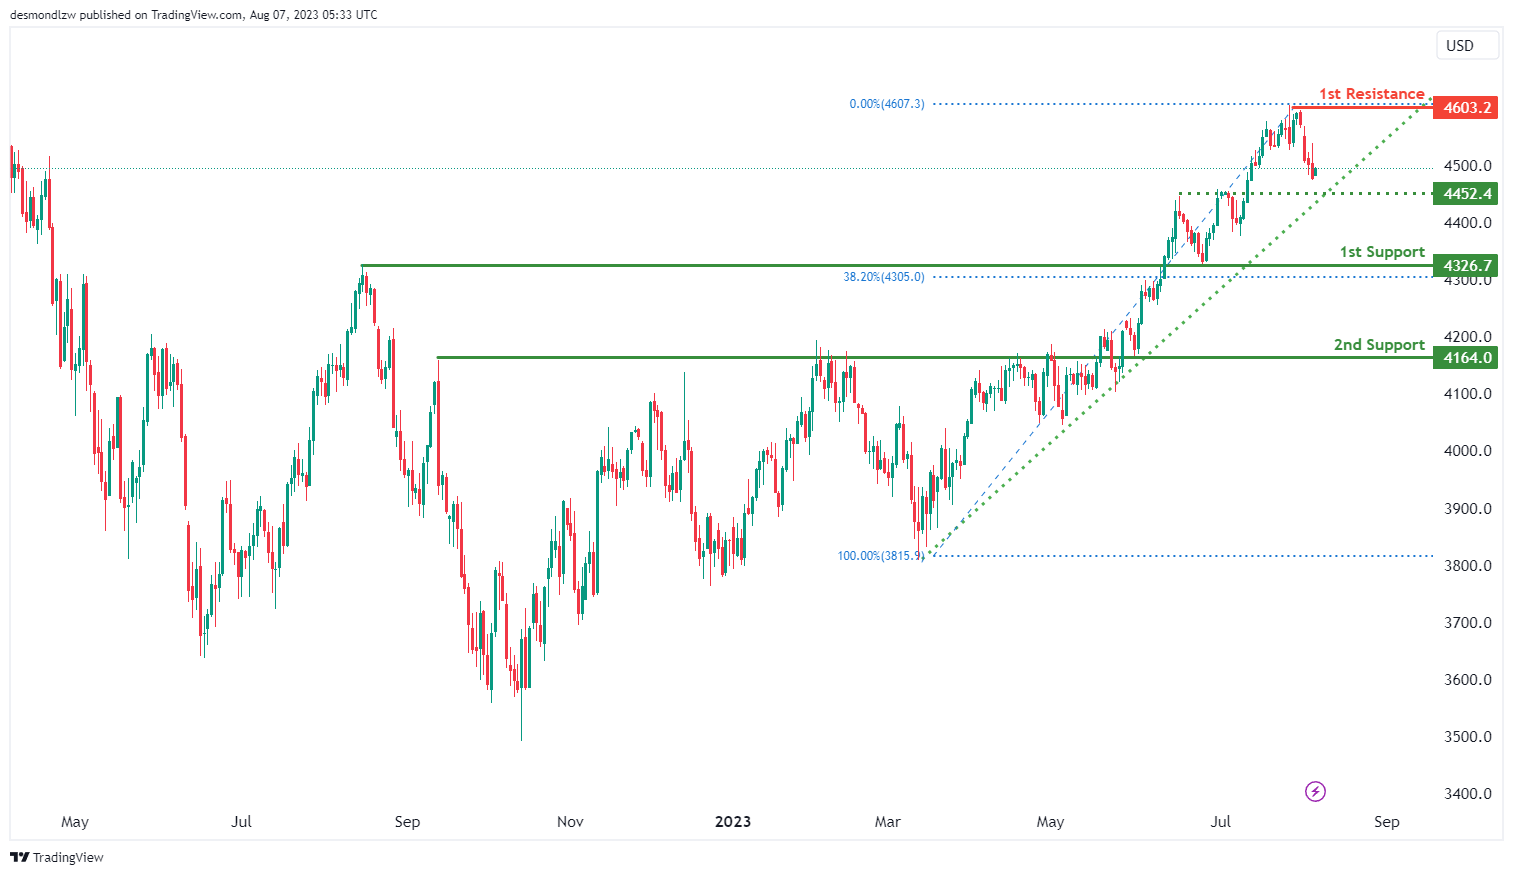
The US500 instrument is currently showing a bullish overall momentum on the chart. A contributing factor to this momentum is that the price is above a major ascending trend line, which suggests further bullish momentum may be on the horizon. The price could potentially continue in a bullish direction towards the first resistance level at 4603.2.
The first support level at 4326.7 is notable due to its role as a pullback support and its alignment with a 38.20% Fibonacci Retracement. The 2nd support, located at 4164.0, is identified as another pullback support.
On the resistance side, the first resistance level at 4603.2 is significant for its role as a swing high resistance. The 2nd resistance, situated at 4749.9, is marked by a multi-swing high resistance.
Additionally, an intermediate support level at 4452.4 is worth noting due to its function as a pullback support.
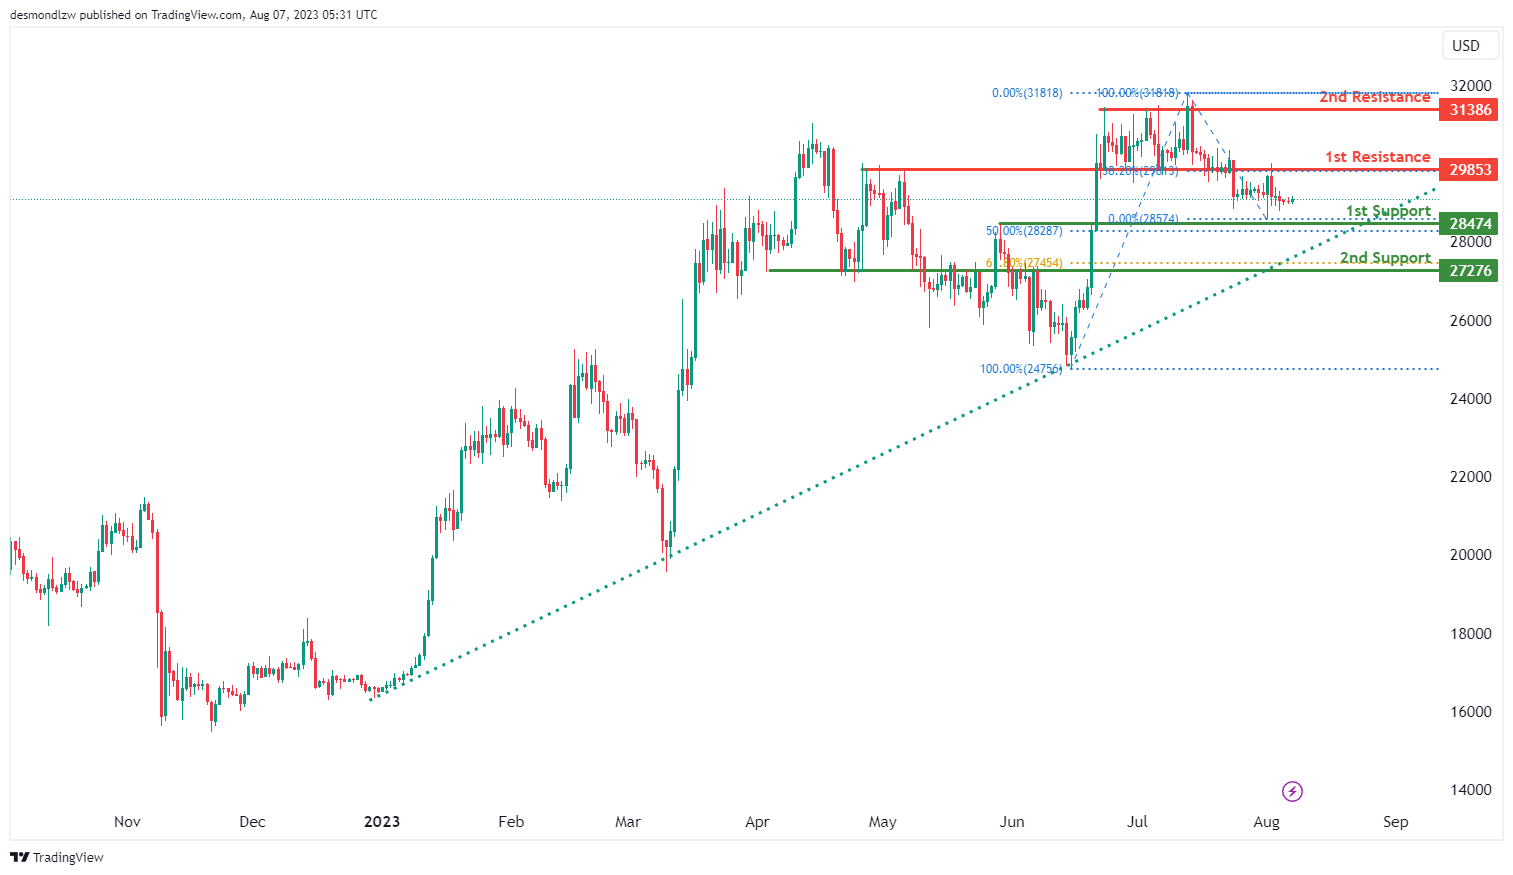
BTC/USD:
The BTC/USD instrument is currently demonstrating a neutral overall momentum on the chart. The price is predicted to fluctuate between the first resistance level at 29853 and the first support level at 28474.
The first support level at 28474 is notable because it serves as a pullback support and also aligns with a 50% Fibonacci Retracement. The 2nd support, located at 27276, is marked by an overlap support and a 61.80% Fibonacci Retracement.
On the other hand, the first resistance level at 29853 is identified by an overlap resistance and a 38.20% Fibonacci Retracement. The 2nd resistance, at 31386, is significant due to its role as a multi-swing high resistance.
ETH/USD:
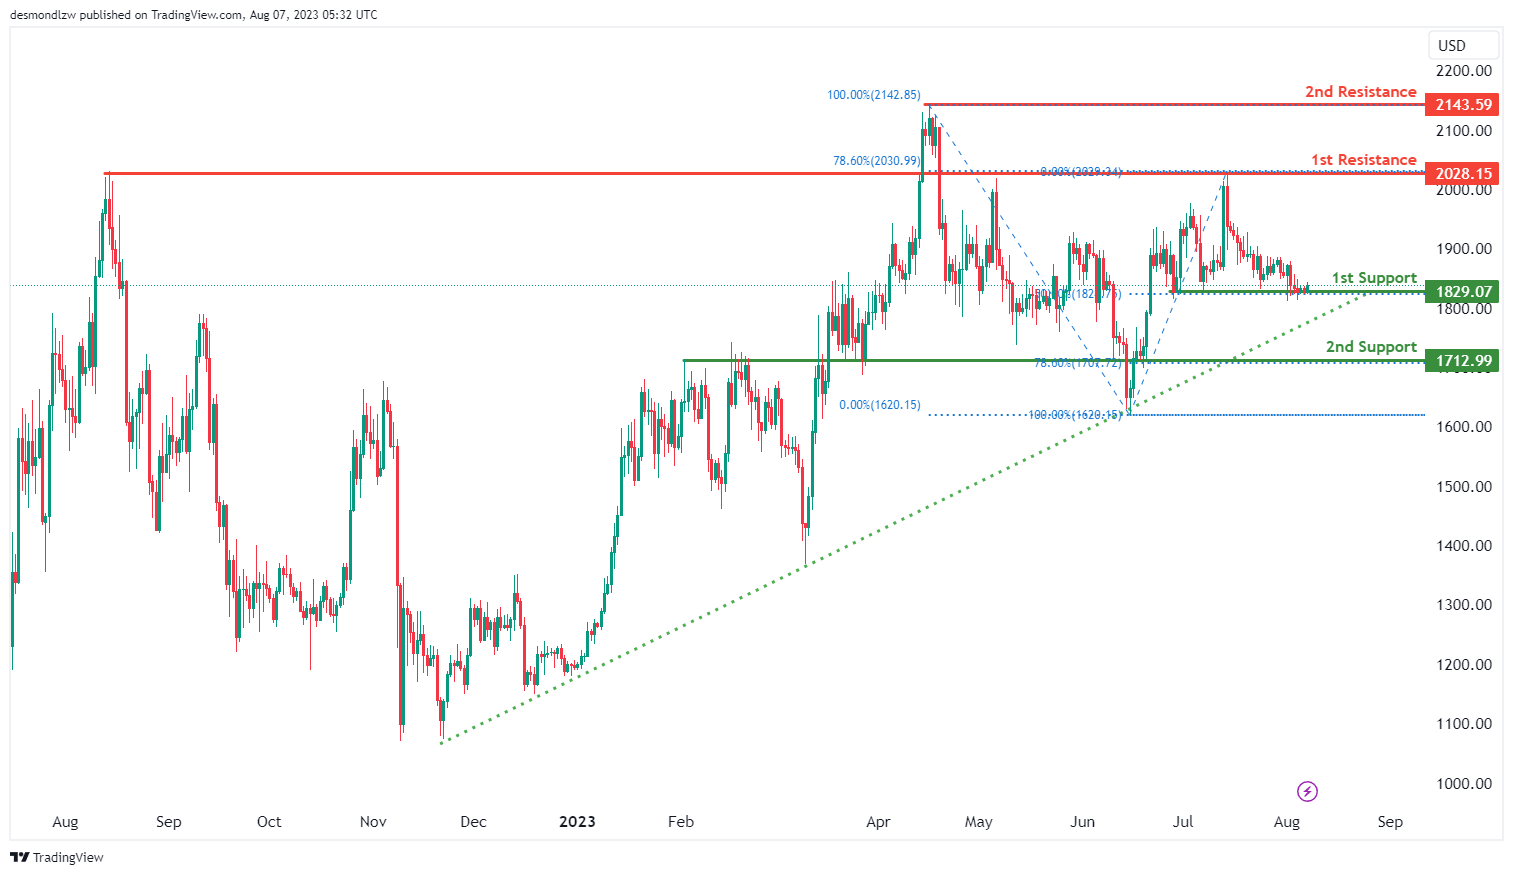
The ETH/USD instrument is currently displaying a bullish overall momentum on the chart. The price could potentially make a bullish bounce off the first support level at 1829.07 and head towards the first resistance level at 2028.15.
The first support level at 1829.07 is noteworthy because it represents a multi-swing low support and coincides with a 50% Fibonacci Retracement. The 2nd support, situated at 1712.99, is characterized by an overlap support and a 78.60% Fibonacci Retracement.
Meanwhile, the first resistance level at 2028.15 is identified by an overlap resistance and a 78.60% Fibonacci Retracement. The 2nd resistance, located at 2143.59, is significant due to its status as a swing high resistance.
WTI/USD:
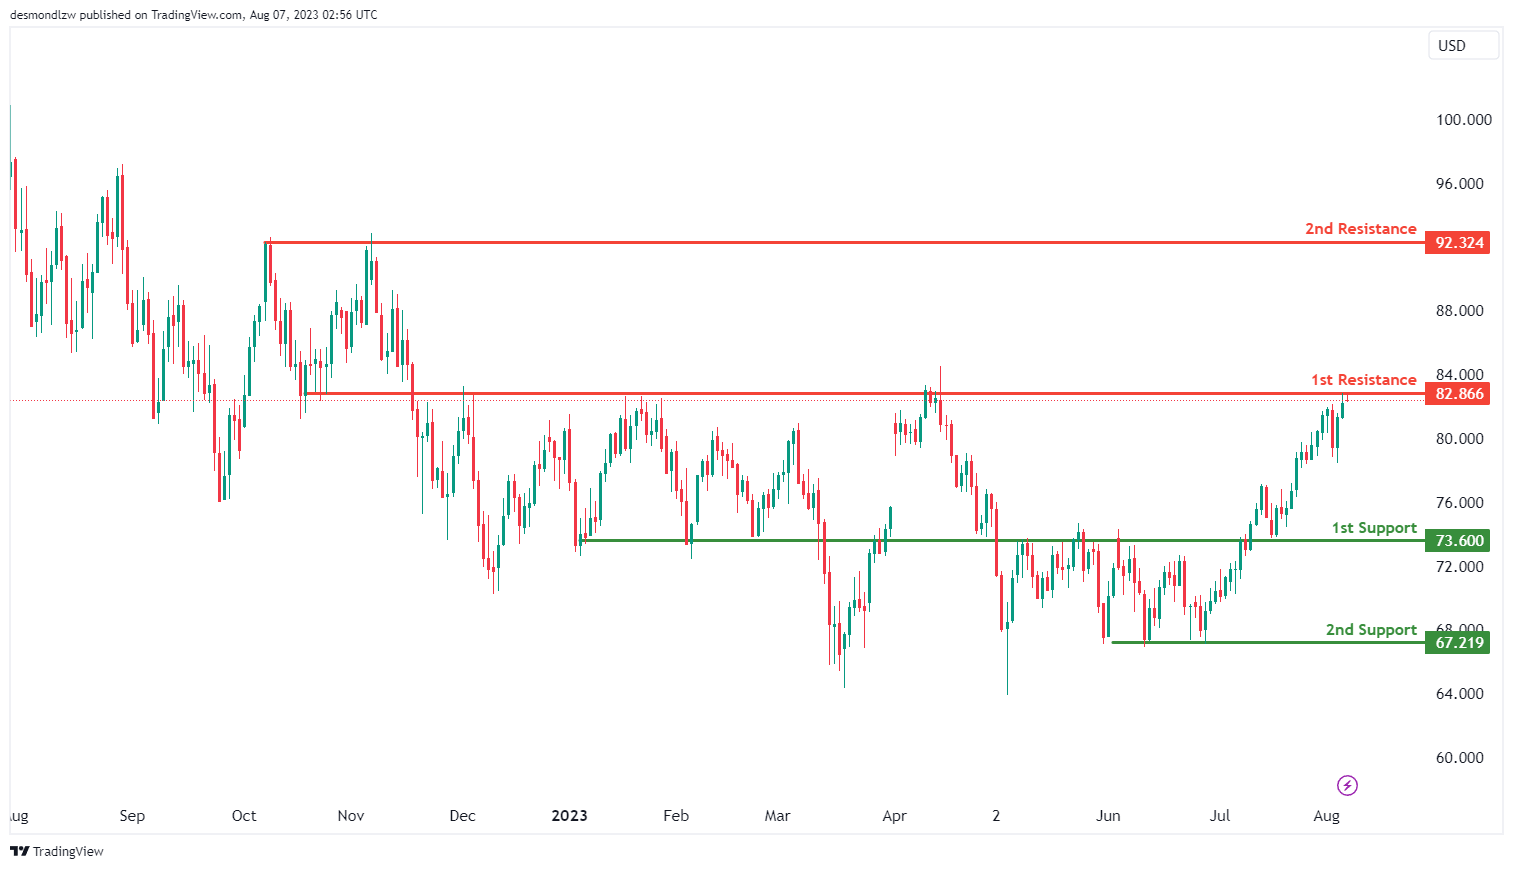
The WTI Crude Oil (West Texas Intermediate) is currently demonstrating a bearish momentum. It is anticipated that price could potentially react off the first resistance level and drop towards the first support.
The first support level is situated at 73.60 which represents an overlap support level. Should the price fall below this first support level, the 2nd support is at 67.22. This level serves as an overlap support and could potentially serve as a significant support barrier.
To the upside, the first resistance level lies at 82.87 which is identified as an overlap resistance. Beyond this point, the 2nd resistance level is at 92.32. This level is an overlap resistance that was tested a couple of times in the past. If the price reaches this level, it could face significant resistance.
XAU/USD (GOLD):
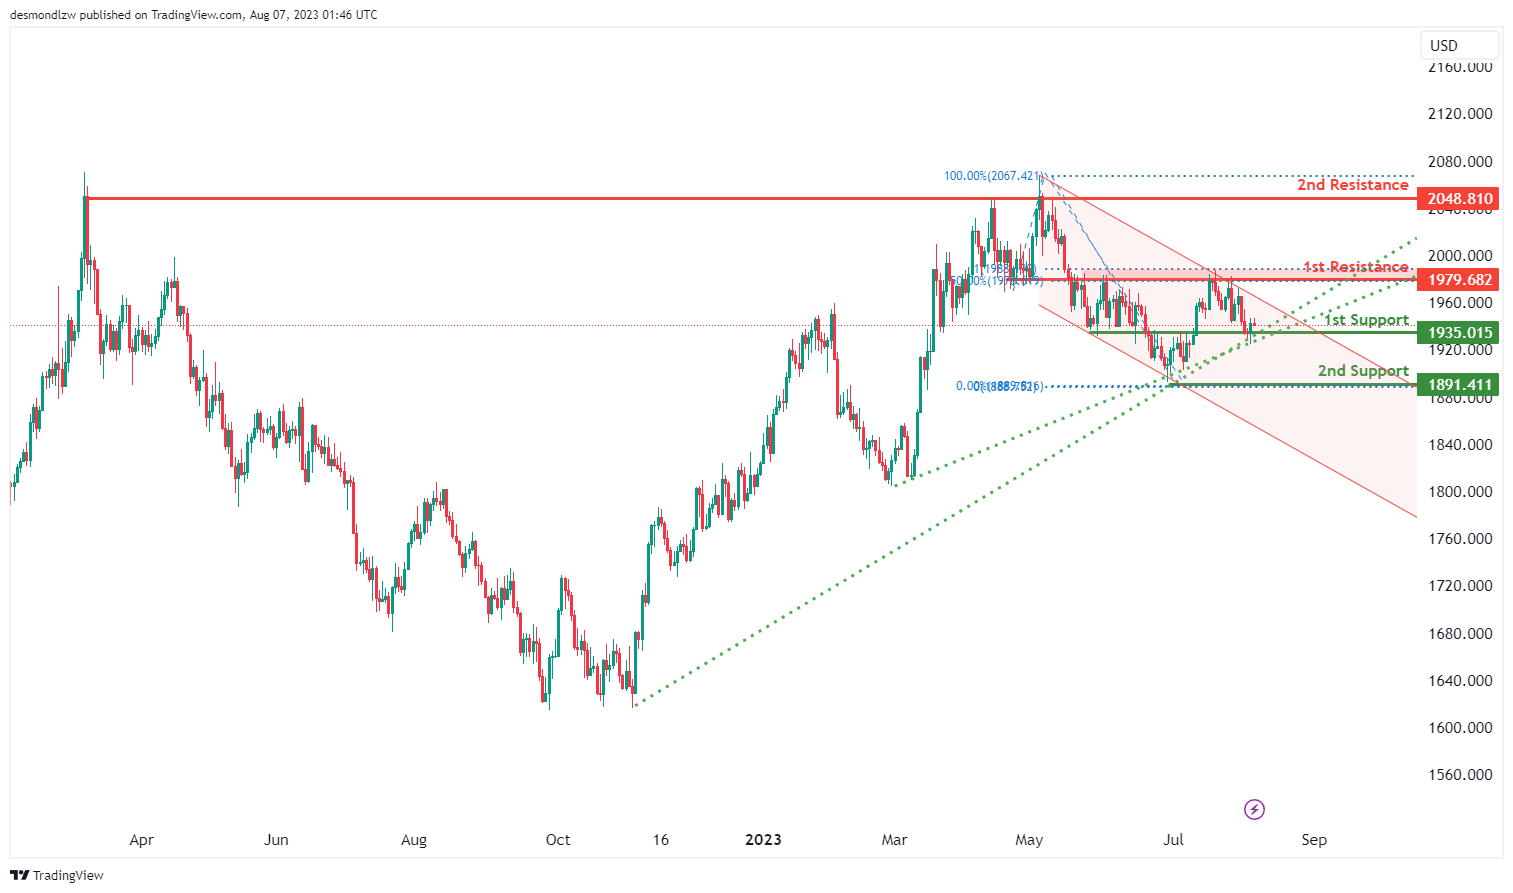
The XAU/USD (Gold/US Dollar) instrument is currently experiencing a bearish overall momentum, represented by a descending bearish channel, which indicates a downtrend in the price movement.
In the immediate term, there is a prediction of a short-term rise before a potential reversal to the first support level at 1935.01. This support level is significant due to its historical importance as a “swing low support.” It has acted as a reliable level where the price found support during previous bearish trends
Additionally, the chart presents a 2nd support level at 1891.41, which also holds historical significance as a “swing low support.” This level reinforces its importance as a potential area where the price may find support and possibly reverse its downward movement.
On the resistance side, two key levels stand out. The first resistance level is at 1979.68 and is characterized by “Overlap resistance” and a “50% Fibonacci retracement.” This level is critical because historical price levels and technical indicators cluster at this point, making it a significant barrier to further price advances. Moreover, the 50% Fibonacci retracement level adds to the importance of this resistance level, often indicating potential trend reversals.
The 2nd resistance level at 2048.81 is identified as a “multi-swing high resistance.” This level has played a notable role in obstructing price movement during various bullish swings.
EUR/USD Faces Uphill Task, Key Support Intact
Key Highlights
- EUR/USD is consolidating above the 1.0920 support.
- A major bearish trend line is forming with resistance near 1.1030 on the 4-hour chart.
- GBP/USD is attempting a fresh increase from the 1.2600 zone.
- USD/JPY is showing positive signs above the 142.00 zone.
EUR/USD Technical Analysis
The Euro started a fresh decline from 1.1150 resistance against the US Dollar. EUR/USD declined below 1.1000 to enter a short-term bearish zone.
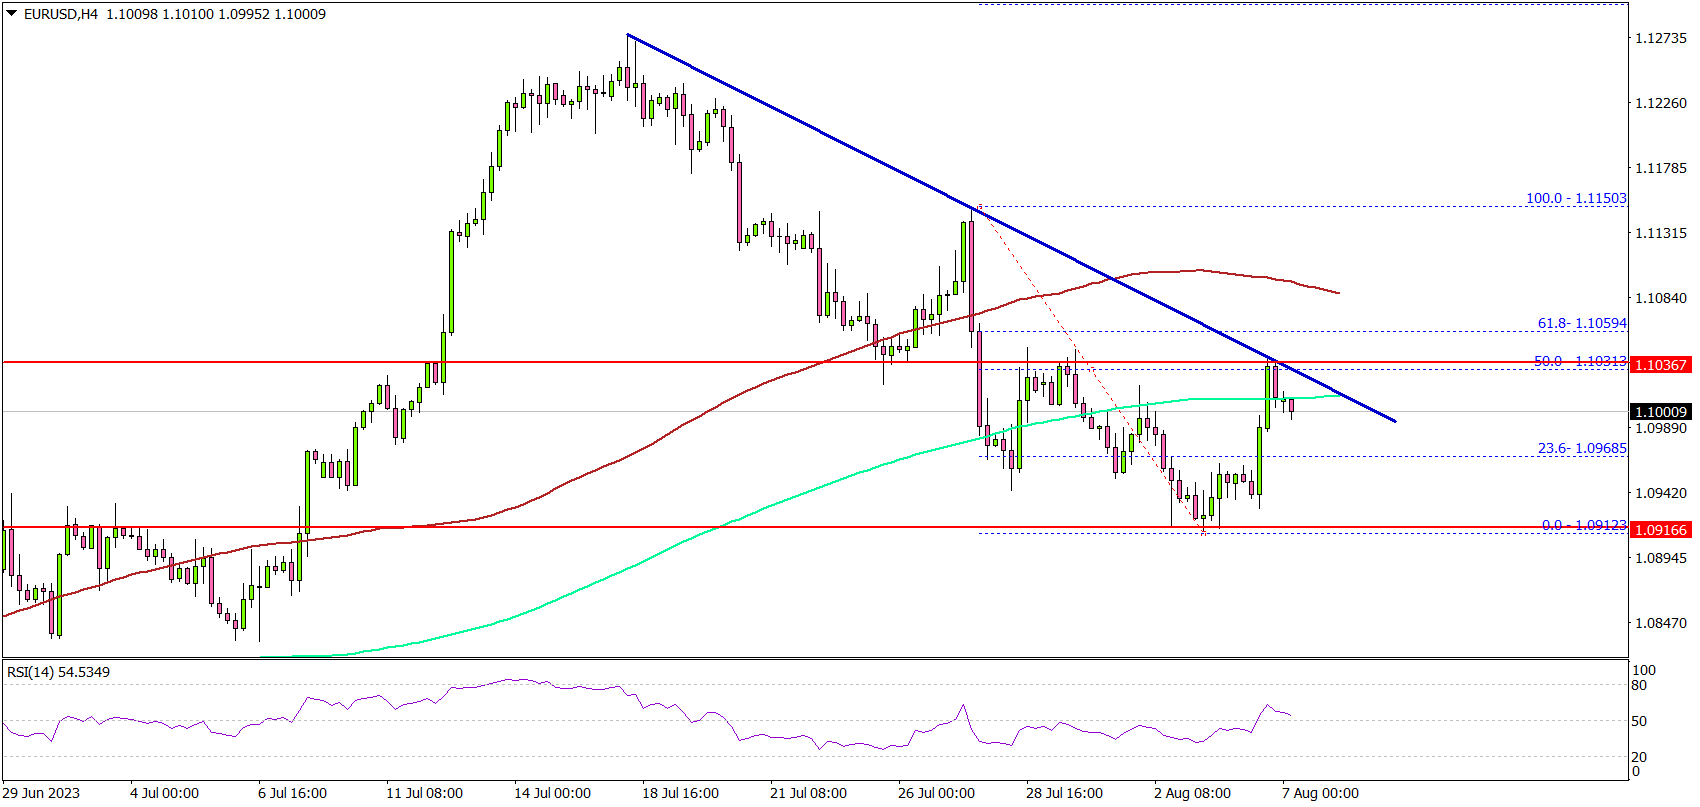
Looking at the 4-hour chart, the pair settled below the 1.1000 level and the 100 simple moving average (red, 4 hours). The pair even traded below 1.0950 and the 200 simple moving average (green, 4 hours).
A low is formed near 1.0912 and the pair is now attempting a fresh increase. There was a move above the 1.0965 resistance. The pair jumped above the 23.6% Fib retracement level of the downward move from the 1.1150 swing high to the 1.0912 low.
On the upside, the pair is facing resistance near the 1.1020 level. There is also a major bearish trend line forming with resistance near 1.1030 on the same chart.
A close above the 1.1030 resistance could push the pair toward 1.1080. Any more gains could start a fresh increase toward the 1.1150 level.
Initial support is near the 1.0965 level. The next major support is near 1.0920, below which EUR/USD could gain bearish momentum. In the stated case, the pair could test the 1.0840 support.
Looking at GBP/USD, the pair extended its decline below the 1.2650 level and is currently attempting a recovery wave.
Economic Releases
- Euro Zone Sentix Investor Confidence for August 2023 - Forecast -23.4, versus -22.5 previous.