Sample Category Title
Australia NAB business confidence rose to 2, inflationary pressures on the rise
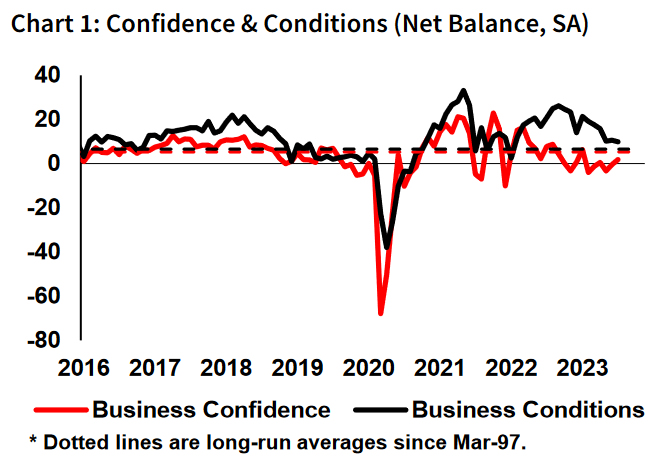
Australia's NAB Business Confidence Index for July revealed an upward tick, moving from -1 in June to 2. However, Business Conditions saw a slight dip from 11 to 10. Delving into specific metrics, readings for trading conditions, profitability, and employment remained unchanged with the previous month, all settling at 16, 10, and 6 respectively.
Notably, the month saw a pronounced rise in price and cost growth. Labour cost growth surged to 3.7% in quarterly equivalent terms, up from June's 2.3%, and purchase cost growth escalated to 2.6%, a jump from the previous month's 2.2%. Furthermore, final price growth climbed to 2%, doubling June's 1%.
Commenting on the findings, NAB Chief Economist, Alan Oster, remarked, "Business conditions in July remained resilient and have largely held steady at above-average levels over the past few months."
He added, "While business confidence rebounded to positive territory, overall confidence remains muted."
Oster further noted the inflationary pressures highlighted by the survey, noting, "Despite the Q2 CPI release indicating an improvement, the survey underscores that the upward pressure on inflation remains significant."
Australia’s Consumer Sentiment down -0.4%, no lift from RBA pause
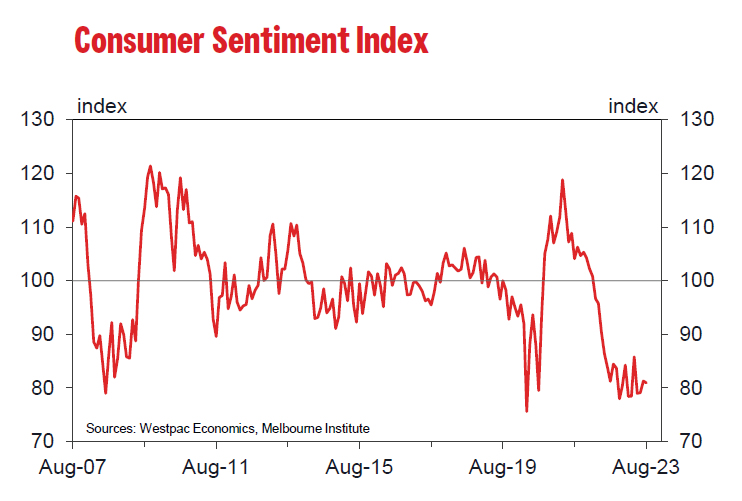
Australia's Westpac Consumer Sentiment Index for August indicated a slight decline, registering at 81, a drop of -0.4% mom from July's reading of 81.3. Westpac's analysis suggests that this decrease cements the prevailing pessimistic mood among consumers. Interestingly, RBA's decision to pause rate hikes did not notably influence this sentiment. The prevailing concerns about inflation continue to overshadow, although confidence in the job market did see a marginal improvement.
Regarding RBA's upcoming meeting on September 5, Westpac anticipates the central bank will maintain its current stance, leaving rates untouched at 4.1%. This cash rate is expected to be the zenith of this financial cycle. It is now up to incoming data and unfolding economic scenarios to present a compelling argument for further monetary tightening.
Westpac emphasized that for RBA to be prompted into action, any economic developments would need to be not just surprising, but also substantial, essentially posing a challenge to the bank's medium-term outlook.
Japan’s wages growth and household spending miss expectations, supports ultra-loose BoJ
Today's wage growth data out of Japan came in softer than anticipated, reinforcing BoJ's position towards maintaining its ultra-loose monetary strategy. Furthermore, the consistent decline in real wages continues to weigh down consumer spending.
Nominal cash earnings for workers in June grew by only 2.3% yoy, missing the projected 3.0% yoy rise. This marks a deceleration from previous month's impressive 2.9% yoy – the most robust growth observed in nearly 30 years. Delving deeper, June's base salary advance was logged at 1.4% yoy, , also under May's 1.7% yoy .
Economists have previously estimated that wage increases of 3% or more are crucial to sustain consumer inflation above BoJ's 2% target.
Compounding concerns, real cash earnings continued their downward trajectory, recording a decline of -1.6% yoy, faring worse than the anticipated stasis at -0.9% yoy. This represents the 15th consecutive month of negative readings in this domain.
Furthermore, overall household spending for June saw a contraction of -4.2% yoy, veering further off the expected -3.5% yoy decline. This marks the fourth consecutive month of shrinking household spending.
These lackluster wage figures pose a challenge for the BoJ. As Governor Kazuo Ueda remarked, the trajectory of income trends is pivotal in determining the realistic prospects of accomplishing lasting inflation. Today's data lends credence to the BoJ's recent evaluation that consistently achieving price increments beyond 2% remains a distant goal. Consequently, the need to uphold its ultra-accommodative monetary parameters becomes ever more evident.
GBP/USD Could Restart Increase Above This Resistance
Key Highlights
- GBP/USD is attempting a fresh increase above the 1.2700 zone.
- A major bearish trend line is forming with resistance near 1.2820 on the 4-hour chart.
- EUR/USD is facing an uphill task near the 1.1000 zone.
- Gold prices are correcting lower below $1,940.
GBP/USD Technical Analysis
The British Pound declined below the 1.2800 pivot level against the US Dollar. GBP/USD even tested the 1.2620 zone where the bulls emerged.
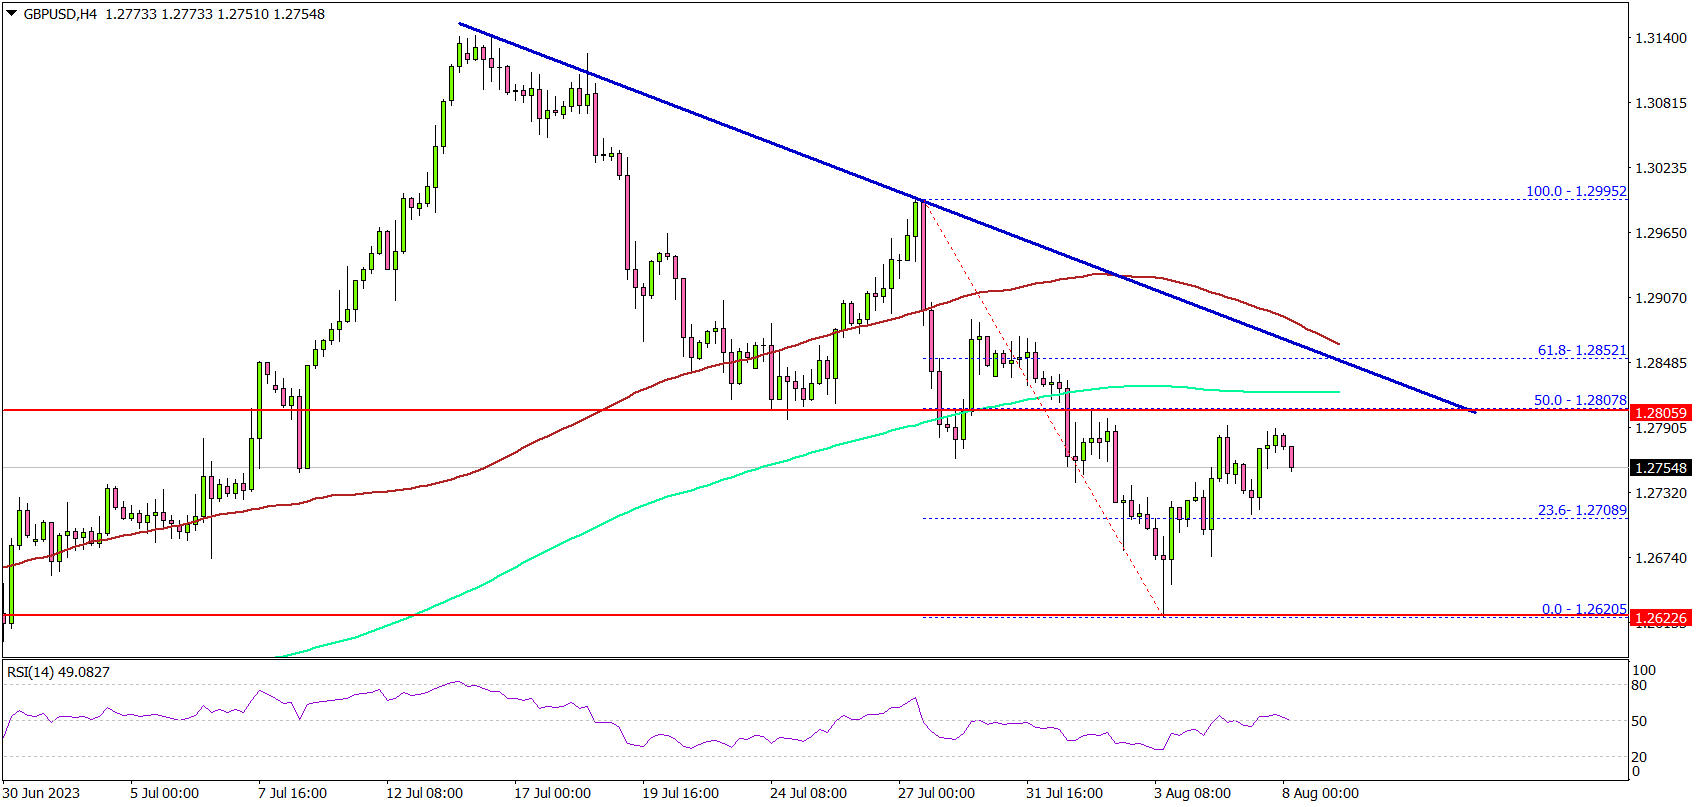
Looking at the 4-hour chart, the pair settled below the 1.2750 level and the 100 simple moving average (red, 4 hours), and the 200 simple moving average (green, 4 hours).
The pair is now attempting a fresh increase above the 1.2700 zone. There was a move above the 23.6% Fib retracement level of the downward move from the 1.2995 swing high to the 1.2620 low.
On the upside, the pair is facing resistance near the 1.2800 level. There is also a major bearish trend line forming with resistance near 1.2820 on the same chart. The trend line is near the 50% Fib retracement level of the downward move from the 1.2995 swing high to the 1.2620 low.
A close above the 1.2820 resistance could push the pair toward 1.2950. Any more gains could start a fresh increase toward the 1.3000 level.
Initial support is near the 1.2700 level. The next major support is near 1.2620, below which GBP/USD could gain bearish momentum. In the stated case, the pair could test the 1.2500 support.
Looking at EUR/USD, the pair is struggling to clear the 1.1000 resistance and might start another decline toward the 1.0850 level.
Economic Releases
- US Goods Trade Balance for June 2023 - Forecast $-85.5B, versus $-87.8B previous.
Nikkei ($NKD_F) Should Find Extreme In Wave 4 Pullback Soon
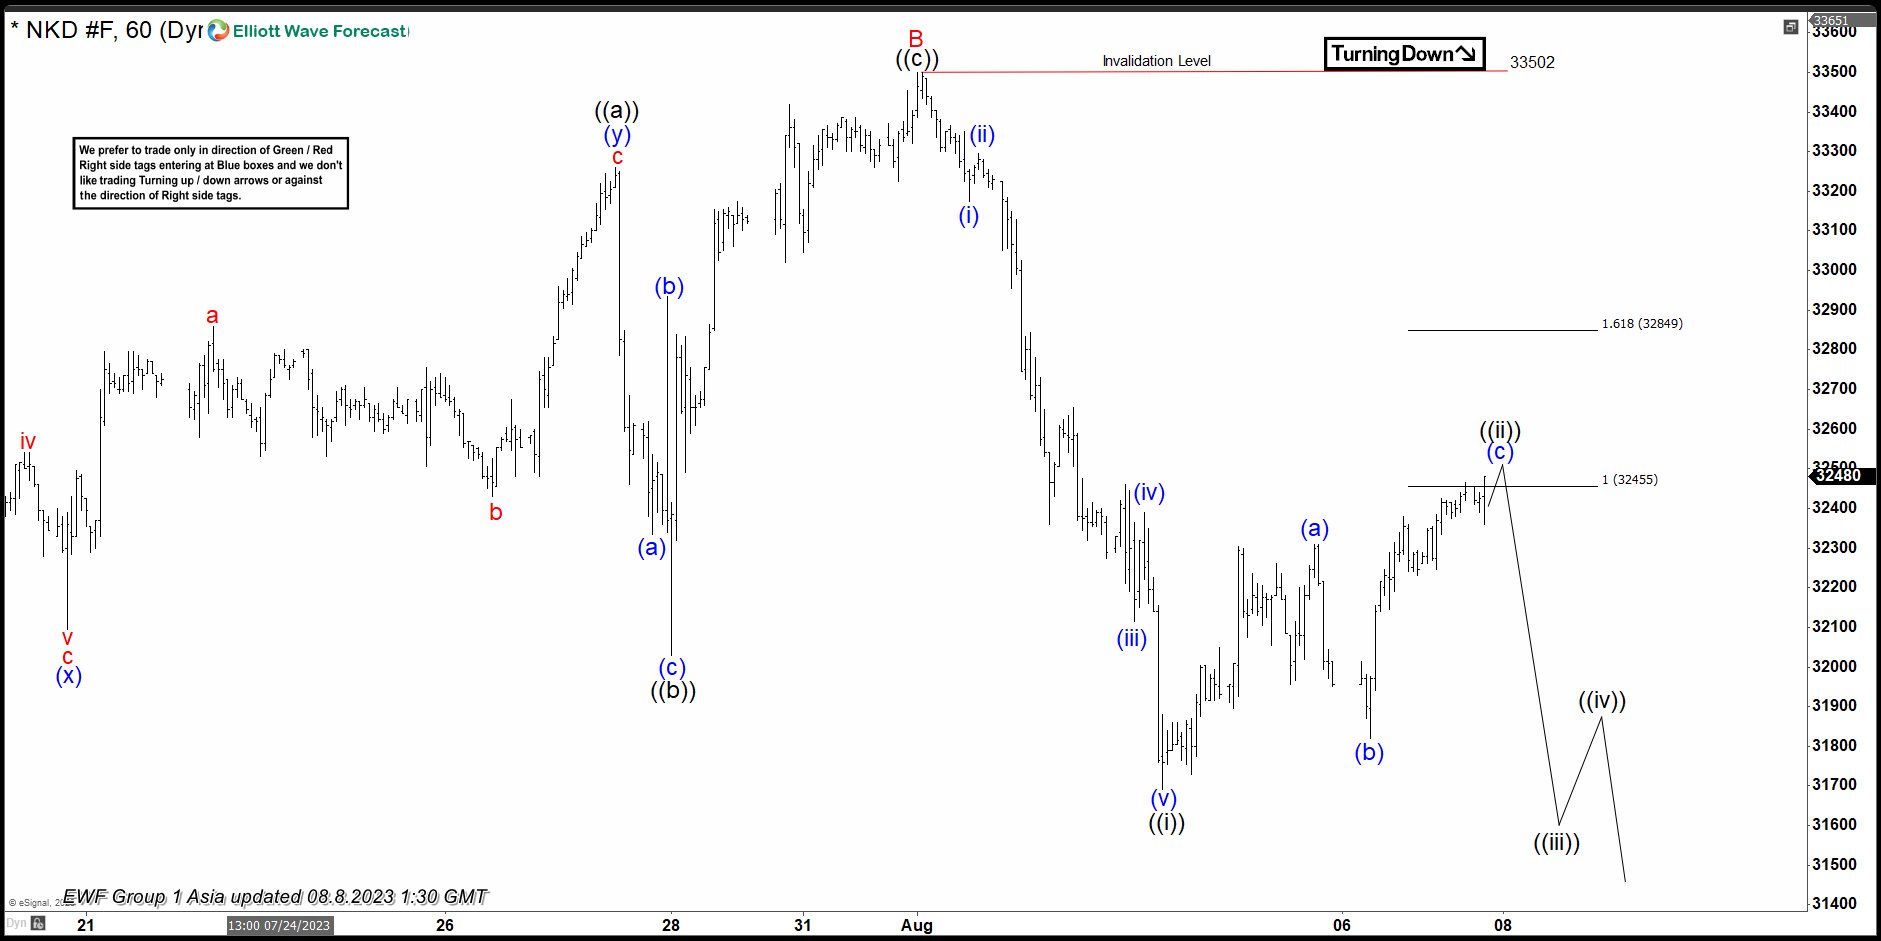
The Short term view in Nikkei futures ticket symbol: $NKD_F suggests that the index is doing a bigger pullback in wave (4) to correct the cycle from the 03 January 2023 low. The index is expected to find the extreme in the pullback soon. Before it can start the next leg higher or it does a 3-wave reaction higher at least. So far the pullback from the peak is unfolding as Elliott wave zigzag correction where wave A ended at 31800 low. Up from there, wave B bounce unfolded in a lesser degree flat correction with wave ((a)) completed at 33260 high. Wave ((b)) ended at 32030 low and then wave ((c)) ended in a lesser degree 5 waves at 33502 high thus completing wave B.
Down from there, the index made a new low below the previous wave A low. And confirmed the next extension in the C leg lower. Whereas the wave ((i)) ended at 31690 low in a lesser degree 5 waves impulse sequence. Above from there, the index is doing a bounce in wave ((ii)) in a lesser degree zigzag structure. Where small wave (a) ended at 32310. Wave (b) ended at 31820 and wave (c) should end between 32455- 32849 100%-161.8% Fibonacci extension area of (a)-(b). From there, the index is expected to resume the decline for a push towards 31274- 30748 bigger extreme area before it could resume higher again or ends up doing a 3-wave bounce minimum. Near-term, as far as bounces fail below 33502 high expect index to extend in C leg lower.
Nikkei 1 Hour Elliott Wave Chart From 8.08.2023
Nikkei Elliott Wave Video
https://www.youtube.com/watch?v=A1BfokaWP-c
AUDJPY Wave Analysis
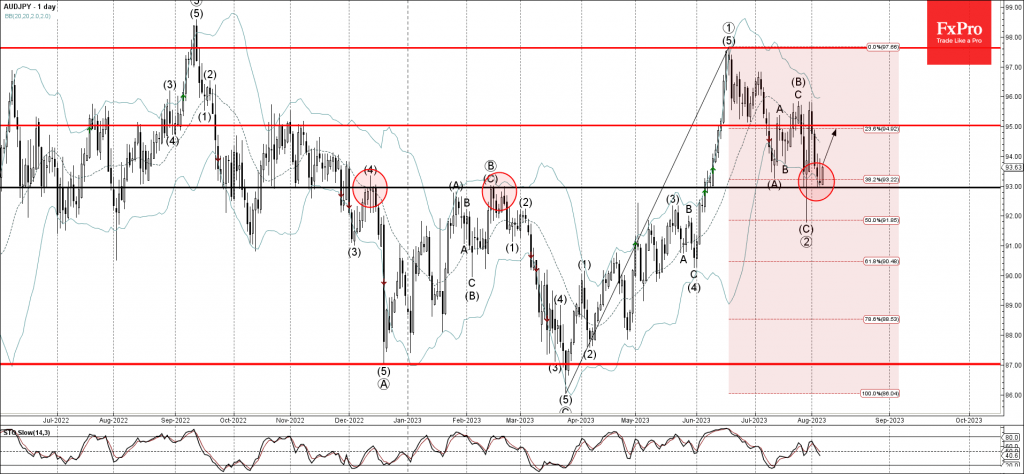
- AUDJPY reversed from pivotal support level 93.00
- Likely to test resistance level 95.00
AUDJPY currency pair recently reversed up from the pivotal support level 93.00, former strong resistance from December and February, which also reversed the pair sharply in July.
The upward reversal from the support level 93.00 is likely to form the daily Japanese candlesticks reversal pattern Morning Star.
Given the strongly bearish yen sentiment, AUDJPY can be expected to rise further toward the next resistance level 95.00.
GBPCAD Wave Analysis
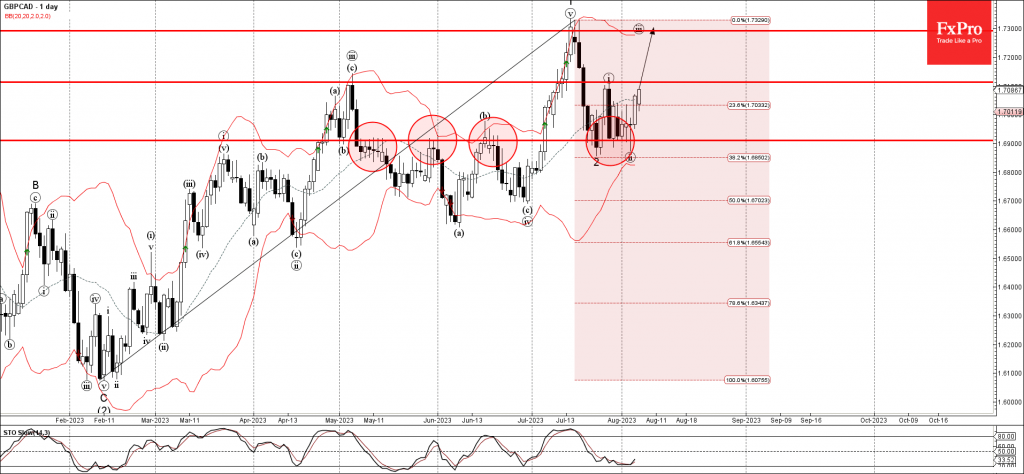
- GBPCAD reversed from key support level 1.6900
- Likely to test resistance levels – 1.7110 and 1.7290
GBPCAD recently reversed up from the key support level 1.6900, former strong resistance from May and June.
The support level 1.6900 was strengthened by the lower daily Bollinger Band and by the 38.2% Fibonacci correction of the upward impulse from February.
Given the clear daily uptrend, GBPCAD can be expected to rise further toward the next resistance levels – 1.7110 and 1.7290 (target for the completion of the active wave iii).
Euro Attempts a Reversal to the Upside
The Euro has halted its three-week decline, finding local support at 1.0900.
Despite the European Central Bank's (ECB) latest interest rate hike to 4.25% on 27 July, the Euro is weakening against the US Dollar. Over the past three weeks, the EURUSD pair has retreated from its highs near 1.1300 to around 1.0900.
On Friday, US employment market data was released, slightly falling short of expert predictions: the Nonfarm Payrolls (NFP) indicator registered a figure of 187 thousand compared to the market's projected 200 thousand. Consequently, the Dollar weakened against the Euro, causing the EURUSD pair to recover from its lows around 1.0900 to surpass 1.1000.
The key driver for heightened market volatility this week will be the forthcoming US Consumer Price Index (CPI) data, due for release on Thursday. Should the data surpass forecasts, the Euro's decline may continue; conversely, weaker data could give the Euro reason to rise.
Technical analysis for the EUR/USD currency pair
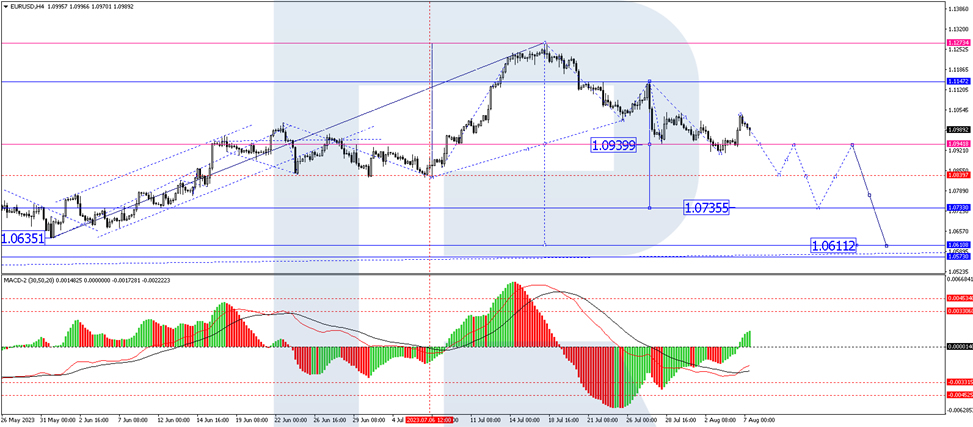
On the H4 chart, EUR/USD completed a corrective wave to the 1.1040 level and started to develop another wave of decline. The 1.0941 level could be reached. A downward breakout of this level will open the potential for a wave of decline to 1.0840. Once the price hits this level, a link of growth to 1.0940 (a test from below) is expected, followed by a decline to 1.0735. This is a local target. Technically, the MACD indicator confirms this scenario with its signal line below the zero mark. The price is expected to return to it and continue falling to new lows.
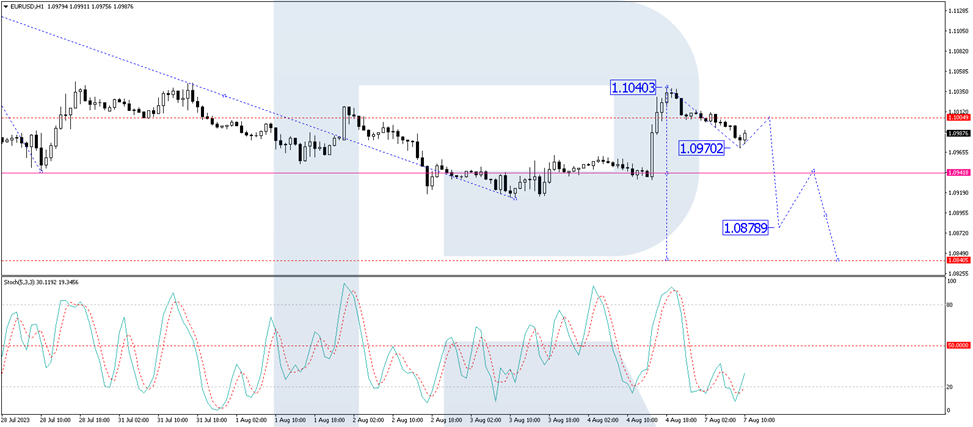
On the H1 chart, EUR/USD has completed an impulse of decline to the 1.1005 level. A consolidation range has formed around it today, and with a downward breakout, the price has declined to 1.0970. A link of correction to 1.1005 (a test from below) could form, followed by another wave of decline to 1.0940. A downward breakout of this level will open the potential for a wave of decline to 1.0878. Technically, the Stochastic oscillator also supports this outlook, with its signal line having broken the 20 mark upwards and continuing to rise to 50.
Hawkish Fed Speak Boosts Dollar Across All the Board
- Fed’s Bowman reiterates that more hikes might be need to bring down inflation
- German Industrial Production fell to a 6-month low
- US inflation data expected to support a September pause, but possible coin flip for the November meeting
The US dollar is stronger across the board as the bond market selloff returns, sending the 10-year Treasury yield 6.9 basis points higher to 4.103%. After a mixed jobs report (slower job growth pace but higher wages) this week is all about an inflation report that will probably show moderate price growth. The focus for many traders is all about the end of tightening and this weekend’s Fed speak supported the higher for longer stance. Fed’s Bowman noted that it will likely need to raise interest rates further to bring down inflation. A New York Times article this morning reported that Fed’s Williams stated that the central bank’s work to cool the economy is almost done and that he expects rate cuts could happen next year.
Heading into Thursday’s US inflation report, expectations are for headline CPI to rise from 3.0% to 3.3%, mainly due to base effects, but snapping a long streak of declines that has been in place since last August. Fixed income markets are growing confident that the September FOMC will support a rate pause. The core readings are also expected to hold steady, but any hot surprises could keep the pressure on for a November hike.
At the end of last week, the euro saw some volatility after the Bundesbank said domestic government deposits would not receive any interest, sparking a move into bills and other high-yielding markets. This decision surprised many traders and could lead to significant outflows for German debt. Today’s disappointing German industrial production data also sent the euro lower as recession risks continue to rise. Output continues to drop, falling to a 6-month low.
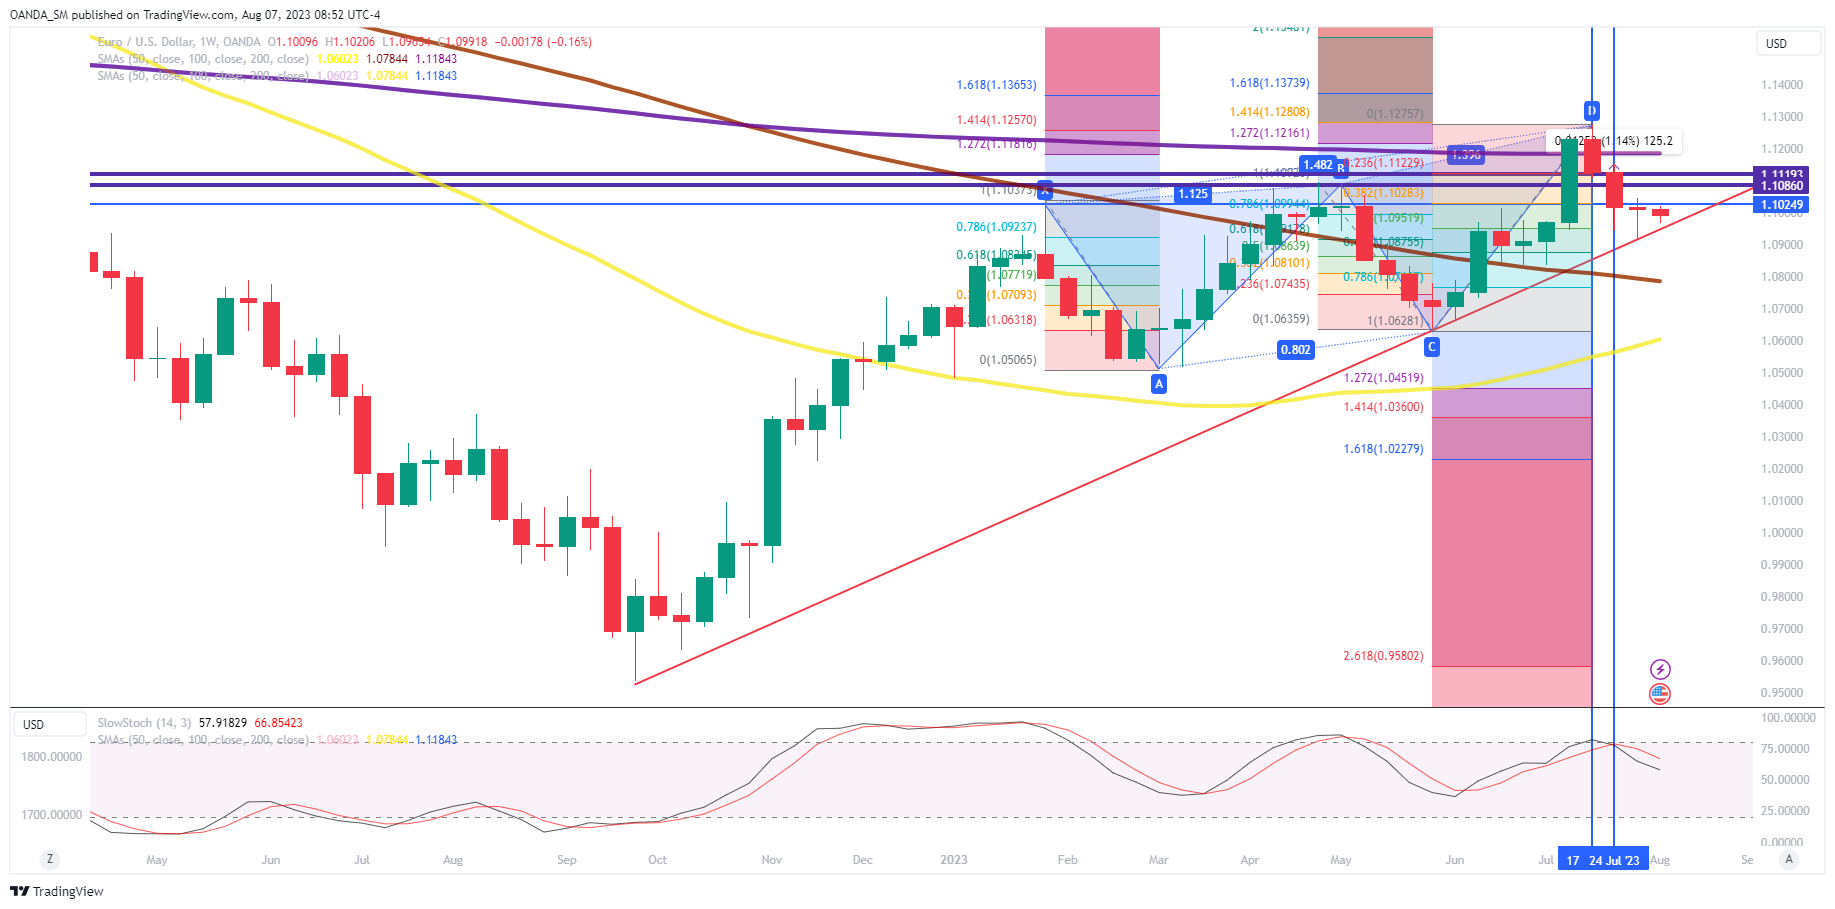
The weekly EURUSD chart shows price is approaching key trendline support at 1.0930. If downward momentum accelerates, downside targets include the 1.0850 region followed by 1.07667 level. To the upside the 1.1050 provides initial resistance followed by the 1.1135 level.
Stocks
US stocks are slightly higher following Friday’s selloff as Wall Street embraces a very solid earnings season, but the harsh reality that the US economy is still recession bound. As we get the last batch of earnings, so far 84% of the companies in the S&P 500 have provided results, around 80% have delivered topped market expectations. Stocks are also surging alongside Treasury yields, which might prove difficult to continue if last week’s Treasury yield high is surpassed.