Sample Category Title
Yen Extends Slide as Consumers Reduce Spending
- USD/JPY is down 1% this week
- Japanese wage growth and personal spending decline
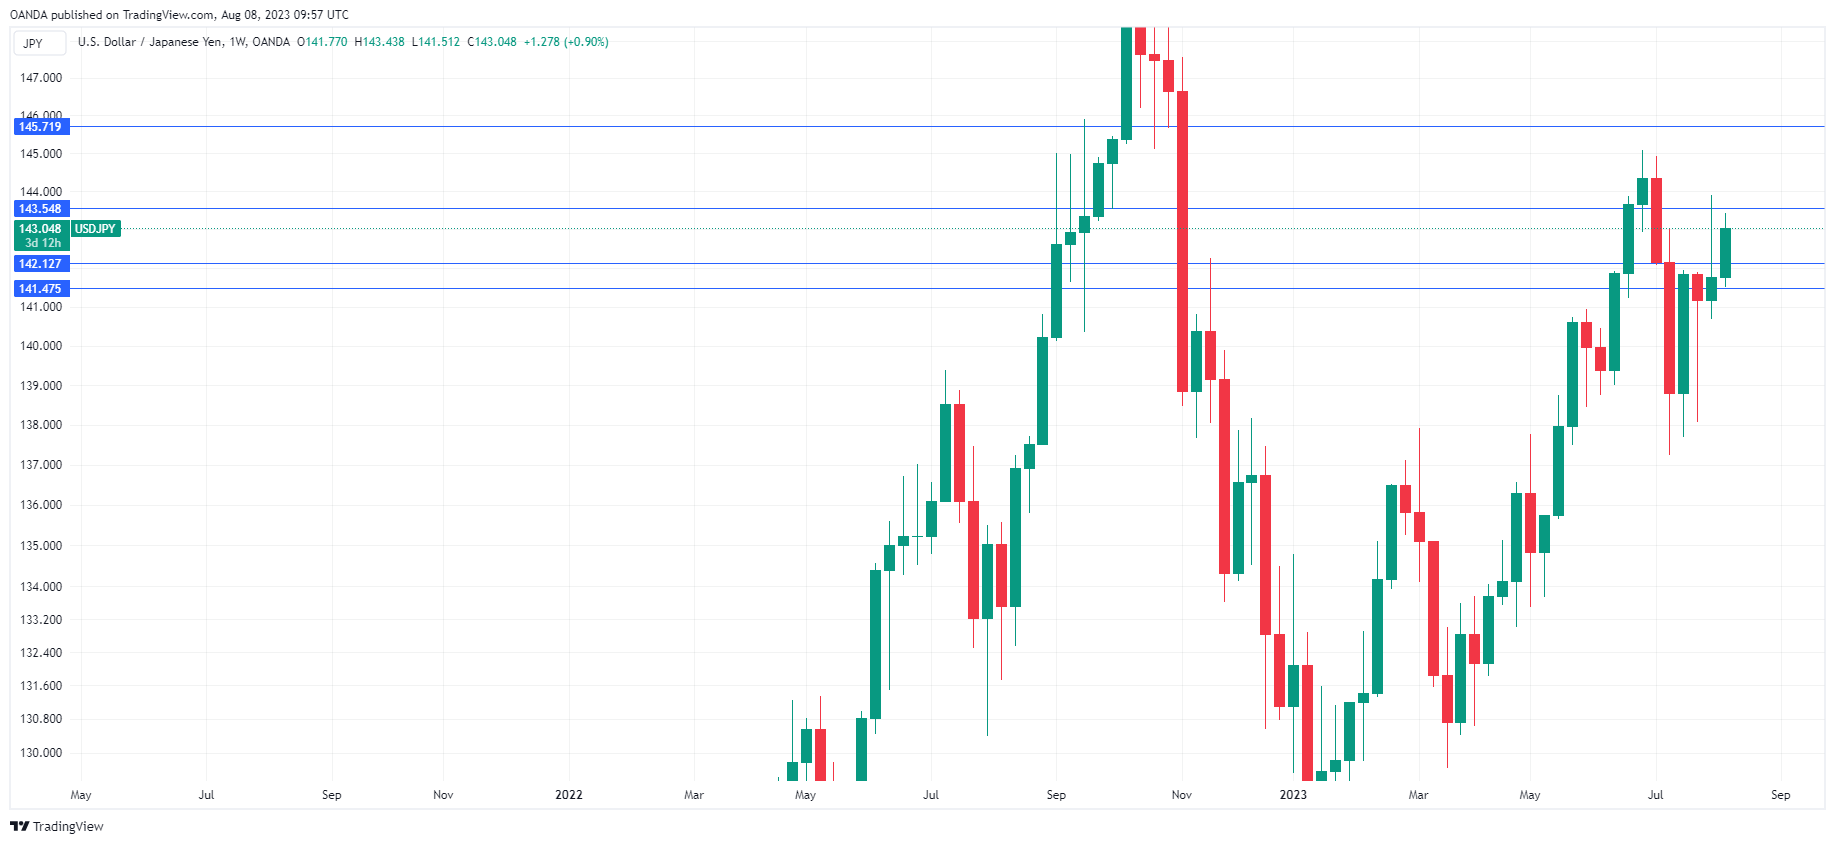
The Japanese yen is trading quietly on Tuesday. In the European session, USD/JPY is trading at 143.10, up 0.42%. The yen is down 1% so far this week.
Investors have been focused on the Bank of Japan, amid speculation that it could tighten policy due to rising inflation. How has the Japanese consumer managed with high inflation? Not all that well, according to spending and wage reports released on Tuesday.
Japanese household spending fell 4.2% y/y in June, following a 4.0% decline in May and worse than the consensus estimate of 4.1%. Household spending has declined in seven of the past eight months, as inflationary pressures have forced consumers to cut back on spending.
Japanese wage growth decelerated, as average cash earnings rose 2.3% y/y in June, down from 2.9% in May but better than the estimate of 1.6%. Wage growth continues to lag behind inflation, which came in at 3.3% in June. Taking inflation into account, real wages have declined for 15 straight months. High inflation remains a serious problem, but the Bank of Japan has insisted that it will not take any steps to normalize monetary policy until wage growth increases.
The BoJ released its Summary of Opinions on Monday. While members reiterated the need to maintain an ultra-accommodative policy, there was a discussion about rising inflation. Is the BoJ slowly coming around to acknowledging that inflation is not temporary? If so, it would mark a sea change in the BoJ’s thinking and perhaps lead to some tightening moves in the not-too-distant future, which would have major ramifications for the Japanese yen.
USD/JPY Technical
- USD/JPY put pressure on resistance at 143.55 earlier before retreating. 145.71 is the next resistance line
- 142.12 and 141.47 are providing support
ECB consumer survey: Easing inflation expectations, but waning spending optimism
In June ECB Consumer Expectations Survey, consumer concerns over inflation appear to be receding, with expectations for both short-term and three-year horizons declining. Despite steady views on income growth over the next year, there's a palpable decrease in optimism around consumer spending. Meanwhile, the outlook for economic growth sees a marginal uptick, albeit remaining muted.
Notably, consumers seem to be less concerned about rampant inflation. Expectations for inflation over the next 12 months have retreated, with mean prediction decreasing from 5.1% to 4.7%. Median inflation outlook for the same period experienced a steeper decline, shifting from 3.9% down to 3.4%. This downward trend also extends to longer-term predictions. Mean inflation expectations for a three-year horizon have decreased from 4.0% to 3.8%, while median expectations for the same period have edged down from 2.5% to 2.3%.
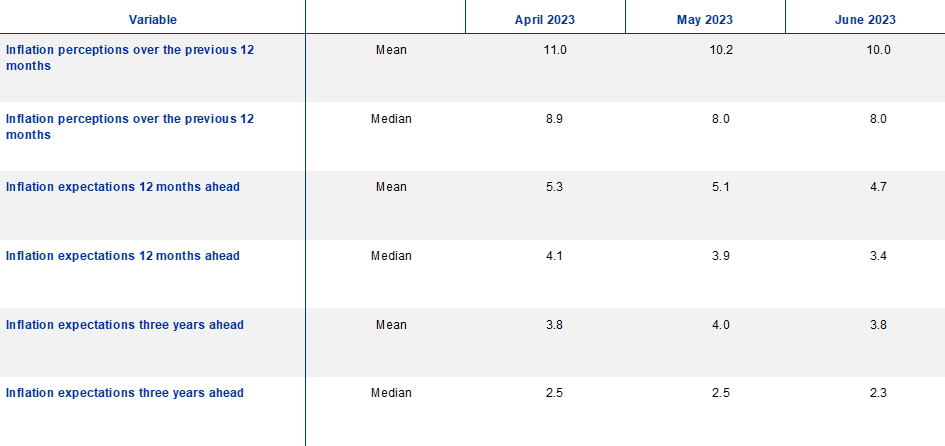
Consumer views on household income for the next 12 months remained steady, with both mean and median expectations unmoved at 1.2% and 0.1% respectively. However, there's growing pessimism concerning consumer spending. Expectations for mean household spending over the next year have slightly decreased from 3.5% to 3.4%, while median forecast has descended more markedly from 2.4% to 2.1%.
In terms of economic performance, consumers are marginally less bearish about near-term growth outlook. Mean expectation for economic growth over the next year has improved slightly from -0.7% to -0.6%, even though median remains unchanged at flat 0.0%. Interestingly, there were no alterations in consumer outlook for unemployment over the next year, with predictions holding steady.
GBPUSD Stays Resilient Above Crucial Support
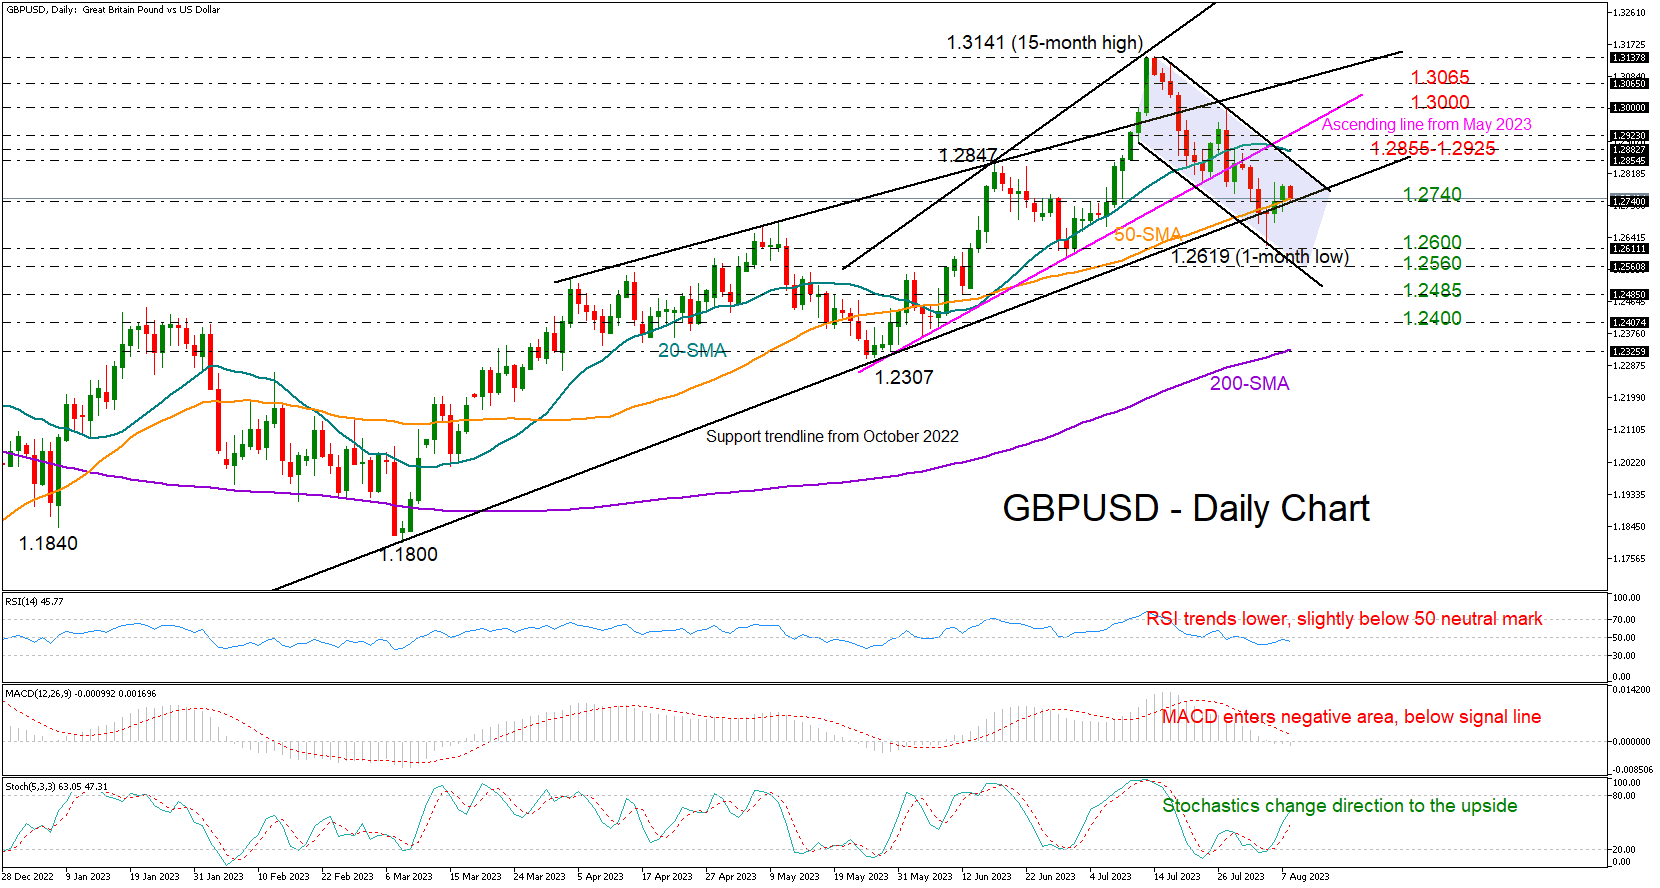
GBPUSD closed higher than its 50-day SMA and the resistance trendline from October 2022 on Monday, indicating a higher chance for more positive sessions.
Moreover, the doji candlestick printed at the bottom of the bearish channel on August 3 was followed by two green candlesticks, promoting an extension towards the channel’s upper boundary at 1.2855. The 20-day SMA and the broken ascending trendline from May are within a breathing distance too, at 1.2880 and 1.2925 respectively, while in the weekly chart, the constraining 200-period SMA is placed in the same region. Hence, traders might wait for a close above 1.2925 before they send the price towards the 1.3000 psychological mark or even higher to the resistance line from April at 1.3065.
The RSI and MACD are conflicting with the bullish scenario because they're both trending downward and in the bearish area. On the other hand, the Stochastic oscillator has bottomed out in the oversold region and is on the rise again. Interestingly, the signals are similar to those back in May, when the pair eventually staged a notable rally to 1.2847. Hence, some patience might be required in the coming sessions.
In the event selling pressure resurfaces below the key support trendline at 1.2740, the price could seek shelter somewhere between the 1.2600 base and the channel’s lower band at 1.2560. Running lower, the decline could next take a breather around 1.2485 and then near 1.2400 before touching the 200-day SMA at 1.2325.
Summing up, GBPUSD is showing mixed signals in the short-term picture. A pullback below 1.2740 could dampen market sentiment. Otherwise, the pair may attempt to exit the bearish channel on the upside.
EURJPY Just Below 16-Year High But Lacks Momentum
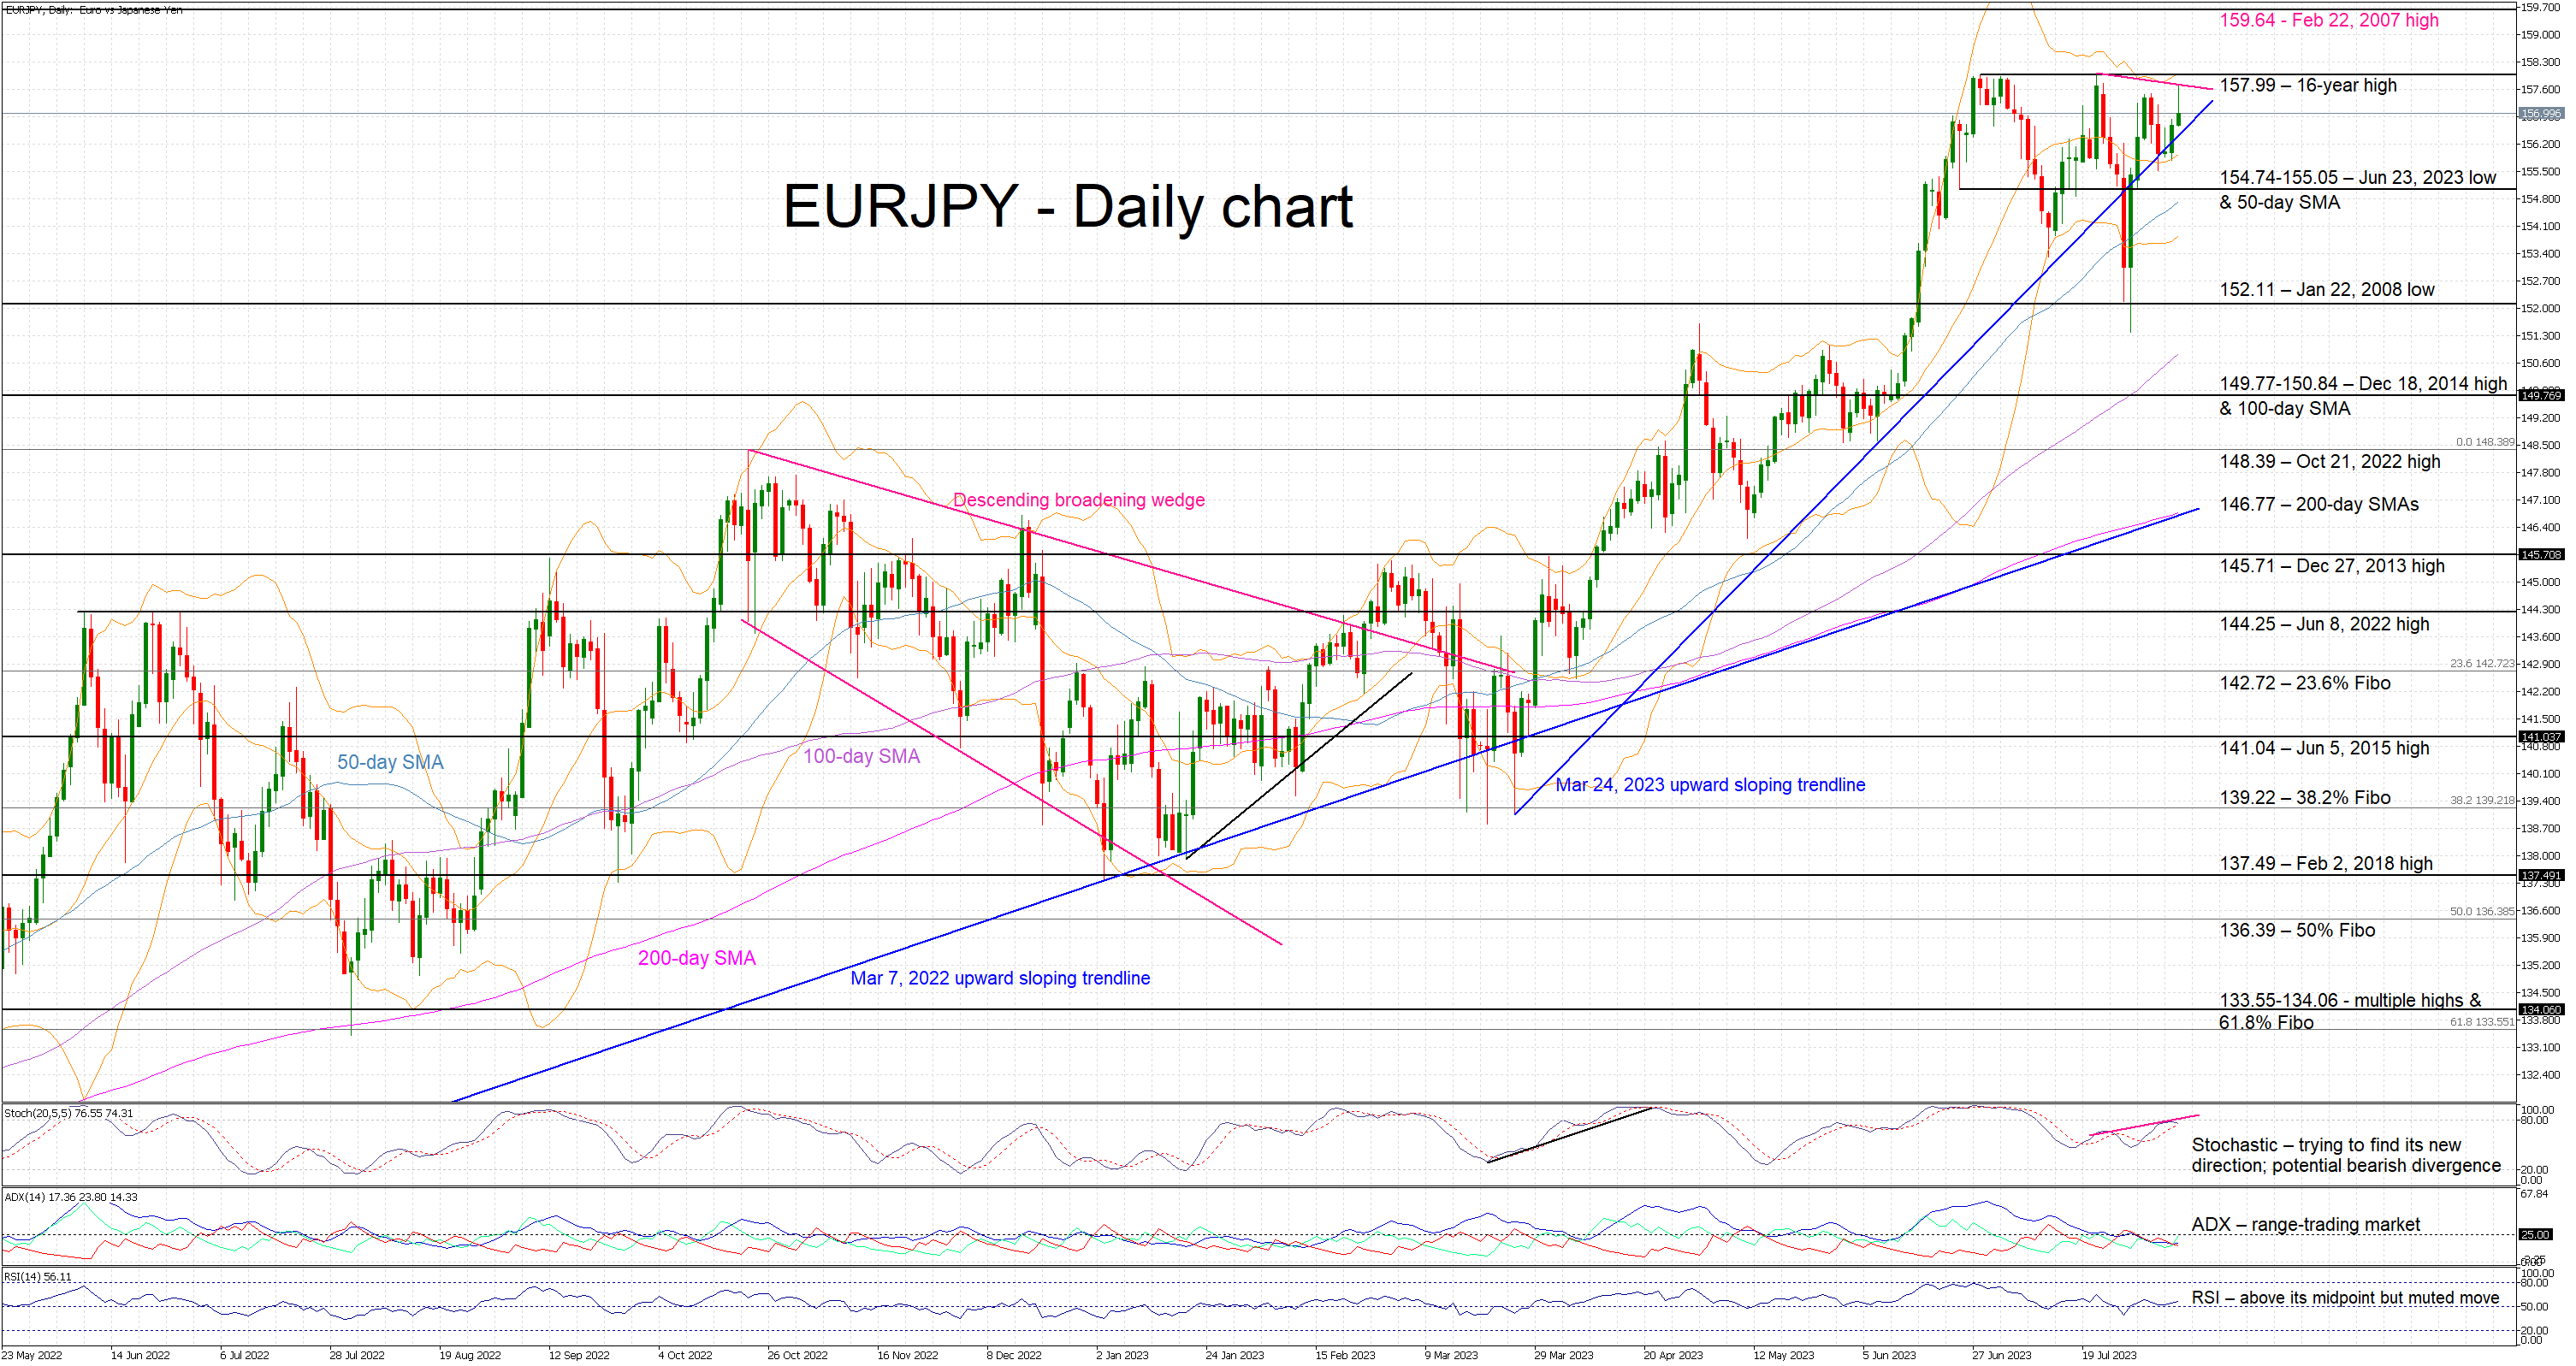
EURJPY is edging higher as it appears ready to retest the 16-year high of 157.99. The move prior to the July 28 BoJ meeting has been almost completely erased with the bulls confirming their dominance in this market. However, they have yet to make a new higher high, thus giving some hope to the bears that the recent series of lower lows and lower highs could still play a role.
Turning to the momentum indicators, the overall picture does not look overly supportive of the bulls’ intention. In more detail, the Average Directional Movement Index (ADX) continues to hover well above its 25-threshold, signaling a trendless market, and the RSI has just edged above its midpoint. More importantly, the stochastic oscillator is trading sideways, a tad below its overbought territory as it seems to lack the strength for another rally. Crucially, there is a growing risk of a bearish divergence forming if EURJPY fails to make a new higher high soon.
Should the bulls ignore the muted signs, they would aim for a break of the 16-year high at 157.99. Such a move though is bound to energize the EURJPY bears and reignite the intervention talk from the Japanese authorities. The bulls could then set their eyes on an even bigger prize, the February 22, 2007 high at 159.64.
On the other hand, the bears are desperately trying to recoup part of their recent losses. They appear keen on a move below the March 24, 2024 upward sloping trendline and towards the busy 154.74-155.05 area, which is populated by the June 23, 2023 low and the 50-day simple moving average (SMA). If successful, they could then have a look at the July 28 low, which is a tad below the January 22, 2008 low of 152.11.
To sum up, EURJPY bulls feel confident following the recent upleg but a potential failure in making a higher high would gradually open the door to a sizeable correction, assisted by a developing bearish divergence.
EUR/AUD Daily Outlook
Daily Pivots: (S1) 1.6693; (P) 1.6731; (R1) 1.6776; More...
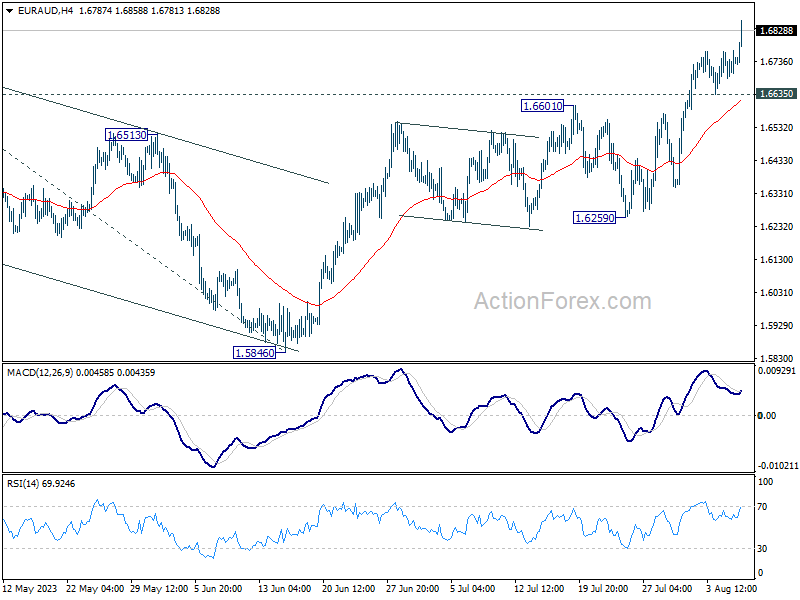
EUR/AUD's up trend from 1.4281 resumed by breaking through 1.6785 resistance and intraday bias is back on the upside. Further rally should be seen to 1.7377 projection level next. Meanwhile, near term outlook will now remain bullish as long as 1.6635 support holds, in case of retreat.
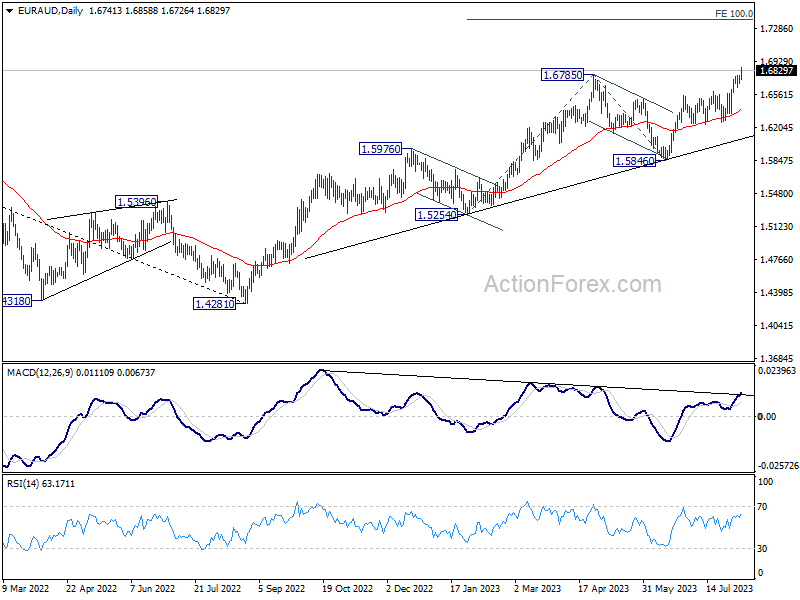
In the bigger picture, the rise from 1.4281 (2022 low) is in progress. Next target is 100% projection of 1.5254 to 1.6785 from 1.5846 at 1.7377. For now, outlook will stay bullish as long as 1.5846 support holds, even in case of another pull back.
EUR/JPY Daily Outlook
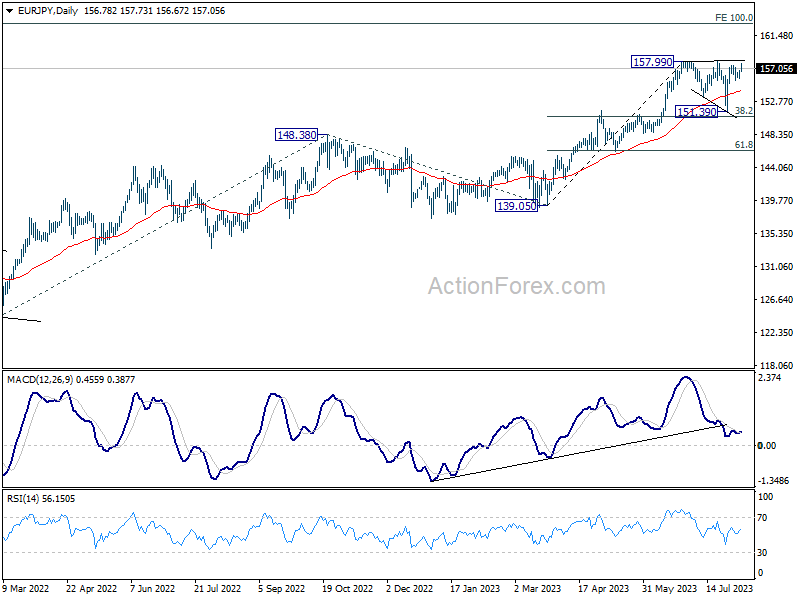
Daily Pivots: (S1) 156.10; (P) 156.48; (R1) 157.14; More....
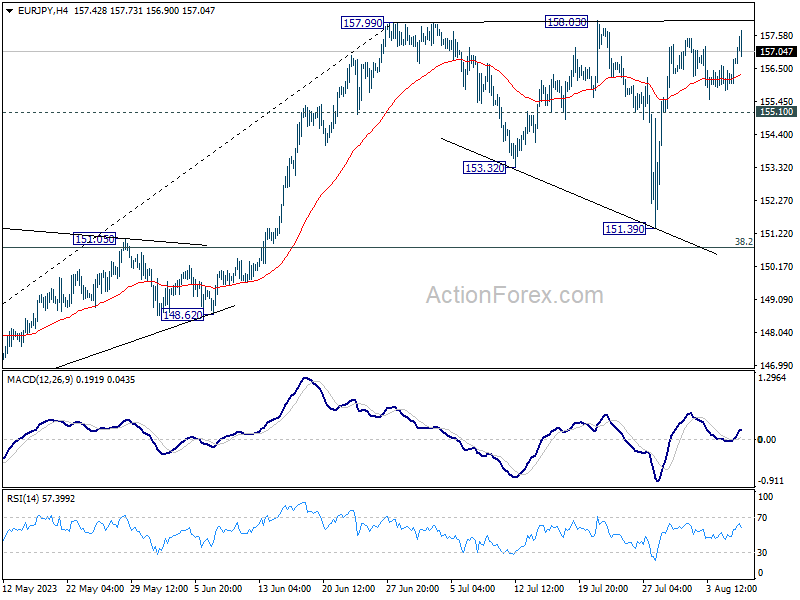
Intraday bias in EUR/JPY stays neutral first, as it's limited below 158.03 resistance despite today's rally. On the upside, decisive break of 157.99/158.03 will resume larger up trend to 162.82 projection level next. However, break of 155.10 will extend the corrective pattern from 157.99 with another falling leg instead.
In the bigger picture, as long as 151.60 resistance turned support holds, rise from 114.42 (2020 low) is in progress. On resumption, next target is 100% projection of 124.37 to 148.38 from 138.81 at 162.82. Nevertheless, sustained break of 151.60 will argue that larger correction is already underway. Deeper decline would be seen to 55 W EMA (now at 145.94).
GBP/JPY Daily Outlook
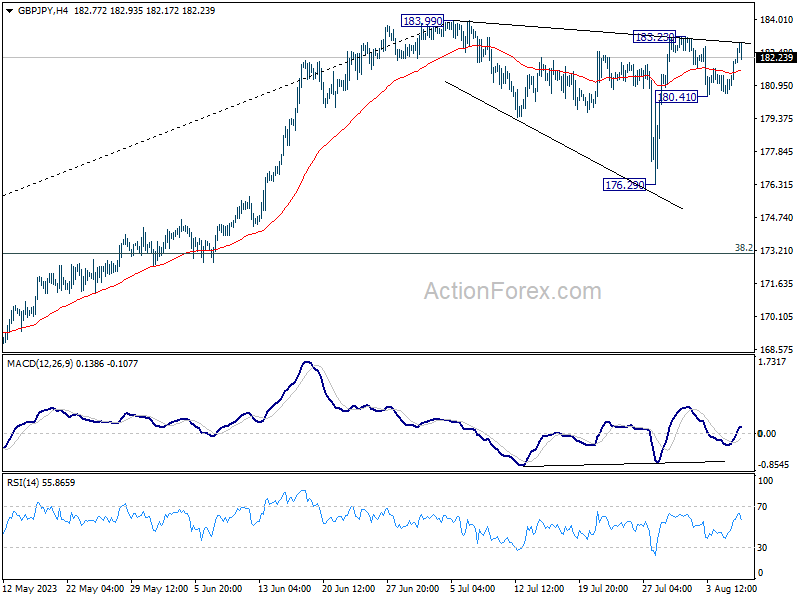
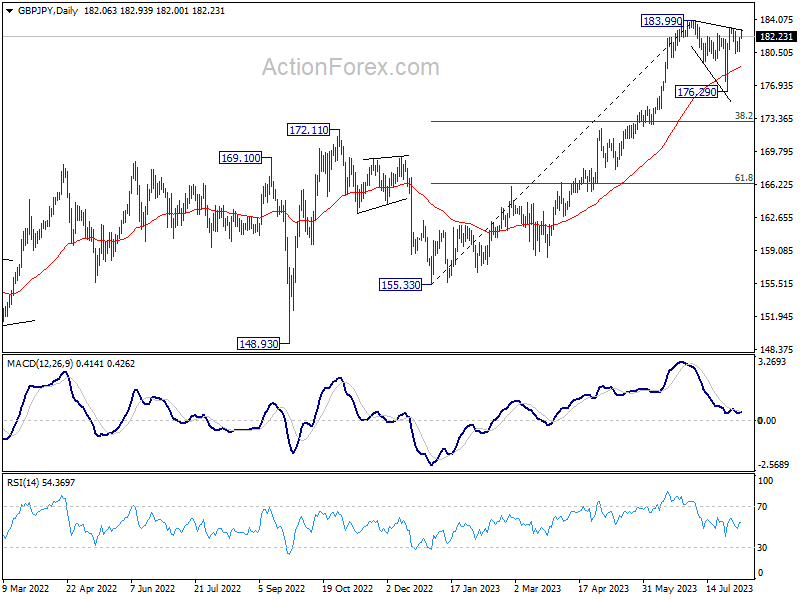
Daily Pivots: (S1) 181.10; (P) 181.64; (R1) 182.70; More...
Intraday bias in GBP/JPY is turned neutral with current recovery. On the upside, decisive break of 183.99 high will resume larger up trend. Nevertheless, break of 180.41 will turn bias to the downside, to bring another fall to extend the corrective pattern from 183.99.
In the bigger picture, as long as 172.11 resistance turned support holds, up trend from 123.94 (2020 low) is expected to continue through 183.99 at a later stage, towards 195.86 (2015 high). Nevertheless, firm break of 172.11 will argue that larger correction is already underway.
EUR/GBP Daily Outlook
Daily Pivots: (S1) 0.8595; (P) 0.8618; (R1) 0.8629; More...
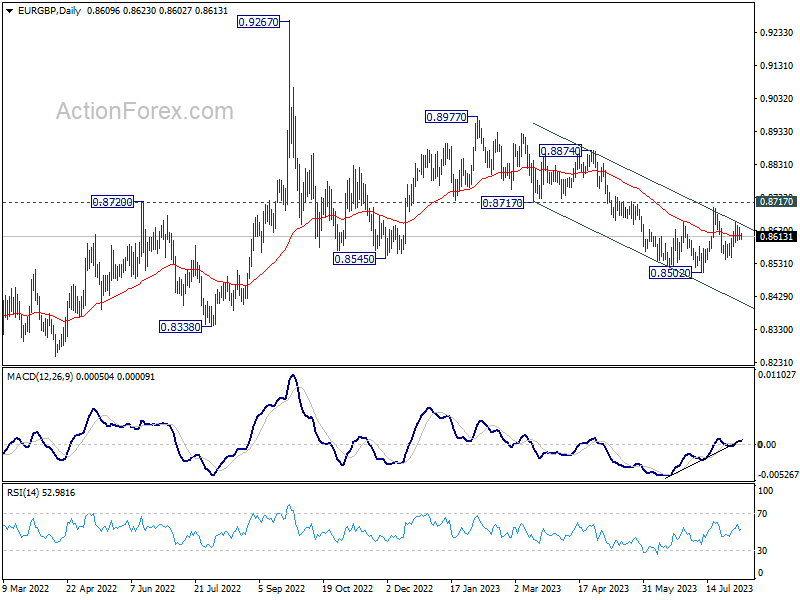
Range trading continues in EUR/GBP and intraday bias stays neutral at this point. On the downside, below 0.8543 will target a test on 0.8502 low. Decisive break there will resume larger decline from 0.8977. On the upside firm break of 0.8717 resistance will suggest larger reversal and target 0.8874 resistance next.
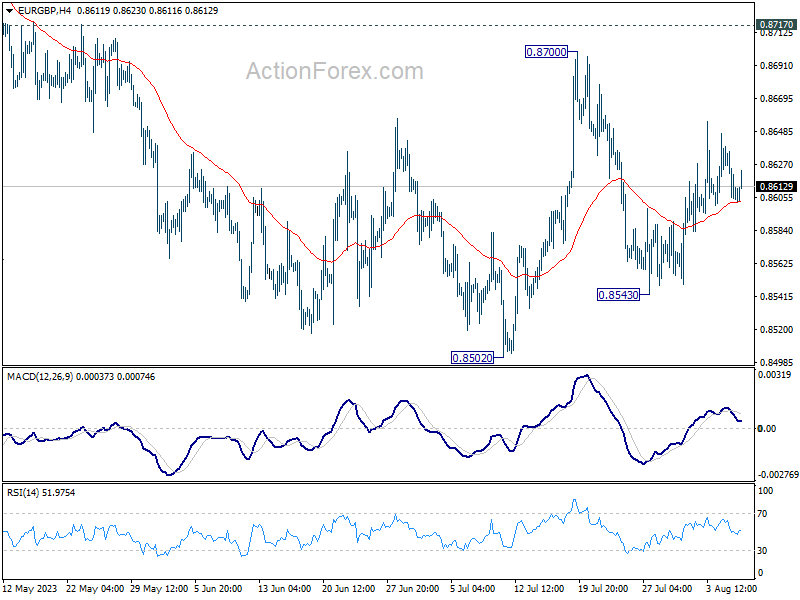
In the bigger picture, the down trend from 0.9267 (2022 high) is seen as part of the long term range pattern from 0.9499 (2020 high). Firm break of 0.8717 support turned resistance will argue that it has completed with three waves down to 0.8502. Further break of 0.8977 will bring retest of 0.9267 high. Nevertheless, rejection by 0.8717, followed by break of 0.8502 will resume the decline towards 0.8201 (2022 low).
EUR/CHF Daily Outlook
Daily Pivots: (S1) 0.9595; (P) 0.9612; (R1) 0.9620; More...
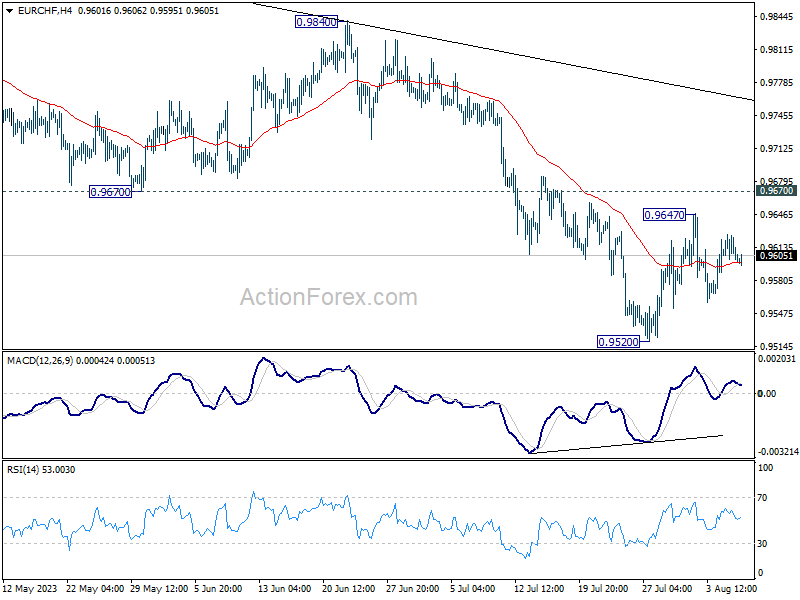
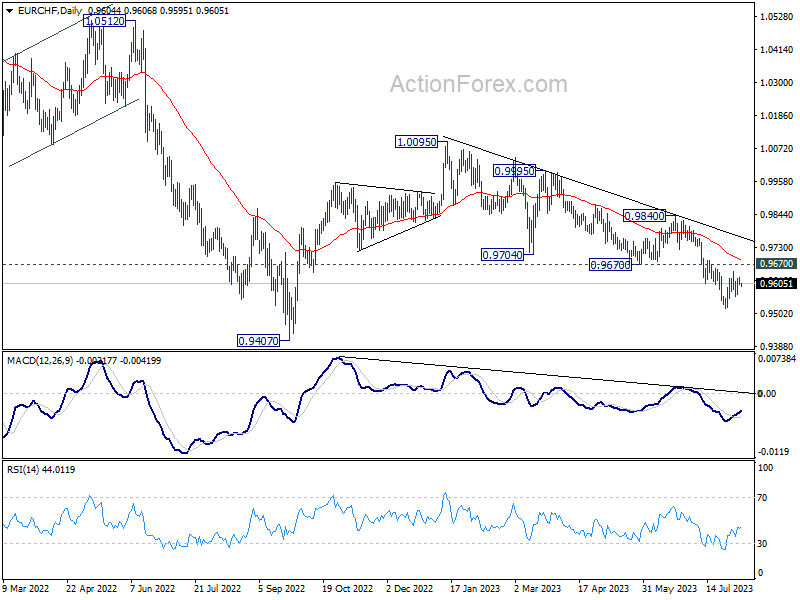
Range trading continues in EUR/CHF and intraday bias stays neutral at this point. Further decline is in favor as long as 0.9670 holds. On the downside, break of 0.9520 will resume the whole fall from 1.0095 towards 0.9407 low. Nevertheless, sustained break of 0.9670 will be the first sign of bullish reversal and target 0.9840 resistance for confirmation.
In the bigger picture, medium term outlook is staying bearish as the pair is capped well below falling 55 W EMA (now at 0.9860). Down trend from 1.2004 (2018 high) is in favor to continue. Sustained break of 0.9407 will target 61.8% projection of 1.1149 to 0.9407 from 1.0095 at 0.9018. For now, this will remain the favored case as long as 0.9840 resistance holds, in case of strong rebound.
USD Holds Steady
USD/CHF bounces higher
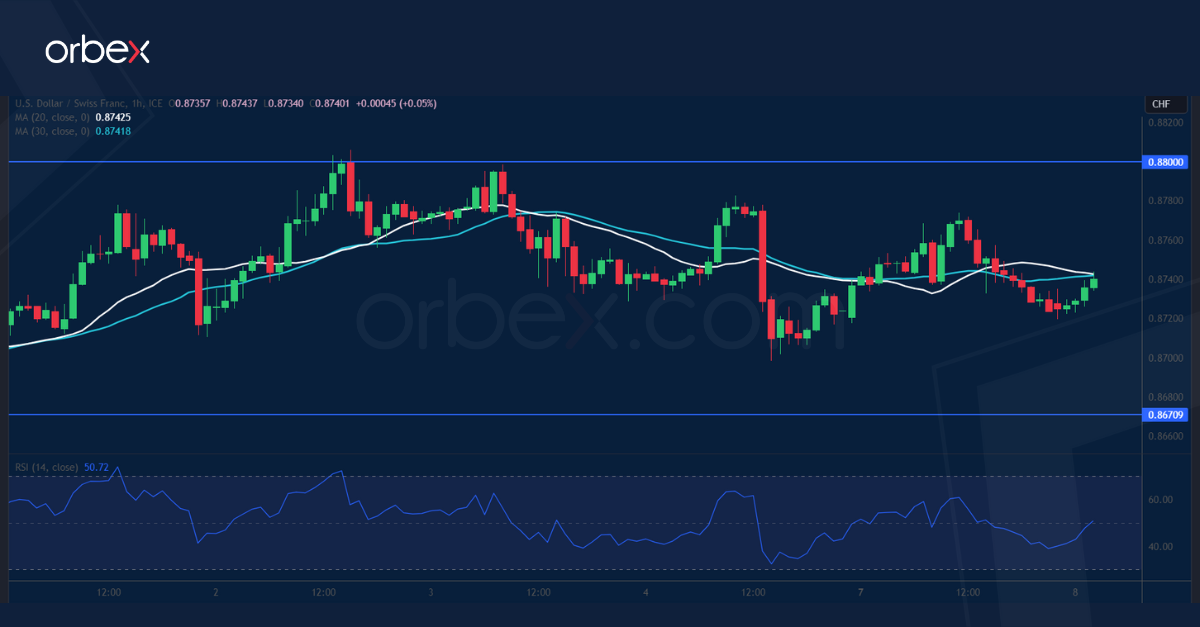
The US dollar steadies as Fed officials commented that further rate increases are likely. The pair is still in a slow recovery, probing for resistance as sellers take some chips off the table. The bounce has hit resistance at 0.8800 on the 30-day SMA, suggesting that sentiment remains cautious at best. 0.8670 is the immediate support and 0.8560 a critical floor to keep the current rebound valid or risk a bearish continuation. On the upside, the former daily support of 0.8900 would be next in case of further bullish extension.
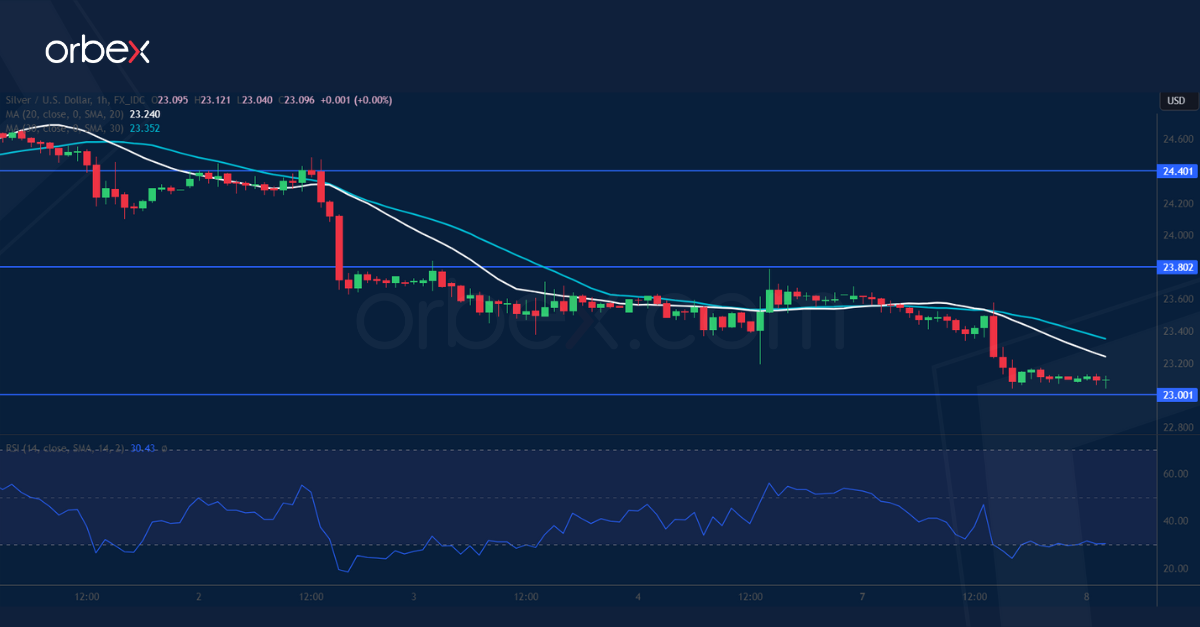
XAG/USD tests major support
Precious metals weaken as a tight US labour market pushes bond yields higher. Silver has fallen back to the base of July’s breakout rally and the round number of 23.00 and this could be the ultimate test of buyers’ resolve. A bearish breakout would expose June’s lows near 22.10, invalidating the summer rally. An oversold RSI has brought in some bids in this major demand zone. 23.80 is the first hurdle to clear should the bulls manage to make their way back and only a close above 24.40 would help attract more buying interests.
DAX 40 seeks support
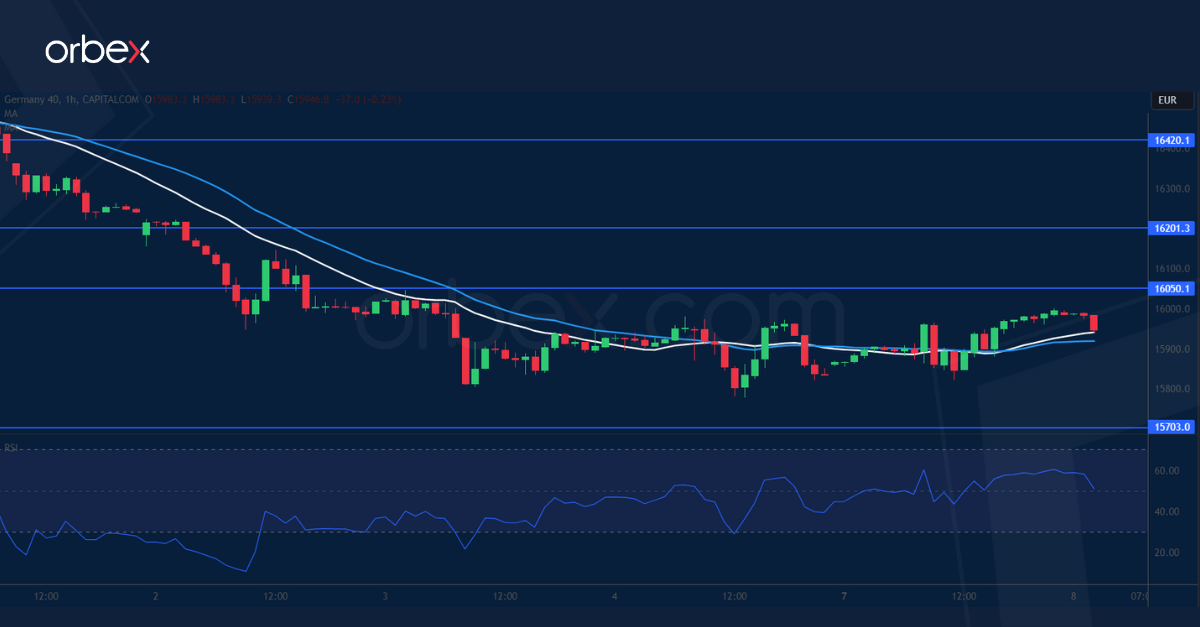
The Dax 40 consolidates ahead of inflation figures from Germany and the US this week. A drop below the psychological level of 16000 which coincides with a swing low and the 30-day SMA has put buyers in a bind. Volatility is a sign that short-term positions were forced to exit. The area between July’s low of 15450 and 15700 is key in keeping the upward bias intact from the daily chart’s perspective, or its breach could trigger a prolonged correction. 16050 is a fresh resistance and the bulls may only regain control once above 16200.