Sample Category Title
Crypto Encouraged Again by Banks’ Woes
Market picture
The crypto market has added 1.4% in the past 24 hours to $1.18 trillion. The positive momentum can be tied to a new wave of concerns about banks following Moody’s downgrade of ten mid-sized US banks and an unexpected Italian windfall tax. Investors are piling into the largest cryptocurrencies to preserve large amounts of capital to stay far from the banks, where deposit guarantees apply to not-so-large sums.
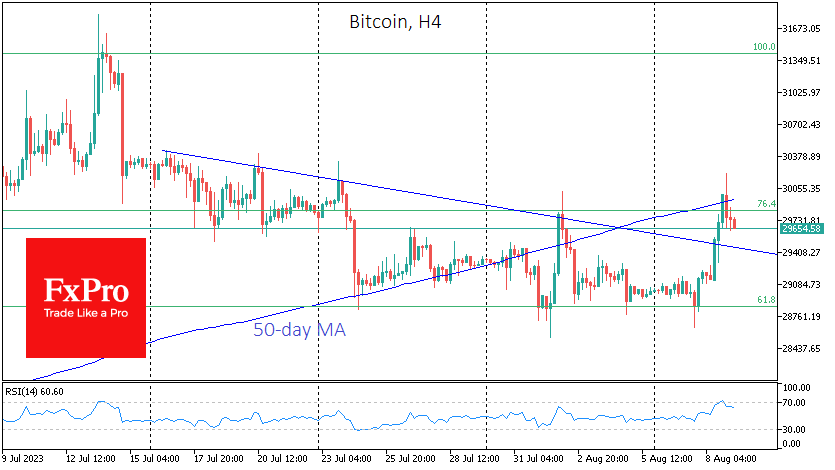
Bitcoin added over 3% throughout Tuesday with a mini short-squeeze in low-liquidity morning trading briefly taking the price above $30K before pulling back to $29.7K by the time of writing. Bitcoin could maintain a negative correlation with bank stocks’ performance, benefiting from their downturn. However, without actual industry bankruptcies, this is akin to a knee-jerk reflex with a short-lived impact.
Technically, the market made its second failed attempt this month to get back above the 50-day average. The ability to consolidate above $30K will be a milestone, cementing the breaking of the downtrend of the last four weeks.
News Background
Kaiko is talking about the return of the “Stablecoin Wars” amid massive USDT selling. Consequently, the USDT exchange rate has fallen below its target peg to the dollar for the past few days.
According to DEXTools, at least 66 fake PayPal USD (PYUSD) stablecoins have appeared online, launched on Monday by the payment system PayPal. Some crypto enthusiasts have taken a negative view of PayPal’s initiative. Others are positive about the new coin’s impact on the Ethereum blockchain in the context of its wider adoption.
So far this year, 97 out of 700 cryptocurrency funds have closed, according to a report by 21e6 Capital. In the first half of the year, the average return of such organisations was just 15.2%, while Bitcoin rose 83.3% over the same period.
According to CoinGecko, MetaMask was the most popular non-custodial wallet, with over 22.66 million installations in 2023. This is followed by Coinbase Wallet, Trust Wallet and Blockchain.com Wallet, with at least 10 million installations each.
GBP/USD Technical Analysis
On the hourly chart of GBP/USD at FXOpen, the pair found support near the 1.2680 zone. The British Pound started a decent increase above 1.2720 against the US Dollar.
The pair settled above the 50-hour simple moving average. It is now facing resistance near the 1.2765 zone. The first major resistance is near the 1.2800 zone. If there is a clear upside break above 1.2800, the pair could rise toward the 1.2840 level in the near term.
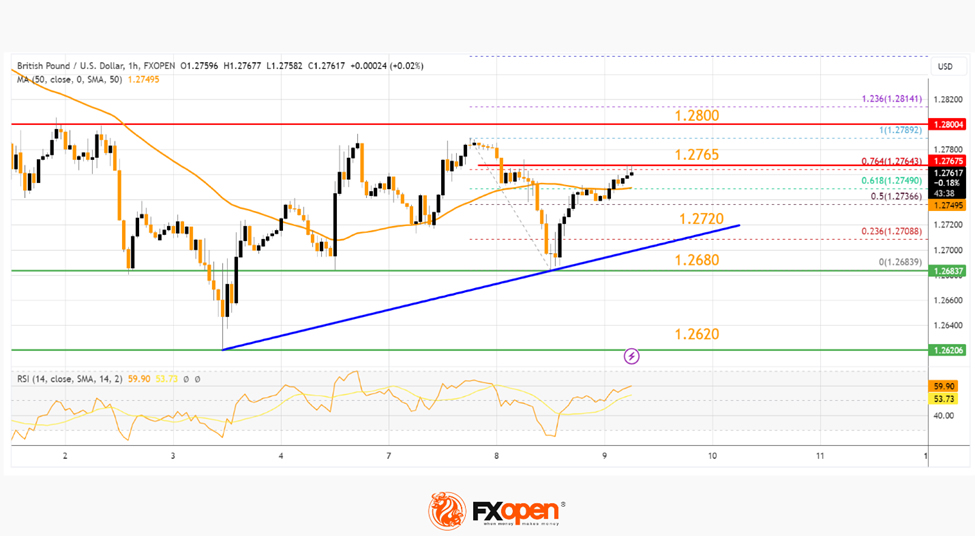
The next key resistance sits near the 1.2880 level, above which the GBP/USD pair might gain bullish momentum and revisit the 1.2950 zone.
On the downside, the first major support is near the 1.2720 zone, below which the pair could decline toward 1.2680. The next stop for the bears may perhaps be near the 1.2620 level.
This article represents the opinion of the Companies operating under the FXOpen brand only. It is not to be construed as an offer, solicitation, or recommendation with respect to products and services provided by the Companies operating under the FXOpen brand, nor is it to be considered financial advice.
USDJPY Fights August’s Bar Again
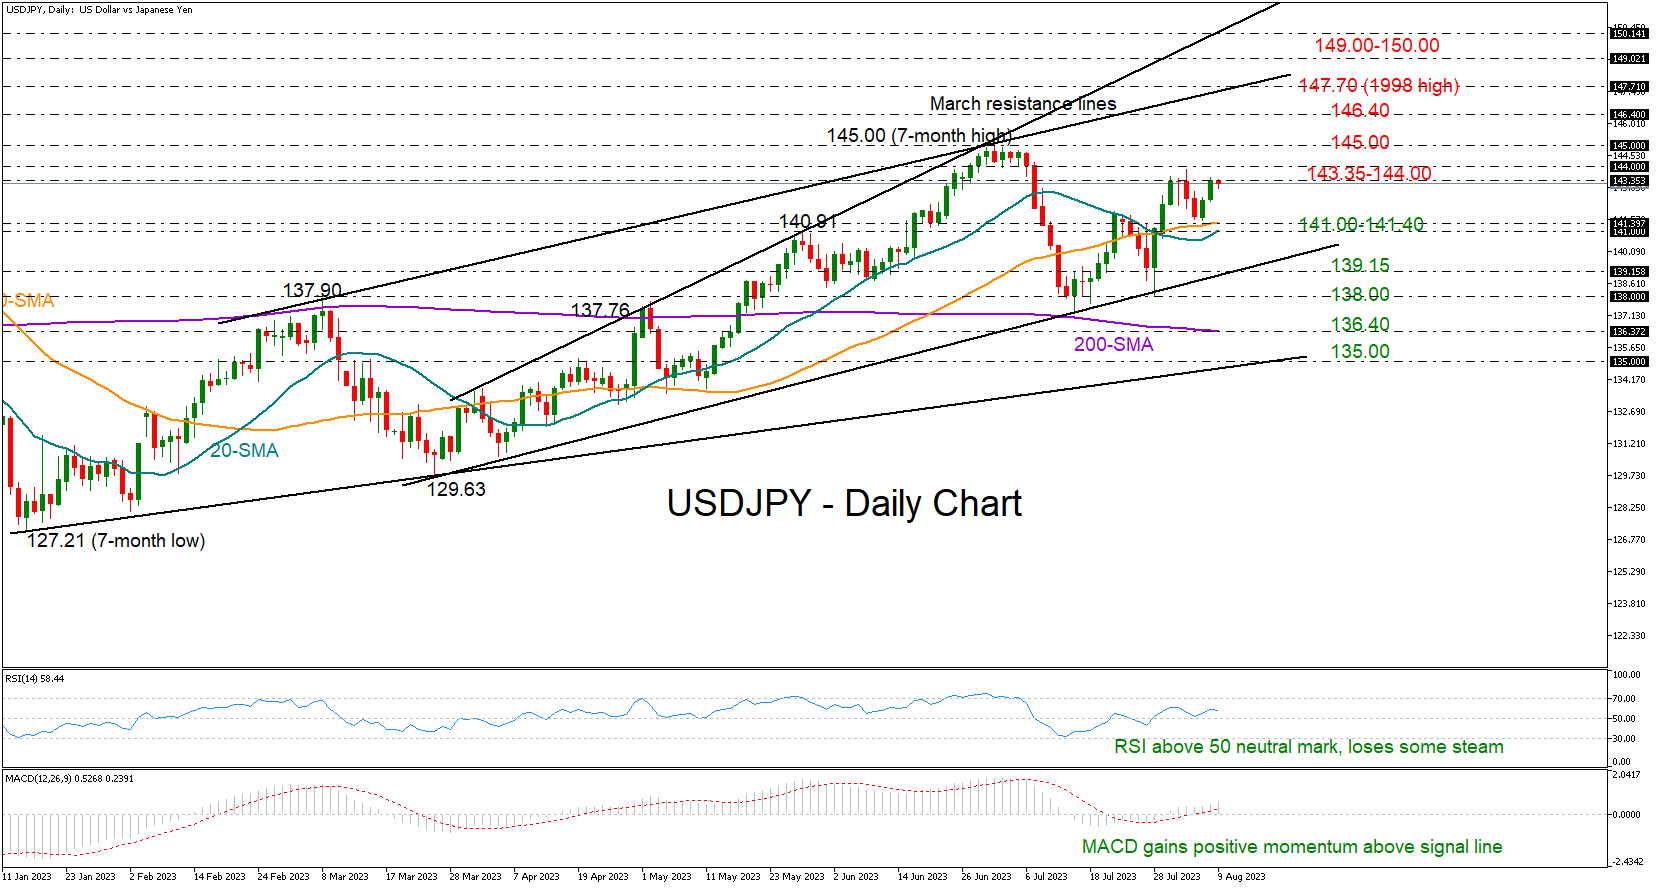
USDJPY recouped its latest pullback after finding strong support around the 141.50 level and near the 50-day simple moving average (SMA).
The focus is now again on the 143.35 ceiling as investors are eagerly waiting for the US CPI inflation report to generate some extra volatility on Thursday at 12:30 GMT. There have been no successful attempts to cross the bar this month, but the bulls still have an advantage as long as the RSI is fluctuating above its 50 neutral mark and the MACD remains elevated above its red signal line. Nonetheless, some caution is still required as the RSI seems to be struggling to post new higher highs.
A continuation of the 2023 bullish movement above 144.00 and June’s peak of 145.00 could be another tough job. A decisive extension above that boundary could activate new buying orders, likely prompting a rally towards the 1998 barrier of 147.70 and the resistance line from March, unless the October-November constraining zone of 146.40 blocks the way higher. Further up, the price could next face congestion within the 149.00-150.00 region.
If the 143.35 bar stands firm, forcing a new bearish correction, the 50- and 20-day SMAs could protect the market from a steeper decline towards the support trendline at 139.15. The next destination could be the 138.00 area, where the price rebounded a couple of times last month. Failure to pivot there could open the door for the 200-day SMA at 136.40.
All in all, USDJPY has some bullish fuel in the tank, with traders probably waiting for a clear close above 143.35 to drive the price to June’s highs.
EUR/USD Dips Again While USD/JPY Gains Traction
EUR/USD started a fresh decline from 1.1040. USD/JPY is rising and might climb further toward the 145.00 resistance zone.
Important Takeaways for EUR/USD and USD/JPY Analysis Today
- The Euro started a fresh decline from the 1.1040 resistance zone.
- There is a key bearish trend line forming with resistance near 1.0975 on the hourly chart of EUR/USD at FXOpen.
- USD/JPY climbed higher above the 142.50 and 143.00 levels.
- There is a major bullish trend line forming with support near 143.00 on the hourly chart at FXOpen.
EUR/USD Technical Analysis
On the hourly chart of EUR/USD at FXOpen, the pair started a fresh decline from the 1.1040 zone. The Euro declined below the 1.1015 support zone against the US Dollar.
The pair even settled below the 1.1000 zone and the 50-hour simple moving average. A low is formed near 1.0929 and the pair is now correcting losses above the 23.6% Fib retracement level of the recent decline from the 1.1042 swing high to the 1.0929 low.
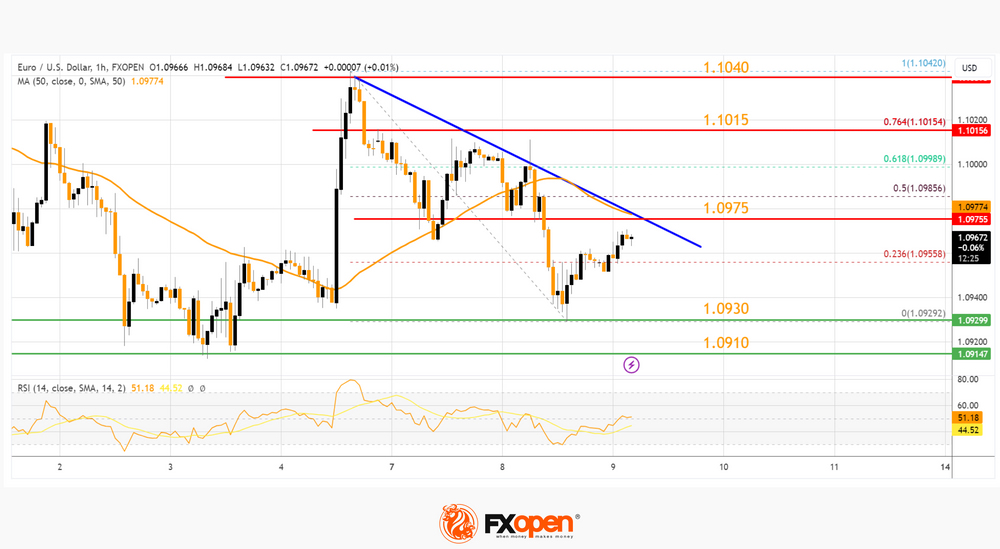
On the upside, the pair is now facing resistance near the 50-hour simple moving average at 1.0975 and a key bearish trend line. The next major resistance is near 1.1015.
The 76.4% Fib retracement level of the recent decline from the 1.1042 swing high to the 1.0929 low is also near 1.1015. The main resistance is still near 1.1040. An upside break above 1.1040 could set the pace for another increase. In the stated case, the pair might rise toward 1.1100.
If not, the pair might resume its decline. The first major support on the EUR/USD chart is near 1.0930. The next key support is near 1.0910. If there is a downside break below 1.0910, the pair could drop toward 1.0880. The main support is near 1.0850, below which the pair could start a major decline.
USD/JPY Technical Analysis
On the hourly chart of USD/JPY at FXOpen, the pair started a decent increase from the 141.50 zone. The US Dollar gained bullish momentum above 142.50 against the Japanese Yen.
It settled above the 50-hour simple moving average and 143.00. A high is formed near 143.49 and the pair is now consolidating gains. It is holding the 23.6% Fib retracement level of the upward move from the 141.51 swing low to the 143.49 high.
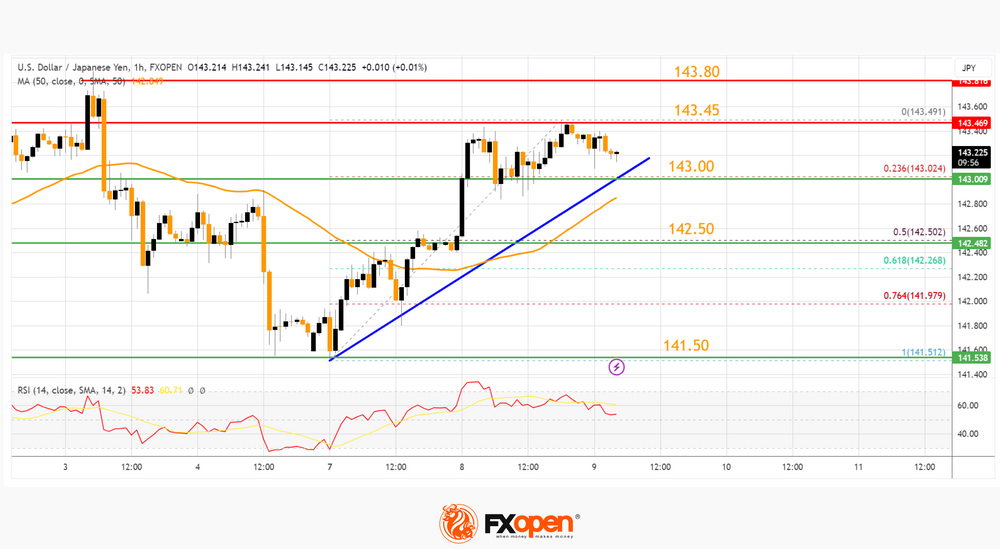
On the downside, the first major support is near a trend line at 143.00. The next major support is near the 142.50 level or the 50% Fib retracement level of the upward move from the 141.51 swing low to the 143.49 high. If there is a close below 142.50, the pair could decline steadily.
In the stated case, the pair might drop toward 141.50. The next stop for the bears may perhaps be near the 140.00 handle.
Immediate resistance on the USD/JPY chart is near 143.45. The first major resistance is near 143.80. If there is a close above the 143.80 level and RSI moves above 60, the pair could rise toward 144.50. The next major resistance is near 144.80, above which the pair could test 145.00 in the coming days.
This article represents the opinion of the Companies operating under the FXOpen brand only. It is not to be construed as an offer, solicitation, or recommendation with respect to products and services provided by the Companies operating under the FXOpen brand, nor is it to be considered financial advice.
EUR/AUD Daily Outlook
Daily Pivots: (S1) 1.6694; (P) 1.6777; (R1) 1.6826; More...
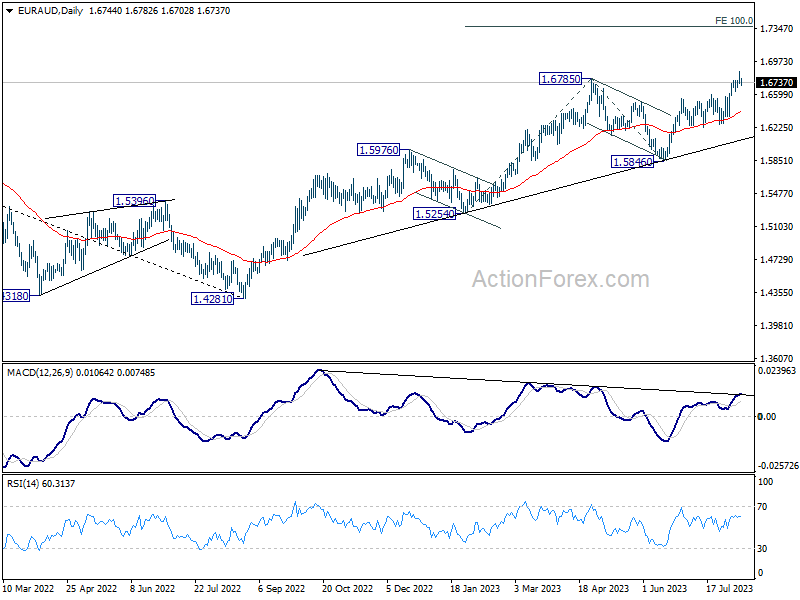
Intraday bias in EUR/AUD is turned neutral as it retreated after hitting 1.6858. Still new term outlook stays bullish as long as 1.6635 support holds. Above 0.6858 will resume larger up trend to 1.7377 projection level next.
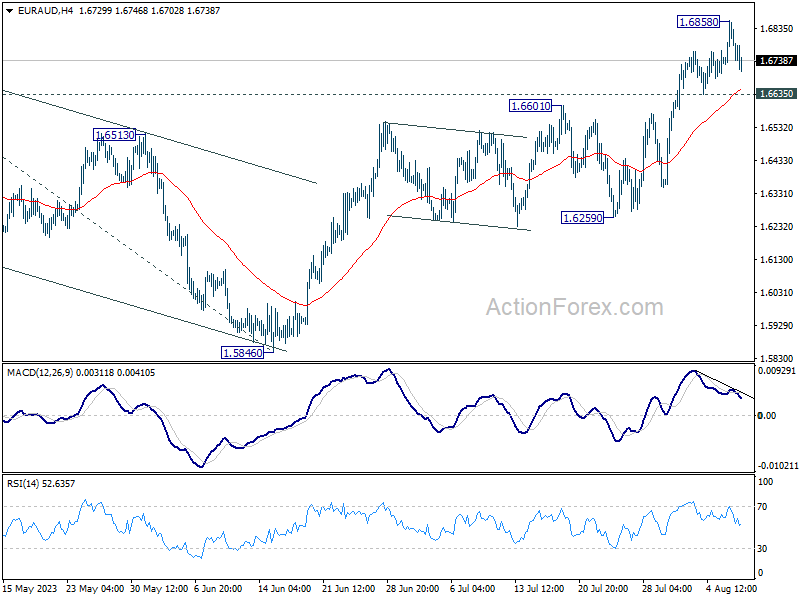
In the bigger picture, the rise from 1.4281 (2022 low) is in progress. Next target is 100% projection of 1.5254 to 1.6785 from 1.5846 at 1.7377. For now, outlook will stay bullish as long as 1.5846 support holds, even in case of another pull back.
EUR/GBP Daily Outlook
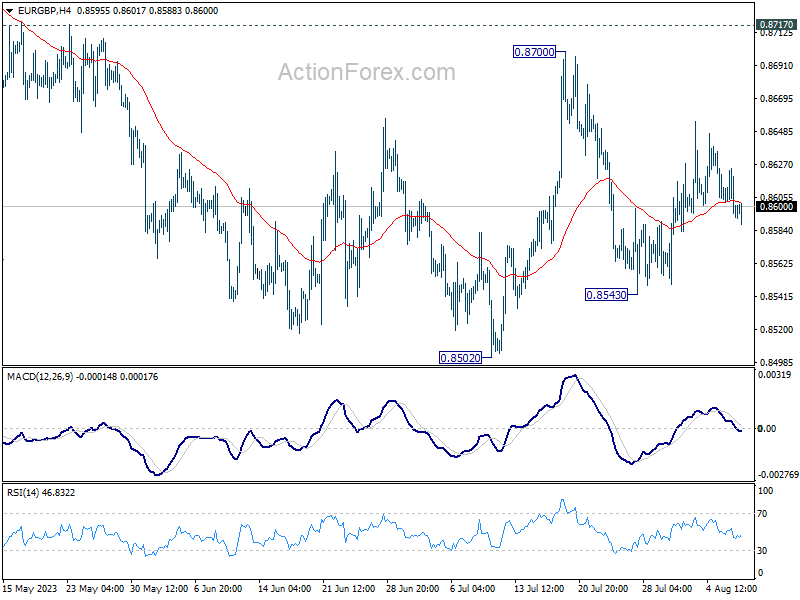
Daily Pivots: (S1) 0.8584; (P) 0.8605; (R1) 0.8616; More...
Intraday bias in EUR/GBP remains neutral as it's still bounded in sideway trading. On the downside, below 0.8543 will target a test on 0.8502 low. Decisive break there will resume larger decline from 0.8977. On the upside firm break of 0.8717 resistance will suggest larger reversal and target 0.8874 resistance next.
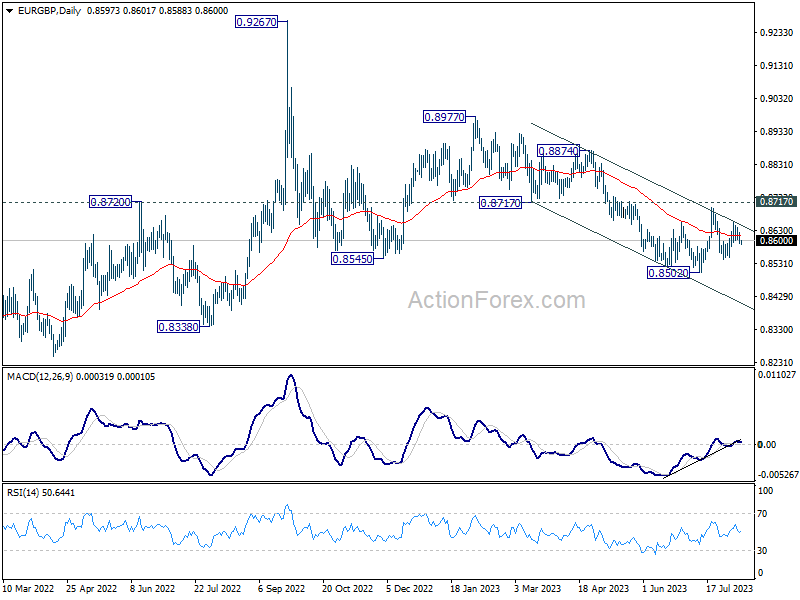
In the bigger picture, the down trend from 0.9267 (2022 high) is seen as part of the long term range pattern from 0.9499 (2020 high). Firm break of 0.8717 support turned resistance will argue that it has completed with three waves down to 0.8502. Further break of 0.8977 will bring retest of 0.9267 high. Nevertheless, rejection by 0.8717, followed by break of 0.8502 will resume the decline towards 0.8201 (2022 low).
EUR/JPY Daily Outlook
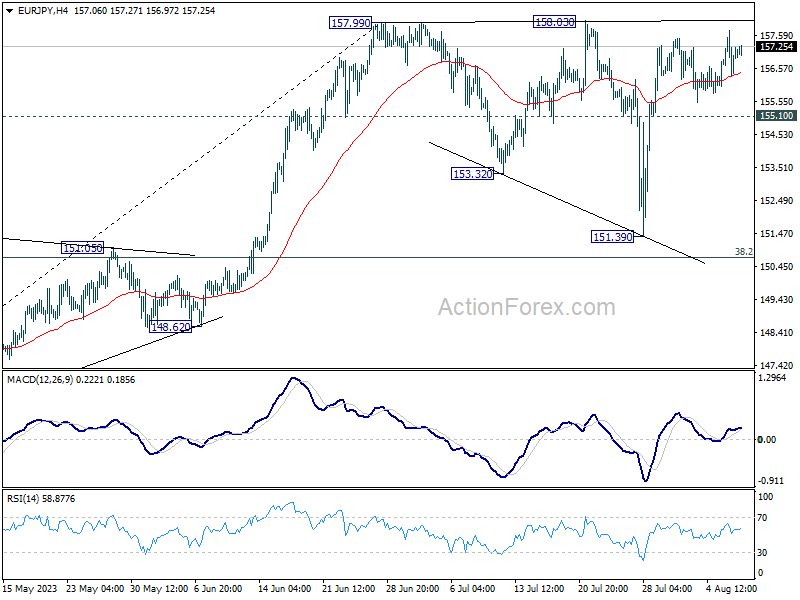
Daily Pivots: (S1) 156.39; (P) 157.07; (R1) 157.78; More....
Intraday bias in EUR/JPY remains neutral for the moment. On the upside, decisive break of 157.99/158.03 will resume larger up trend to 162.82 projection level next. However, break of 155.10 will extend the corrective pattern from 157.99 with another falling leg instead.
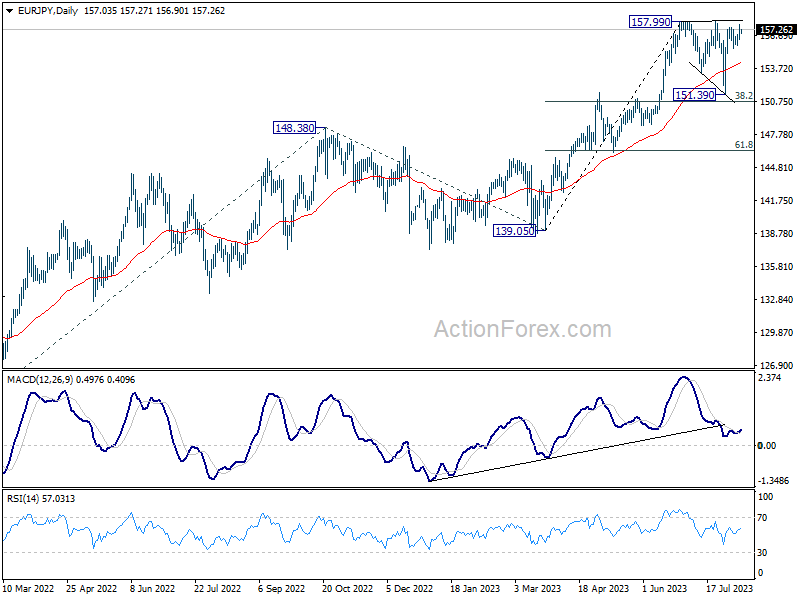
In the bigger picture, as long as 151.60 resistance turned support holds, rise from 114.42 (2020 low) is in progress. On resumption, next target is 100% projection of 124.37 to 148.38 from 138.81 at 162.82. Nevertheless, sustained break of 151.60 will argue that larger correction is already underway. Deeper decline would be seen to 55 W EMA (now at 145.94).
GBP/JPY Daily Outlook
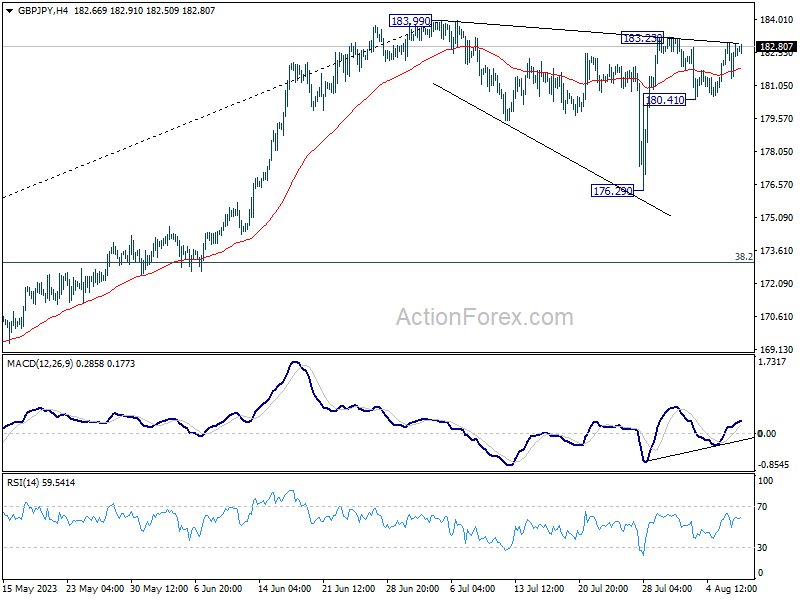
Daily Pivots: (S1) 181.81; (P) 182.38; (R1) 183.38; More...
Intraday bias in GBP/JPY stays neutral at this point. On the upside, decisive break of 183.99 high will resume larger up trend. Nevertheless, break of 180.41 will turn bias to the downside, to bring another fall to extend the corrective pattern from 183.99.
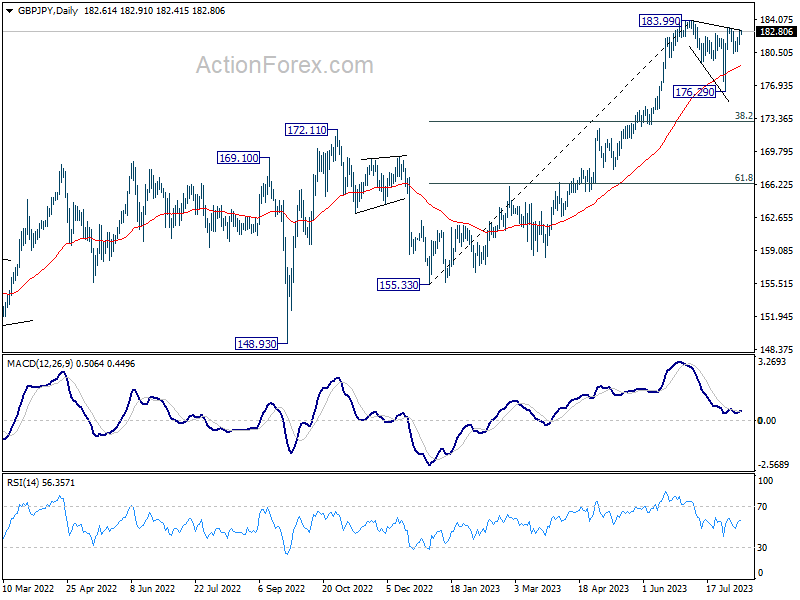
In the bigger picture, as long as 172.11 resistance turned support holds, up trend from 123.94 (2020 low) is expected to continue through 183.99 at a later stage, towards 195.86 (2015 high). Nevertheless, firm break of 172.11 will argue that larger correction is already underway.
EUR/CHF Daily Outlook
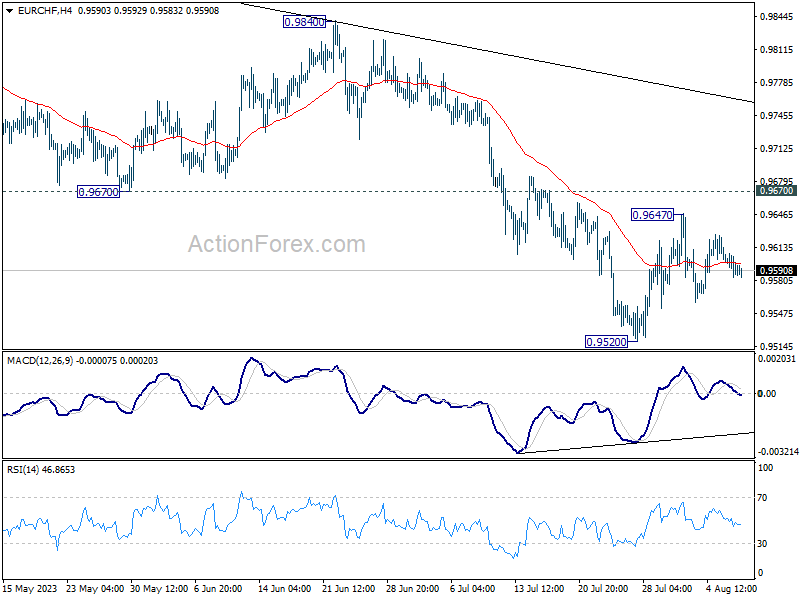
Daily Pivots: (S1) 0.9583; (P) 0.9596; (R1) 0.9607; More...
No change in EUR/CHF's outlook as range trading continues. Further decline is in favor as long as 0.9670 holds. On the downside, break of 0.9520 will resume the whole fall from 1.0095 towards 0.9407 low. Nevertheless, sustained break of 0.9670 will be the first sign of bullish reversal and target 0.9840 resistance for confirmation.
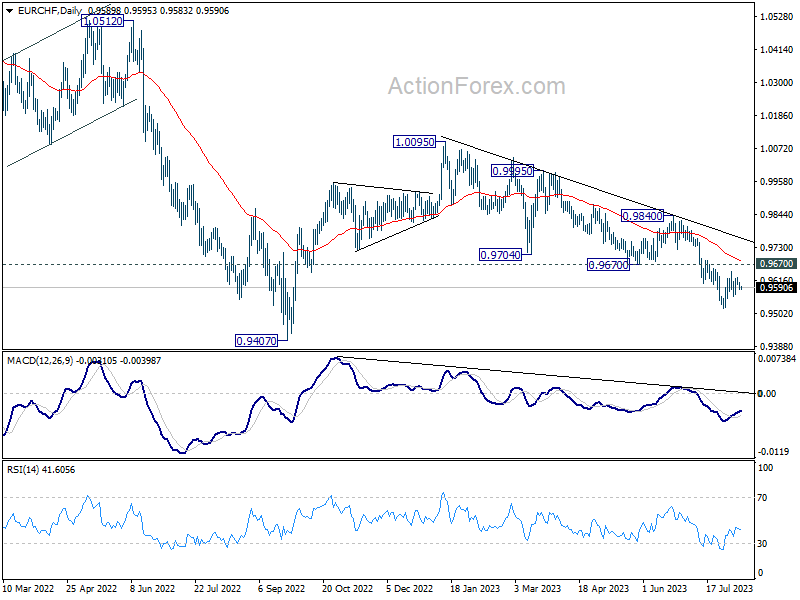
In the bigger picture, medium term outlook is staying bearish as the pair is capped well below falling 55 W EMA (now at 0.9860). Down trend from 1.2004 (2018 high) is in favor to continue. Sustained break of 0.9407 will target 61.8% projection of 1.1149 to 0.9407 from 1.0095 at 0.9018. For now, this will remain the favored case as long as 0.9840 resistance holds, in case of strong rebound.
NZDUSD Bearish Breakout Might Have Run Its Course
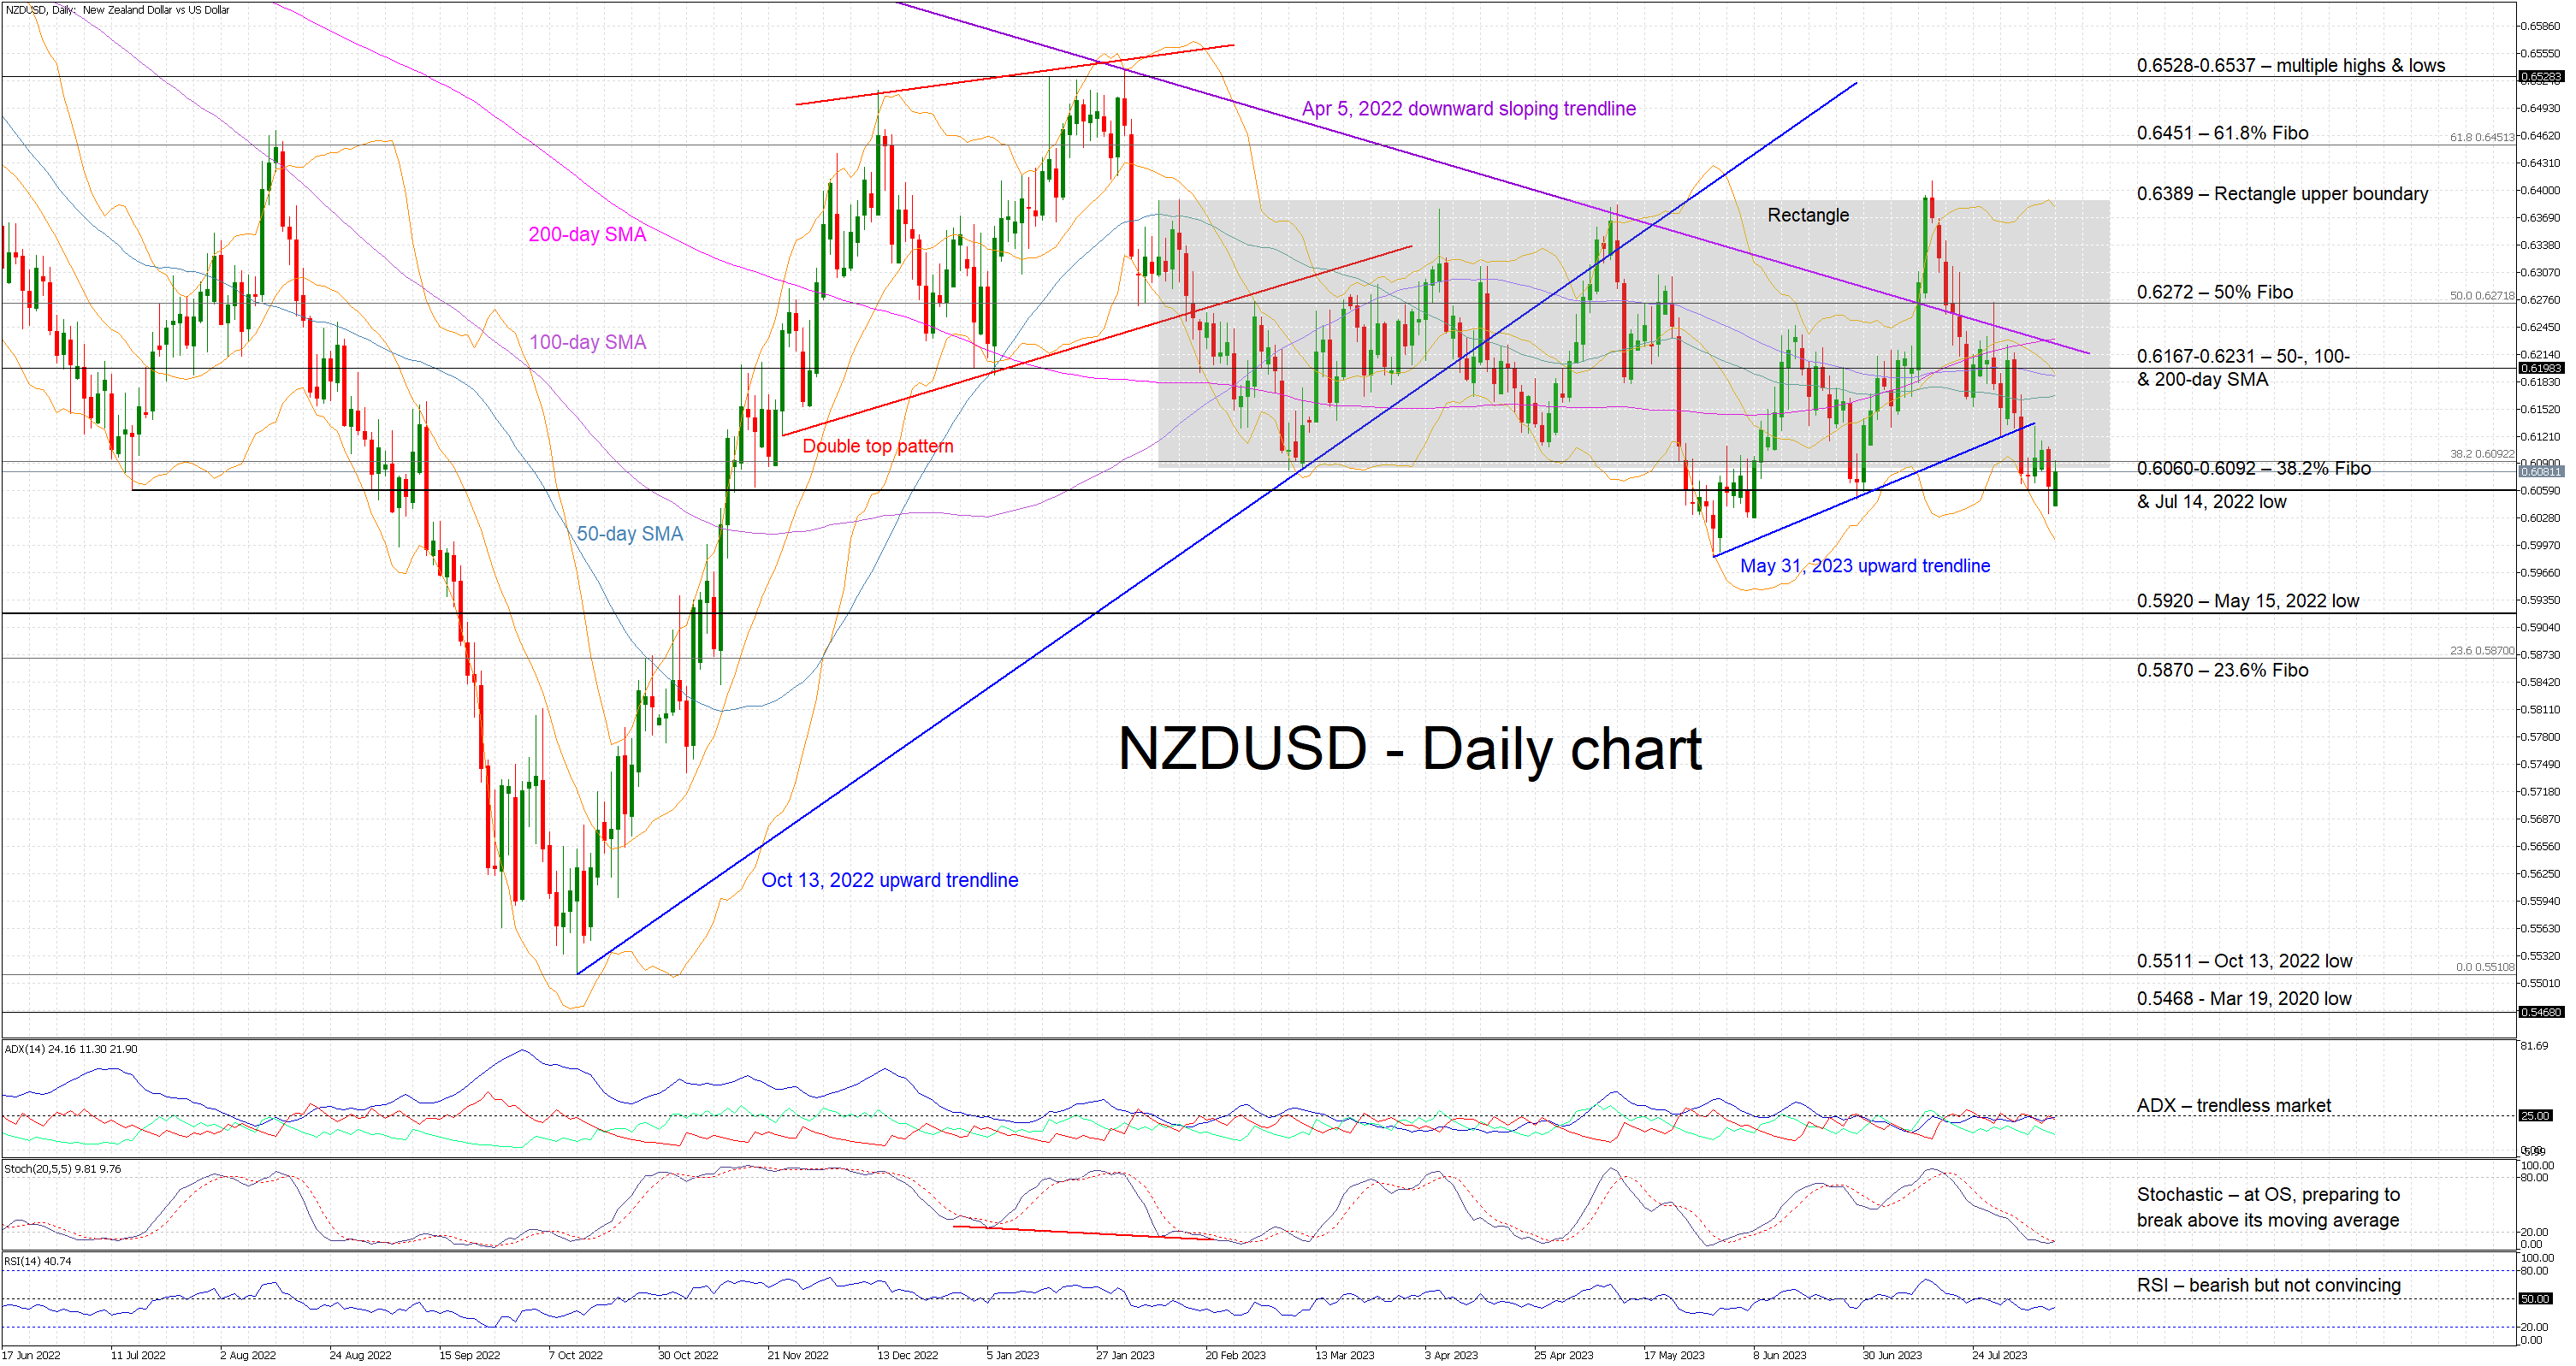
NZDUSD is recording a green candle today as the bulls are trying to halt the bearish breakout from the rectangle that has been in place since February 2023. This is actually the fourth breakout attempt since early June 2023, but similar to the previous ones, it seems to lack the necessary strength for a sizeable downleg. At least, the bears have managed to cancel the recent series of higher highs and higher lows that was developing since the May 31 local trough.
With the Average Directional Movement Index (ADX) mostly in holiday mood and pointing to a trendless market, the focus turns once again on the RSI and the stochastic oscillator. The former is moving sideways, a tad below its 50-midpoint and thus confirming the presence of bearish pressure. More importantly, the stochastic is preparing to break above its moving average and then gradually move above its oversold territory. This reaction would be seen as a strong bullish signal, especially if the ADX agrees and signals a bullish trend in NZDUSD.
Should the bears still feel confident, they would first try to overcome the support set by the busy 0.6060-0.6092 range that is defined by the 38.2% Fibonacci retracement of the April 5, 2022 – October 13, 2022 downtrend and the July 14, 2022 low respectively. They would then have the chance of recording a new 2023 low by overcoming the previous one at 0.5984, before setting their eyes on the May 15, 2022 low at 0.5920.
On the flip side, the bulls are patiently waiting to retake the market reins, and push NZDUSD above the 0.6060-0.6092 area and back inside the aforementioned rectangle. They could then have a go at leading NZDUSD even higher, towards the 0.6167-0.6231 range. This is populated by the 50-, 100- and 200-day SMAs and could prove tougher to crack.
To conclude, NZDUSD bears are trying to defend the current breakout, but the bulls appear ready to continue their counterattack, especially if they get the decisive signal from the stochastic oscillator.