Sample Category Title
CHFJPY Extends Rally to Record Highs
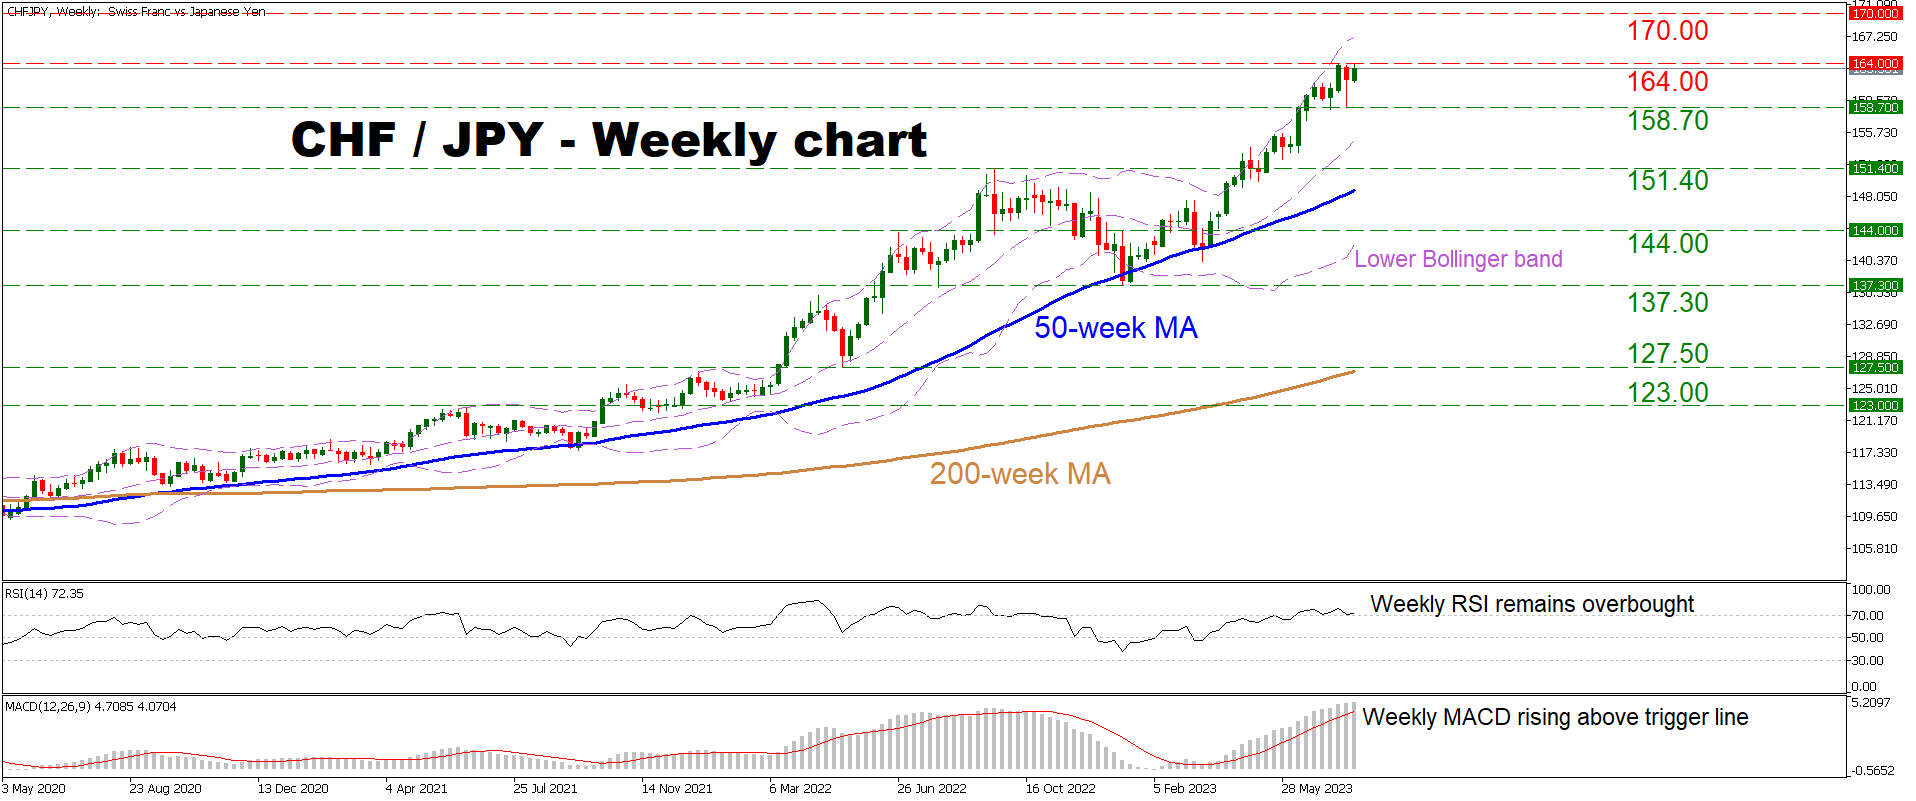
CHFJPY has been steadily marching higher this year, reaching its highest levels in at least four decades, since official records began. The pair is currently challenging those record highs near the 164.00 area, a violation of which would propel the market into uncharted waters.
On the weekly chart, momentum oscillators signal overbought conditions. The weekly RSI has flatlined but remains above the 70 level, while the weekly MACD is at its highest point in at least three decades. These readings are so extreme that they would normally be a warning for the bulls, although it is worth noting that markets can remain overbought for long periods of time.
If buyers remain in control and pierce above the record high of 164.00, the next major resistance barrier could be near 170.00, as traders might prefer to set their stops close to round psychological numbers. Even higher, the next area of interest would be around 174.00, which is the 261.8% Fibonacci extension of the correction in late 2022.
Now in case sellers come back into play and push the market lower, the first major cluster of support might be found near 158.70. That’s where the pair rebounded twice in July, and it’s also where the 50-day moving average has converged. Slicing below that region, the focus would shift towards 151.40, which was the high back in September.
In short, the technical outlook remains overwhelmingly positive, even if the momentum indicators are at extreme levels. A break above the record high of 164.00 would likely act as fuel for buyers.
US: Manufacturing Sector Activity Continued to Soften in July
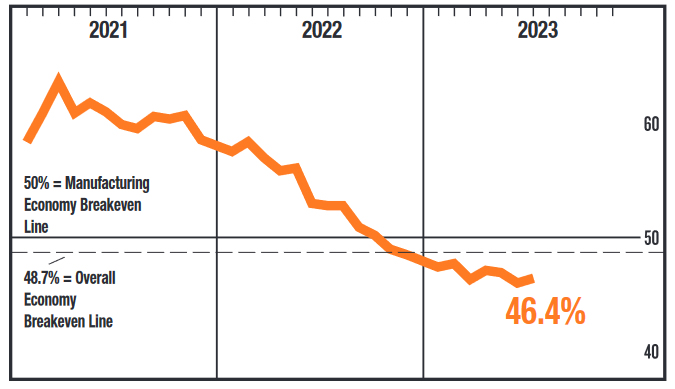
The July ISM Manufacturing Index registered 46.4, a slight improvement over June's 46.0 reading but short of the firming to 46.9 markets had expected.
The new orders sub-index rose 1.7 percentage points (pp) to 47.3, while new export orders fell another 1.1 pp to 46.2.
The backlog of orders sub-index registered 42.8, up from June's 38.7 print. The sub-index shows backlogs have been falling since October 2022.
The production and employment indexes both signaled contraction, registering 48.3 and 44.4, respectively.
The supplier deliveries sub-index rose to 46.1 from 45.7 in June – still reflecting improving supplier delivery times. The prices paid sub-index rose to 42.6 but continues to reflect softening raw materials prices.
Two of 18 manufacturing industries reported growth in July. The industries reporting growth are Petroleum & Coal Products and Furniture & Related Products.
Key Implications
The manufacturing sector is showing signs of contraction for the ninth consecutive month with little change in the headline index, and all subcomponents showing declining activity. Moreover, only two of 18 industries reported growth in July, down from four in June. The weakness in the sector is growing more pervasive – as would be expected given that new orders have now declined for 11 consecutive months.
For the Fed, weakness in the manufacturing sectors output should signal the freeing up of capacity and easing price pressures. From this lens, despite last week's personal consumption expenditure report showing that consumer demand for goods ticked up again in June – led higher by healthy growth in durables expenditures – inflation continues to soften. Looking forward, we are of the view that the Fed has likely reached the end of its tightening cycle and will wait for the full force of policy to work its way through the economy.
Can Nonfarm Payrolls Reawaken the US Dollar?
The latest edition of nonfarm payrolls will be released at 12:30 GMT Friday. Early indicators point to another solid employment report, which would reaffirm that the US economy remains far stronger than its competitors. This strength has not been reflected in the dollar lately, as other central banks raced ahead of the Fed in raising rates, although this dynamic seems to be changing.
Economic resilience
It is becoming clearer that the US economy has withstood the burden of higher interest rates without sustaining any real damage. Economic growth is running at around 2%, consumption remains robust, and the labor market is in great shape.
Even the housing market has staged a recovery, which is impressive in an environment where mortgage rates are almost 7%, restricting access for first-time buyers. And while the broader economy remains resilient, inflationary pressures seem to be moderating with some assistance from falling energy prices.
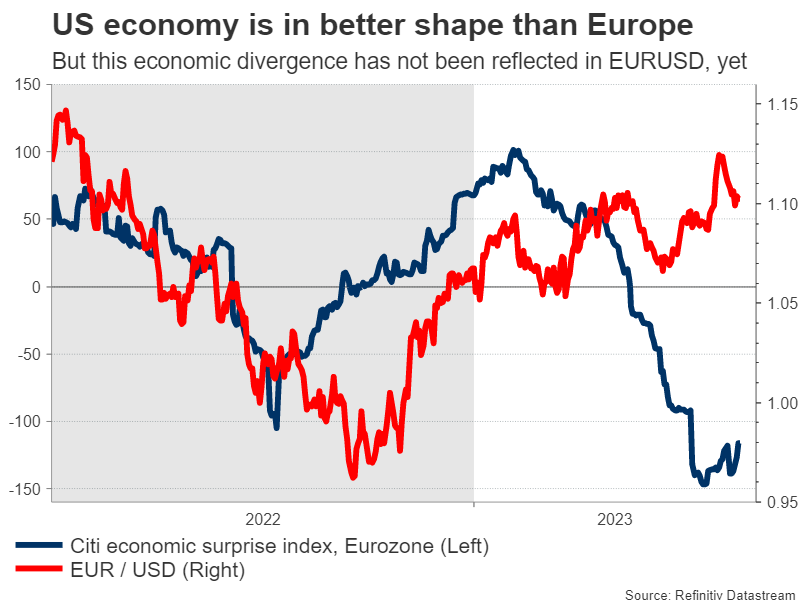
As such, recession concerns have faded away and there are growing hopes that the US economy can achieve a soft landing. In sharp contrast, business surveys warn that the European economy is descending into a recession, while the Chinese economy has been kneecapped by the slump in global manufacturing.
NFP might slow down, but nothing tragic
Turning to this week's releases, the ball will get rolling on Tuesday with the ISM manufacturing survey for July. The non-manufacturing index will follow on Thursday and will provide important clues around how the labor market performed, ahead of the official employment report on Friday.
Nonfarm payrolls are projected to have risen by 200k in July, which is a shade lower than last month's 209k. The unemployment rate is expected unchanged at 3.6%, while average hourly earnings are seen losing some steam, slowing down to 4.2% from 4.4% in the previous month.
For the most part, these forecasts are corroborated by early labor market indicators. Applications for unemployment benefits fell during the month, which suggests there were no signs of mass layoffs. Meanwhile, business surveys revealed the slowest pace of employment growth since January, but admittedly, that's not very worrisome since it's been a stellar year for jobs growth so far.
One area that might hold surprises is wage growth, as the same businesses reported rising salary pressures amid challenges to retain staff. Hence, the risks surrounding the average hourly earnings print might be tilted to the upside.
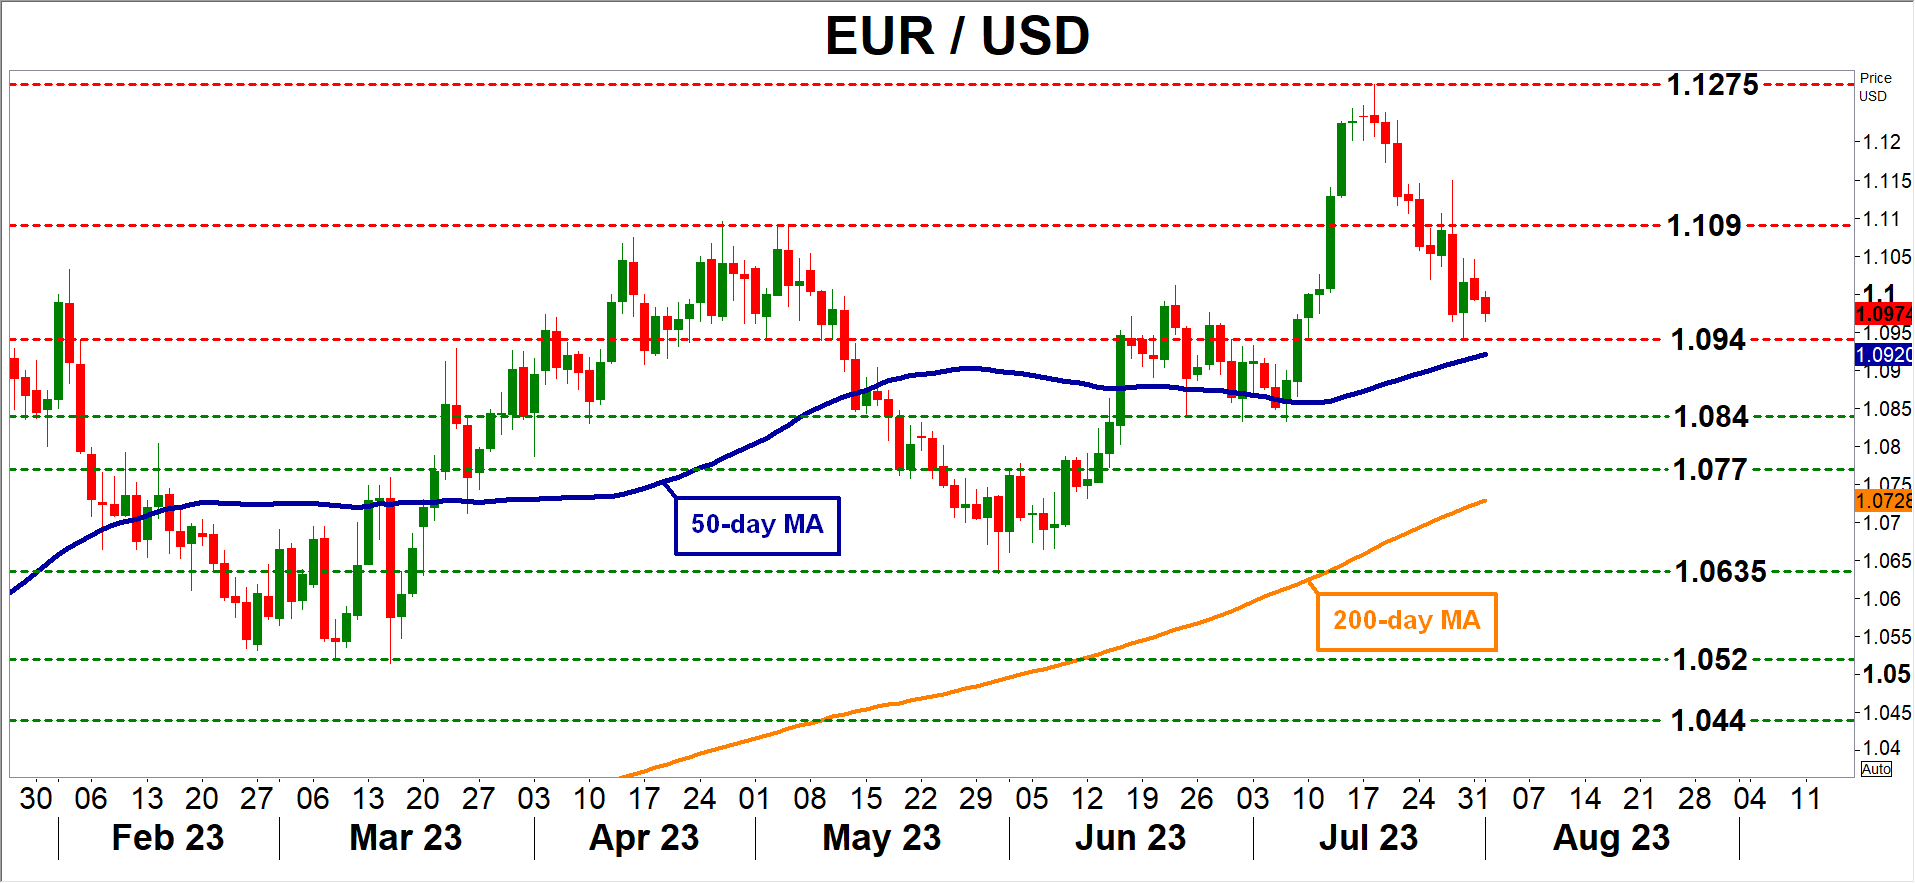
A generally hot employment report - especially on the earnings front - could fuel bets that the Fed is not done raising rates and by extension help to revive the US dollar. Looking at the euro/dollar chart, the most crucial area to watch on the downside is the 1.0940 region, which is the 50% Fibonacci retracement of the entire 2021-2022 downtrend.
On the other hand, any disappointments in the jobs data could inflict some damage on the dollar and propel euro/dollar higher, turning the spotlight towards the 1.1090 territory.
Investors will get a better sense of what to expect on Wednesday and Thursday, when the ADP employment data and the ISM services survey are released, respectively.
The big picture
All told, the outlook for the US dollar seems increasingly bright. The US economy is far superior to its competitors at this stage, which ultimately might be reflected in the FX arena.
Market pricing currently suggests that the Fed is likely to cut interest rates before the ECB does next year, even though the European economy is already struggling. This leaves some scope for a repricing in bond markets, something that would be negative for euro/dollar if it plays out.
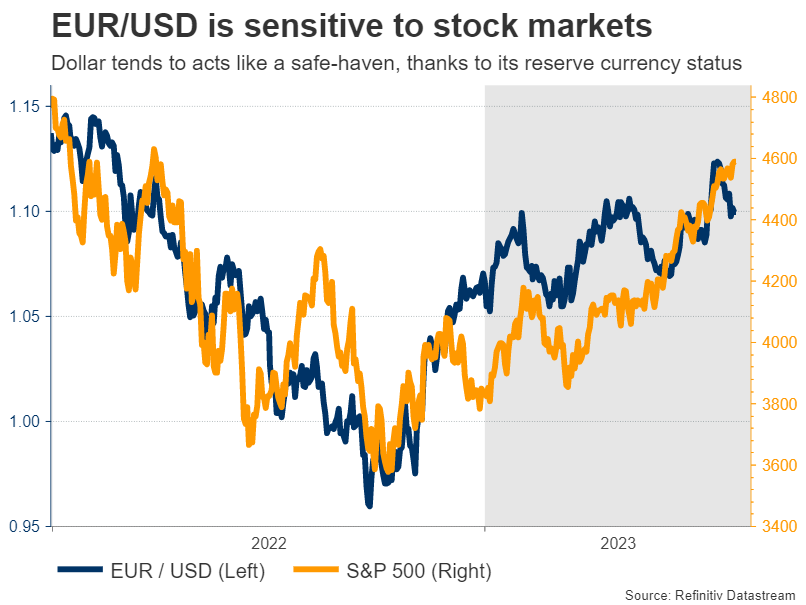
Similarly, the euphoric tone in stock markets has been a major factor behind the dollar's inability to rally this year. Both euro/dollar and pound/dollar have a strong positive correlation with US stocks, so if there is any correction in equity markets, that might also help the dollar get its mojo back.
Gold Now Choosing Its Trend
Gold has been sticking to support at the 50-day moving average since July 13th but has not found enough strength to break away from it. The markets tested the uptrend again last Thursday amid a wave of dollar strength. On Tuesday morning, Gold is down 0.6%, falling back to $1953, just $6 above this curve.
Technically, the ability to hold above this line would be a significant tactical victory for the bulls. It would dispel buyers’ doubts about the precious metal’s ability to move higher in an environment with the highest interest rates in more than twenty years and investors’ attempts to jump into equities after months of rallying.
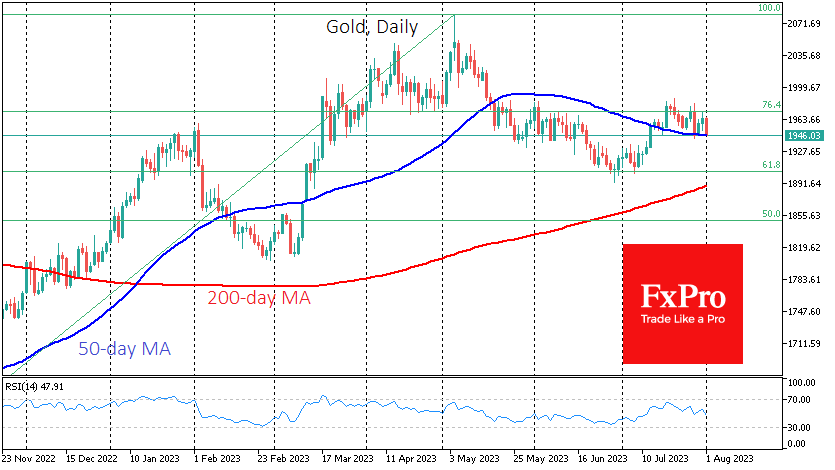
The longer-term technical picture remains bullish, with gold trading above its 200-day average since last December and the corrective pullback of May and April representing a precisely calibrated Fibonacci retracement of 61.8% of the November-May advance.
Nevertheless, the gold market looks balanced locally, with the RSI now barely above 50 on the daily and 55 on the weekly timeframes.
Fundamental factors on the precious metal’s side include investor sentiment that the Fed is done raising rates after a string of weak inflation data in recent weeks.
The ability of the bulls to defend the $1947 level for the third time in less than a month could encourage them to buy, taking the price to the area of the historic highs at $2050 and renewing them from there. This is the base case scenario.
However, the short-term downtrend that has formed in recent weeks raises the question of the near-term downside targets in the event of a breach of support. Consolidation below $1947 could open a direct path to the $1900 area with the risk of a long-term trend reversal to the downside.
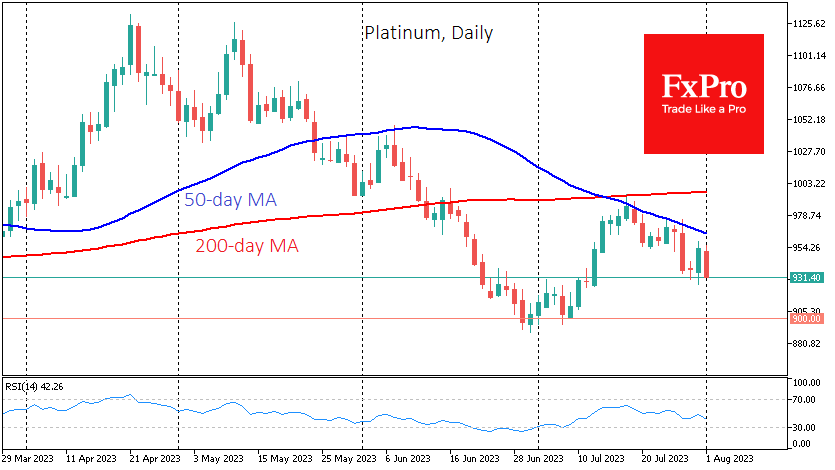
Other precious metals are not happy locally. Platinum is down over 2% on Tuesday, with the 50-day moving average acting as resistance since the middle of last month, shortly after forming a “death cross” signal.
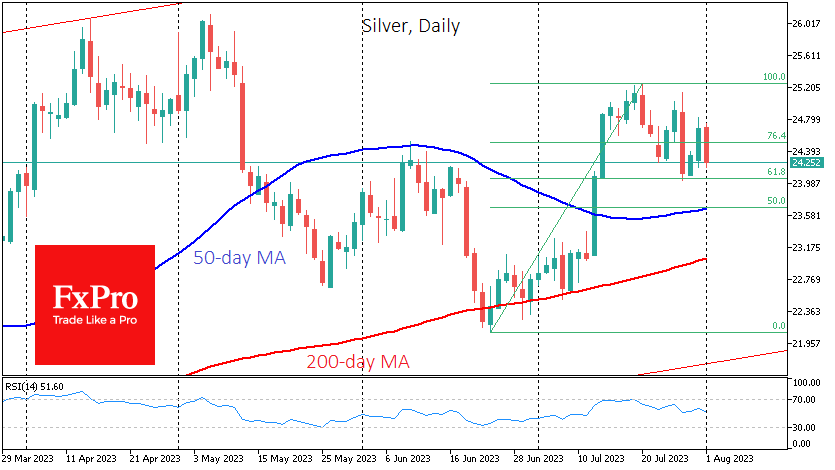
Silver’s losses for Tuesday alone are also approaching 2%, taking the price to $24.2, despite having an even better technical picture than gold. The first sign of a bullish retreat in silver will be a break below $24, making the latest decline more than just a mediocre correction.
Sunset Market Commentary
Markets
July was a pretty volatile month for core bonds. They gained in the first half before forfeiting much of those gains in the second part of the month. They continued the latter move at the start of August. In absence of any economic data of importance or other specific triggers, both US and German bond yields swung higher. Moves across the Atlantic range between 2-5.8 bps in a steepener with the 2-y yield slowly but steadily closing in on 5% again. The 10-y yield is trying to settle back north of 4%. Germany’s 2-y tenor ekes out a small 1.4 bps with the 3% barrier serving as a technical support zone. Changes on the remainder of the curve vary from +3.3 bps to 5.2 bps in a similar steepening move to the US. It’s a market reaction that could just as well have taken place yesterday following stronger-than-expected European inflation and growth numbers. Equity sentiment took a blow from a flurry of disappointing earnings, including BMW and Pfizer. It’s also simply a logical, healthy retreat after a stellar July month that brought the likes of the EuroStoxx50 beyond strong resistance levels and the S&P500 less than 5% away from its 2022 all-time high. Stocks today ease about 1% in Europe and half that in the US. The risk-off and UST underperformance gives the dollar a nice edge over its peers. The trade-weighted index jumps above intermediate resistance at 101.92 to fill bids around 102.36. EUR/USD goes deeper south, sub 1.10 to trade at the weakest level since its comeback early July. The Australian dollar is trading in the defensive after the Reserve Bank of Australia this morning defied analyst expectations for a 25 bps rate hike. Instead it opted for a hold and wants to await more economic data. AUD/USD drops towards the 0.66 area, a level that has marked the lower bound of a 2 big figure wide sideways trading range that has been in place since March.
The above was the setting markets found themselves in going into the publication of the US manufacturing ISM for July and the JOLTS report for June. Both came in slightly below expectations. Job openings still stand at a historically elevated 9582k vs 9600k expected and down from 9824k the month before. The manufacturing sector is showing tentative signs of bottoming out with the ISM rising from 46.4 from 46. Consensus was for a slightly bigger recovery to 46.9. Prices paid still drop sharply, be it slightly less than in June (42.6 vs 41.8). Manufacturers cut deeper in personnel (44.4 from 48.1) but new orders fell less dramatically last month (47.3 from 45.6).
News & Views
China’s currency regulators in recent weeks have asked commercial banks to either reduce or delay dollar purchases, news agency Reuters reported citing two people with direct knowledge of the matter. The informal instructions, also known as window guidance, were issued in a bid to slow the pace of the yuan’s decline. USD/CNY since hitting a correction low in January this year, has shot up more than 8% to around USD/CNY 7.25 by end of June. In July, a turnaround kicked in with the pair moving back south to 7.16 currently. The PBOC’s yuan fixing in recent weeks was also consistently (much) stronger than what analysts expected and the spot rate. Weak household confidence and thus consumption, a slowing (services) economy, troubled housing market and monetary policy divergence are the key elements for the weak yuan. Over the past few days, the Chinese government has announced a slew of measures to address the poor economic performance though it can take some time before they get implement and yield effect.
UK house prices according to the Nationwide Building Society in the twelve months through July fell by the most since 2009. The average house price was down 3.8% y/y on a monthly price decline of -0.2%. The drop was nonetheless slightly less than analysts expected (-0.5% m/m and -4% y/y). Nationwide’s chief economist Gardner said the challenging affordability picture helps explain the housing downturn. Mortgage interest rates have risen sharply in response to the Bank of England’s aggressive tightening cycle, accounting for an ever larger chunk in household expenses. Gardner remains cautiously optimistic on a soft landing for the market though: "While activity is likely to remain subdued in the near term, healthy rates of nominal income growth, together with modestly lower house prices, should help to improve housing affordability over time - especially if mortgage rates moderate once Bank Rate peaks."
US ISM manufacturing ticked up to 46.4, 9th month of contraction
US ISM Manufacturing PMI rose slightly from 46.0 to 46.4 in July, below expectation of 46.5. Looking at some details, new orders rose from 45.6 to 47.3. Production rose from 46.7 to 48.3. Employment dropped notably from 48.1 to 44.4. Prices rose from 41.8 to 42.6.
ISM said: "This is the ninth month of contraction and continuation of a downward trend that began in June 2022. That trend is reflected in the Manufacturing PMI®'s 12-month average falling to 48.3 percent."
"The past relationship between the Manufacturing PMI® and the overall economy indicates that the July reading (46.4 percent) corresponds to a change of minus-0.8 percent in real gross domestic product (GDP) on an annualized basis."
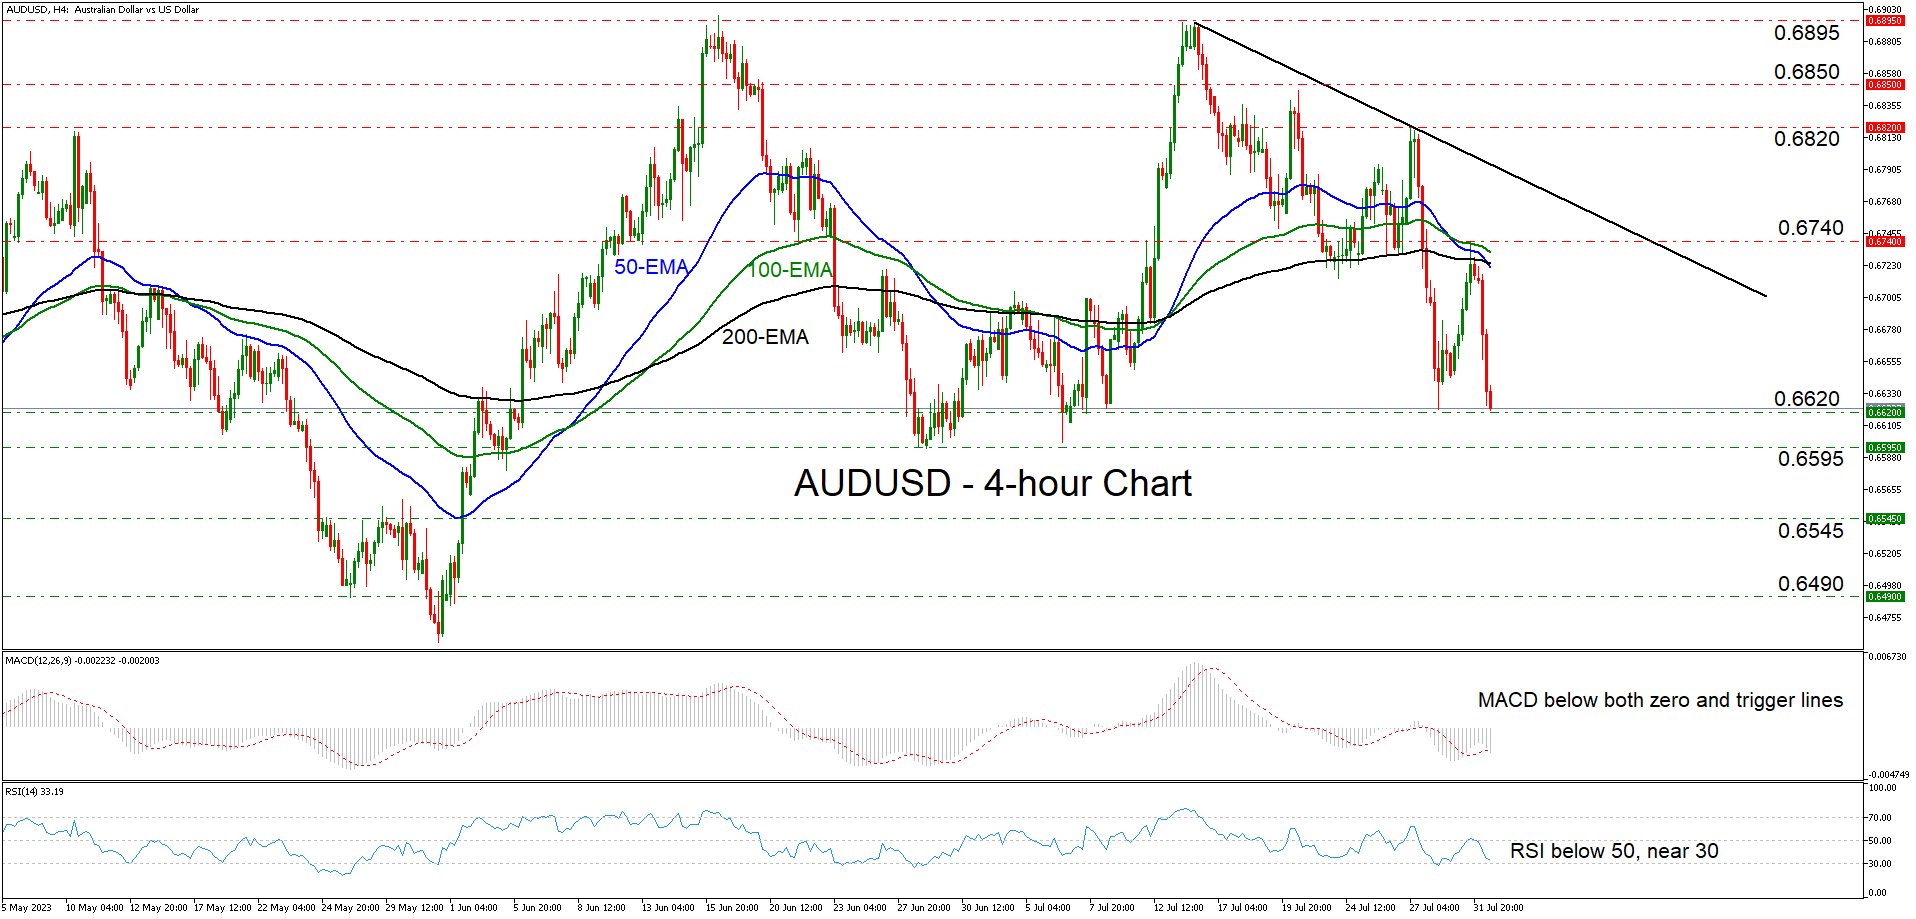
AUDUSD Tumbles and Revisits the Low of July 28
AUDUSD tumbled on Tuesday after the RBA decided to refrain from lifting interest rates, with the pair falling all the way down to the low of July 28 at around 0.6620. Overall, the price structure remains of lower highs and lower lows below the downtrend line drawn from the peak of July 14, which keeps the short-term outlook bearish.
Both the RSI and the MACD are detecting negative momentum, corroborating the view that the pair may be poised to continue drifting south for a while longer. The former lies below 50, close to its 30 line, while the latter runs below both its zero and trigger lines, pointing down.
A decisive break below 0.6620 would confirm a forthcoming lower low on the 4-hour chart and may initially target the 0.6595 zone, which offered support on June 28 and 29, as well as on July 6. If the bears are not willing to stop there either, then they may decide to extend their march towards the 0.6545 territory, which acted as a resistance back in May.
For the outlook of this pair to brighten, the bulls have a lot of work to do. They may need to climb all the way above the 0.6820 zone, as such a break will confirm the pair’s return above the aforementioned uptrend line and perhaps above all three of the plotted exponential moving averages. The next stop may be at around 0.6850, the break of which could carry extensions towards the 0.6895 barrier, which stopped the bulls from driving further north both in June and July.
To sum up, AUDUSD suffered heavy losses today after the RBA decided to remain on hold, with the broader picture pointing to a near-term downtrend that may be poised to extend to lower levels.
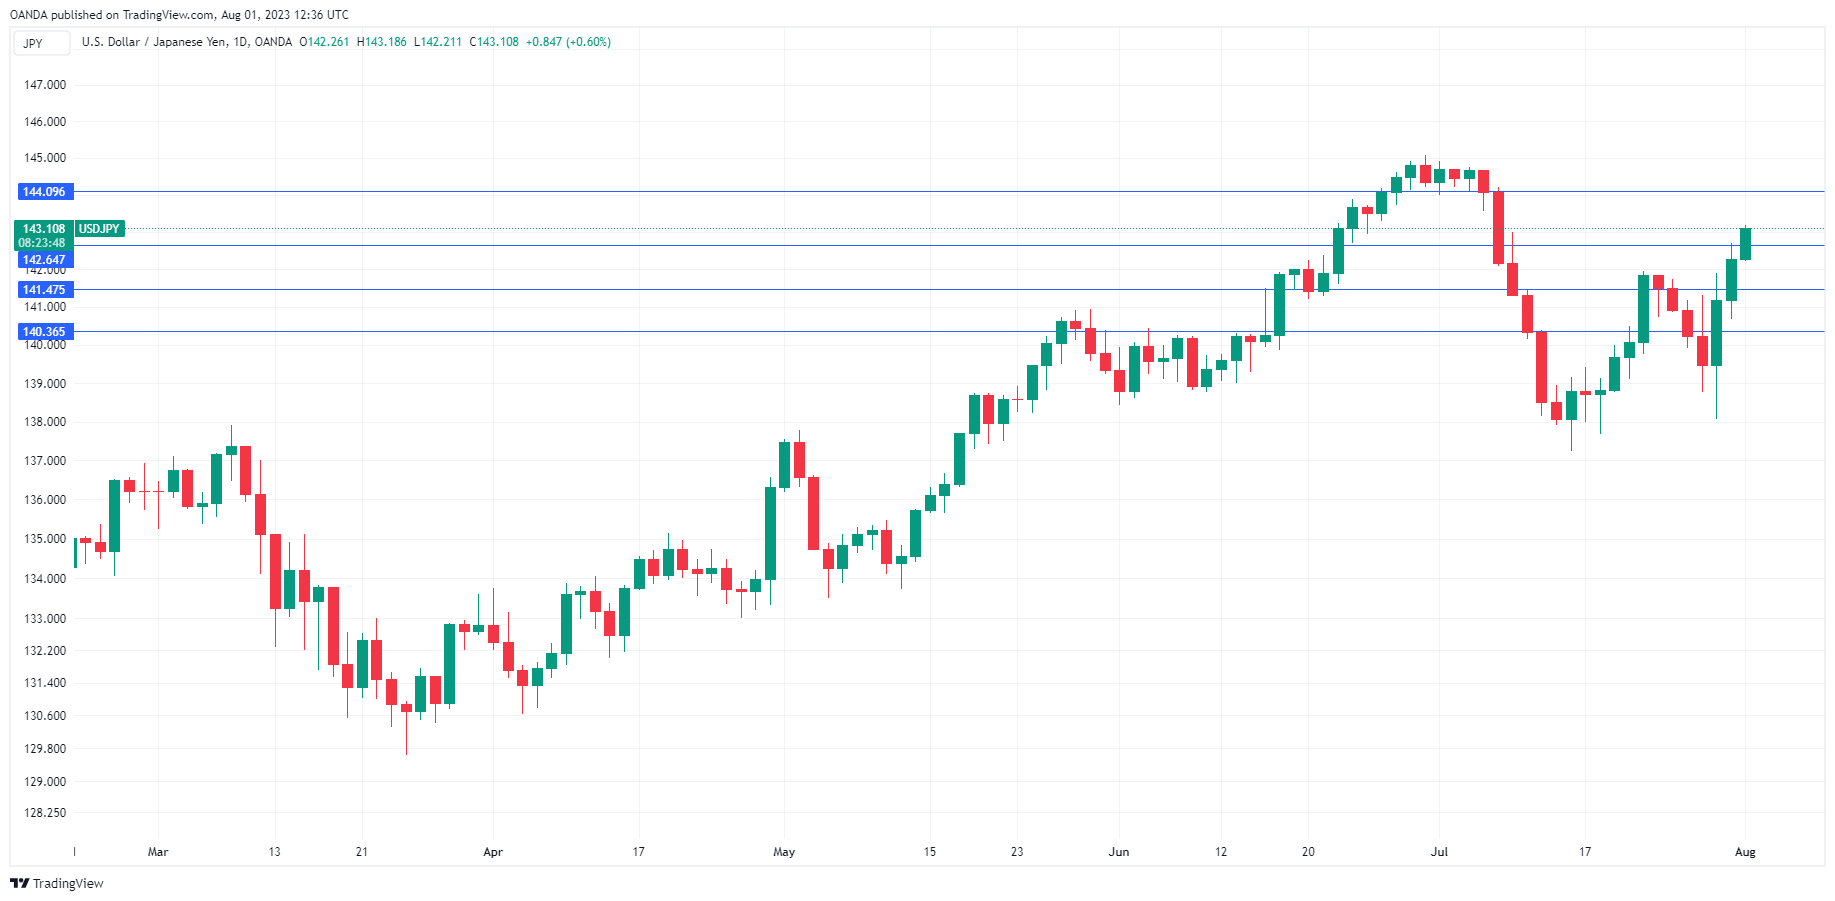
Japanese Yen Extends Losses Against Dollar
The Japanese yen continues to slide and is down 1.41% this week. In Tuesday’s European session, USD/JPY is trading at 143.16, up 0.64%.
Dollar/yen powers above 143
The yen continues to lose ground against the US dollar. Earlier in the day, the yen weakened to 143.18, its weakest level against the US dollar since July 7th. The yen has plunged 370 basis points since Friday when the Bank of Japan stunned the markets and tweaked its yield control (YCC) policy.
The Bank of Japan has loosened its YCC and this has sent the yen sharply lower. The BoJ had set a rigid cap of 0.50% yields on 10-year government bonds but has turned that cap into a yardstick, saying it would offer to purchase JGBs at 1%. The 10-year yield rose has risen to a multi-year high of 0.61% and there is a strong possibility of the yield continuing to rise.
The BoJ has been an outlier of central banks, sticking to its policy of negative rates. True, inflation in Japan is much lower than in other developed economies, but there is growing criticism that this policy is outdated and the central bank needs to take further steps toward normalization. Governor Ueda stressed on Friday that the YCC tweak was not a move towards normalization and we’re unlikely to see any tightening from the BoJ unless inflation moves significantly higher.

In the US, ISM Manufacturing PMI is today’s key release. The manufacturing sector remains in the doldrums and has been in decline since October, with readings below the 50.0 level. Demand has been weak and production has been declining due to the lack of orders. In June, the Manufacturing PMI slipped to 46.0, the lowest level since May 2020. Another decline is expected for July, with a consensus estimate of 46.8 points.
USD/JPY Technical
- USD/JPY has pushed above resistance at 142.63. Above, there is resistance at 144.09
- There is support at 141.47 and 140.35
EUR/USD Mid-Day Outlook
Daily Pivots: (S1) 1.0979; (P) 1.1012; (R1) 1.1031; More...
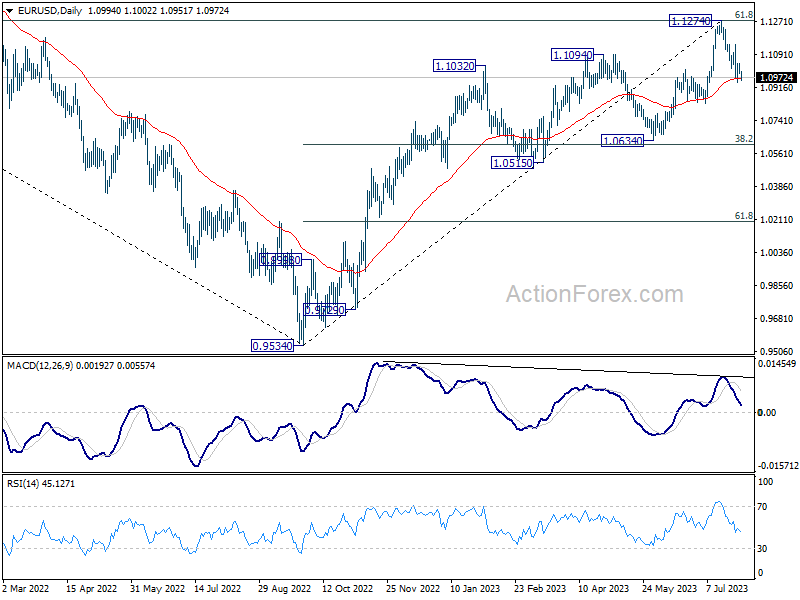
EUR/USD is still staying above 1.0942 temporary low and intraday bias remains neutral. Further fall is expected as long as 1.1148 resistance holds. Below 1.0942 will target 1.0832 support next. Nevertheless, break of 1.1148 will argue that the decline has completed and bring retest of 1.1274 high.
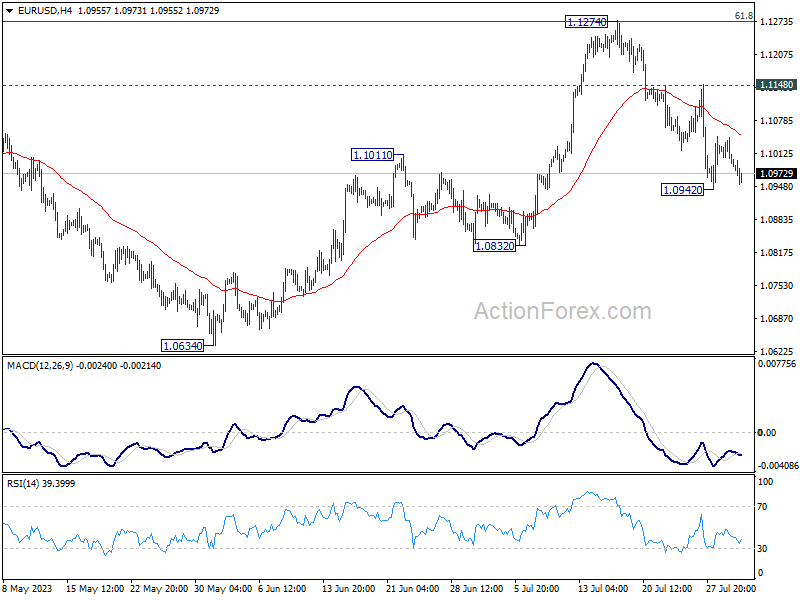
In the bigger picture, a medium term top could be formed at 1.1274, after failing to break through 61.8% retracement of 1.2348 (2021 high) to 0.9534 at 1.1273 decisively, on bearish divergence condition in D MACD. Sustained trading below 55 D EMA (now at 1.0963) will bring deeper correction to 1.0634 cluster support (38.2% retracement of 0.9534 to 1.1274 at 1.0609). Strong support could be seen there, at least on first attempt, to set the range for consolidation.
USD/CHF Mid-Day Outlook
Daily Pivots: (S1) 0.8679; (P) 0.8705; (R1) 0.8743; More....
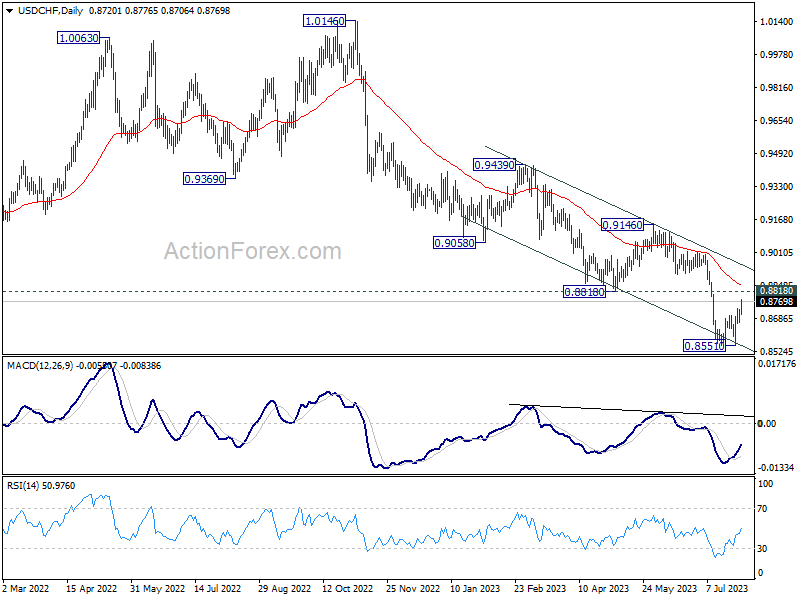
USD/CHF's rebound from 0.8551 continues today and intraday bias stays on the upside. Strong resistance could be seen from 0.8818 support turned resistance to complete the recovery. Below 0.8663 minor support will turn bias back to the downside for retesting 0.8551. However, decisive break of 0.8818 will carry larger bullish implication and target 0.9146.
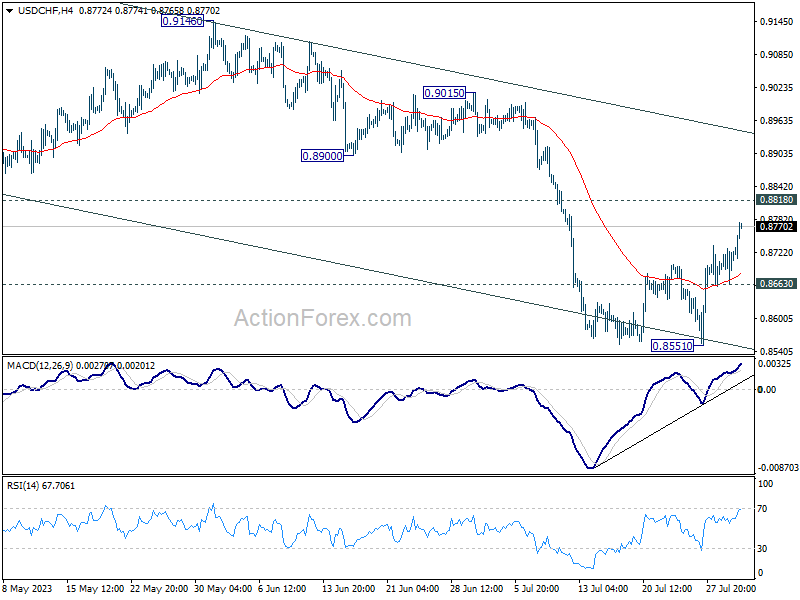
In the bigger picture, down trend from 1.0146 is seen as in progress as long as 0.8188 support turned resistance holds. Next target is 61.8% retracement of 0.7065 (2011 low) to 1.0342 (2016 high) at 0.8317. However, sustained break of 0.8818 will be the first sign of medium term bottoming, and turn focus back to 0.9146 resistance for confirmation.