Sample Category Title
GBP/USD Turns At Risk of Further Declines
Key Highlights
- GBP/USD started a downside correction below the 1.2950 support.
- It traded below a major bullish trend line with support near 1.2850 on the 4-hour chart.
- Crude oil prices climbed further higher above the $77.20 resistance.
- The UK Manufacturing PMI declined further from 46.5 to 45 in July 2023 (Prelim).
GBP/USD Technical Analysis
The British Pound struggled to clear the 1.3150 resistance against the US Dollar. GBP/USD started a downside correction below the 1.3000 and 1.2950 support levels.
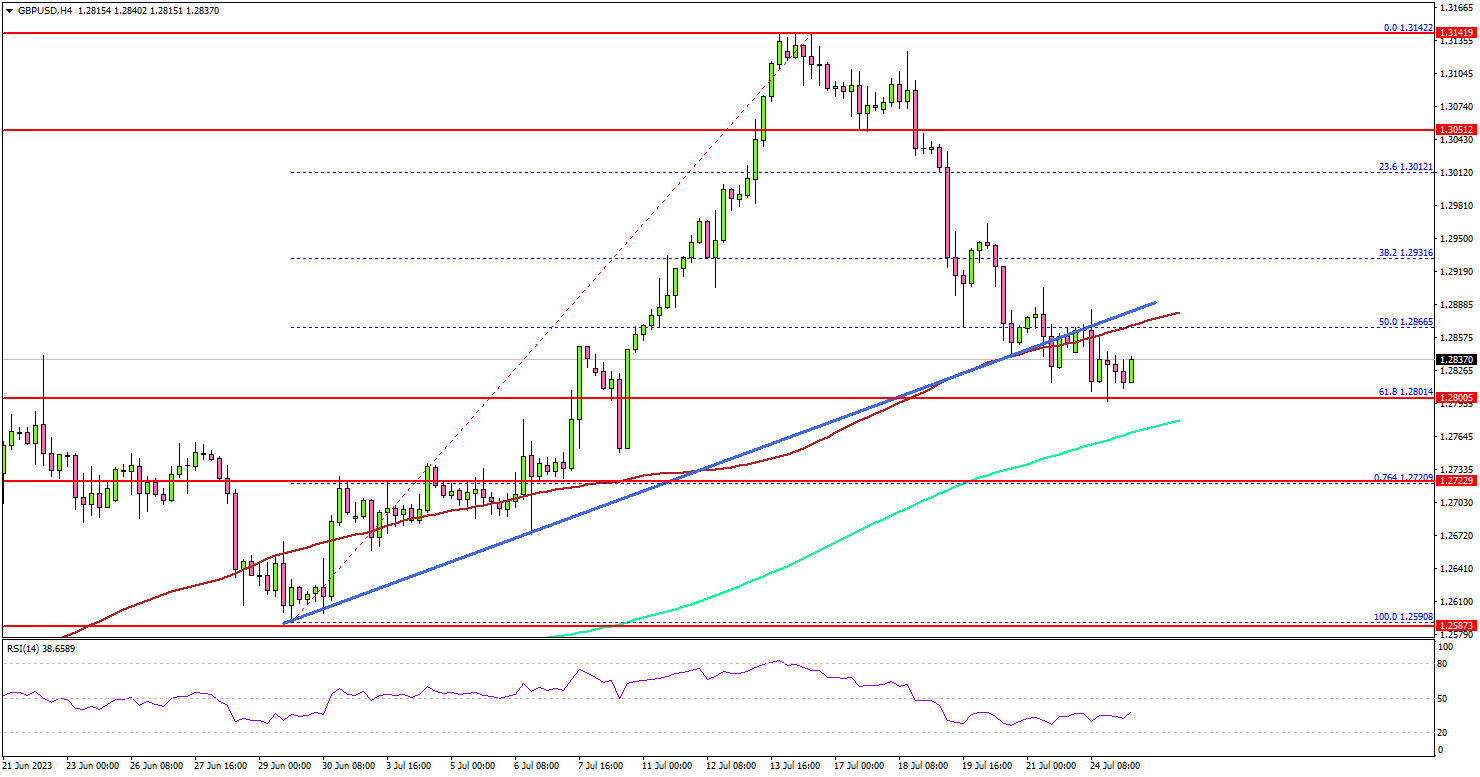
Looking at the 4-hour chart, the pair traded below a major bullish trend line with support near 1.2850. There was a move below the 50% Fib retracement level of the upward move from the 1.2590 swing low to the 1.3142 high.
The pair settled below the 100 simple moving average (red, 4 hours). However, the bulls are now protecting the 1.2800 support and the 61.8% Fib retracement level of the upward move from the 1.2590 swing low to the 1.3142 high.
The next major support is near the 200 simple moving average (green, 4 hours), below which GBP/USD could slide toward the 1.2600 zone.
On the upside, the pair might face resistance near the 1.2865 level and the 100 simple moving average (red, 4 hours). The next resistance is near the 1.2940 level. Any more gains might send the pair toward the 1.3000 level.
Looking at crude oil prices, there was a steady increase above $76.50 and the bulls seem to be aiming for a move toward $80.
Economic Releases
- US Housing Price Index for May 2023 (MoM) - Forecast +0.2%, versus +0.7% previous.
GBPCAD Wave Analysis
- GBPCAD reversed from major resistance level 1.7310
- Likely to fall to support level 1.6600
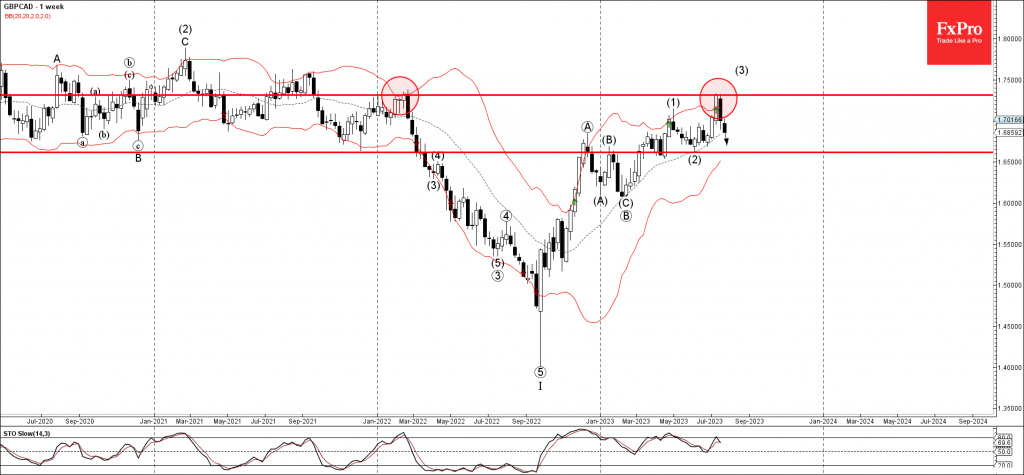
GBPCAD currency pair recently reversed down from the major resistance level 1.7310, previous yearly high from last year – standing above the upper weekly Bollinger Band.
The downward reversal from the resistance level 1.7310 stopped the previous intermediate impulse wave (3).
Given the strongly bullish CAD sentiment seen today, GBPCAD can be expected to fall further toward the next support level 1.6600 (low of the previous correction (2)).
EURNZD Wave Analysis
- EURNZD reversed from resistance level 1.8000
- Likely to fall to support level 1.7800
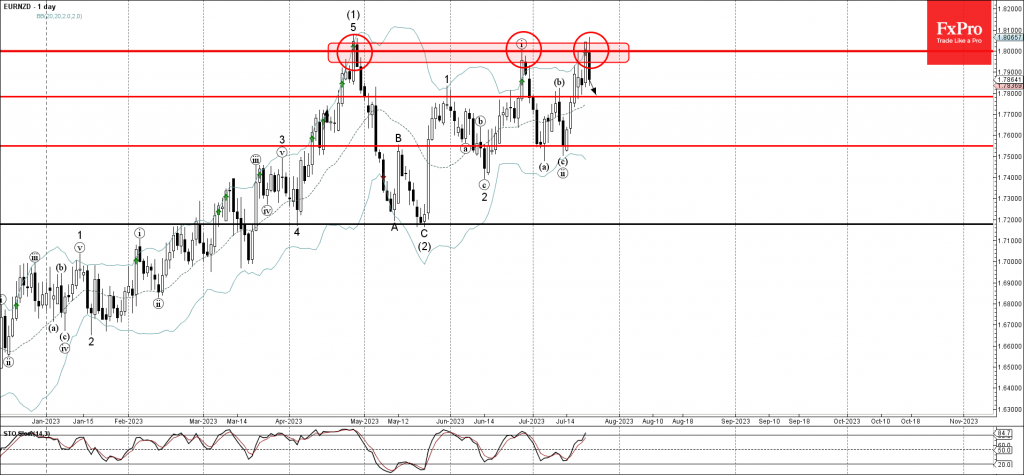
EURNZD recently reversed up from round resistance level 1.8000, which has been reversing the price from the end of April.
The downward reversal from the resistance level 1.8000 is likely to form the daily Japanese candlesticks reversal pattern Bearish Engulfing – strong sell signal for EURNZD.
Given the strength of the resistance level 1.8000 and the overbought daily Stochastic, EURNZD can be expected to fall further toward the next support level 1.7800.
ECB Preview – All Eyes on September Guidance
A 25bp rate hike from the ECB this week is essentially a given. This outcome has been well communicated in advance by most members, and should not in itself lead to any noticeable market reaction.
The focus will be on guidance ahead of the September meeting, where a pause or more definite stop to the rate hikes are on the table. The communication dilemma that ECB face is a trade-off between the lagged effect of monetary policy measures already taken and the strength of the incoming data. Therefore we do no expect a firm guidance for September, either for a pause or a hike, but a repeat of data dependence and in particular in light of the significant amount of data released before the September meeting.
The weakening growth momentum, as well as some softening in core inflation measures will be the decisive for a potential final hike of 25bp at the September meeting. Further deterioration may change our baseline expectation of a final hike in September.
Markets price 25bp for this week and another 20bp to a 3.95% peak in the deposit rate. We find that pricing fair.
EUR/USD and USD/JPY in Focus Post Flash PMIs; Bitcoin Falls Below $29.5k
It was surprisingly a busy weekend as Spain delivered a close national election, Barbie showed us the economy is still partying, Chevron reported impressive earnings, and as expectations turn downbeat for China to deliver significant stimulus this week.
Despite all the headlines, overnight both S&P 500 futures and the dollar were mostly little changed until the release of the flash PMIs.
EUR/USD tumbles after weak eurozone PMI data
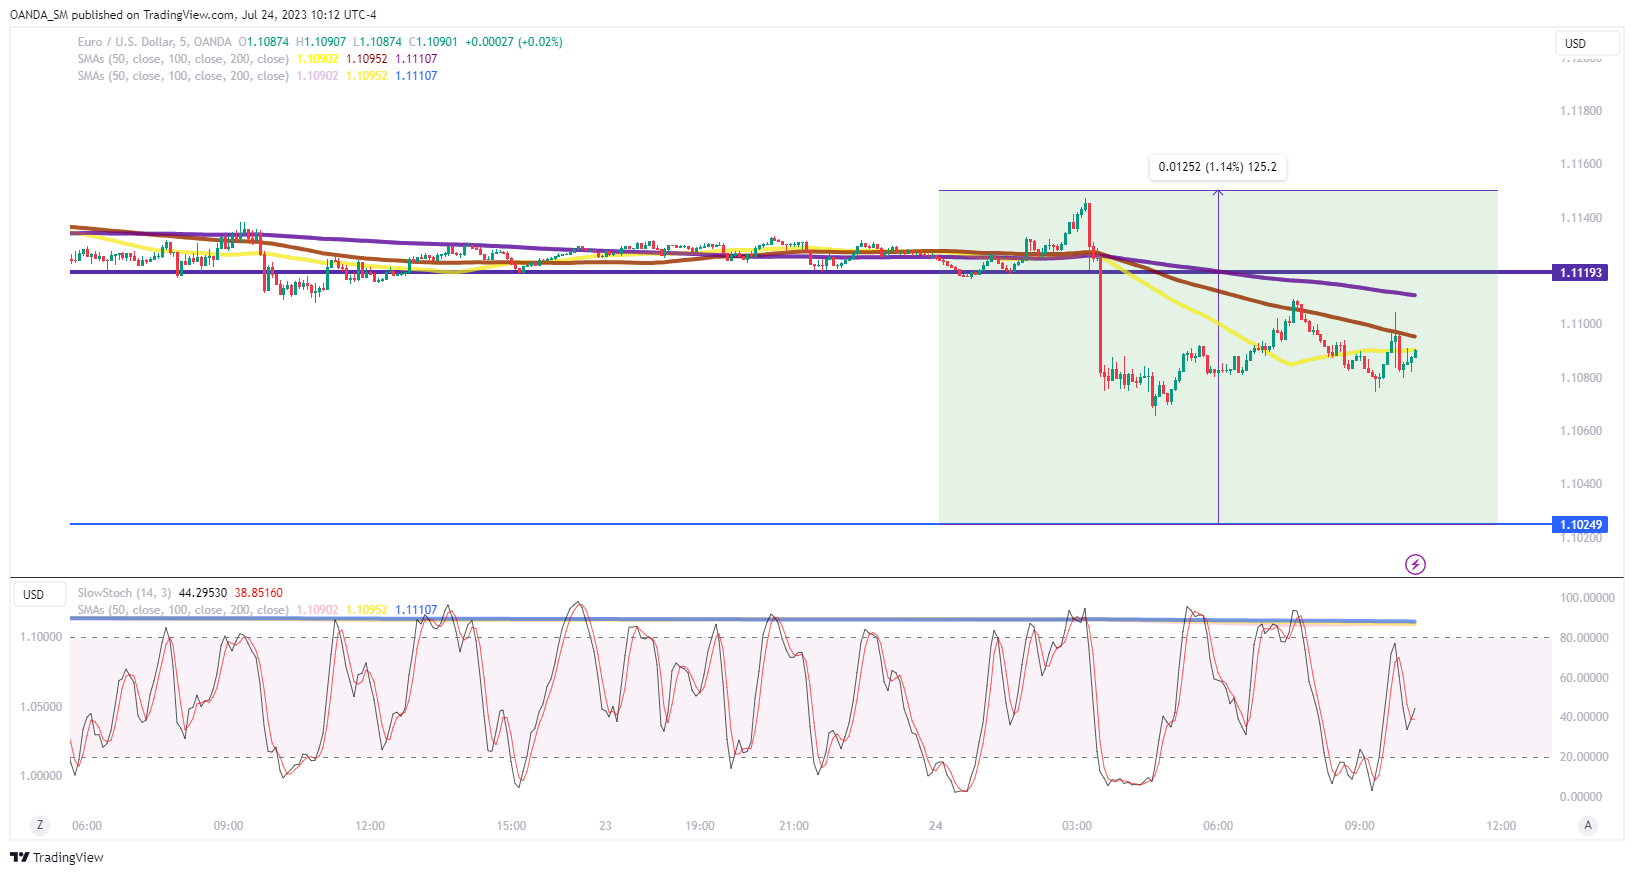
The euro declined below the 1.1120 level against the dollar after European PMI data disappointed across the board. It didn’t matter if you looked at eurozone manufacturing or service data, it was all ugly. One of the reasons why the euro didn’t fall further has been the recent string of optimism being reflected by European firms. Despite all the complicated macro backdrop and disappointing Chinese recovery, so far most EU companies aren’t too overly downbeat with the outlook.
Sterling softened too but not as much as the services PMI remained in expansion territory and as manufacturing activity only fell a point more than forecast.
The US dollar held onto its gains against both the euro and the pound after the US flash PMI showed the world’s largest economy is hanging in there. The service sector softened more than expected, but manufacturing surprisingly rebounded almost back to expansion territory. A global slowdown is clearly not here, but expectations remain for the US economy to gradually weaken. Until we see the labor market weaken significantly, that should keep the risk of more Fed tightening on the table beyond this week.
The potential bearish butterfly reversal pattern that was identified last week is still intact. If EUR/USD bearish momentum remains, key support might target the 1.1025 level. Given this is a massive macro week, price might enter its pre-central bank trading ranges, which could see consolidation between 1.1050 and 1.1150.
USD/JPY starts looking a little bullish heading into both the Fed and BOJ meetings
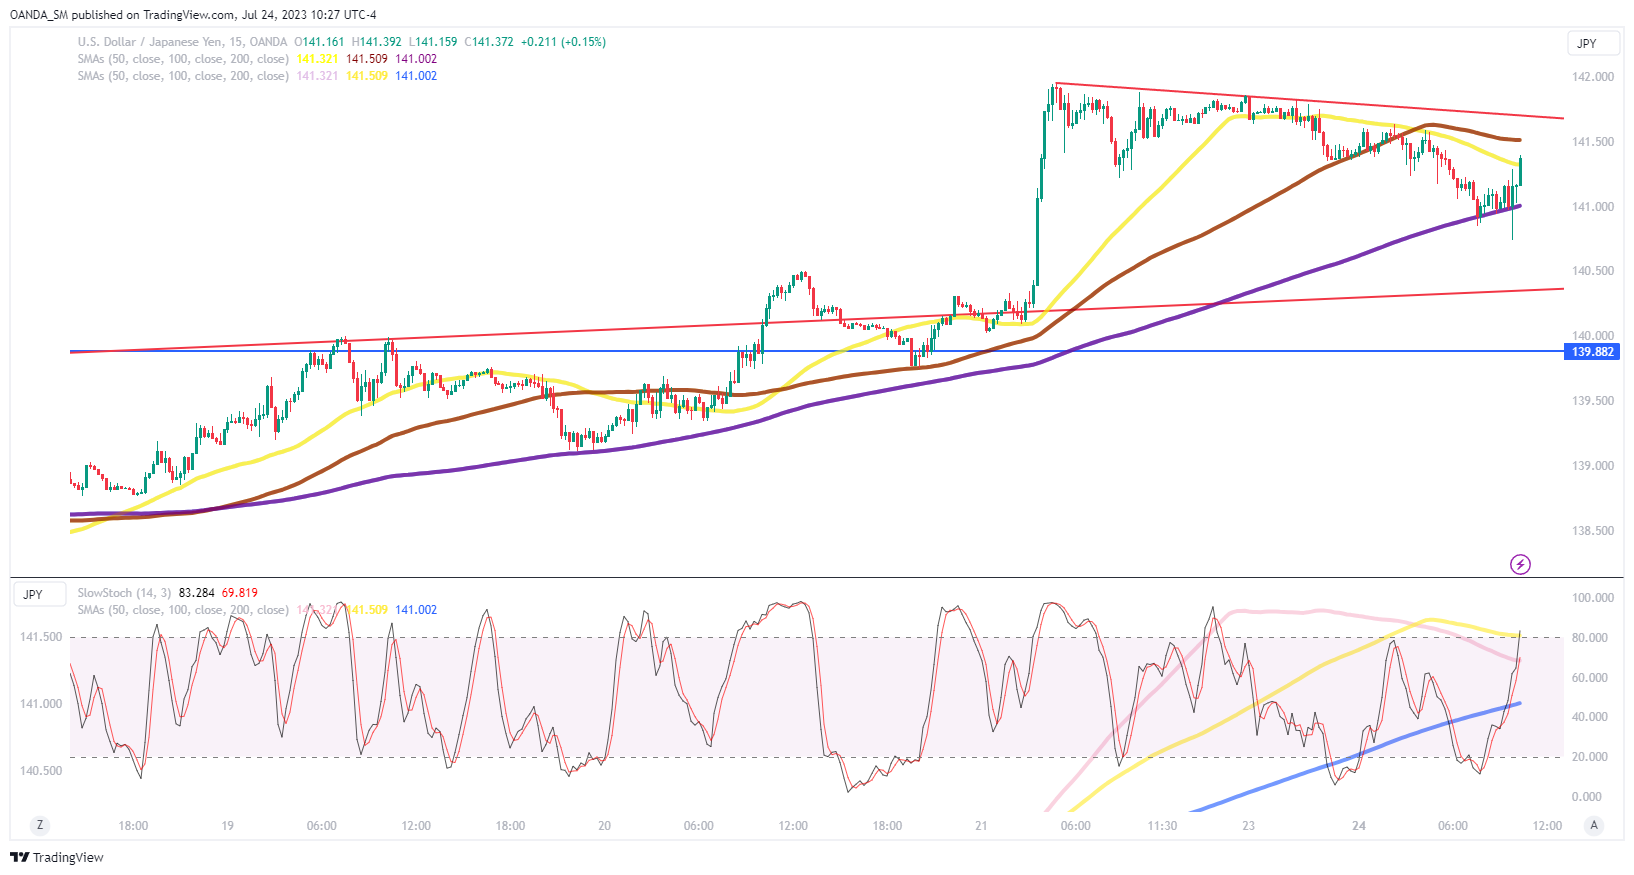
Heading into this week, macro traders are expecting the Fed to signal that the downtrend with core inflation could support a one-and-done approach by the Fed, or at least a very long pause. Given how risk appetite has been fairly intact for US equities, it seems traders are counting on a rather dovish monetary stance by the Fed.
The BOJ will be interesting as the majority of analysts expect no major shifts, but a slight upgrade with their price forecasts. Hours before the BOJ decision, the Tokyo inflation report is expected to show core pricing pressures softened to the lowest levels seen since last summer. However, if the Fed decision ends up not being as dovish as expected and if Tokyo’s inflation report comes in hot, BOJ Governor Ueda might decide a tweak in Yield Curve Control is warranted. Ueda has been careful in signaling that more stimulus is needed, but a tweak could be justified on Friday.
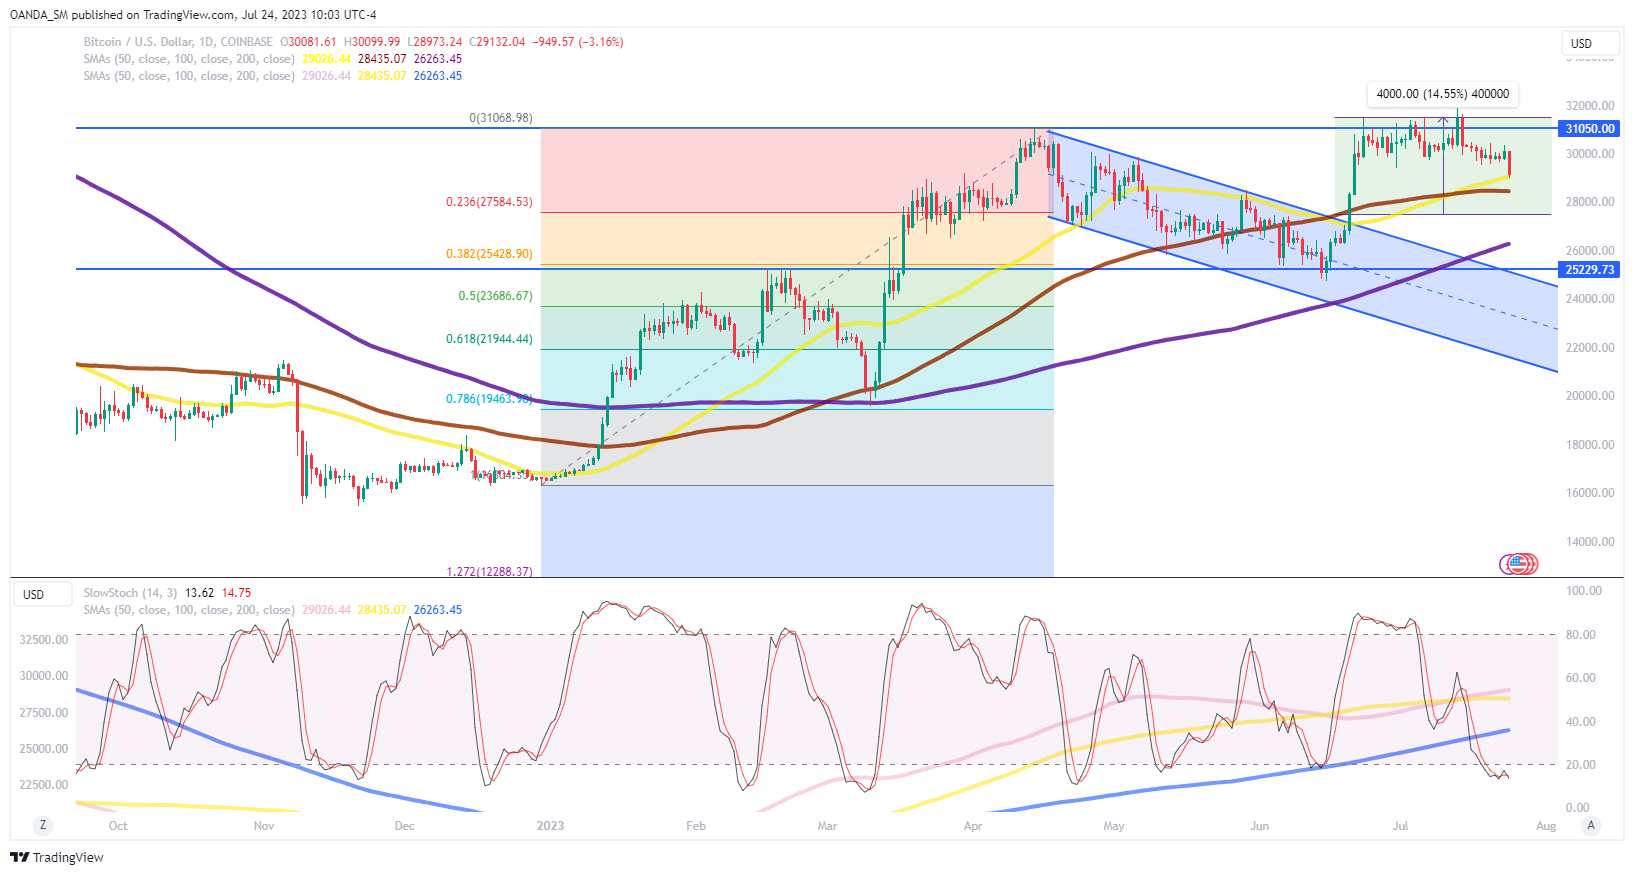
Crypto – Bitcoin breaks below $29.5k
Bitcoin’s consolidating trading has seen price action reside closer to the lower boundaries as volatility disappears. Short-term support from the $29,500 level broke this early this morning and if bearish momentum builds, key support could target the $27,500 region. The crypto news flow has been uninspiring, with many traders focusing on OPENAI’s Sam Altman’s Worldcoin crypto project. It will take a fresh catalyst to excite Bitcoin traders and right now it seems the price action is destined for a broadening formation, potentially targeting the $27,500 and $31,500 zone.
EUR/CHF: Hits a Multi-month Low as Weakening Business Activity Warn of Recession
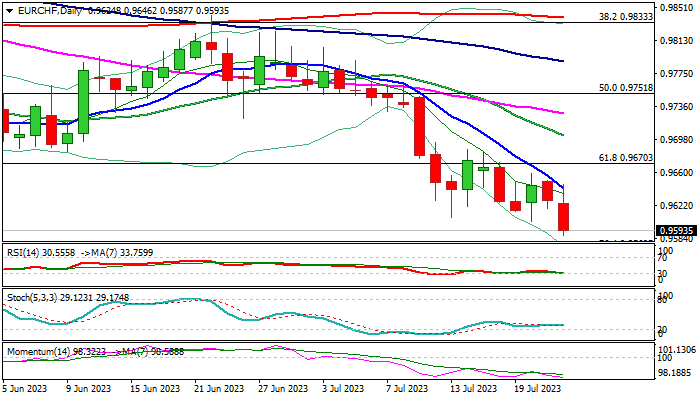
EURCHF fell to the lowest since late September on Monday, after weaker than expected German/French/EU PMI’s in July sparked fresh acceleration lower.
Bears broke through lower base at 0.9605 zone, with close below this support to verify bearish signal for attack on nearby Fibo support at 0.9569 (76.4% of 0.9406/1.0097 advance, loss of which would open way towards 2022 low at 0.9406.
Firmly bearish daily studies support the action, adding to negative sentiment on weaker than expected business activity, which raises fears that Euro bloc will slip back into recession.
Weak data also point to strong negative impact from high interest rates, as the ECB meets on Thursday and expected to deliver another 25 basis points hike, in its continuous fight with inflation, despite the economic damage which tightening could cause.
Traders will also focus on signals the central bank will send about their near-future steps, with encouraging signals from easing of price pressures, though inflation is still 2.5 times above target, which is expected to keep the ECB highly alerted, but also pressured by two opposite forces.
Falling 10DMA (0.9641), which tracks the downtrend in more than three weeks, marks pivotal barrier which should cap upside attempts and keep bears fully in play.
Res: 0.9641; 0.9670; 0.9686; 0.9702.
Sup: 0.9569; 0.9531; 0.9465; 0.9406.
Crude Oil Market Relies on Demand
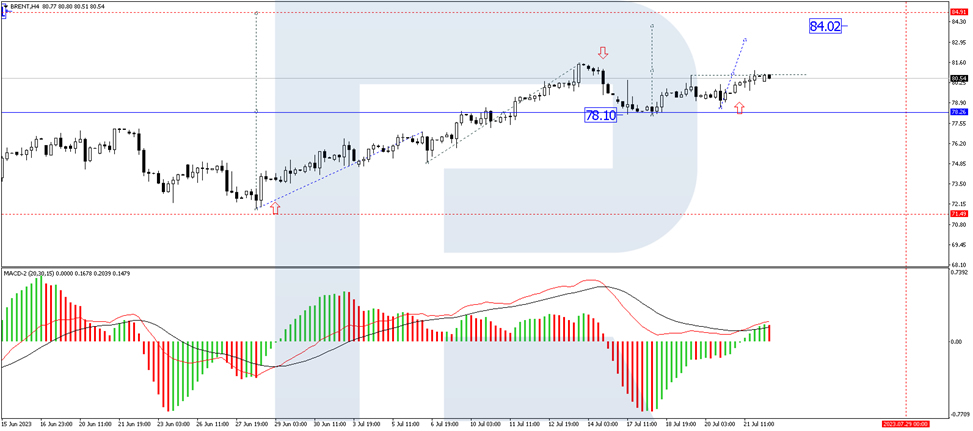
As the new week in July kicks off, the commodities market is in high spirits. The price of Brent crude oil has surged to 81.00 USD per barrel. The oil sector is responding to rising global tensions, which may have adverse effects on the supply of energy resources. However, demand expectations are stable, and are driving prices upward.
There are growing concerns about the potential displacement of a portion of biofuels by oil and its derivatives, particularly amidst complications with the extension of the "grain deal." This further supports the upward trend in commodity prices.
According to Baker Hughes data, drilling activity in the US has decreased. The number of oil rigs fell by 7 units to 530, and the number of gas rigs decreased by 2 units to 131.
Technical Analysis of the Brent oil price chart:
On the H4 chart, Brent is currently developing a third wave of growth. Having reached 81.40 USD, a consolidation range is expected to form just below this level. A breakout above this range would likely lead to the continuation of the upward wave, targeting 81.81 USD. Surpassing this level could open the potential for further growth towards 84.00 USD, with the possibility of continuing the upward trend to 85.00 USD. Technically, the MACD indicator confirms this scenario; with its signal line above the zero mark, it is showing a clear upward direction, indicating potential new highs.
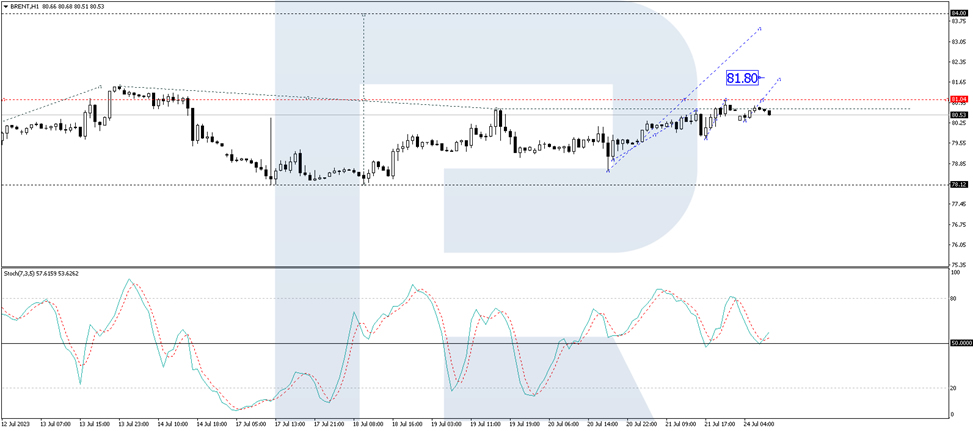
On the H1 chart, Brent completed an upward wave to 81.04 USD, followed by a correction to 80.30 USD. After the correction, an upward wave is anticipated to begin targeting 81.80 USD. This target is local. Technically, the Stochastic oscillator also supports this outlook, with its signal line above the 50 mark, indicating a readiness to continue rising towards the 80 mark.
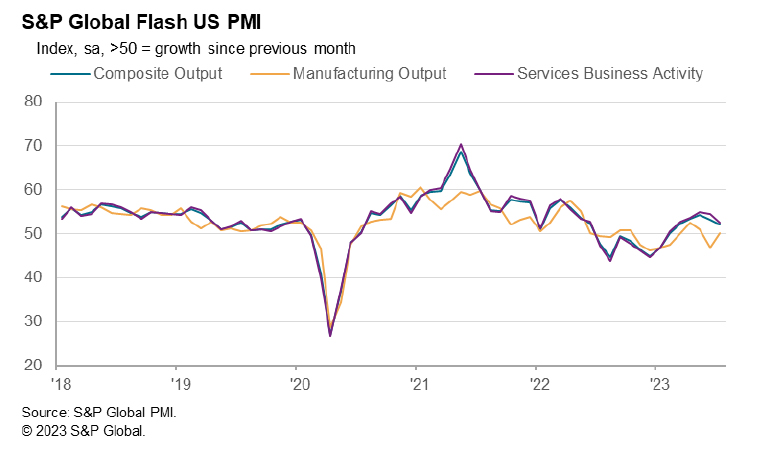
US PMI manufacturing rose to 49, services down to 52.4
US PMI Manufacturing rose from 46.3 to 49.0 in July. PMI Services dropped from 54.4 to 52.4. PMI Composite dropped from 53.2 to 52.0, a 5-month low.
Chris Williamson, Chief Business Economist at S&P Global Market Intelligence said:
"July is seeing an unwelcome combination of slower economic growth, weaker job creation, gloomier business confidence and sticky inflation.
"The overall rate of output growth, measured across manufacturing and services, is consistent with GDP expanding at an annualized quarterly rate of approximately 1.5% at the start of the third quarter. That's down from a 2% pace signalled by the survey in the second quarter.
"However, growth is being entirely driven by the service sector, and in particular rising spend from international clients, which is helping offset a becalmed manufacturing sector and increasingly subdued demand from US households and businesses.
"Furthermore, business optimism about the year-ahead outlook has deteriorated sharply to the lowest seen so far this year. The darkening picture adds downside risks to output growth in the coming months which, alongside the slowing in the pace of expansion in July, will keep alive fear that the US economy may yet succumb to another downturn before the year is out.
"The stickiness of price pressures meanwhile remains a major concern. As the survey index of selling prices has acted as a reliable leading indicator of consumer price inflation, anticipating the easing to 3% in June, it sends a worrying signal that further falls in the rate of inflation below 3% may prove elusive in the near term."
Euro Retreats Inside Uptrend on Weak PMIs
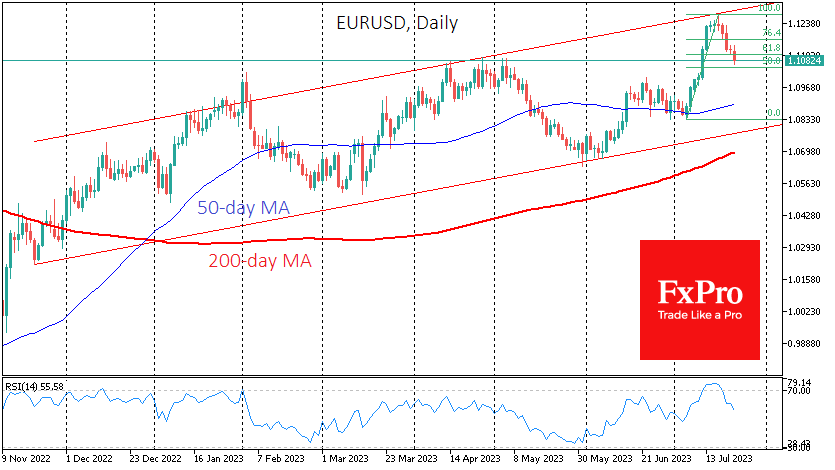
The single currency fell against the Dollar on Monday, dropping to 1.1070 following the release of weak economic data. After losing for five consecutive sessions, the EURUSD has given back almost half of its gains from the 6th to the 18th, and the pair’s further momentum will largely depend on comments from the ECB and the Fed in the second half of the week.
Preliminary estimates of the July PMI business activity indices triggered a fresh wave of disappointment and selling in the single currency, as they were painfully weaker than expected. The composite index for France fell to 46.6 from 47.2 the previous month, against expectations for a rise to 47.8. The indicator points to the sharpest contraction in business activity since November 2020.
The situation is similar in Germany. There, the composite index fell from 50.6 to 48.3, marking a shift from expansion to contraction, while the average forecast pointed to a correction to 50.3 (weak growth).
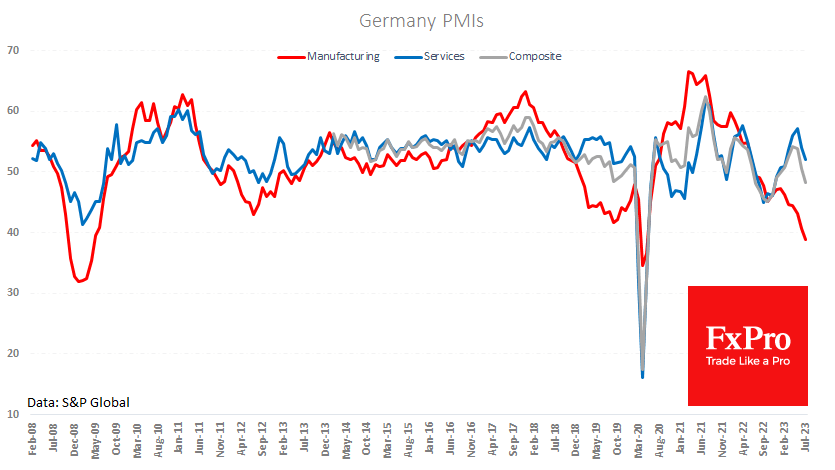
In the euro area, the Manufacturing PMI fell to 42.7 from 43.4 the previous month and against expectations of 43.5. Excluding the coronavirus shock, the index was only lower between October 2008 and June 2009. But the central bank was cutting interest rates sharply at that time to support the economy and boost inflation. Nowadays, despite the alarming signals from the economy, the ECB continues to see the fight against inflation as its most important task.
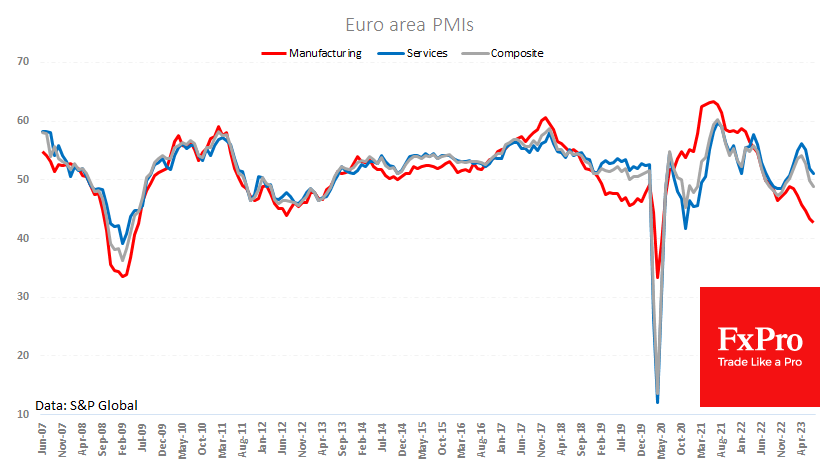
Historical experience suggests that the current policies of the major central banks are justified in the long term but carry the risk of excessive pressure on the economy in the short term. The sell-off in the euro, which began immediately after the French data and intensified after the German data, suggests a reassessment of the outlook for monetary policy.
Speculators are probably rushing to bet that the ECB will be forced to soften its hawkish stance on further policy tightening, which is immediately bearish for the euro. However, investors and traders should remember that the ECB has been methodically tightening in recent months as the economic outlook for the region has weakened.
Technically, the euro’s decline is a retreat from the upper boundary of the ascending channel in which the pair has been trading since last November and a correction after accumulated overbought conditions on the daily timeframe. Potential targets for the bears are 1.0900, near the 50-day moving average, and 1.0850, the area of previous lows and the channel’s lower boundary. Only a break below this level will allow us to discuss a long-term uptrend change.
At the same time, it cannot be ruled out that the pair will stay above 1.1050, turning the local extremes of April and May into solid support.