Sample Category Title
EURUSD Backs Off After New 2023 High
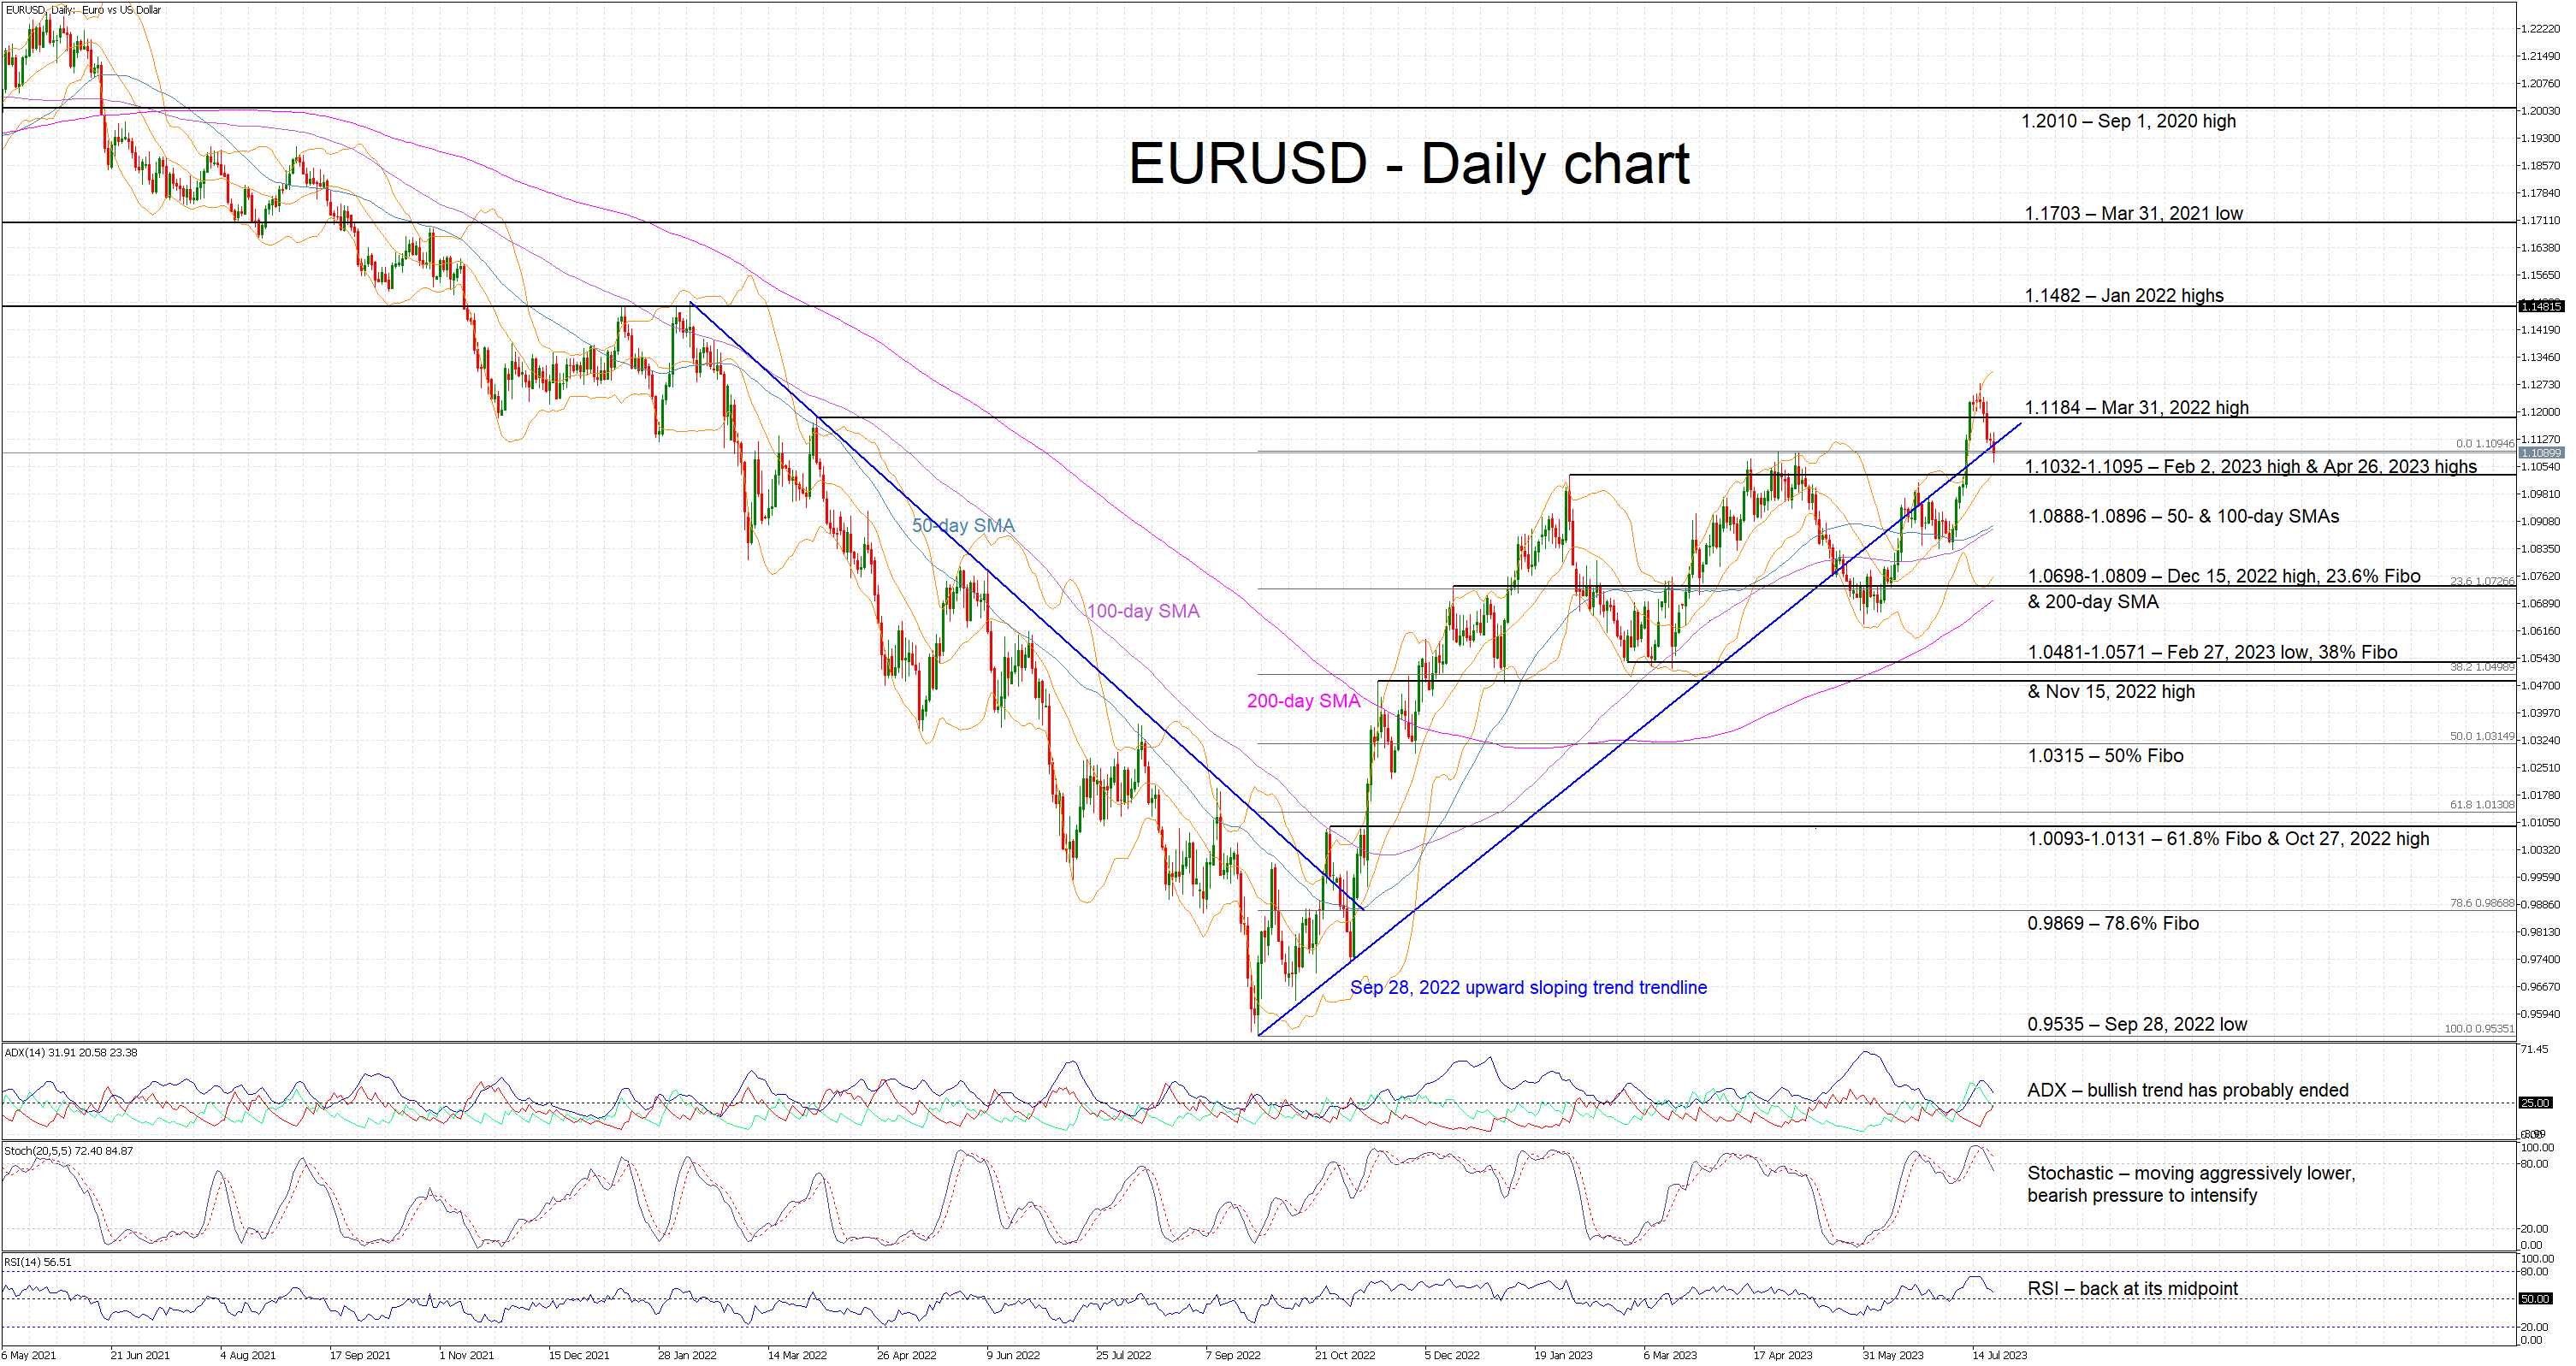
EURUSD has been on a downward path since registering on July 18 a new 2023 high, which is also the highest print since February 25, 2022. Seven consecutive red candles reveal the euro bulls’ inability to hold onto the impressive gains recorded during the first half of July. In addition, the convergence of the 50- and 100-day simple moving averages (SMAs) could be seen as a sign that the elevated market volatility is not close to abating soon.
In the meantime, the Average Directional Movement Index (ADX) is dropping aggressively towards its 25-threshold and thus confirming the end of the recent bullish move, and the RSI is again trading a tad above its midpoint. More interestingly, the stochastic oscillator is moving lower in a vertical fashion and building a good gap from its moving average. A continuation of this move and, particularly a drop below the latest stochastic’s trough would be considered a stronger bearish signal.
Should the bears feel energized by the latest drop, they would aim for a move below the busy 1.1032-1.1095 range that is populated by the February 2, 2023 and April 26, 2023 highs respectively. They could then have a go at the 1.0888-1.0896 area. This appears to be a strong support region as it is defined by the 50- and 100-day SMAs. Even lower, the path remains tricky with the next key area coming at the 1.0698-1.0809 range.
On the flip side, the bulls are anxiously trying to set up their defense and regain market control. If they manage to keep EURUSD above the September 28, 2022 upward sloping trend trendline, they might feel confident in breaking the March 31, 2022 high at 1.1184, and then have the chance of recording a new 2023 high above the current high of 1.1275.
To conclude, EURUSD bears are on a mission, but they need to clear some key levels and get some help from the momentum indicators in order to reverse the medium-term bullish trend.
How Will Reporting Season Affect US Indices?
Earnings season is a crucial time for investors and analysts, as it provides insights into how well companies have performed over the past quarter and gives indications of their future earnings. In 2023, expectations for US Q1 earnings were low due to economic challenges and rising interest rates. Surprisingly, many companies beat these low expectations, with 75% of S&P 500 companies surpassing forecasts. However, despite the positive results, share prices haven't rallied, partly due to macroeconomic events like stress on the US banking sector and sticky inflation.
Analysts predict a bottoming out of US earnings in the middle of the year, with potential recovery towards the end of 2023. Consumer spending remains positive, and if inflation eases and interest rates stabilize future earnings seasons could show a more positive outlook.
US100 - W1 Timeframe
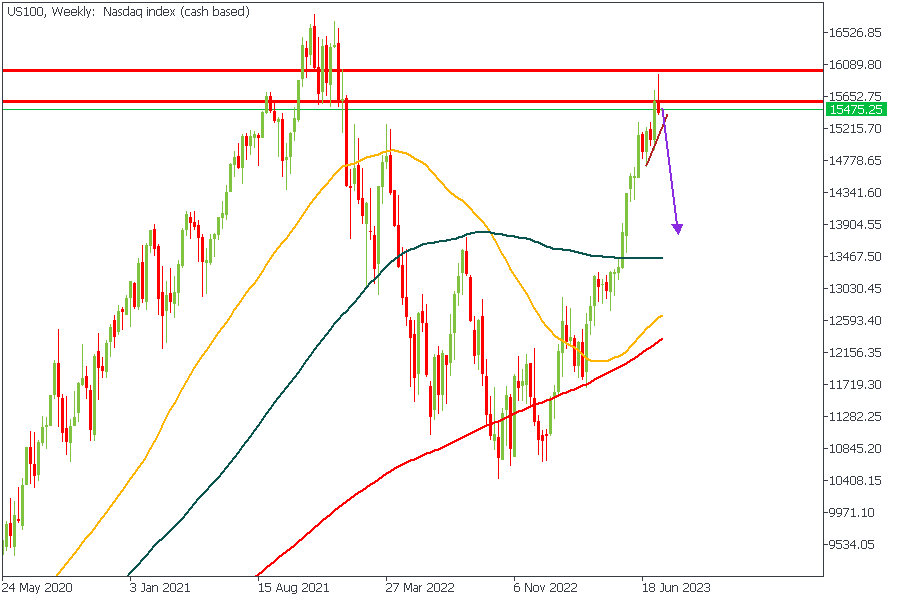
US100 on the weekly timeframe has reacted from the pivot zone with an interesting close to the previous week - a pin bar candlestick pattern. Considering that the 50-period moving average is also currently below the 100-period moving average, and the pivot zone falls around 78% of the Fibonacci retracement of the previous drop, I am actively searching for selling opportunities to trade towards the retest of the 100-period moving average.
Analyst’s Expectations:
- Direction: Bearish
- Target: 13809.06
- Invalidation: 15808.39
US500 - W1 Timeframe
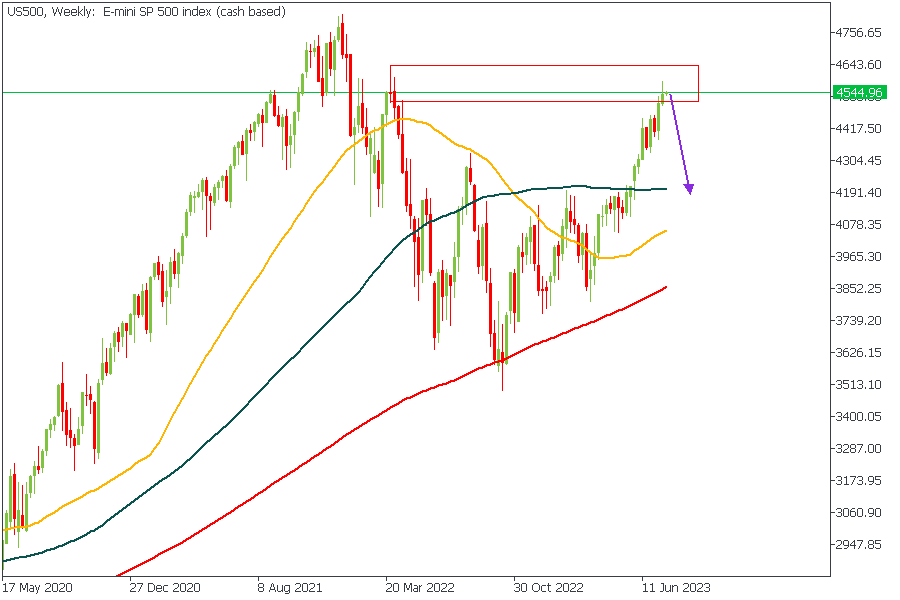
US500 is sleek; the price is at a rally-base-drop supply zone around the 88% Fibonacci retracement of the previous drop, and the 50-period moving average is below the 100-period moving average. This suggests that the drop will continue from there, with the 100-period moving average as its likely target.
Analyst’s Expectations:
- Direction: Bearish
- Target: 4232.30
- Invalidation: 4615.15
CONCLUSION
The trading of CFDs comes at a risk. Thus, to succeed, you have to manage risks properly. To avoid costly mistakes while you look to trade these opportunities, be sure to do your due diligence and manage your risk appropriately.
GBP/USD Revisits Support While USD/CAD Regains Strength
GBP/USD is trading near the 1.2800 support zone. USD/CAD is rising and might gain pace above the 1.3230 resistance zone.
Important Takeaways for GBP/USD and USD/CAD Analysis Today
- The British Pound started a fresh decline from the 1.3120 resistance zone.
- There is a key bearish trend line forming with resistance near 1.2870 on the hourly chart of GBP/USD at FXOpen.
- USD/CAD is rising steadily from the 1.3120 support zone.
- There was a break above a major bearish trend line with resistance near 1.3200 on the hourly chart at FXOpen.
GBP/USD Technical Analysis
On the hourly chart of GBP/USD at FXOpen, the pair started a fresh decline from the 1.3120 zone. The British Pound traded below the 1.3050 support and moved into a bearish zone against the US Dollar.
The pair even traded below 1.2970 and the 50-hour simple moving average. Finally, the bulls appeared near the 1.2815 level. A low is formed near 1.2816 and the pair is now consolidating losses. It is testing a key bearish trend line with resistance near 1.2870.
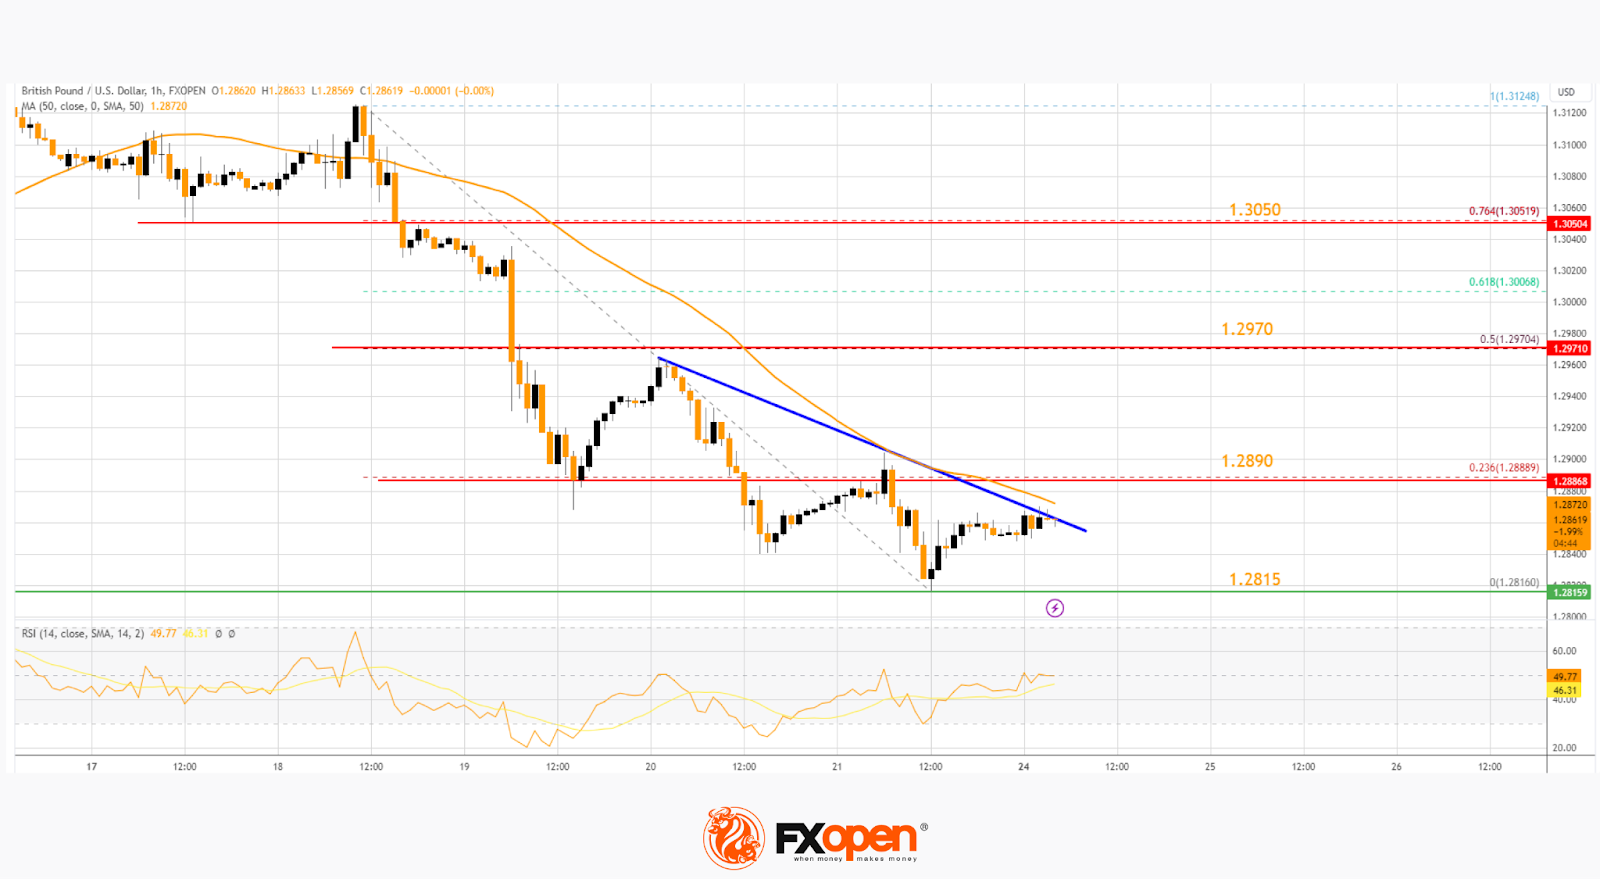
The first major resistance on the GBP/USD chart is near the 23.6% Fib retracement level of the downward move from the 1.3124 swing high to the 1.2816 low at 1.2890.
The next major resistance is near the 1.2970 level. It is close to the 50% Fib retracement level of the downward move from the 1.3124 swing high to the 1.2816 low. Any more gains could lead the pair toward the 1.3050 resistance in the near term.
Initial support sits near 1.2840. The next major support sits at 1.2815 or 1.2800, below which there is a risk of a sharp decline. In the stated case, the pair could drop toward 1.2650.
USD/CAD Technical Analysis
On the hourly chart of USD/CAD at FXOpen, the pair formed a strong support base above the 1.3120 level. The US Dollar started a decent increase above the 1.3150 resistance against the Canadian Dollar.
The pair broke above the 50-hour simple moving average and a major bearish trend line with resistance near 1.3200. It is now consolidating near the 1.3230 resistance zone. A clear upside break above 1.3230 could trigger another steady increase.
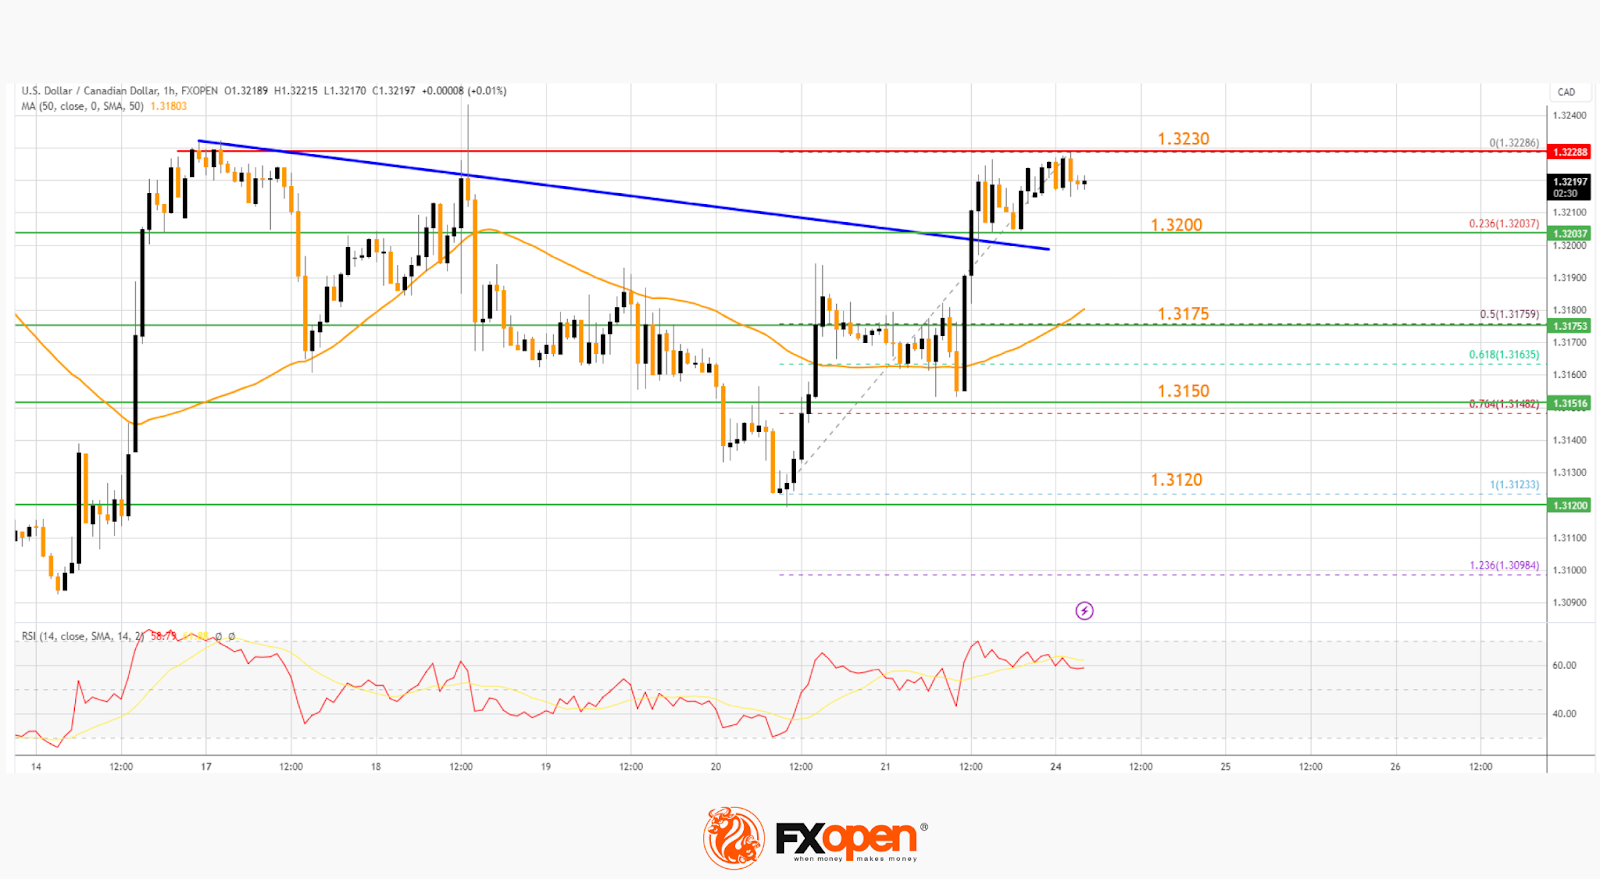
The next major resistance is the 1.3300 level. A close above it might send the pair toward the 1.3350 pivot level. Any more gains could open the doors for a test of 1.3500.
Conversely, the pair could start a downside correction. Initial support is near the 1.3200 level and the broken trend line on the same USD/CAD chart. It is close to the 23.6% Fib retracement level of the upward move from the 1.3123 swing low to the 1.3228 high.
The next major support is near the 50-hour simple moving average at 1.3175. Any more losses might send the pair toward the 76.4% Fib retracement level of the upward move from the 1.3123 swing low to the 1.3228 high at 1.3150.
A downside break below 1.3150 could push the pair further lower. The next major support is near the 1.3120 support zone, below which the pair might visit 1.3000.
Trade global forex with the Innovative Broker of 2022*. Choose from 50+ forex markets 24/5. Open your FXOpen account now or learn more about trading forex with FXOpen.
* FXOpen International, Innovative Broker of 2022, according to the IAFT
This article represents the opinion of the Companies operating under the FXOpen brand only. It is not to be construed as an offer, solicitation, or recommendation with respect to products and services provided by the Companies operating under the FXOpen brand, nor is it to be considered financial advice.
EUR/USD: Extends Pullback on Weaker than Expected EU/German Manufacturing PMI’s
EURUSD remains in red for the fifth straight day and accelerated lower on Monday morning, as weaker than expected German / EU manufacturing PMI data (hit the lowest in three years in July) further soured the sentiment.
Downbeat PMI numbers hurt expectations for rate hike in September, as the Fed is expected to raise rates by 25 basis points in the policy meeting due later this week.
Although inflation in the Eurozone dropped significantly (down to 5.5% in June from last October’s peak at 10.6%) it is still well above 2% target and requires further action from the central bank, but high borrowing cost already hurt the economy, warning of further slowdown in economic growth if the ECB opts for more aggressive approach to monetary policy.
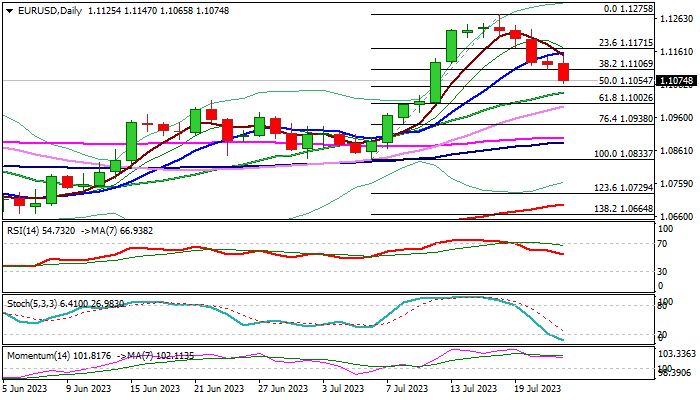
Today’s break of pivotal supports at 1.1106/00 (Fibo 38.2% of 1.0833/1.1275 / round-figure) generated fresh bearish signal for attack at next key support at 1.1054 (50% retracement / daily Kijun-sen).
Bears may face solid bids at this zone, as stochastic is deeply oversold and bullish momentum is still strong on daily chart but break here would risk test of 1.1026/1.1000 (Fibo 61.8% / psychological) violation of which to confirm reversal.
Only bounce and close above 10DMA (1.1150) would neutralize bears and signal an end of corrective phase.
Res: 1.1106; 1.1150; 1.1171; 1.1229.
Sup: 1.1054; 1.1026; 1.1000; 1.0938.
Yen Rebounds After Rough Week, US Manufacturing PMI Next
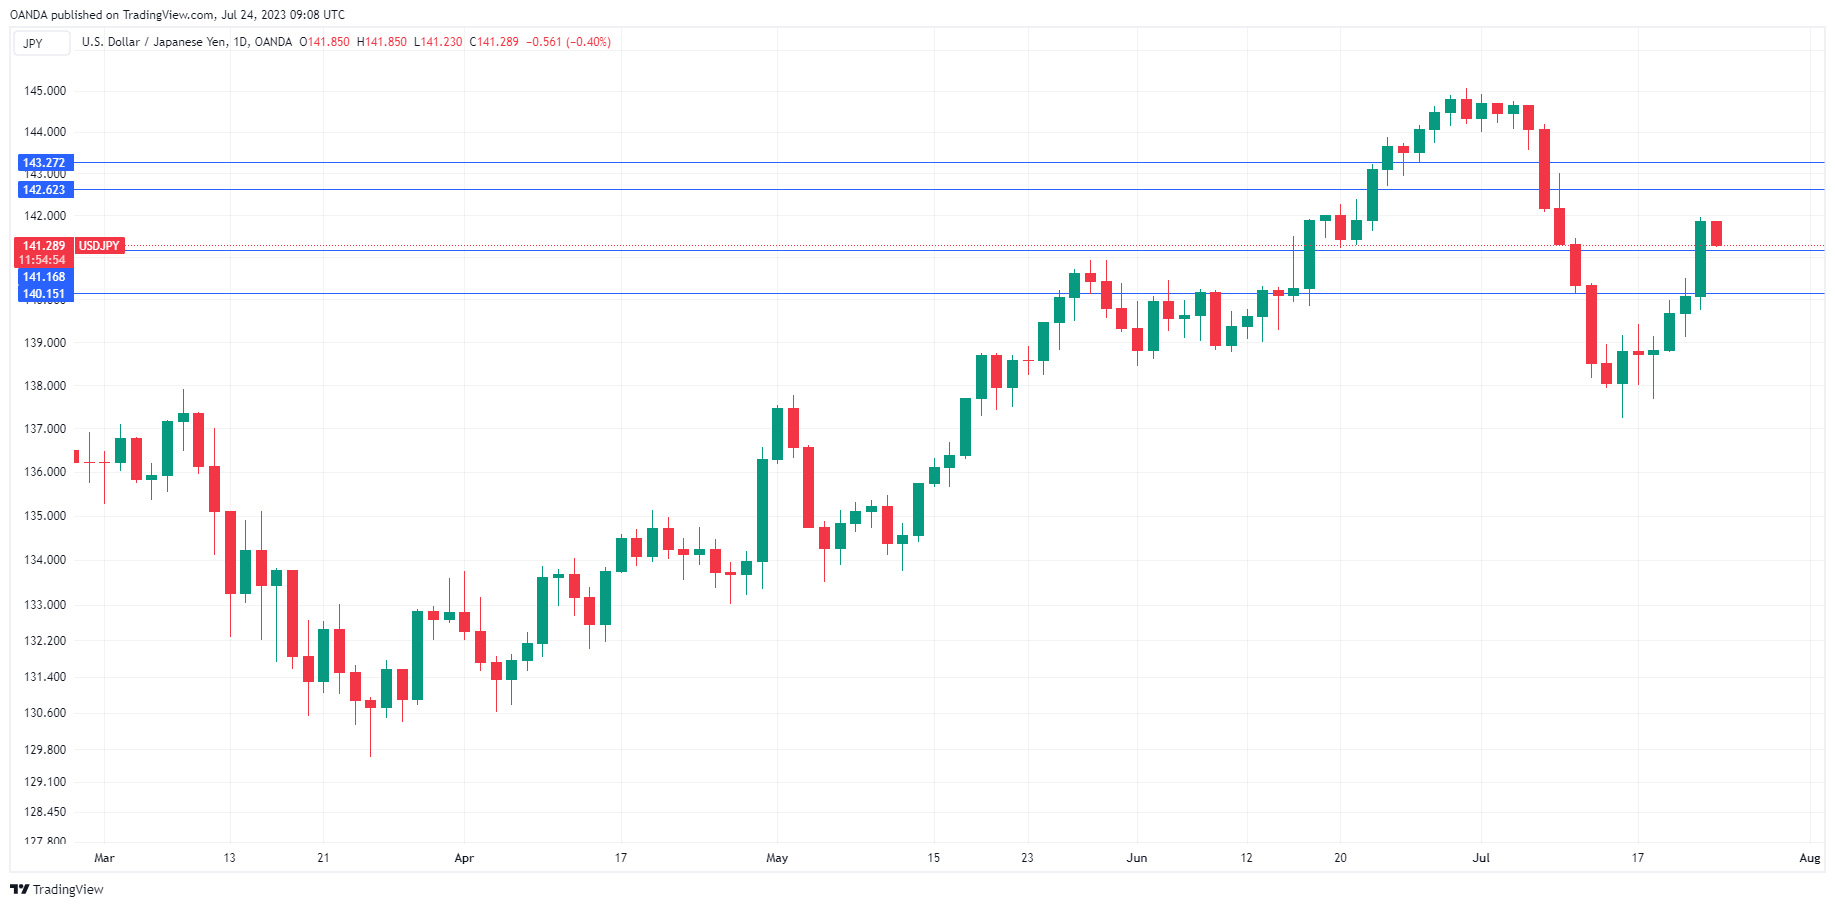
The Japanese yen has bounced back on Monday. In the European session, USD/JPY is trading at 141.27, down 0.40%. The yen declined on Friday by 1.2%, capping an awful week, with the yen falling 2.2%.
Reuters – BoJ decision could be a close call
Traders are keeping a close eye on the Bank of Japan, which holds a policy meeting on Friday. The BoJ made it to the headlines on Friday, after a Reuters report that the BoJ is leaning towards keeping its yield control policy unchanged. This was not major news, as expectations are that the BoJ will maintain current policy settings. What was noteworthy in the report was that the BoJ had not reached a consensus and the decision could be a close call.
The BoJ has insisted that inflation is temporary and there is no need to tighten policy, but with inflation at high levels, there is speculation that a shift in policy is only a question of time. Last week, Japan’s core inflation rose to 3.3%, the 15th straight time that inflation exceeded the BoJ’s target of 2%.
If the BoJ were to surprise the markets and tweak its yield control policy, the yen would likely post sharp gains. Traders will be on their toes for any developments related to the BoJ meeting, which could make it a busy week for USD/JPY.
The US starts the week with manufacturing and services PMIs. The two sectors have been moving in opposite directions, with manufacturing in decline and services showing growth. This trend is expected to continue on Monday – Manufacturing PMI is projected to inch higher to 46.4, up from 46.3, while the Services PMI is expected to rise to 54.4, up from 54.0. The 50.0 level separates contraction from expansion.
USD/JPY Technical
- USD/JPY has pushed past resistance at 1.4067 and 141.28. There is weak resistance at 142.12, followed by 142.62
- There is support at 139.68 and 138.52
Crypto Market Poised for Deeper Correction
Market picture
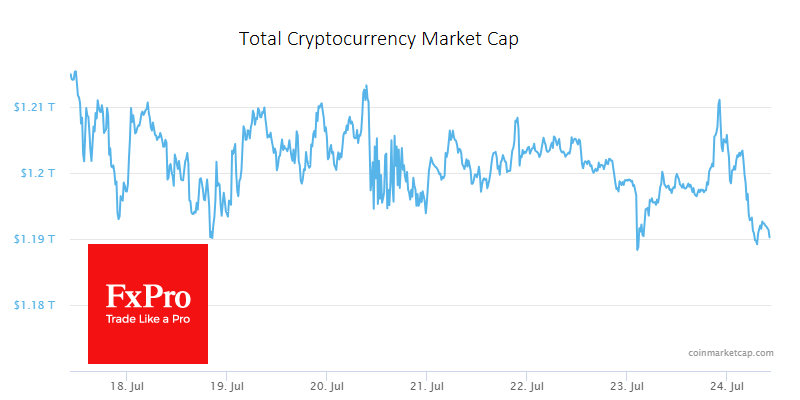
The crypto market lost 1.8% to last week’s level of $1.192 trillion, spending most of its time within the $1.190-1.210 trillion range and near its lower boundary on Monday morning. The market has found its temporary equilibrium as it awaits the decisions of three major central banks – the Fed, the ECB, and the Bank of Japan – later this week. Their actions and comments will likely complete the market consolidation and set the trend for the coming weeks.
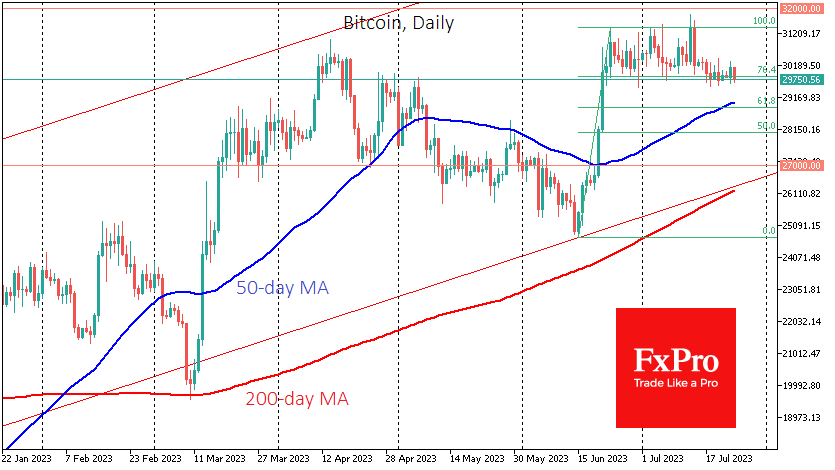
Bitcoin continues to test the lower end of the range, trading at $29.8K, but a closer look reveals a downtrend, with periods of weakness occurring at slightly lower levels. On the other hand, the bulls still manage to buy back BTCUSD on dips below $29.7K. Nevertheless, be prepared for Bitcoin to fall to $28.9K as part of a typical correction to 61.8% of the initial rise since mid-June and the 50-day MA.
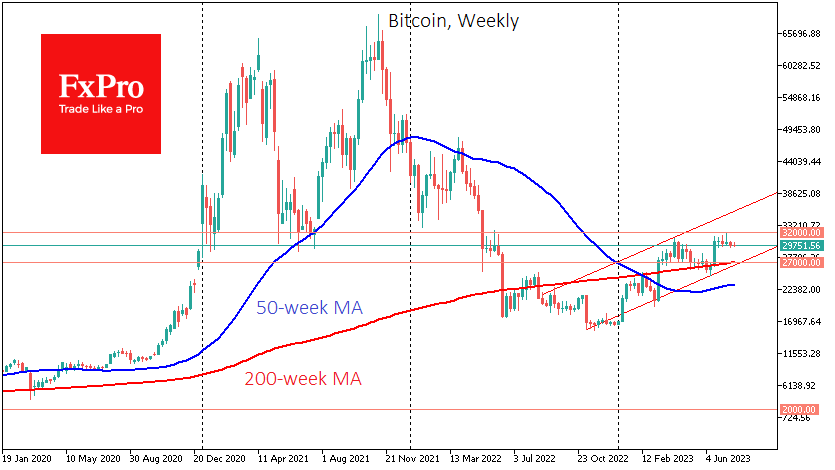
If bearish pressure intensifies, the next significant support level would be $27K, the lower boundary of the rising channel from the November lows and the 200-week moving average.
News background
Bitcoin will soon fall to almost nothing, says Spencer Schiff, a former BTC backer and son of prominent crypto critic Peter Schiff. He has become disillusioned with cryptocurrency and now believes that the most attractive projects will be those based on artificial intelligence.
Republicans in the US House of Representatives released a draft bill to regulate the digital asset industry, requiring the SEC and CFTC to develop rules.
Cryptocurrency exchange Coinbase closes its Borrow lending programme. The programme allowed customers of the largest US exchange to borrow up to $1 million against crypto assets.
MicroStrategy co-founder Michael Saylor said Argentina’s economy can only recover thanks to cryptocurrencies, especially Bitcoin. Argentina is leading the way in cryptocurrency adoption in Latin America amid high inflation.
GBP/JPY Daily Outlook
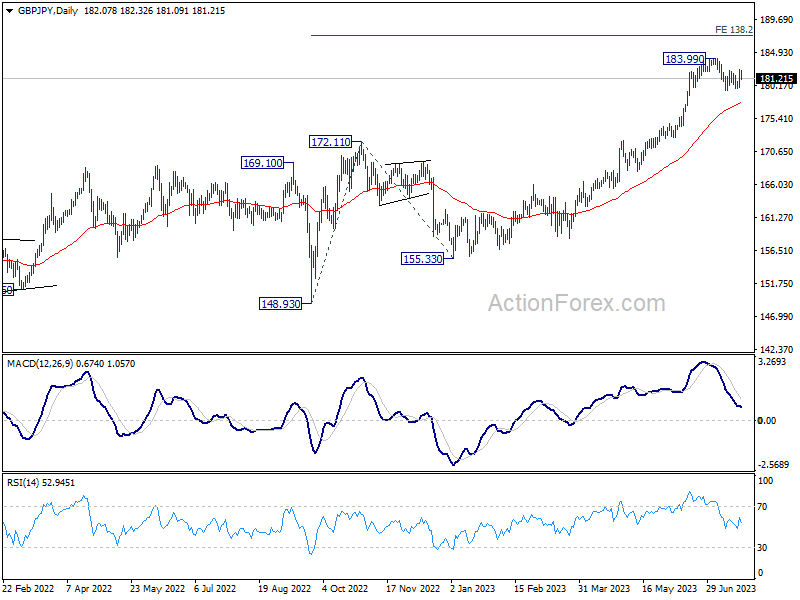
Daily Pivots: (S1) 180.61; (P) 181.57; (R1) 183.22; More...
Intraday bias in GBP/JPY remains neutral and outlook is unchanged. On the downside, break of 179.45 will resume the correction from 183.90 to 55 D EMA (now at 177.70). On the upside, firm break of 183.99 high will resume larger up trend to 187.36 projection level.
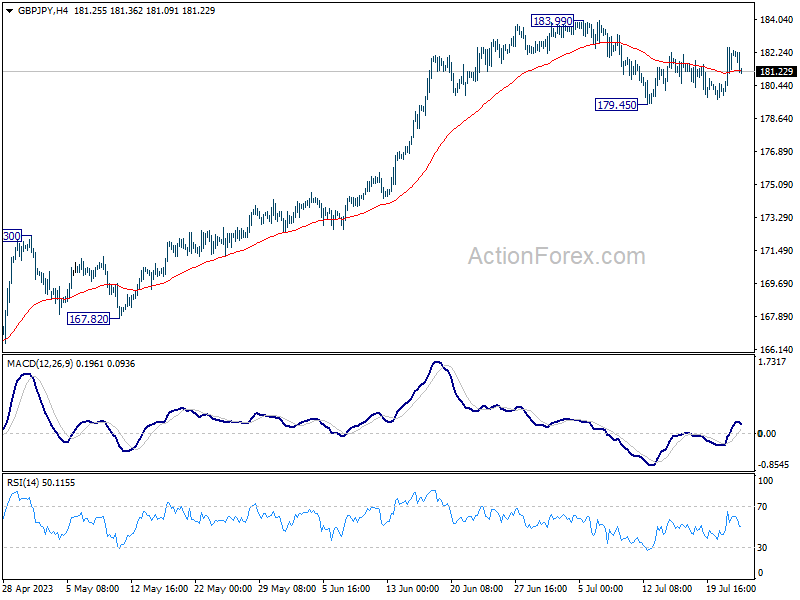
In the bigger picture, as long as 172.11 resistance turned support holds, up trend from 123.94 (2020 low) is expected to continue. On resumption, next target is 138.2% projection of 148.93 to 172.11 from 155.33 at 187.36, and then 195.86 (2015 high). Nevertheless, firm break of 172.11 will argue that larger correction is already underway.
EUR/JPY Daily Outlook
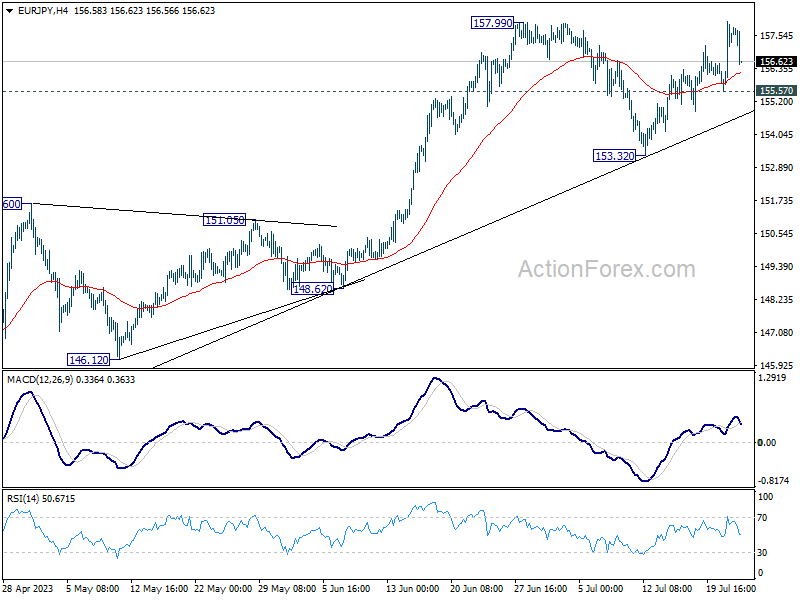
Daily Pivots: (S1) 156.21; (P) 157.12; (R1) 158.66; More....
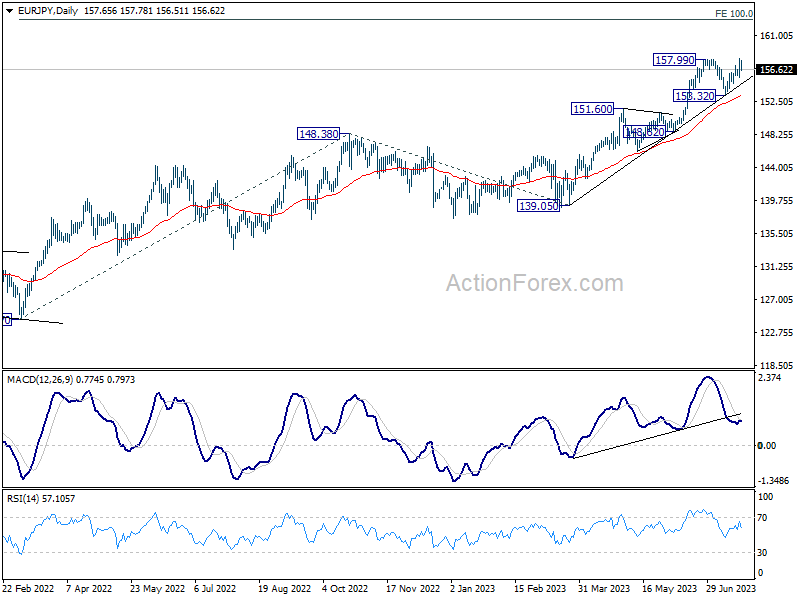
Intraday bias in EUR/JPY stays neutral as it retreated after failing to break through 157.99 high decisive break. On the upside, sustained break of 157.99 will confirm resumption of larger up trend, and target 162.82 projection level next. Nevertheless, break of 155.57 minor support will bring deeper decline to extend the corrective pattern from 157.99.
In the bigger picture, as long as 151.60 resistance turned support holds, rise from 114.42 (2020 low) is in progress. On resumption, next target is 100% projection of 124.37 to 148.38 from 138.81 at 162.82. Nevertheless, sustained break of 151.60 will argue that larger correction is already underway.
EUR/GBP Daily Outlook
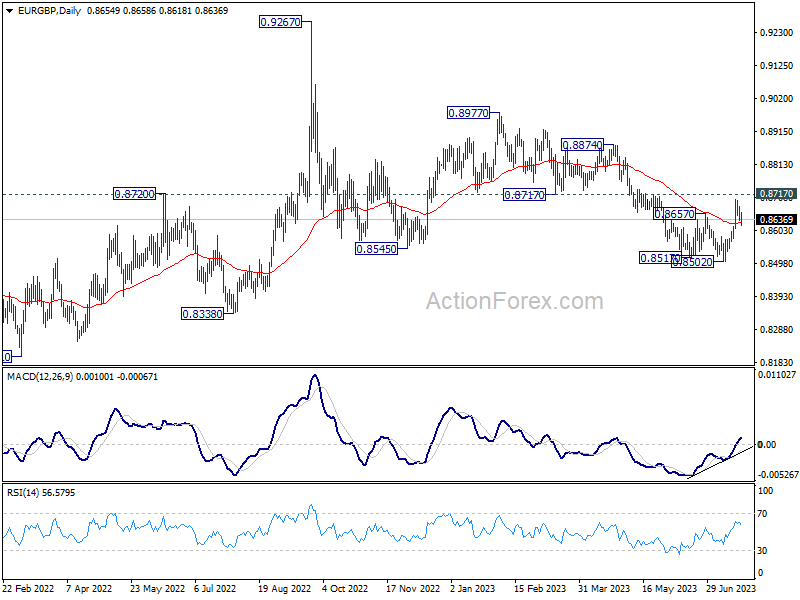
Daily Pivots: (S1) 0.8633; (P) 0.8657; (R1) 0.8679; More...
Intraday bias in EUR/GBP stays neutral and further rally is expected with 0.8619 minor support intact. On the upside, decisive break of 0.8717 support turned resistance will solidify that fall from 0.8977 has completed a five-wave decline. Further rally should then be seen to 0.8977 resistance next. On the downside, though, below 0.8619 minor support will mix up the outlook and turn bias back to the downside for retesting 0.8502 low.
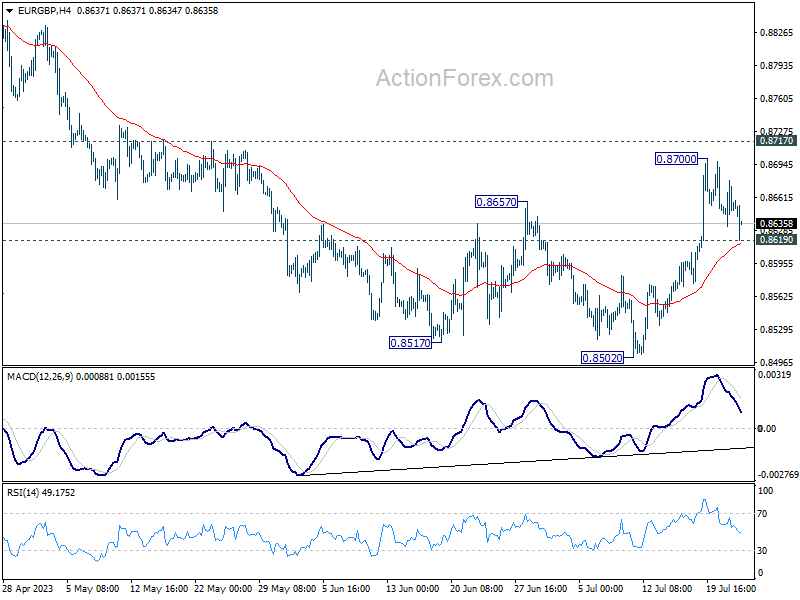
In the bigger picture, the down trend from 0.9267 (2022 high) is seen as part of the long term range pattern from 0.9499 (2020 high). Firm break of 0.8717 support turned resistance will argue that it has completed with three waves down to 0.8502. Further break of 0.8977 will bring retest of 0.9267 high. Nevertheless, break of 0.8502 will resume the decline towards 0.8201 (2022 low).
EUR/AUD Daily Outlook
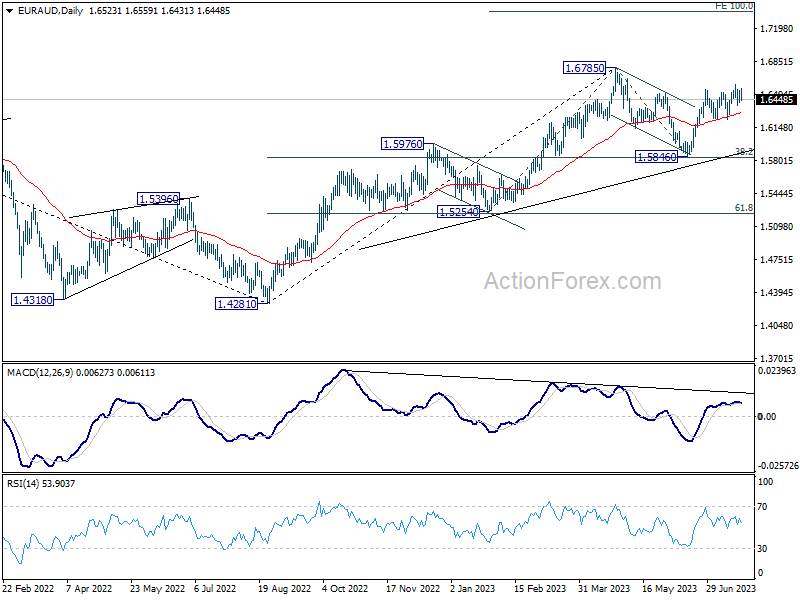
Daily Pivots: (S1) 1.6446; (P) 1.6493; (R1) 1.6574; More...
Intraday bias in EUR/AUD stays neutral at this point, for consolidation below 1.6601. Near term outlook stays cautiously bullish as long as 1.6231 support holds. On the upside, break of 1.6601 will target 1.6785 high next. However, firm break of 1.6231 will bring deeper fall to extend the corrective pattern from 1.6785.
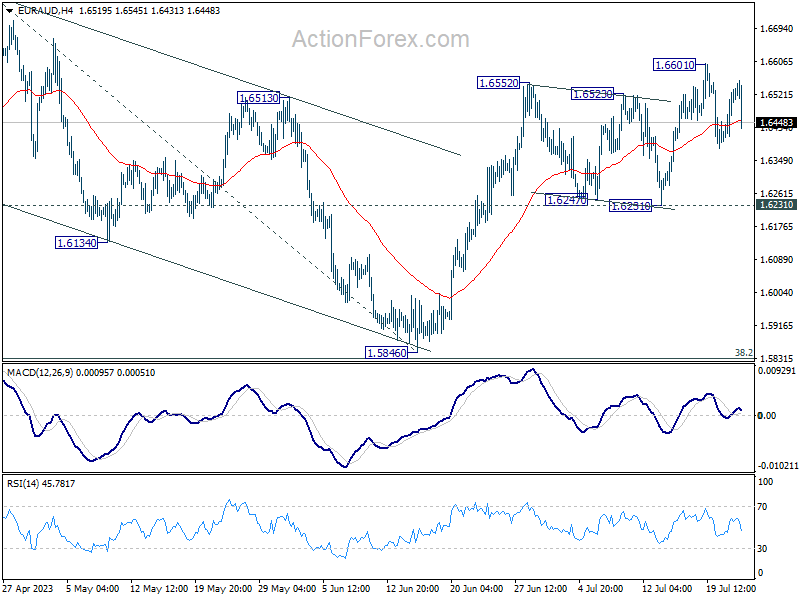
In the bigger picture, with 38.2% retracement of 1.4281 to 1.6785 at 1.5828 intact, rally from 1.4281 is still in progress. Firm break of 1.6785 will confirm rise resumption. Next target is 100% projection of 1.5254 to 1.6785 from 1.5846 at 1.7377. On the other hand, rejection by 1.6785 will extend the corrective pattern with another fall leg. But outlook will stay bullish as long as 1.5828 holds.