Sample Category Title
Forex and Cryptocurrencies Forecast
EUR/USD: Awaiting the Federal Reserve and ECB Meetings
When the DXY Dollar Index dropped to April 2022 levels (99.65) on July 14, many market participants concluded that the best days for the American currency were over. Inflation is nearing target levels, and in order not to suffocate the economy, the Federal Reserve will soon initiate a campaign to ease its monetary policy. However, things aren't that straightforward. After reaching a peak of 1.1275 on Tuesday, July 18, the EUR/USD pair reversed and started to decline.
In general, against the backdrop of weak macroeconomic reports coming from the United States, the dollar could have given up a few dozen or even a couple of hundred points to the euro. Industrial production in the country is falling for the second month in a row, with a 0.5% decrease in June. Retail sales, expected to grow by 0.5%, only increased by 0.2% (a 0.5% increase in May). The Philadelphia Federal Reserve's Manufacturing Activity Index continues to be in the negative territory (-13.5). The real estate market data also turned out worse than predicted. For instance, the number of new constructions in the U.S. fell by 8.0% in June, following a 15.7% increase in the previous month. The number of issued construction permits also dropped by 3.7% after a 5.6% rise in May. Sales in the secondary housing market were below the previous values (4.16M in June, 4.30M in May, forecast 4.20M). However, the labour market data turned out slightly better than expected - the number of initial jobless claims was 228K (previous value 237K, forecast 242K). Yet, this is a highly volatile indicator, and it may not reflect the actual situation, but the market was pleased with this bit of positivity.
Overall, the published macro-statistics vividly illustrate the cooling of the American economy. The worsening situation in the real estate market clearly signals the pressure that high-interest rates exert on this important sector. It's enough to recall the Global Financial Crisis of 2007-2008, which began with a mortgage crisis in the U.S.
In such a situation, the hawkish course of the Federal Reserve is likely nearing its end. Almost all Bloomberg experts anticipate that on July 26, the Federal Open Market Committee (FOMC) will raise the interest rate by 25 basis points to 5.5%. There's a possibility that the hike could be even less: not 25, but just 10 basis points. Afterwards, the regulator is expected to take a wait-and-see approach, which could last until the end of the year. The futures market estimates the probability of a rate increase to 5.75% in 2023 at 28%.
However, there's not just the American currency on the EUR/USD scale but also the pan-European one. Revised statistics show that in Q1, the Eurozone's GDP was almost at zero, the economy is stagnating, and its growth prospects appear rather weak. It is clear that the hike in the euro's key interest rate, which has grown from 0% to 4.00% in this tightening cycle, has had and continues to have a negative impact. The lagging effect of monetary tightening is becoming more and more palpable.
On the other hand, despite a 400 basis point increase in rates, inflation (CPI) in the Eurozone is declining quite slowly - in June, it was 5.5% year-on-year compared to 6.1% a month earlier. It is still very far from its target level of 2.0%.
Therefore, on one hand, we see significant price pressure, on the other – the difficulties the EU economy is experiencing. In such an ambiguous situation, the further steps of the European Central Bank officials also seem uncertain. More clarity regarding future monetary policy is expected to emerge at the upcoming European Central Bank Monetary Policy Committee meeting on Thursday, July 27. At least, that's what market participants are hoping for.
Even somewhat unclear data from the US labour market was enough to trigger a DXY correction northwards and send EUR/USD south. The final note of the working week was set at 1.1125. As for the near-term prospects, at the time of writing this review, the evening of July 21, only 20% of analysts voted for the pair's further rise, 50% for its fall, and the remaining 30% took a neutral stance. As for technical analysis, on D1, 75% of trend indicators point up, 25% point down. Of the oscillators, 85% recommend buying, while the remaining 15% take a neutral stance. The pair's nearest support is located around 1.1090-1.1110, 1.1045, 1.0995-1.1010, 1.0895-1.0925, 1.0845-1.0865, 1.0800, 1.0760, 1.0670, 1.0620-1.0635. Bulls will meet resistance around 1.1145, then 1.1170, 1.1230-1.1245, 1.1275-1.1290, 1.1355, 1.1475, and 1.1715.
Undoubtedly, the key events of the upcoming week will be the FED meeting on July 26 and the ECB meeting on July 27, along with the subsequent press conferences held by the leaders of these regulators. Additionally, on Monday, July 24, numerous preliminary business activity data (PMI) will come from Germany, the Eurozone, and the US. The next day, the Eurozone Bank Lending Survey will be published, and the value of the US Consumer Confidence Index will be known. On Thursday, data on durable goods orders will arrive from the United States, along with real estate and unemployment statistics. Finally, at the very end of the working week, on Friday, July 28, we will learn the preliminary data on inflation (CPI) in Germany, as well as personal consumption expenditure data in the US.
GBP/USD: 50 Basis Points or is it 25 After All?
The next meeting of the Bank of England (BoE) is set for August 3. Some market participants are inclined to believe that at this meeting, the regulator will raise the base rate for the pound by another 50 basis points (bps) to 5.50%. Economists from the French financial conglomerate Societe Generale have formulated three main reasons why the BoE will take this step.
Firstly, inflation in the service sector and wages may have peaked in June, but both indicators remain uncomfortably high. The Consumer Price Index (CPI), although it fell over the month from 8.7% to 7.9% (with a forecast of 8.2%), is still far from the target level of 2.0%.
Secondly, as Societe Generale believes, investors are avoiding UK bonds due to persistent inflation in the country. Such high and stable inflation means that investors require higher compensation for holding UK bonds compared to US Treasuries and German bonds. To reassure investors, it is necessary at this stage to continue a strict monetary policy.
Thirdly, in recent weeks the Bank of England and its governor Andrew Bailey have been heavily criticized for sticking to a soft monetary course for too long, thereby allowing a powerful surge in inflation. And now the BoE may overdo it in its desire to prove that its critics are wrong. This can lead to more aggressive actions, such as a significant rate hike. However, we must also consider the possibility that the BoE could choose a more conservative 25 basis point rate hike instead.
Indeed, not everyone agrees with the arguments put forth by the French economists. For instance, their colleagues at the German Commerzbank have noted that consumer prices (CPI) in the UK grew at a much slower rate in June than was expected. Therefore, the market's built-in expectations for a rate increase are too high and require a downward correction. This, in turn, will lead to a weakening of the pound. A similar viewpoint was expressed by strategists at the Netherlands' largest banking group, ING, who believe the rate will be increased by a maximum of 25 basis points.
The above-mentioned CPI data was published on Wednesday, July 19. However, in addition to this, the Office for National Statistics (ONS) in the UK also published retail trade data for the country on Friday, July 21. It turned out that in June, the volume of retail trade increased by 0.7% on a monthly basis, compared to the expected 0.2% and 0.1% previously. The main indicator of retail sales, excluding auto fuel sales, increased by 0.8% over the month compared to the forecasted 0.1% and 0% in May. The annual volume of retail sales in the UK fell by -1.0% in June against the forecasted -1.5% and May's decline of -2.3%, while the base volume of retail sales dropped by -0.9% against the expected -1.6% and the previous -1.9%.
After the release of these favorable data, the UK Finance Minister Jeremy Hunt stated that "we will start seeing results if we stick to our plan to halve inflation". The minister's words could be interpreted as support for further tightening of the BoE's hawkish policy. However, the markets practically ignored them, and the strengthening dollar continued to pressure GBP/USD, which ended the five-day trading period at the 1.2852 mark.
As for the pair's movement, it will, of course, depend on the decisions and statements of the Fed on July 26. Undoubtedly, the ECB's meeting on July 27 will also influence the pound through EUR/GBP. But all this is in the near future. As for the present, at the time of writing this review, the median forecast of experts for GBP/USD looks maximally neutral: a third of them voted for the pair's growth, a third - for its fall, and a third maintained neutrality. On D1 oscillators, 35% are coloured green, 25% - red, and the remaining 40% - neutral grey. Among trend indicators, 60% sided with the green, and 40% sided with the red. In case of the pair's movement south, it will meet support levels and zones at 1.2800-1.2815, then 1.2675-1.2695, 1.2570, 1.2435-1.2450, 1.2300-1.2330, 1.2190-1.2210. In case of the pair's growth, it will meet resistance at 1.2940, then 1.2980-1.3000, 1.3050-1.3060, 1.3125-1.3140, 1.3185-1.3210, 1.3300-1.3335, 1.3425, 1.3605.
Apart from the FED and ECB meetings, another notable event in the upcoming week's calendar is on Monday, July 24, when the preliminary business activity data (PMI) for various sectors of the UK economy will be published.
USD/JPY: Two Steps Forward, One Step Back
The Russian revolutionary Vladimir Lenin wrote a book in 1904 titled "One Step Forward, Two Steps Back". What happened to the yen over the past three weeks can be titled as "Two Steps Forward, One Step Back". For the first two weeks of July, the Japanese currency grew, and for the third, it gave back more than half of its gains. And while its peers - the euro and pound, retreated thanks to a stronger dollar, in the case of USD/JPY, a significant blow to the national currency was not dealt by the US, but by a fall in inflation in Japan.
It should be recalled that at the time of writing the previous forecast, the number of supporters of yen weakening was three times the number of those expecting its further strengthening (45% versus 15%). And the majority turned out to be correct. The Inflation Report published on Friday, July 21st, sent the Japanese currency into a knockdown. USD/JPY jumped by more than 1%. It turned out that despite the ultra-dovish policy of the BoJ and a negative interest rate of -0.1%, consumer price growth has decreased. Despite a forecast of 3.5%, in reality, inflation (CPI) in June was 3.3%. The consumer price index excluding food and energy fell to 4.2% compared to the previous value of 4.3%.
These data, if not completely, then at least for a long time, buried hopes for a tightening of the monetary policy of the Japanese Central Bank. Moreover, the Prime Minister Fumio Kishida, who spoke the day before, supported the current monetary policy of the regulator. Therefore, with a high degree of probability, at its meeting on Friday, July 28, the Bank of Japan will leave the interest rate unchanged. And to maintain the course of the national currency, if necessary, as before, it will resort to currency interventions.
In the meantime, to stop the yen's fall, Japan's Chief Currency Diplomat Masato Kanda stepped in with a "verbal intervention". In particular, he stated that he "never felt a limit to the possibilities for currency interventions" and that when it comes to them, he takes various steps to avoid running out of "ammunition".
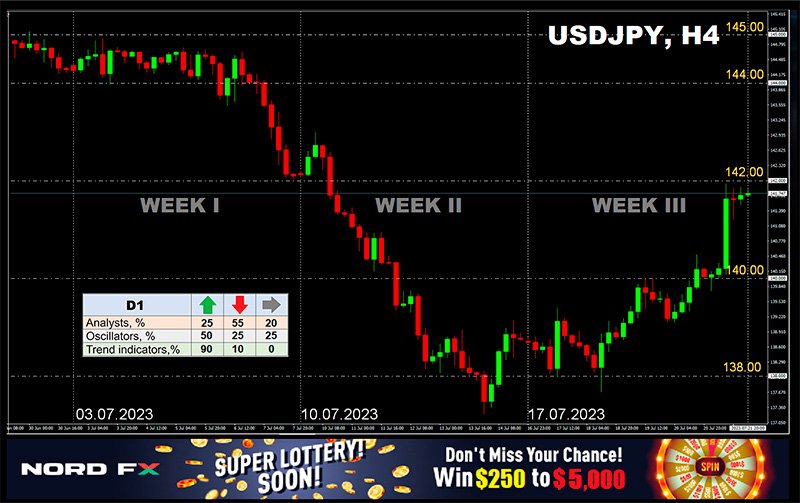
The situation has somewhat calmed down after the comments made by Masato Kanda, with USD/JPY ending the past week at a mark of 141.80. At the time of writing this review, 25% of analysts predict the pair will continue its upward movement in the upcoming days, 55% voted for a downward trend, and 20% took a neutral position. The readings of the D1 indicators are as follows: among the oscillators, 25% are coloured red, 50% green, and 25% grey. Trend indicators show a clear advantage for the greens at 90%, with only 10% on the opposite side. The nearest support level is located in the zone of 141.40, followed by 140.45-140.60, 139.85, 138.95-139.05, 138.05-138.30, then 137.25-137.50, 135.95, 133.75-134.15, 132.80-133.00, 131.25, 130.60, 129.70, 128.10, and 127.20. The nearest resistance is at 142.20, followed by 143.75-144.00, 145.05-145.30, 146.85-147.15, 148.85, and finally the peak of October 2022 at 151.95.
Besides the Bank of Japan's meeting, no significant economic information pertaining to the country's economy is anticipated in the upcoming week.
CRYPTOCURRENCIES: Litecoin Halving - Rehearsal for Bitcoin Halving
Observers note that the peak of the Dollar Index DXY in 2023 almost coincided with bitcoin's trough. There's nothing surprising about this: BTC/USD is like a scale. If the dollar gets heavier, bitcoin becomes lighter. Last week, the rise of the American currency led to a weakening of the digital one. It's worth noting that bitcoin is desperately trying to hold onto the support zone at $29,850 and avoid a collapse to the June lows around $25,000.
The relationship between BTC and USD is logical and understandable. However, some crypto enthusiasts are trying to position bitcoin as the primary, leading asset, with the dollar trailing behind like a dog's tail. As an argument, they cite, for example, the fact that bitcoin entered a horizontal channel by the middle of last year, while the Dollar Index caught up with it a few weeks later. If you look closely, you can find many such moments on the charts. But in our opinion, one should not overestimate the significance of the main cryptocurrency.
At the moment, many experts and influencers continue to paint a bright future for bitcoin. Although the heights of target horizons differ by times, sometimes even by tens of times. For example, Standard Chartered economist Geoff Kendrick recently stated that his financial corporation has adopted a more optimistic forecast for bitcoin's market value, targeting the $120,000 level by the end of 2024.
In response, BBC World analyst Glen Goodman wrote that these $120,000 "seem more like a figure pulled out of thin air than a genuinely justified forecast." He believes that the authors of such predictions are siding with the bulls and are not considering a number of key factors. The most important of them is that the US financial regulators are ruthlessly cracking down on the crypto industry, inundating its participants with lawsuits and investigations. Moreover, Goodman refers to forecasts by American economists who expect a protracted recession next year, the consequences of which can seriously suppress activity in the financial markets, including the digital asset market.
Unlike Glen Goodman, Real Vision CEO and former Goldman Sachs top manager Raoul Pal believes that economic troubles, confusion in the banking sector, and the real estate market crisis are beneficial for bitcoin, which serves as a defensive asset against this backdrop. According to Raoul Pal, a bullish rally for digital gold is inevitable, and BTC can easily reach the $50,000 mark later this year.
Renowned analyst under the nickname PlanB, on the other hand, does not believe that a powerful pump of the flagship cryptocurrency can occur before the halving in April 2024. His forecast is based on using the MA-200 as an indicator. This line increases on average by $500 a month, so in nine months it will be at the $32,000 mark. According to PlanB, it is possible that the coin's price might even be about 50% above this mark, but even then, it would be only $48,000.
Michael Van De Poppe, the founder of venture firm Eight, has clarified his prediction from last week. He believes that the current trend is breaking the minimums, as a result of which bitcoin could drop to $29,500 and even $29,000. However, he thinks that such a price movement could precede a bullish rally, during which the main cryptocurrency will raise its rate first to $32,500, then to $34,000, followed by a surge to $38,000.
Shifting from short- and medium-term forecasts to long-term, one could mention the opinion of Catherine Wood, CEO of ARK Invest. It seems that she is not particularly interested in jumps to $38,000 and even to $120,000. Once again, she reaffirmed her forecast that in about seven years, against the backdrop of inflation and a banking crisis, bitcoin will trade at $1,500,000 per coin, or at least at $625,000.
Against the backdrop of Catherine Wood's boundless optimism, data from CryptoVantage, whose employees surveyed 1,000 crypto investors from the U.S., comes as a cold sobering shower. It turned out that only 23% of them believe that the Bitcoin rate will reach its historical maximum of $68,917 next year. 47% think that the coin's price will rise to this mark within five years. 78% are confident that BTC will eventually return to its all-time high, but in an uncertain future. And 9% believe that this will never happen again.
We've paid significant attention to the upcoming bitcoin halving in April 2023 in our previous reviews. Let's now remember that the Litecoin halving is due quite soon, on August 2nd of this year. The reward for mining a block will be reduced to 6.25 LTC. Given that Litecoin is a fork of bitcoin, and its total emission is capped at 84 million coins, it will be interesting to observe the changes in Litecoin's price and attempt to forecast bitcoin's performance after its future halving based on these observations.
At the time of writing this review, on the evening of Friday, July 21, BTC/USD is trading around $29,850. The total capitalization of the crypto market has barely changed and stands at $1.202 trillion ($1.198 trillion a week ago). The Crypto Fear & Greed Index is in the Neutral zone, at 50 points (down from 60 points a week ago).
Dollar Turned into Consolidation Phase as Selling Passed Climax
Dollar recovered broadly last week and it seemed to have emerged from its near-term selling climax. While it's premature to call for bullish trend reversal, the greenback has likely entered at least a consolidation phase, with potential for a more robust recovery on the horizon. Dollar's next move will likely hinge more on overall risk sentiment than the anticipated Fed rate hike. Riding on the coattails of resilient oil prices, Canadian Dollar secured its place as the second strongest, followed by Swiss Franc, which was further buoyed by against the beleaguered Sterling.
In contrast, last week saw significant sell-offs for both Sterling and Yen. However, their declines were overshadowed by New Zealand Dollar's downturn. The Kiwi and Aussie currencies were both burdened by poor economic data from China, which dimmed recovery hopes for the world's second-largest economy. However, Australian Dollar found some support in robust job data and ended the week mixed, along with Euro.
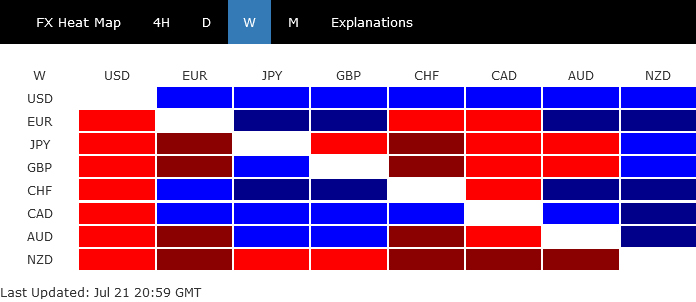
Dollar passed selling climax, now in consolidation mode
Last week could have marked a near term turning point for Dollar, as it appeared to have passed its selling climax, staging a rebound in the midst of a mixed risk sentiment in US stock markets. The late reversal in Japanese Yen the underperformance of Euro helped bolster the greenback's position.
Despite these fluctuations, the basics remain the same. A 25bps hike by Fed at its meeting on the coming Wednesday should be a done deal. But the future beyond this decision is clouded with uncertainty. While Fed anticipates at least one more hike this year according to its own projections, futures markets remain highly skeptical.
It should also be reminded that the next FOMC meeting isn't until September 20-21, leaving a substantial gap filled with several key data releases. These include PCE inflation data on July 28 and August 31, CPI on August 10 and September 13, along with non-farm payrolls on August 4 and September 1. Unless the first batch of data releases contains significant surprises, it is expected that Dollar may continue its consolidation and recovery, at least until Jackson Hole Symposium scheduled for August 24-26.
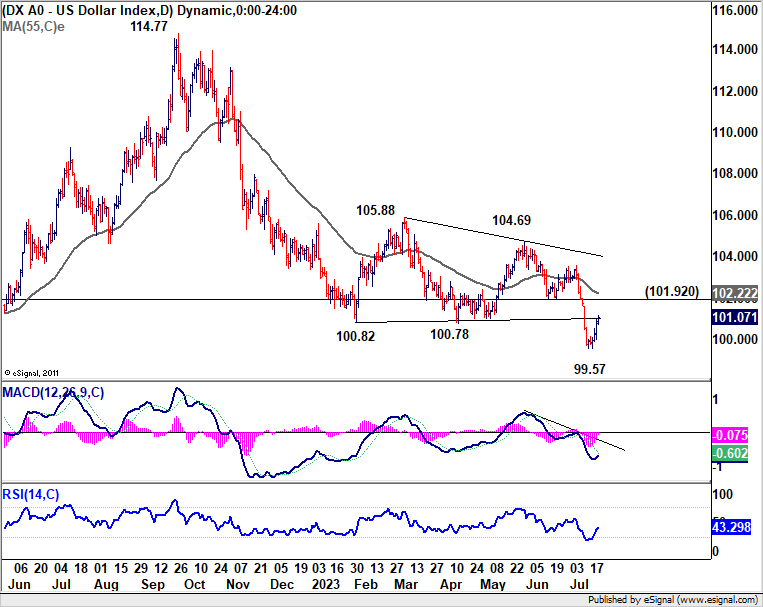
Technically, Dollar Index should have formed a short term bottom at 99.57 with last week's rebound. But near term risk will stay on the downside for another fall as long as 101.92 support turned resistance holds. Break of 99.57 will resume larger down trend from 114.77.
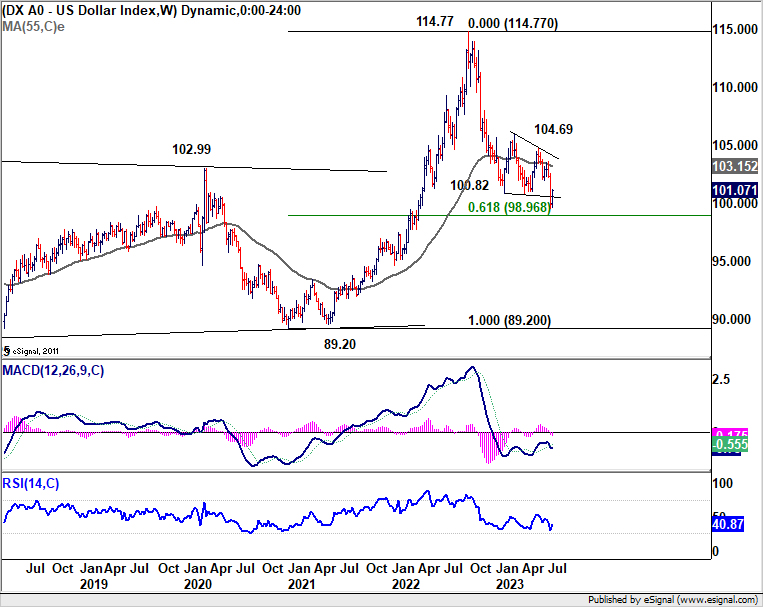
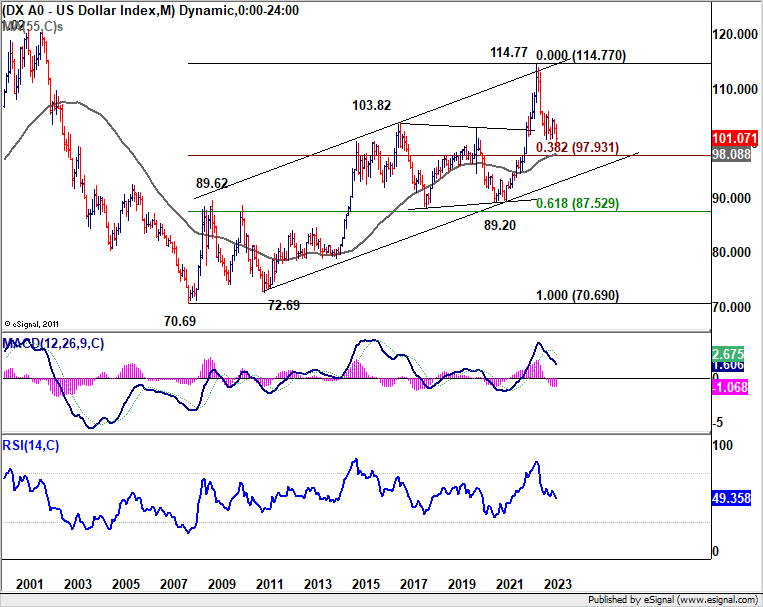
Still, in case of down trend extension, strong support is likely at around 98 handle to contain downside to bring a sustainable bounce or even reversal. There is 61.8% retracement of 89.20 (2021 low) to 114.77 at 98.96. 55 M EMA currently sits around 98.08. Even if DXY is correcting the up trend from 70.69 (2008 low), there is 38.2% retracement of 70.69 to 114.77 at 97.93.
NASDAQ down, reversing or just reacting to rebalancing?
In the short term, the fate of Dollar is likely to be heavily influenced the overall risk sentiment in the market. Over a longer time horizon, performance of the greenback will hinge on whether the current rally in stocks is a "bear market rally", and has almost run its course.
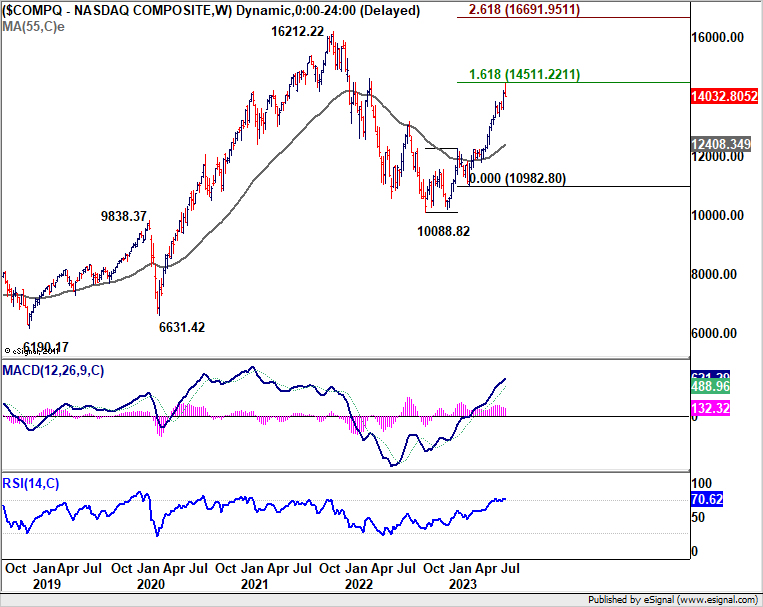
Last week witnessed mixed sentiment, with DOW extending its winning streak to ten consecutive sessions, while tech-heavy NASDAQ fell notably due to disappointing earnings reports from some leading tech companies. At the same time, the impact of NASDAQ rebalancing on the index remains uncertain.
Technically, a short term top should have formed at 14445.66 last week, ahead of 161.8% projection of 10088.82 to 12269.55 from 10982.80 at 14511.22. Considering bearish divergence condition in D MACD, break of 13864.06 support will indicate that deeper correction is underway to 55 D EMA (now at 13332.61).
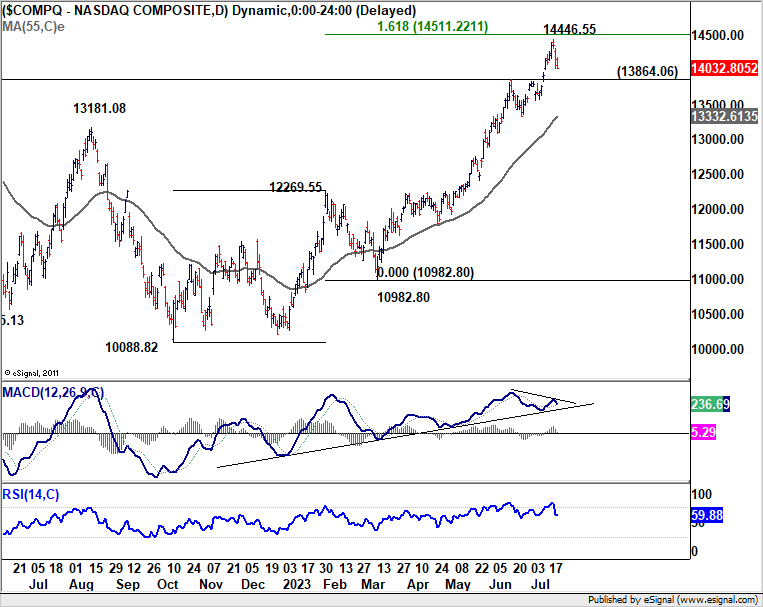
More importantly, rise from 10088.82 is currently seen as the second leg of the pattern from 16212.22 (2021 high). Sustained trading below 55 D EMA will raise the chance that the third leg has started and target 55 W EMA (now at 12408.34 next). Developments in the rest of July and early August would be crucial.
Sterling took a hit on lower BoE rate expectations
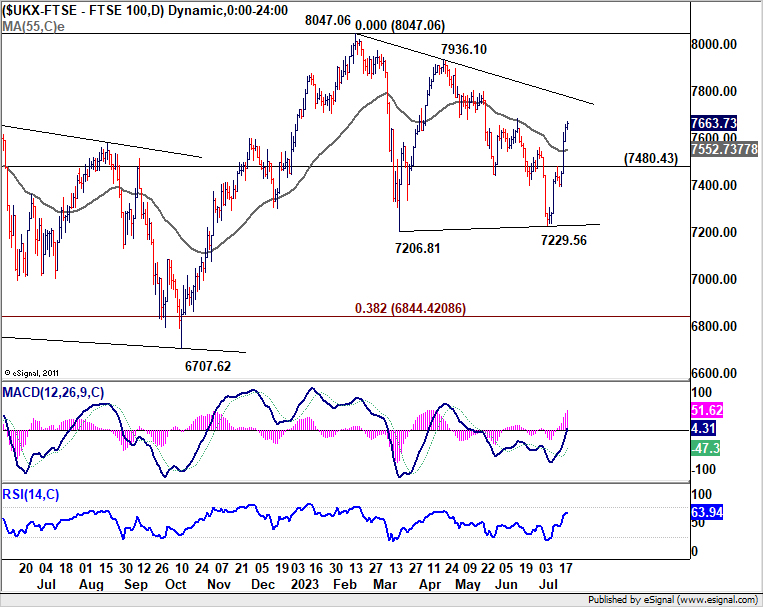
Sterling came under considerable pressure last week, trailing as one of the poorest performers, following data that revealed a more significant slowdown in UK CPI for June than anticipated. However, with both headline and core readings at 7.9% and 6.9% respectively, these figures are unquestionably still extraordinarily high. Despite this, the market has begun to temper expectations for another 50bps rate hike on August 3. Furthermore, the likelihood of interest rate eventually reaching 7% mark has diminished, even admitted by the most hawkish BoE observers.
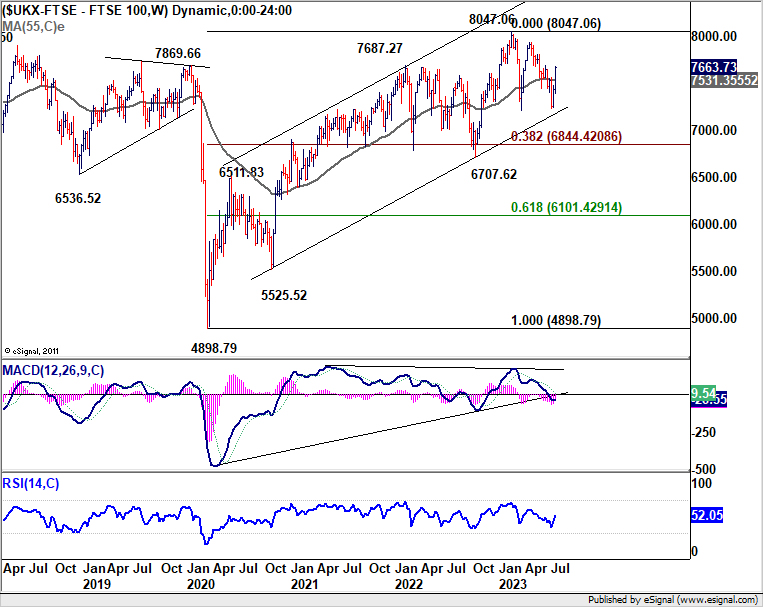
FTSE jumped sharply last week as helped by expectations of a lower BoE peak rate, as well as the depreciation in Sterling. Technically, the base case now is that consolidation from 8047.06 has completed with three waves down to 7229.56. Further rise is in favor in near term trend line resistance (now at around 7780). Sustained break there will bolster the case for upside breakout to new record high above 8047.06. Meanwhile, break of 7480.43 to bring another falling leg to make the corrective pattern a triangle. But downside should be contained by 7206.81/7229.56 support zone.
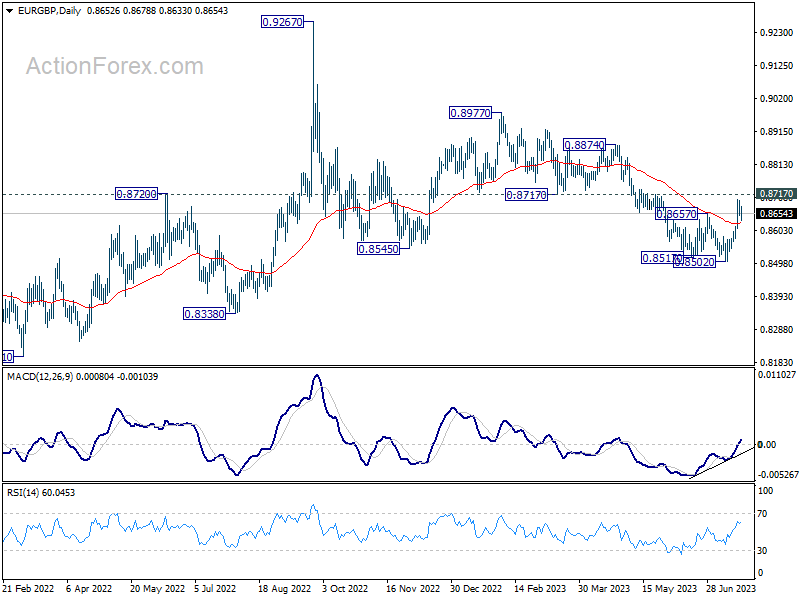
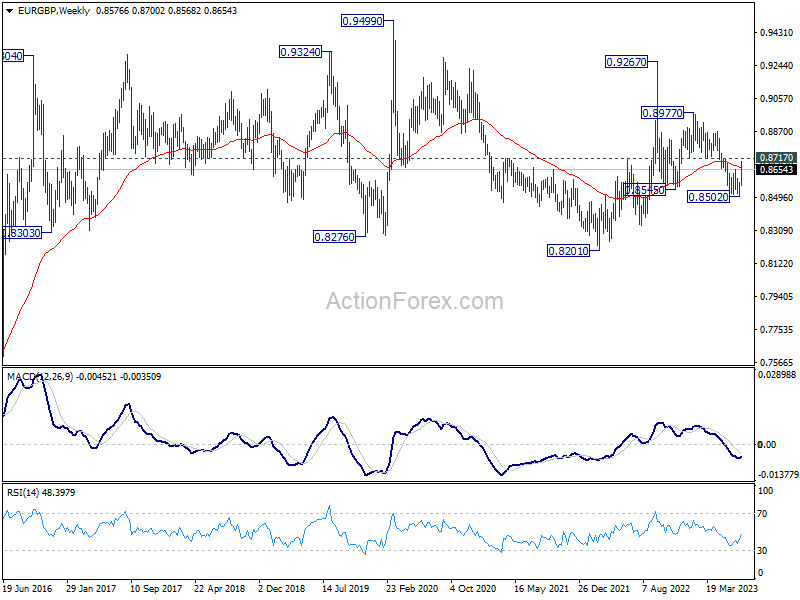
EUR/GBP's strong rebound and break of 0.8657 resistance confirmed short term bottoming at 0.8502. Fall from 0.8977 might have completed its five-way sequence. More importantly, the corrective pattern from 0.9267 (2022 high) could have completed with three waves down to 0.8502 too. Near term focus is now on 0.8717 support turned resistance. Decisive break there will add more credence to this bullish case and pave the way back to 0.8977 next.
Yen plummeted following BoJ speculations
Yen was sold off steeply towards the end of last week, after Reuters reported that BoJ is leaning towards holding monetary policy unchanged at upcoming meeting on Friday, including the parameters for yield curve control. Five unnamed sources were quoted in the report. BoJ could be adopting a strategy to allow businesses to earn enough profits to maintain the pace of wages hike next year, to keep inflation sustainable. The report came after Japanese data showing headline and core inflation figures staying at relatively the same level in June as in May.
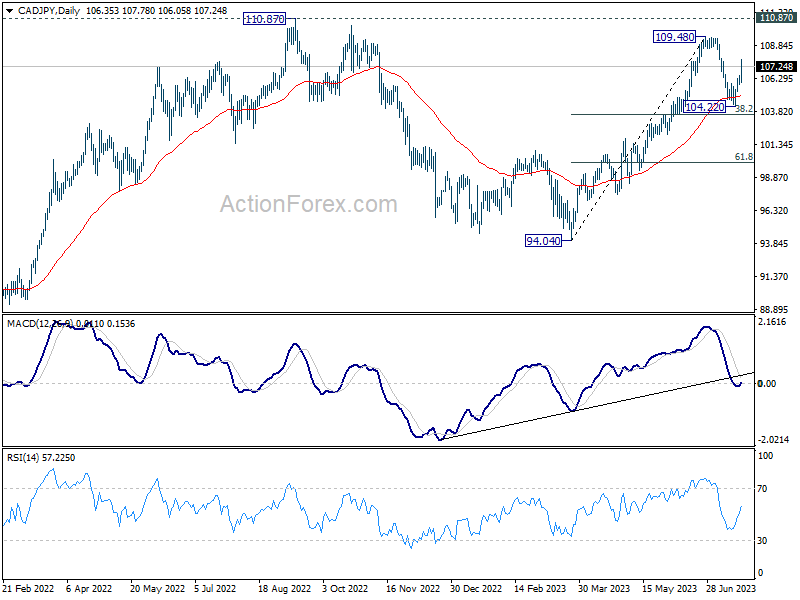
CAD/JPY's strong rebound last week argues that pull back from 109.48 has completed at 104.22 already. More importantly, solid support was seen from 55 D EMA (now at 104.98) and 38.2% retracement of 94.04 to 109.48 at 103.58. The development dampens the view that rise from 94.04 is the second leg of the pattern from 110.87, which has completed. In other words, there is now chance that rise from 94.04 is an impulsive move itself. On the upside, break of 109.48 will target 110.87 high first, and decisive break there will resume larger up trend from 73.80.
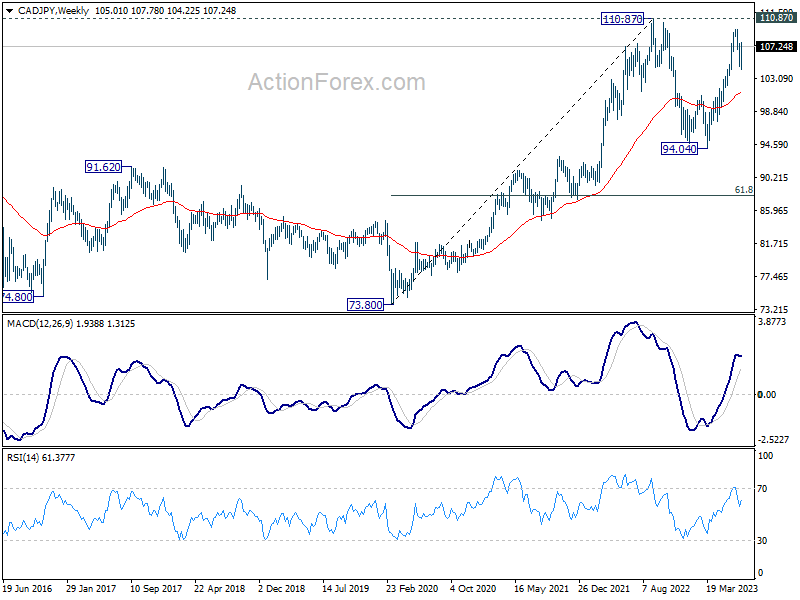
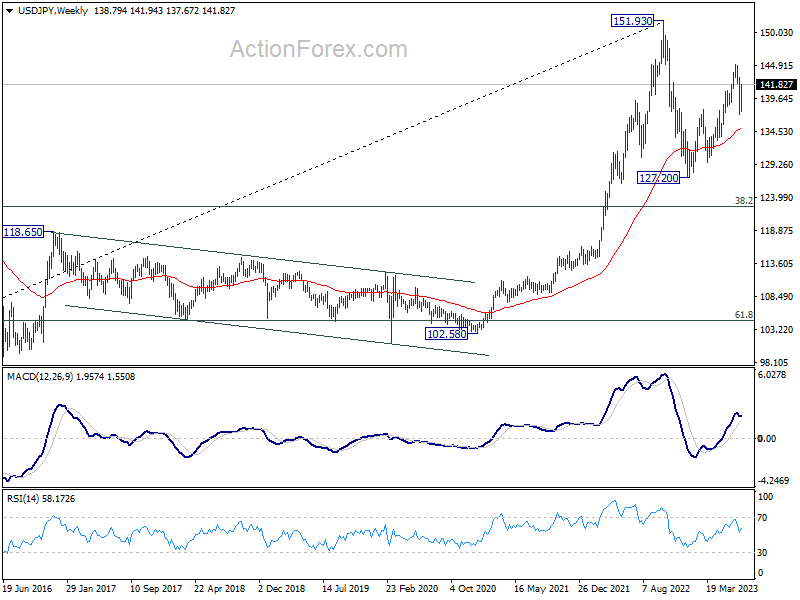
Correspondingly, the current USD/JPY's rise from 127.20 is viewed as the second leg of the corrective pattern from 151.93. However, an upside breakout in CAD/JPY could temper this view and increase the likelihood of USD/JPY eventually breaking through 151.93 high in a corresponding move.
EUR/USD Weekly Outlook
EUR/USD's pull back last week indicates short term topping at 1.1274, after hitting 1.1273 fibonacci level. Initial bias stays on the downside this week for deeper fall. But outlook will remain bullish as long as 1.1011 resistance turned support holds. Above 1.1274 will resume larger up trend from 0.9534. However, firm break of 1.1011 will argue that larger correction is underway.
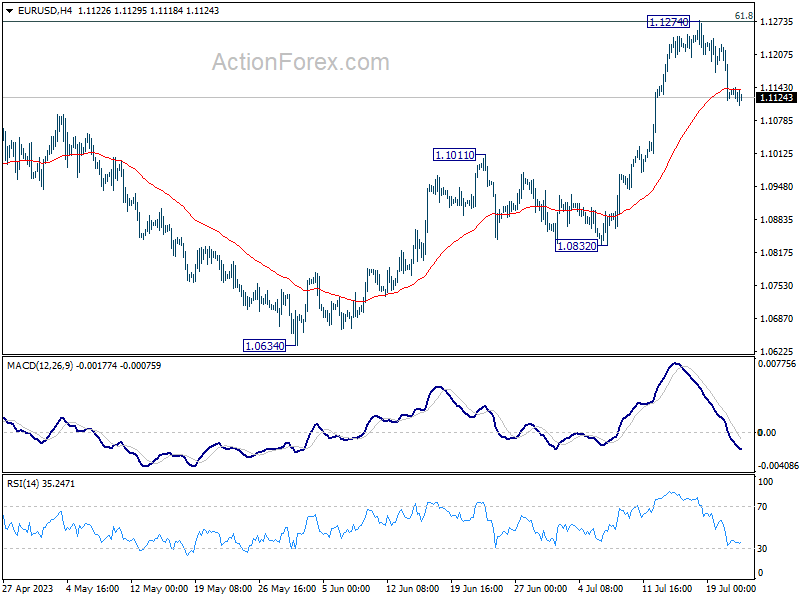
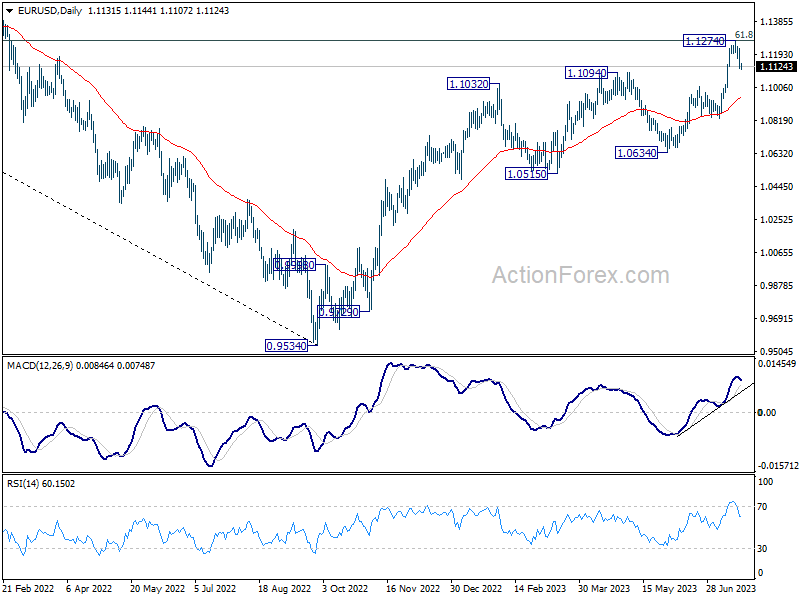
In the bigger picture, rise from 0.9534 is still expected to continue as long as 1.1011 resistance turned support holds. Decisive break of 61.8% retracement of 1.2348 (2021 high) to 0.9534 at 1.1273 will solidify the case of bullish trend reversal and target 1.2348 resistance next. However, firm break of 1.1011 will bring deeper fall back to 1.0634 support next.
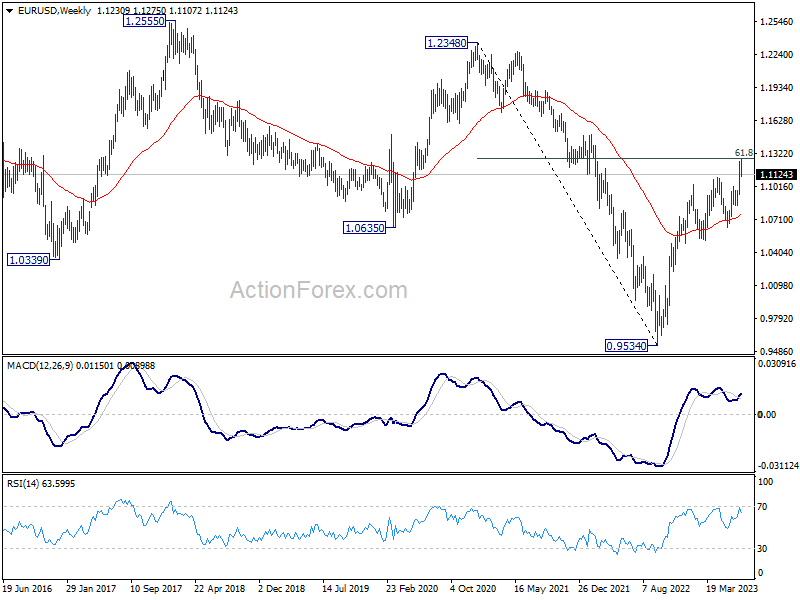
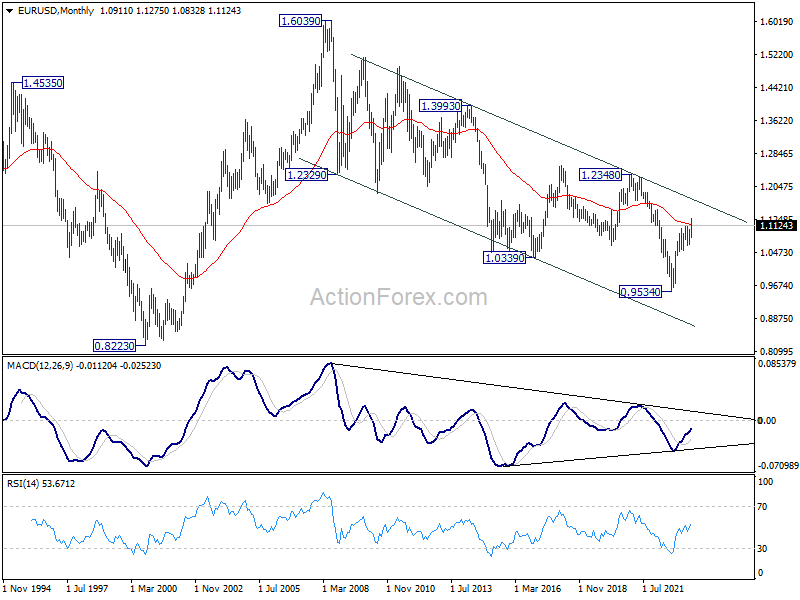
In the long term picture, focus stays on 55 M EMA (now at 1.1141). Rejection by this EMA will revive long term bearishness. However, sustained break above here will be affirm the case of long term bullish reversal and target 1.2348 resistance for confirmation.
EUR/USD Weekly Outlook
EUR/USD's pull back last week indicates short term topping at 1.1274, after hitting 1.1273 fibonacci level. Initial bias stays on the downside this week for deeper fall. But outlook will remain bullish as long as 1.1011 resistance turned support holds. Above 1.1274 will resume larger up trend from 0.9534. However, firm break of 1.1011 will argue that larger correction is underway.
In the bigger picture, rise from 0.9534 is still expected to continue as long as 1.1011 resistance turned support holds. Decisive break of 61.8% retracement of 1.2348 (2021 high) to 0.9534 at 1.1273 will solidify the case of bullish trend reversal and target 1.2348 resistance next. However, firm break of 1.1011 will bring deeper fall back to 1.0634 support next.
In the long term picture, focus stays on 55 M EMA (now at 1.1141). Rejection by this EMA will revive long term bearishness. However, sustained break above here will be affirm the case of long term bullish reversal and target 1.2348 resistance for confirmation.
USD/JPY Weekly Outlook
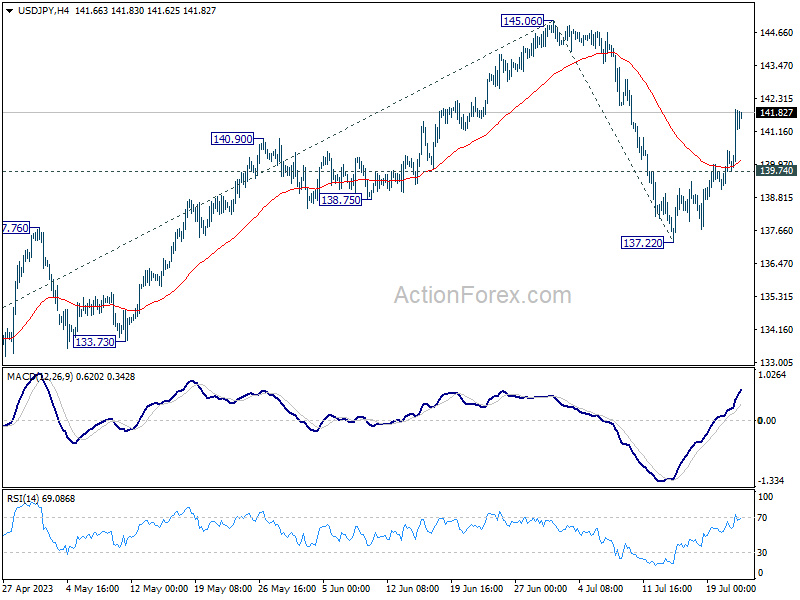
USD/JPY's strong rebound last week argues that pull back from 145.06 has completed at 137.22 already. More importantly, rise from 127.20 is not completed. Initial bias stays on the upside this week for retesting 145.06 first. Firm break there will target 61.8% projection of 129.62 to 127.22 from 145.06 at 146.76 next. On the downside, below 139.74 minor support will bring retest of 137.22 instead.
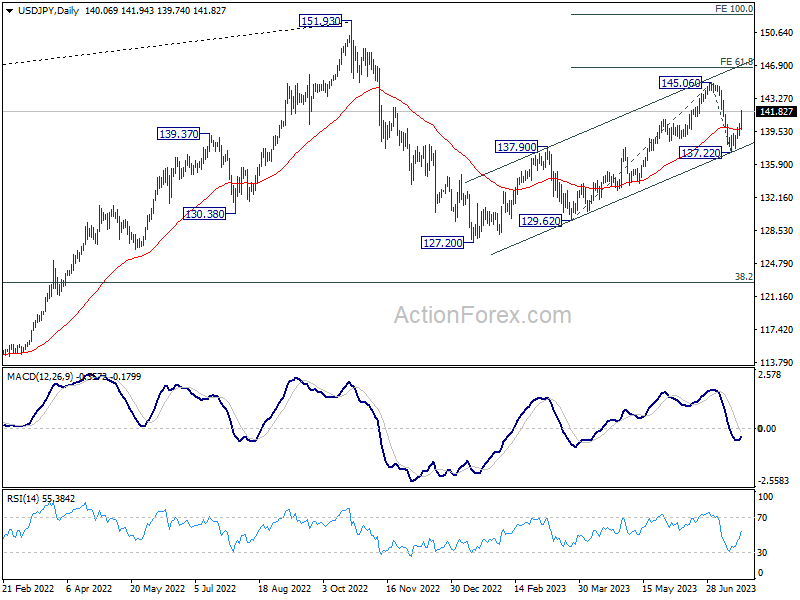
In the bigger picture, overall price actions from 151.93 (2022 high) are views as a corrective pattern. Current development suggests that the second leg (the rise from 127.20) might not be over yet. But even in case of extended rise, strong resistance should be seen from 151.93 to limit upside. Meanwhile, break of 137.22 support should confirm the start of the third leg to 127.20 (2023 low) and below.
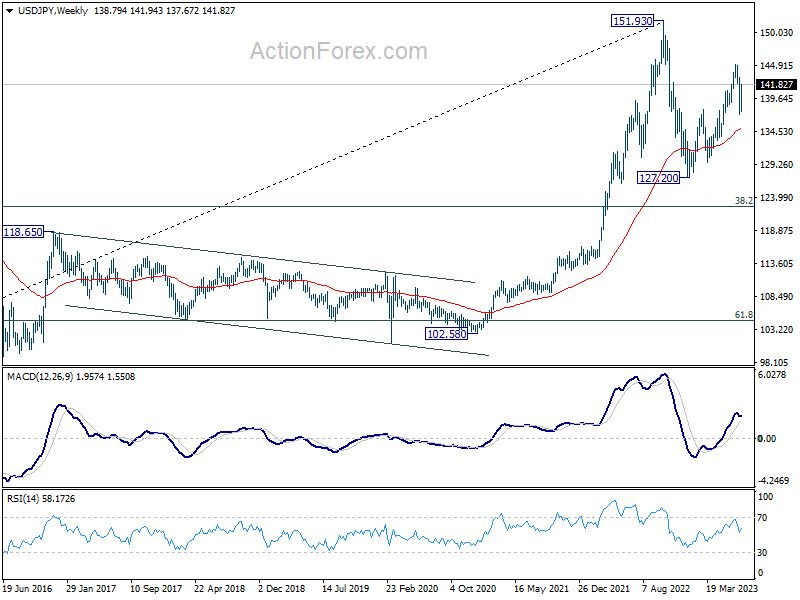
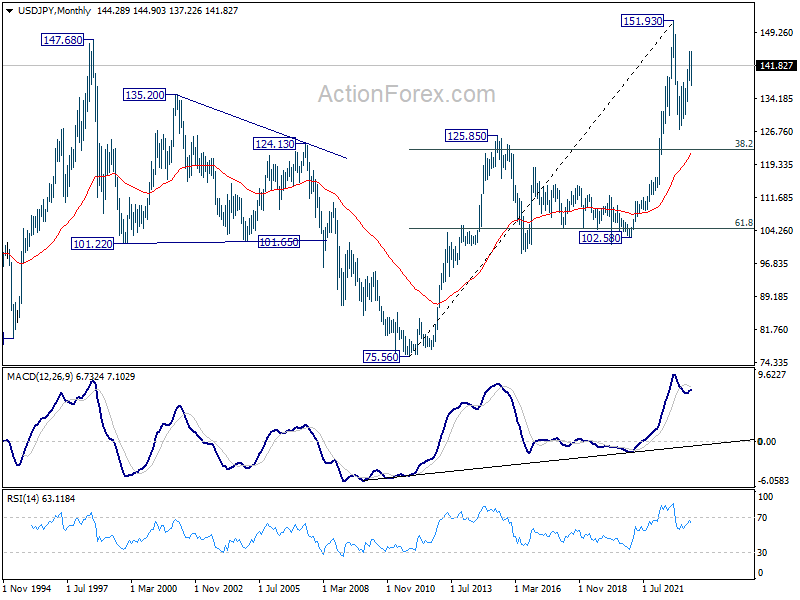
In the long term picture, price action from 151.93 is seen as developing into a corrective pattern to up trend from 75.56 (2011 low). While deeper decline cannot be ruled out, downside should be contained by 38.2% retracement of 75.56 to 151.93 at 122.75.
GBP/USD Weekly Outlook
GBP/USD's fall form 1.3141 extended lower last week and the break of 1.2847 resistance turned support argues that larger correction is underway. Initial bias stays on the downside this week for 55 D EMA (now at 1.2692). On the upside, break of 1.2963 minor resistance will turn bias back to the upside retest 1.3141 high instead.
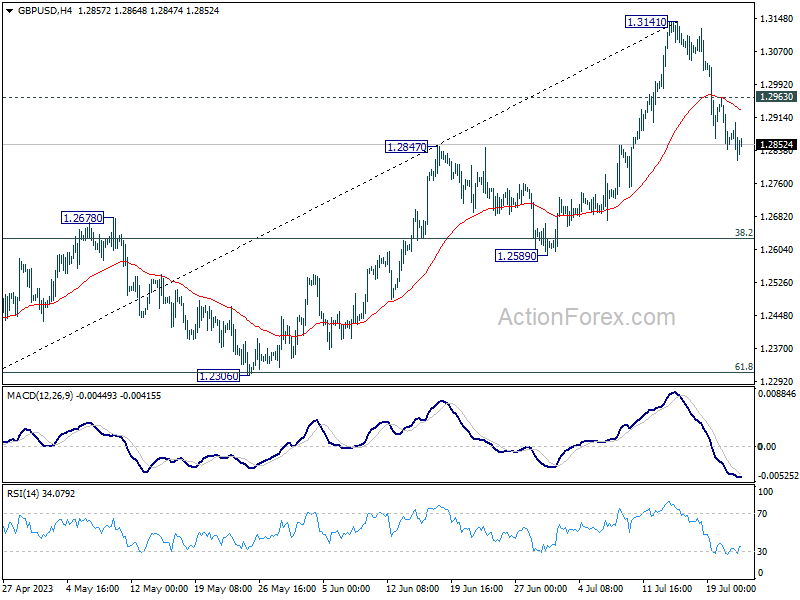
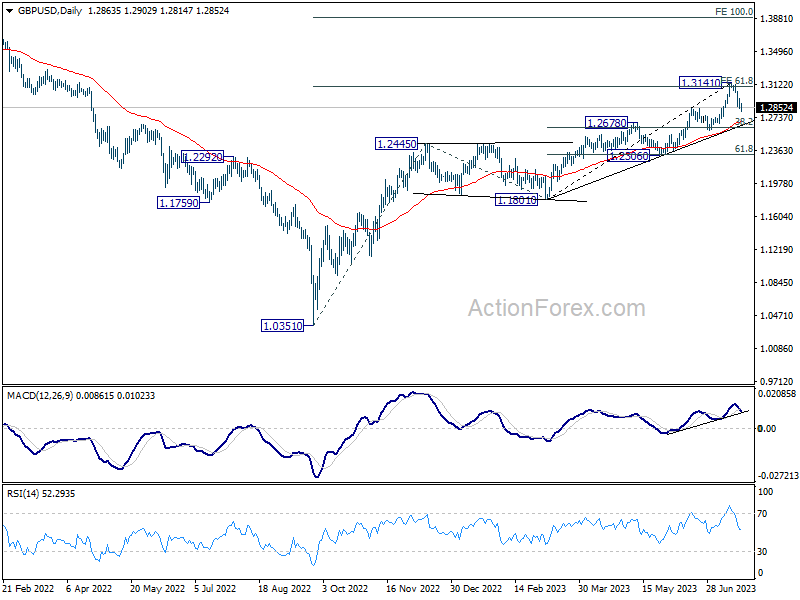
In the bigger picture, as long as 1.2678 resistance turned support holds, rise form 1.0351 (2022 low) is expected to continue. Next target is 100% projection of 1.0351 to 1.2445 from 1.1801 at 1.3895. However, sustained break of 1.2678 will argue that it's at least corrective this rally, with risk of bearish reversal.
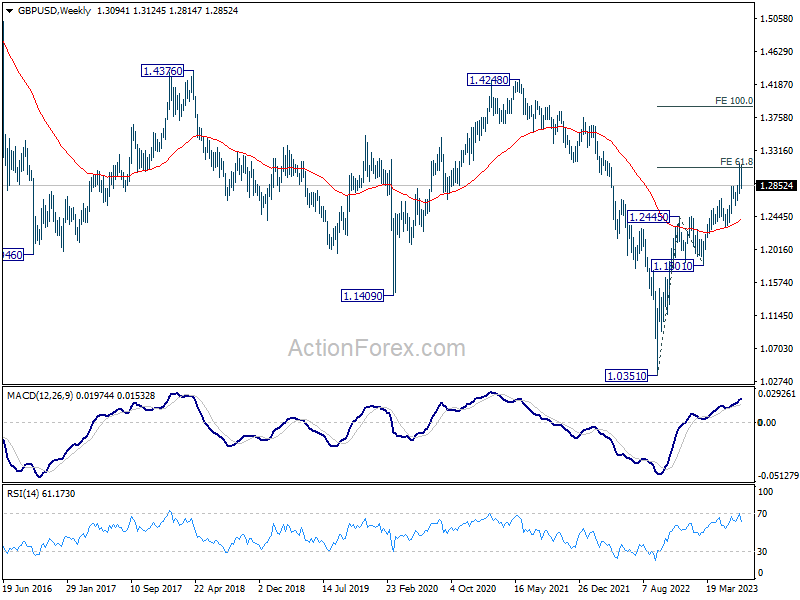
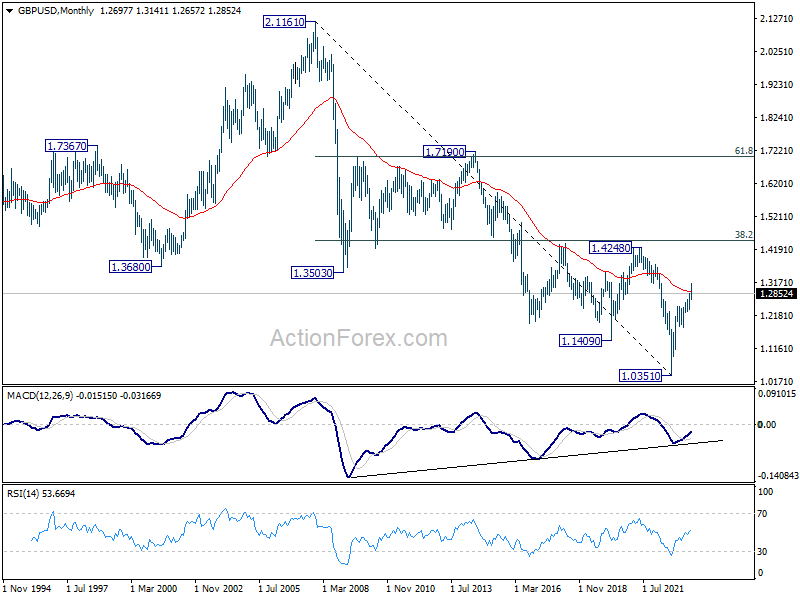
In the long term picture, sustained trading above 55 M EMA (now at 1.2911) will add to the case of long term bullish reversal. Decisive break of 1.4248 cluster resistance (38.2% retracement of 2.1161 (2007 high) to 1.0351 at 1.4480) will confirm completion of whole down trend from 2.1161. Nevertheless, rejection by 1.4248/4480 will keep long term outlook neutral at best.
USD/CHF Weekly Outlook
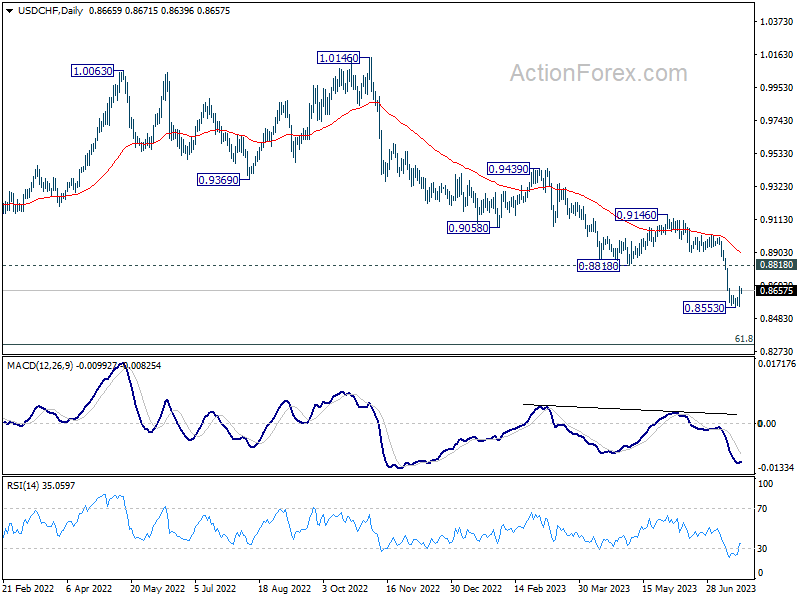
USD/CHF's rebound last week suggests short term bottoming at 0.8853. Initial bias stays mildly on the upside for 0.8818 support turned resistance. Rejection by 0.8818 will retain near term bearishness for another decline through 0.8553. Meanwhile for now, risk will stay mildly on the upside as long as 0.8553 holds, in case of retreat.
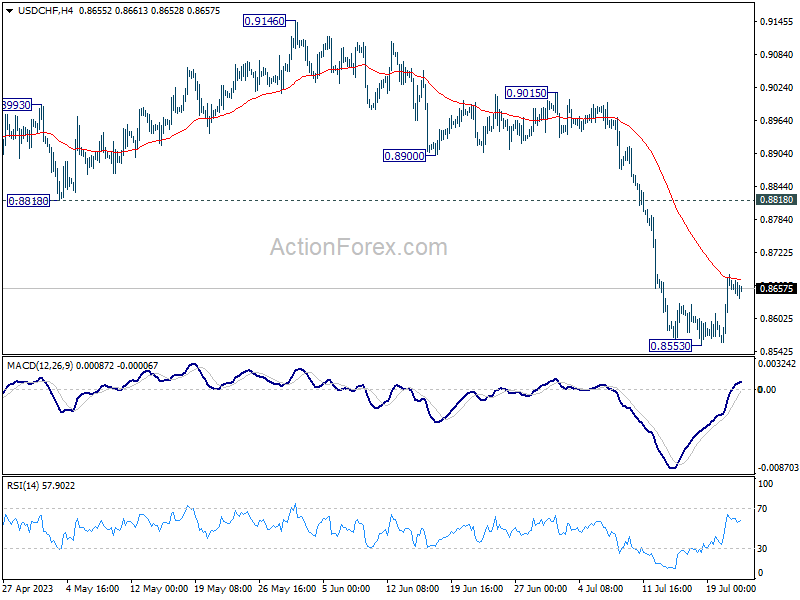
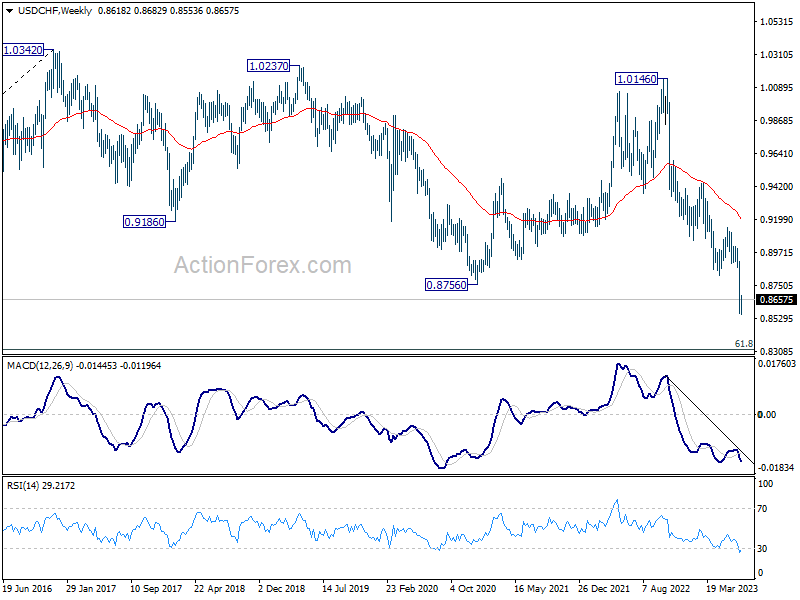
In the bigger picture, the break of 0.8756 (2021 low) indicates break out from the long term range pattern. For now, medium term outlook will stay bearish as long as 0.9146 resistance holds. Further fall would be seen to 61.8% retracement of 0.7065 (2011 low) to 1.0342 (2016 high) at 0.8317 next.
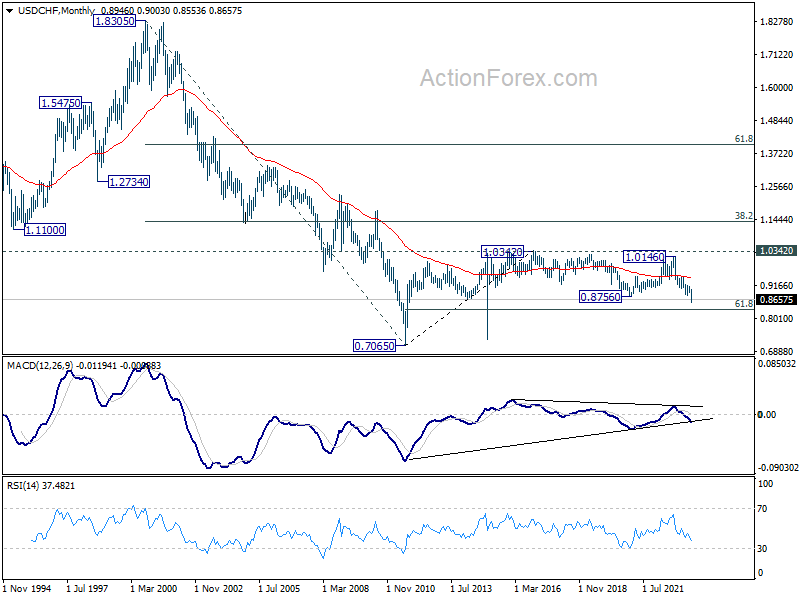
In the long term picture, there is no clear sign that down trend from 1.8305 (2000 high) has completed. With 38.2% retracement of 1.8305 to 0.7065 at 1.1359 intact, outlook is neutral at best. Sustained break of 61.8% retracement of 0.7065 (2011 low) to 1.0342 (2016 high) at 0.8317 will bring retest of 0.7065 low.
AUD/USD Weekly Report
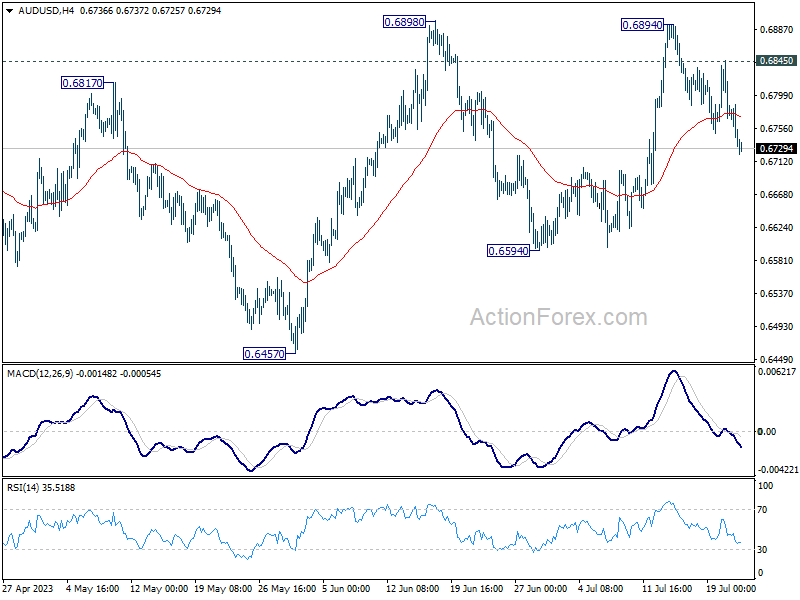
AUD/USD's fall from 0.6894 extended lower last week despite interim recovery. Initial bias is on the downside this week for deeper fall. But downside should be contained above 0.6594 support to bring rebound. On the upside, above 0.6845 will bring retest of 0.6898 resistance. Decisive break there will resume rise from 0.6457.
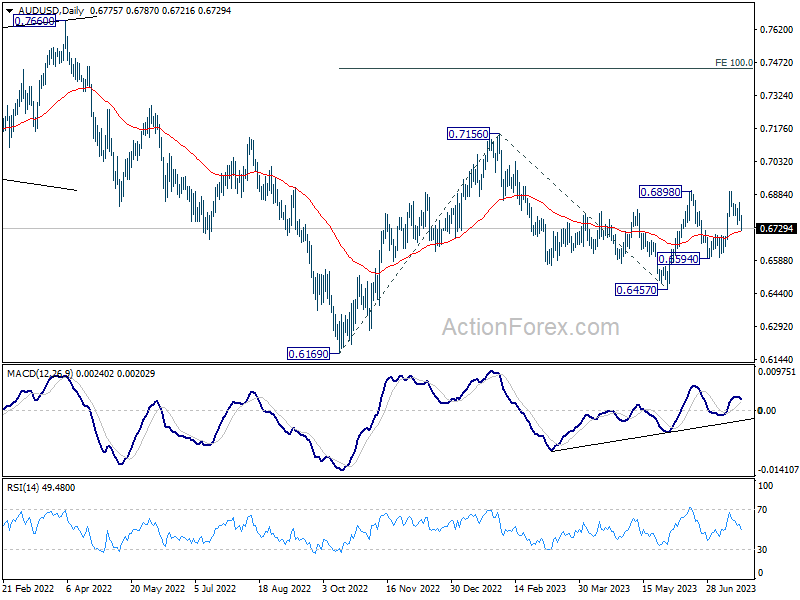
In the bigger picture, price actions from 0.7156 are seen as a correction to the rebound from 0.6169 (2022 low). Break of 0.6898 resistance will argue that rise from 0.6169 is ready to resume through 0.7156. Next target will be 100% projection of 0.6169 to 0.7156 from 0.6457 at 0.7444. For now, this will be the favored case as long as 55 D EMA (now at 0.6715) holds.
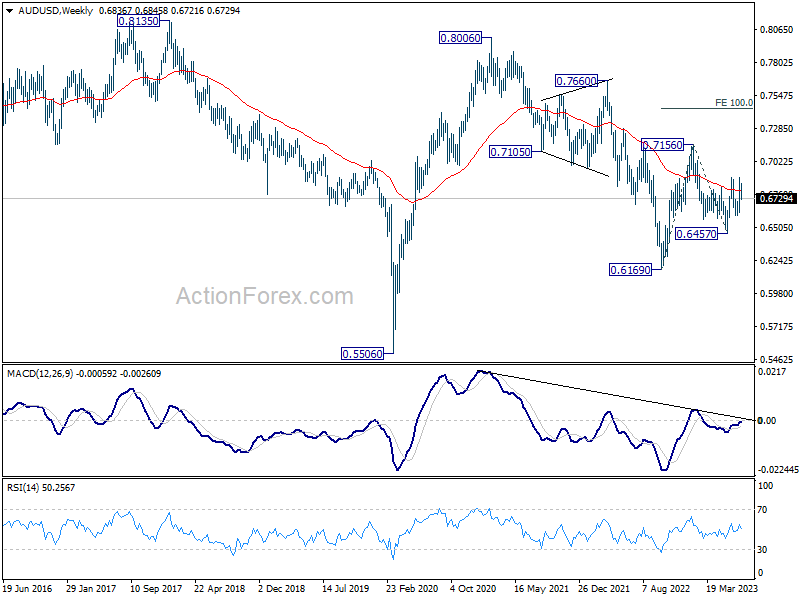
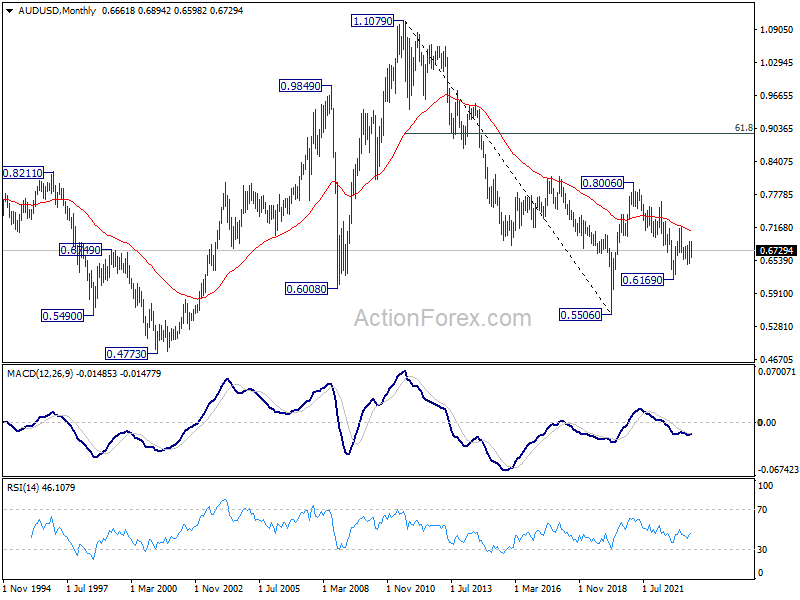
In the long term picture, fall from 0.8006 is seen as a corrective move to up rise from 0.5506 (2020 low). This correction could have completed at 0.6169. Sustained trading above 55 M EMA (now at 0.7085) will affirm this case, and indicate that rise from 0.5506 is ready to resume. However, firm break of 0.6169 will revive long term bearishness and turn focus back to 0.5506 low.
USD/CAD Weekly Outlook
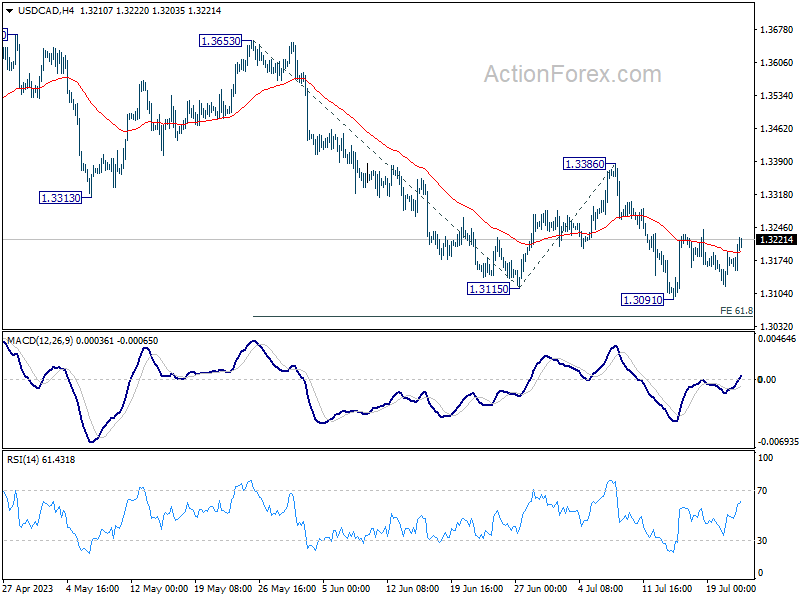
USD/CAD stayed in range trading above 1.3091 last week and outlook is unchanged. Initial bias remains neutral this week first. Further decline is expected as long as 1.3386 resistance holds. Break of 1.3091 will resume larger fall and target 61.8% projection of 1.3653 to 1.3115 from 1.3386 at 1.3054. However, firm break of 1.3386 will indicate near term reversal and turn outlook bullish.
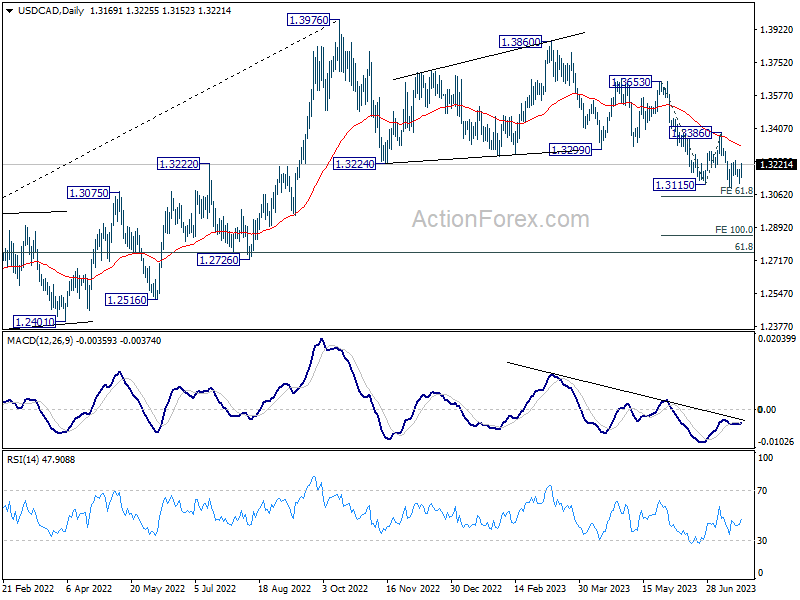
In the bigger picture, price actions from 1.3976 are viewed as a correction to up trend from 1.2005 (2021 low) only. But even so, deeper decline is expected as long as 1.3386 resistance holds. Further fall could be seen to 61.8% retracement of 1.2005 to 1.3976 at 1.2758. Meanwhile, break of 1.3386 will be a sign that the correction has completed and bring stronger rally back to retest 1.3976.
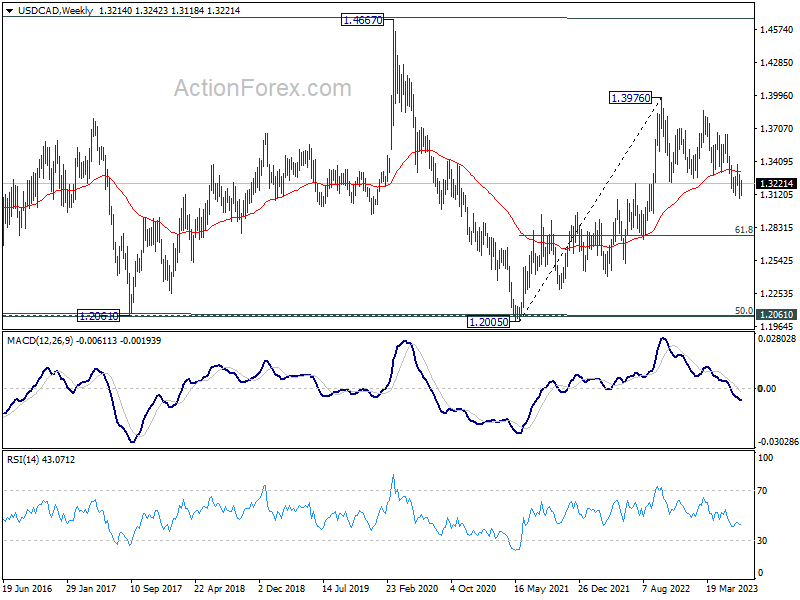
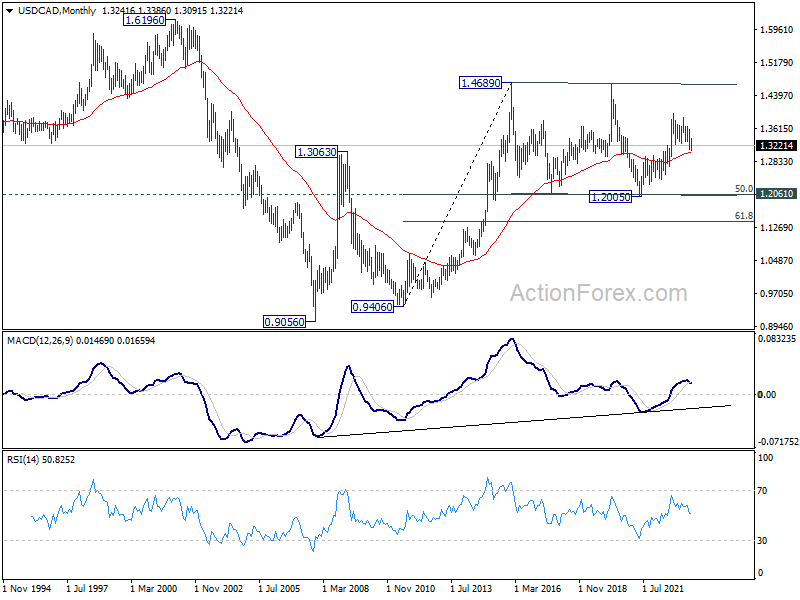
In the longer term picture, price actions from 1.4689 (2016 high) are seen as a consolidation pattern only, which might have completed at 1.2005. That is, up trend from 0.9506 (2007 low) is expected to resume at a later stage. This will remain the favored case as 55 M EMA (now at 1.3048) holds.
GBP/JPY Weekly Outlook
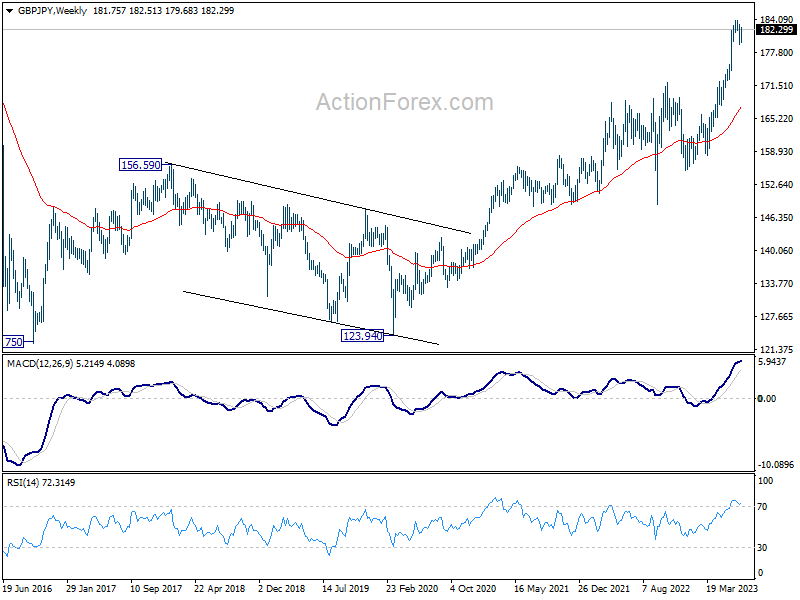
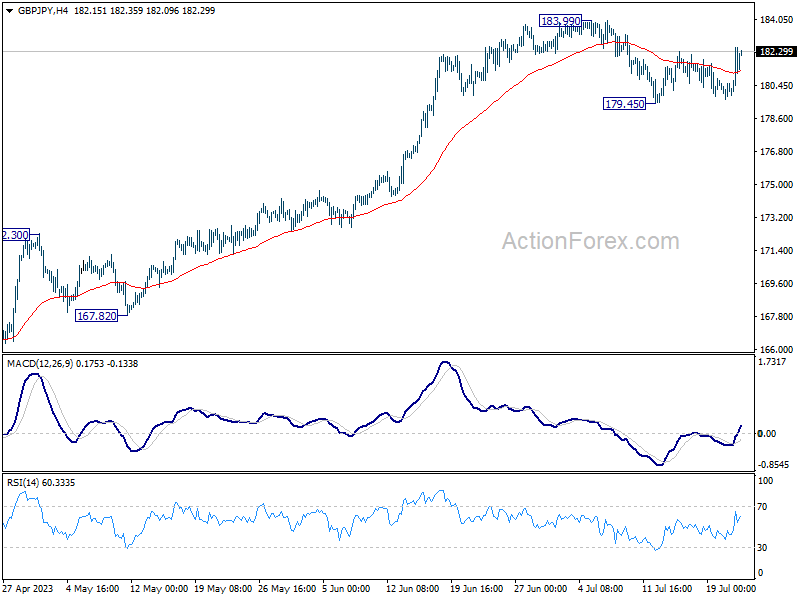
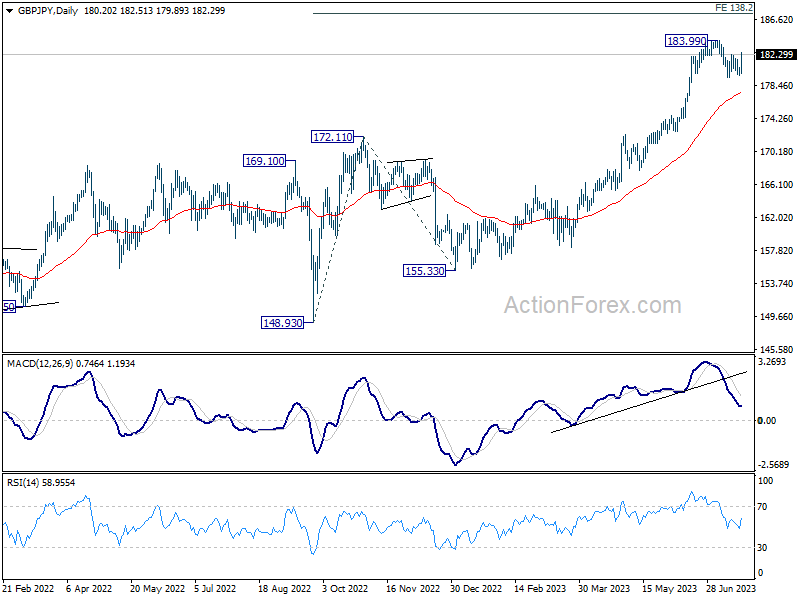
GBP/JPY stayed in range below 183.99 last week and outlook is unchanged. Initial bias is neutral this week first. On the downside, break of 179.45 will resume the correction from 183.90 to 55 D EMA (now at 177.57). On the upside, firm break of 183.99 high will resume larger up trend to 187.36 projection level.
In the bigger picture, as long as 172.11 resistance turned support holds, up trend from 123.94 (2020 low) is expected to continue. On resumption, next target is 138.2% projection of 148.93 to 172.11 from 155.33 at 187.36, and then 195.86 (2015 high). Nevertheless, firm break of 172.11 will argue that larger correction is already underway.
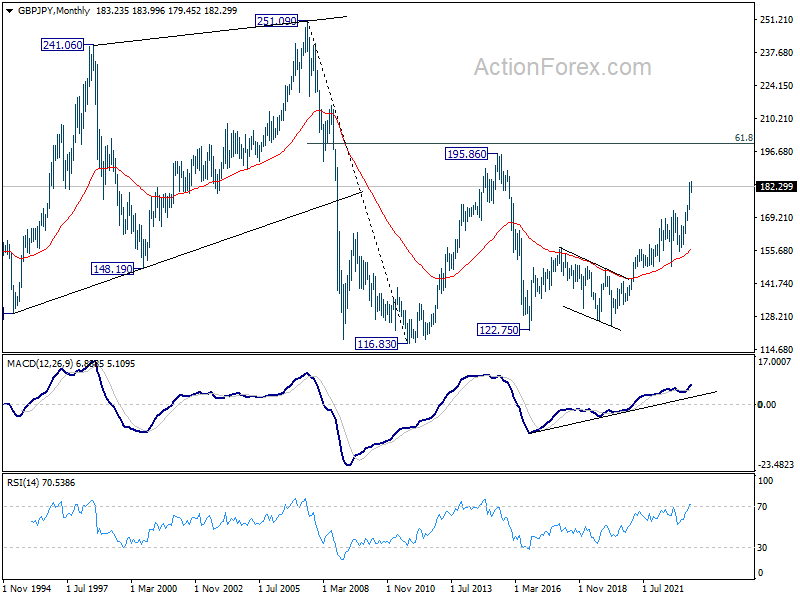
In the longer term picture, rise from 122.75 (2016 low) in still in progress to retest 195.86 (2015 high). Based on current momentum, break of 195.86 is in favor. But strong resistance could still be seen from 61.8% retracement of 251.09 (2007 high) to 116.83 (2011 low) at 199.80 to limit upside on first attempt.