
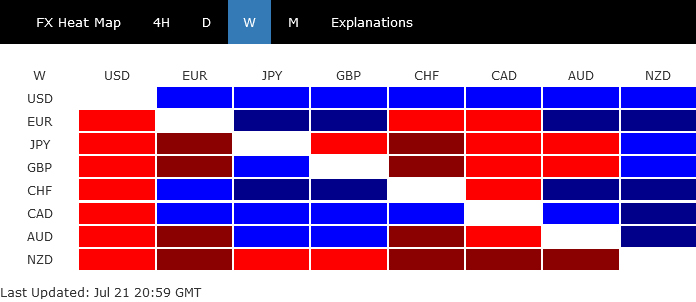
Dollar recovered broadly last week and it seemed to have emerged from its near-term selling climax. While it’s premature to call for bullish trend reversal, the greenback has likely entered at least a consolidation phase, with potential for a more robust recovery on the horizon. Dollar’s next move will likely hinge more on overall risk sentiment than the anticipated Fed rate hike. Riding on the coattails of resilient oil prices, Canadian Dollar secured its place as the second strongest, followed by Swiss Franc, which was further buoyed by against the beleaguered Sterling.
In contrast, last week saw significant sell-offs for both Sterling and Yen. However, their declines were overshadowed by New Zealand Dollar’s downturn. The Kiwi and Aussie currencies were both burdened by poor economic data from China, which dimmed recovery hopes for the world’s second-largest economy. However, Australian Dollar found some support in robust job data and ended the week mixed, along with Euro.
Dollar passed selling climax, now in consolidation mode
Last week could have marked a near term turning point for Dollar, as it appeared to have passed its selling climax, staging a rebound in the midst of a mixed risk sentiment in US stock markets. The late reversal in Japanese Yen the underperformance of Euro helped bolster the greenback’s position.
Despite these fluctuations, the basics remain the same. A 25bps hike by Fed at its meeting on the coming Wednesday should be a done deal. But the future beyond this decision is clouded with uncertainty. While Fed anticipates at least one more hike this year according to its own projections, futures markets remain highly skeptical.
It should also be reminded that the next FOMC meeting isn’t until September 20-21, leaving a substantial gap filled with several key data releases. These include PCE inflation data on July 28 and August 31, CPI on August 10 and September 13, along with non-farm payrolls on August 4 and September 1. Unless the first batch of data releases contains significant surprises, it is expected that Dollar may continue its consolidation and recovery, at least until Jackson Hole Symposium scheduled for August 24-26.
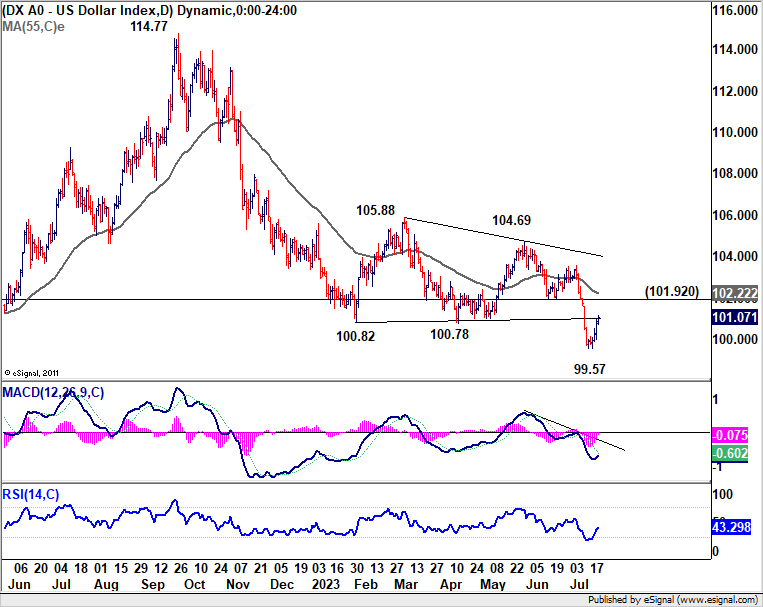
Technically, Dollar Index should have formed a short term bottom at 99.57 with last week’s rebound. But near term risk will stay on the downside for another fall as long as 101.92 support turned resistance holds. Break of 99.57 will resume larger down trend from 114.77.
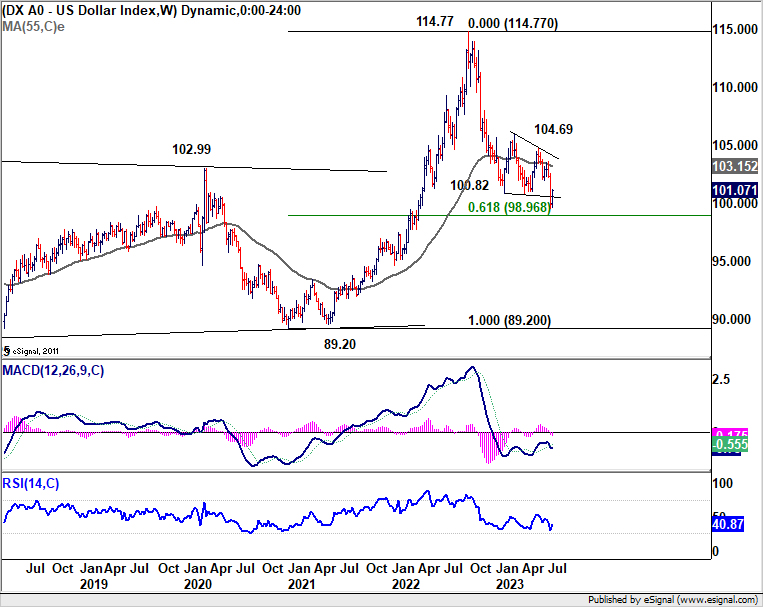
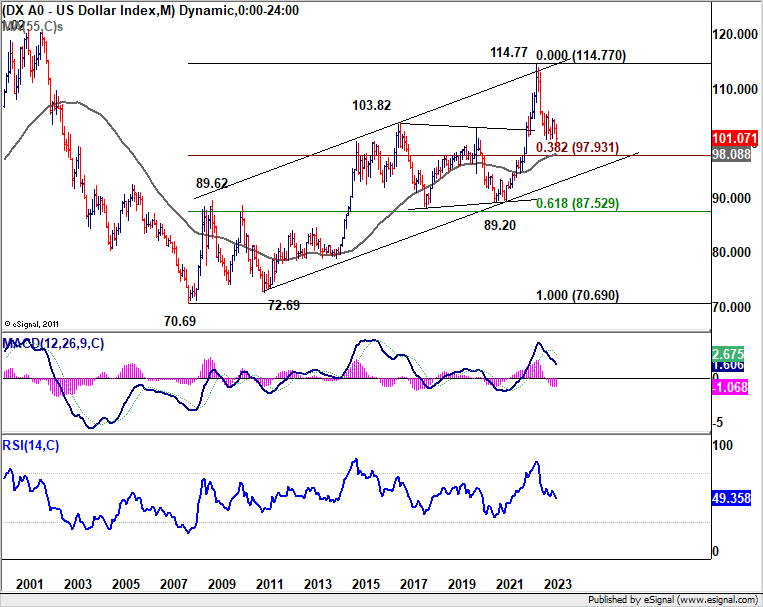
Still, in case of down trend extension, strong support is likely at around 98 handle to contain downside to bring a sustainable bounce or even reversal. There is 61.8% retracement of 89.20 (2021 low) to 114.77 at 98.96. 55 M EMA currently sits around 98.08. Even if DXY is correcting the up trend from 70.69 (2008 low), there is 38.2% retracement of 70.69 to 114.77 at 97.93.
NASDAQ down, reversing or just reacting to rebalancing?
In the short term, the fate of Dollar is likely to be heavily influenced the overall risk sentiment in the market. Over a longer time horizon, performance of the greenback will hinge on whether the current rally in stocks is a “bear market rally”, and has almost run its course.
Last week witnessed mixed sentiment, with DOW extending its winning streak to ten consecutive sessions, while tech-heavy NASDAQ fell notably due to disappointing earnings reports from some leading tech companies. At the same time, the impact of NASDAQ rebalancing on the index remains uncertain.
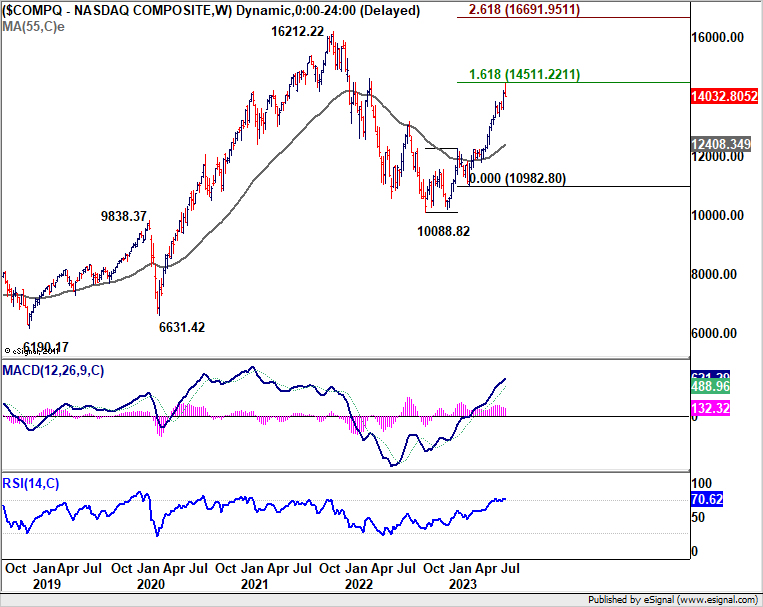
Technically, a short term top should have formed at 14445.66 last week, ahead of 161.8% projection of 10088.82 to 12269.55 from 10982.80 at 14511.22. Considering bearish divergence condition in D MACD, break of 13864.06 support will indicate that deeper correction is underway to 55 D EMA (now at 13332.61).
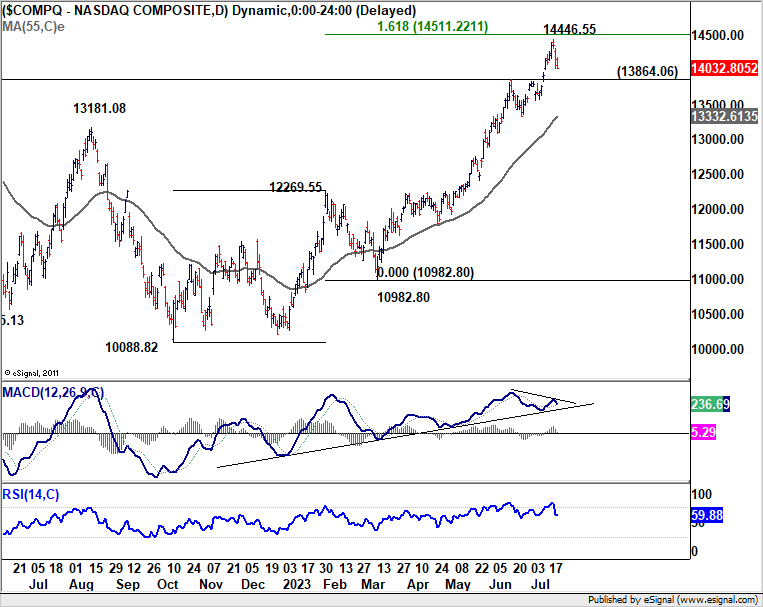
More importantly, rise from 10088.82 is currently seen as the second leg of the pattern from 16212.22 (2021 high). Sustained trading below 55 D EMA will raise the chance that the third leg has started and target 55 W EMA (now at 12408.34 next). Developments in the rest of July and early August would be crucial.
Sterling took a hit on lower BoE rate expectations
Sterling came under considerable pressure last week, trailing as one of the poorest performers, following data that revealed a more significant slowdown in UK CPI for June than anticipated. However, with both headline and core readings at 7.9% and 6.9% respectively, these figures are unquestionably still extraordinarily high. Despite this, the market has begun to temper expectations for another 50bps rate hike on August 3. Furthermore, the likelihood of interest rate eventually reaching 7% mark has diminished, even admitted by the most hawkish BoE observers.
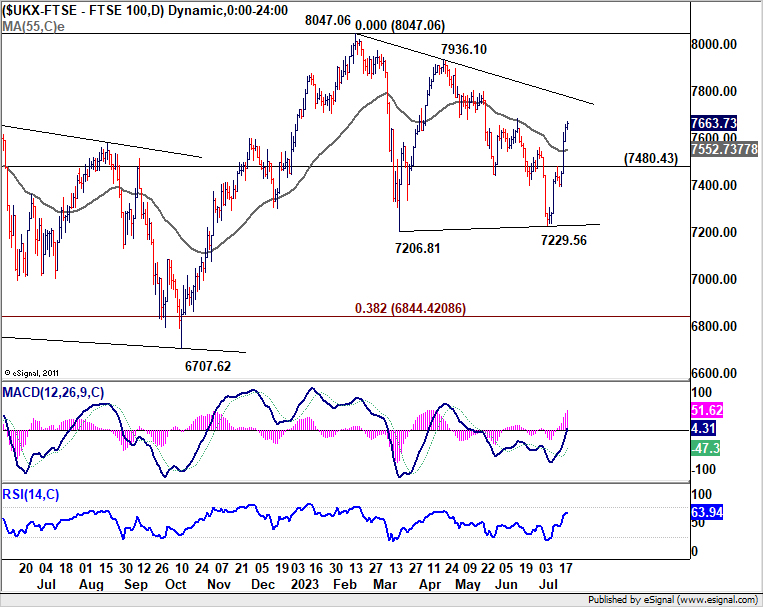
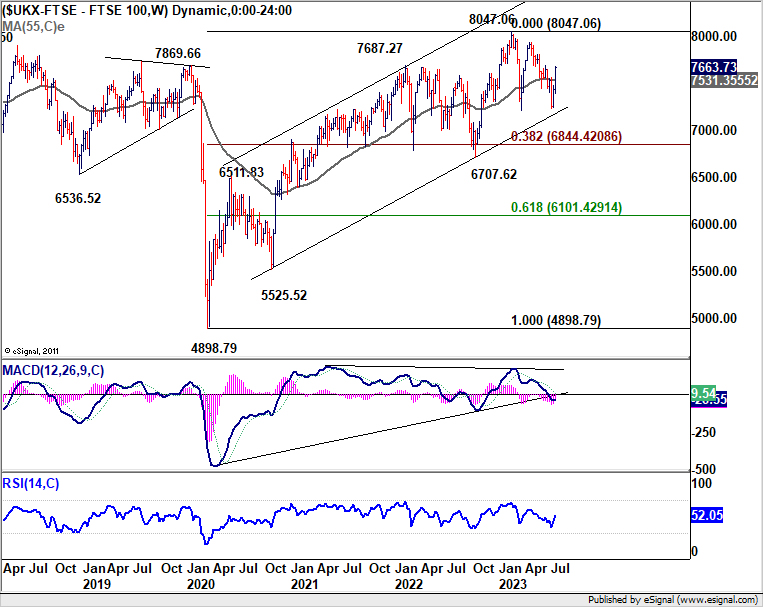
FTSE jumped sharply last week as helped by expectations of a lower BoE peak rate, as well as the depreciation in Sterling. Technically, the base case now is that consolidation from 8047.06 has completed with three waves down to 7229.56. Further rise is in favor in near term trend line resistance (now at around 7780). Sustained break there will bolster the case for upside breakout to new record high above 8047.06. Meanwhile, break of 7480.43 to bring another falling leg to make the corrective pattern a triangle. But downside should be contained by 7206.81/7229.56 support zone.
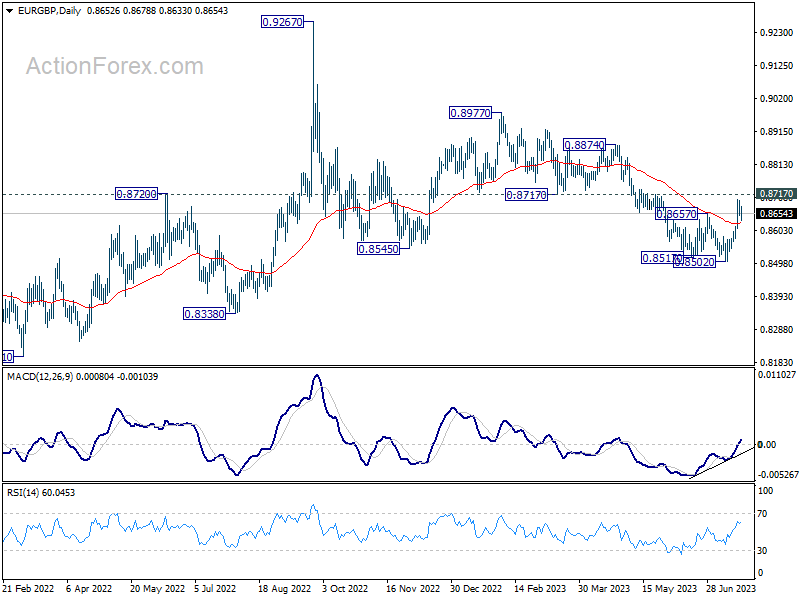
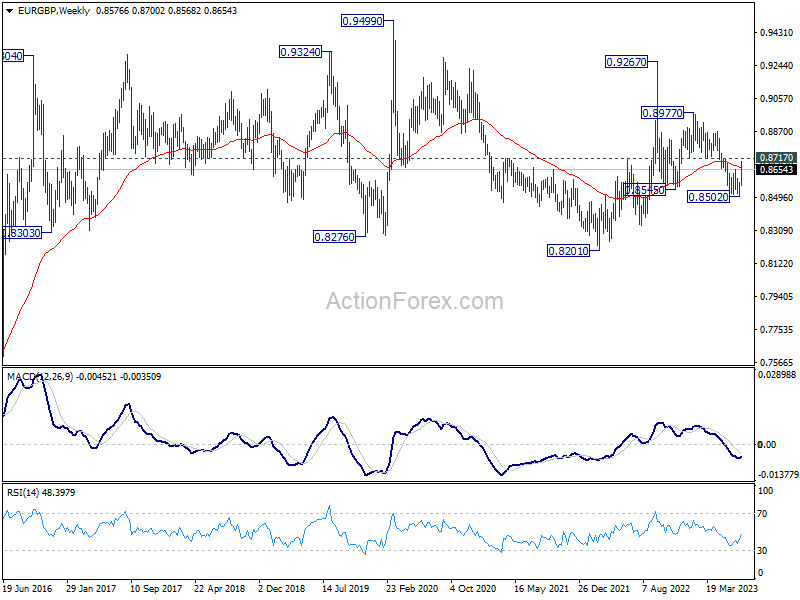
EUR/GBP’s strong rebound and break of 0.8657 resistance confirmed short term bottoming at 0.8502. Fall from 0.8977 might have completed its five-way sequence. More importantly, the corrective pattern from 0.9267 (2022 high) could have completed with three waves down to 0.8502 too. Near term focus is now on 0.8717 support turned resistance. Decisive break there will add more credence to this bullish case and pave the way back to 0.8977 next.
Yen plummeted following BoJ speculations
Yen was sold off steeply towards the end of last week, after Reuters reported that BoJ is leaning towards holding monetary policy unchanged at upcoming meeting on Friday, including the parameters for yield curve control. Five unnamed sources were quoted in the report. BoJ could be adopting a strategy to allow businesses to earn enough profits to maintain the pace of wages hike next year, to keep inflation sustainable. The report came after Japanese data showing headline and core inflation figures staying at relatively the same level in June as in May.
CAD/JPY’s strong rebound last week argues that pull back from 109.48 has completed at 104.22 already. More importantly, solid support was seen from 55 D EMA (now at 104.98) and 38.2% retracement of 94.04 to 109.48 at 103.58. The development dampens the view that rise from 94.04 is the second leg of the pattern from 110.87, which has completed. In other words, there is now chance that rise from 94.04 is an impulsive move itself. On the upside, break of 109.48 will target 110.87 high first, and decisive break there will resume larger up trend from 73.80.
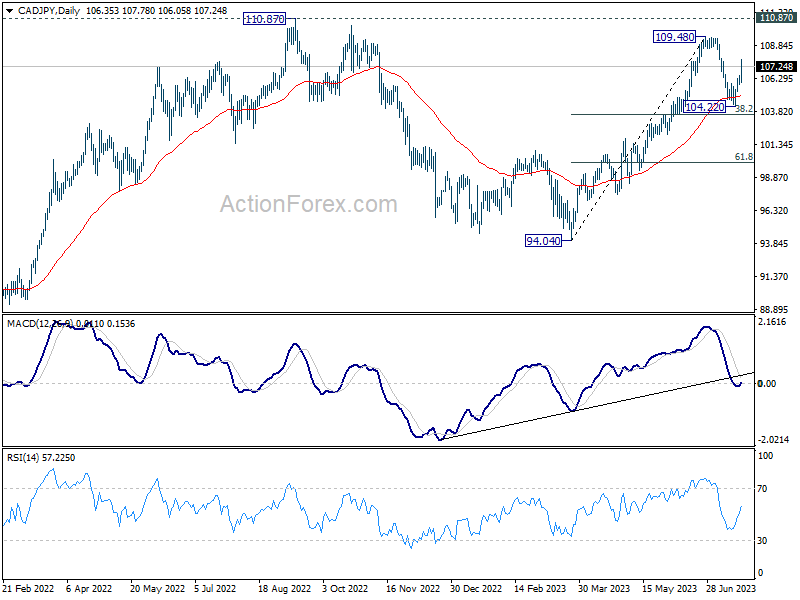
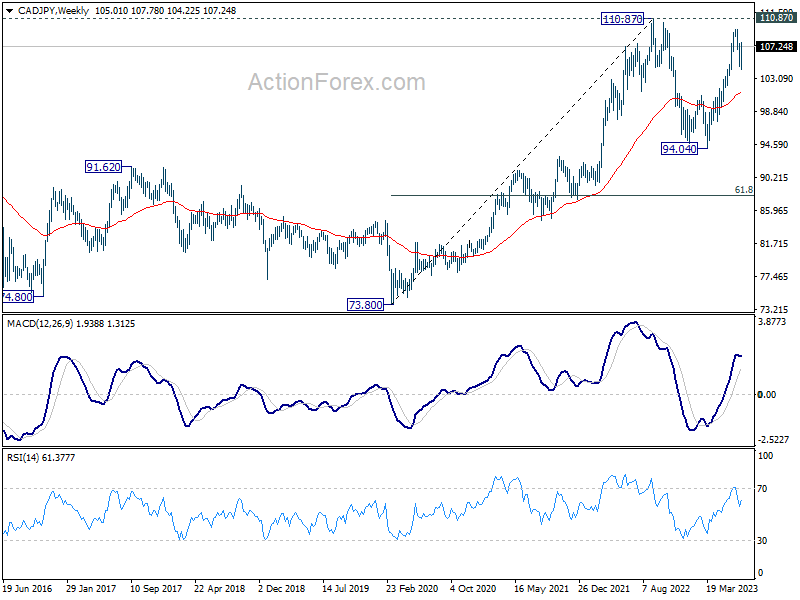
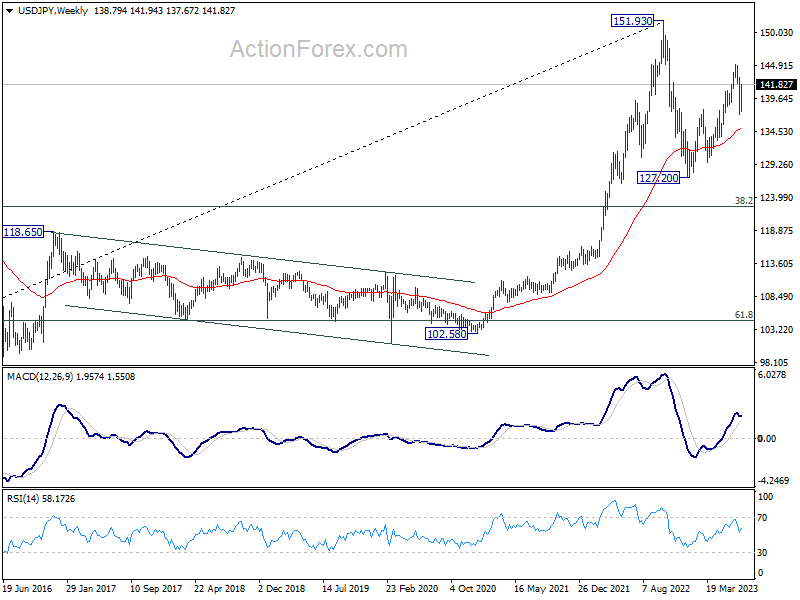
Correspondingly, the current USD/JPY’s rise from 127.20 is viewed as the second leg of the corrective pattern from 151.93. However, an upside breakout in CAD/JPY could temper this view and increase the likelihood of USD/JPY eventually breaking through 151.93 high in a corresponding move.
EUR/USD Weekly Outlook
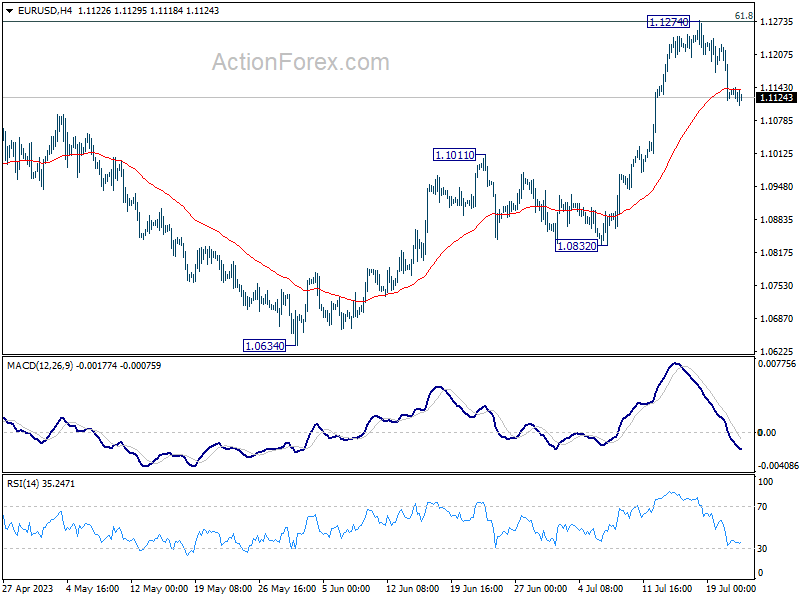
EUR/USD’s pull back last week indicates short term topping at 1.1274, after hitting 1.1273 fibonacci level. Initial bias stays on the downside this week for deeper fall. But outlook will remain bullish as long as 1.1011 resistance turned support holds. Above 1.1274 will resume larger up trend from 0.9534. However, firm break of 1.1011 will argue that larger correction is underway.
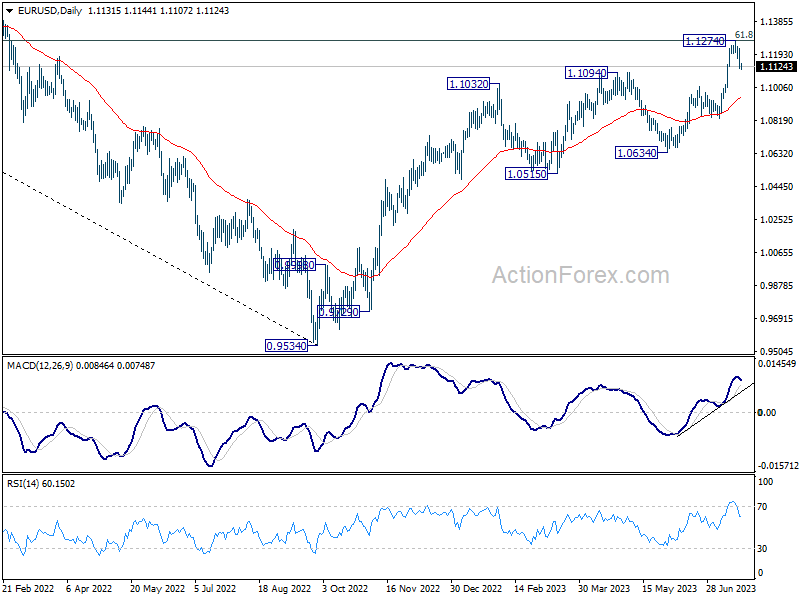
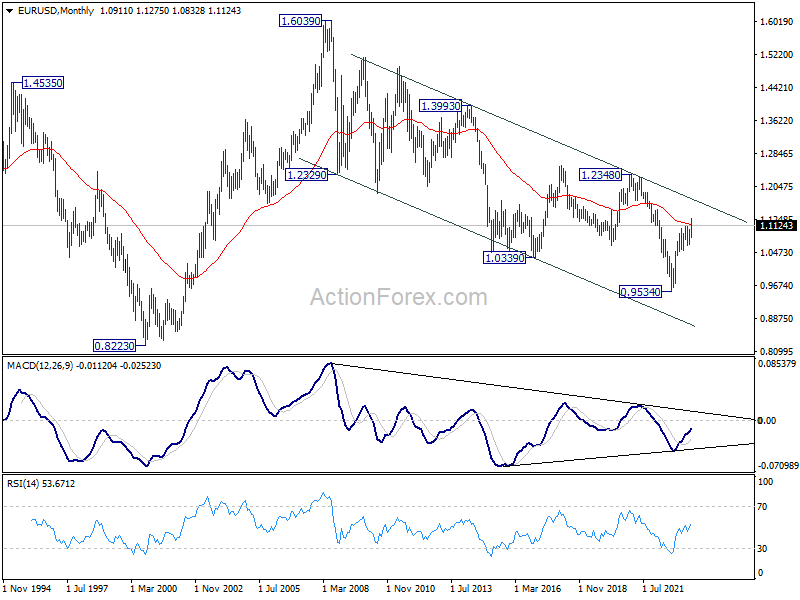
In the bigger picture, rise from 0.9534 is still expected to continue as long as 1.1011 resistance turned support holds. Decisive break of 61.8% retracement of 1.2348 (2021 high) to 0.9534 at 1.1273 will solidify the case of bullish trend reversal and target 1.2348 resistance next. However, firm break of 1.1011 will bring deeper fall back to 1.0634 support next.
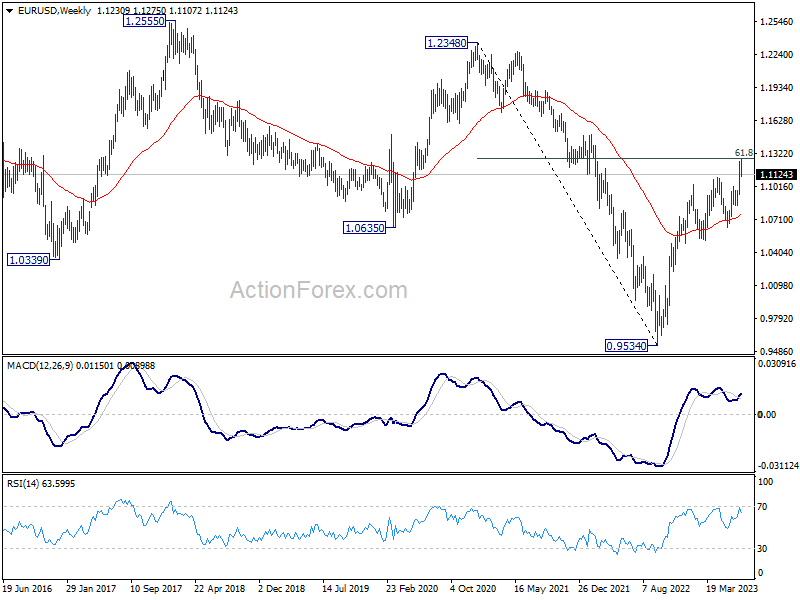
In the long term picture, focus stays on 55 M EMA (now at 1.1141). Rejection by this EMA will revive long term bearishness. However, sustained break above here will be affirm the case of long term bullish reversal and target 1.2348 resistance for confirmation.


