

Sample Category Title
Most Important Task for Chair Powell and Lagarde to Provide Investors With Some ‘Conditional Guidance’
Markets
Markets on Friday mostly showed no big swings with investors mainly looking forward to this week’s eco data and central bank decisions. There were no data with market moving potential in the US or EMU. In Japan, CPI (ex fresh food 3.3% Y/Y, ex fresh food and energy 4.2%) was close to expectations. A few hours after the release, headlines from sources reported to have knowledge of the matter appeared on financial news wires indicating that the BOJ was likely to keep its policy of YCC unchanged at this week’s meeting. The comments pushed the yen substantially lower. USD/JPY closed at 141.73 (was 140.30 area before the headlines). UK June retail sales (0.7% M/M) were slightly stronger than expected, but the impact on gilts (changes between -3.9 bps 2-y and +1.7 bps 30-y) and sterling (close EUR/GBP 0.8656) were limited. In the end US yields declined up to 1.5 bps (10-y). German yields eased between 1.6 bps (30-y) and 3.0 bps (2-y). After Thursday’s USD rebound, the dollar remained well bid. DXY gained from the 100.80 area to close at 101.07. The decline in EUR/USD slowed (close 1.1124). US equities didn’t go anywhere (S&P +0.03%). The EuroStroxx 50 succeeded a modest 0.4% gain.
Asian markets this morning show a mixed picture with Japan outperforming and China underperforming. With respect to the latter, investors are still pondering the effect from expected additional and monetary stimulus. The yuan today again weakens (USD/CNY 7.194). Treasuries are trading little changed and so does the dollar. Today, investors will keep a close eye at the PMI confidence indicators. Both the US and EMU composite measure are expected to ease slightly further respectively from 53.2 to 53.0 and from 49.9 to 49.6. We don’t have much reason to take a different view from the consensus for the US. After last month’s rather steep setback in Europe, we assume that enough bad news might be discounted for now. Whatever the outcome, probably a big surprise is needed for markets to place strong directional bets on Fed and ECB policy beyond this week’s decision. In both cases a 25 bps rate hike is a ‘fait accompli’. Most important task for Chair Powell and Lagarde to provide investors with some ‘conditional guidance’ on what is most likely to happen in September. We assume both to firmly keep the option for further tightening open. In such a scenario, especially the downside in short-term yields should be well protected. The dollar rebounded last week, but the technical picture didn’t change in a profound way. EUR/USD holds above the 1.1095 previous top. Short-term, USD gains might become more difficult from here.
News and views
Spanish snap elections yesterday were inconclusive. The early ballot was called by incumbent prime minister Sanchez after his PSOE socialist party suffered heavy losses in May’s local elections. PSOE gained 122 seats in the 350-seat chamber. With support from potential leftwing partners, Sanchez could secure 172 seats, still less than the 176 needed for a majority. The Partido Popular in pre-election polls was projected to become the clear victor but in the end only won 136 seats. With the support of the 33-seat big Vox, a rightwing alliance would deliver 169 of the spots. Technically, Sanchez could remain in power if other smaller parties, including Junts per Catalunya, would abstain in a vote of confidence. But this will probably come with important concessions to the separatist party. An election re-do is therefore the most likely outcome.
Japan’s service economy remains on a solid growth track, PMI’s showed this morning. The services series stabilized at 53.9 in July, from 54 in June. Details including new (export) orders and backlogs still showed growth, though weaker than in June, meaning activity was often fueled by the completion of existing orders. Employment fell from growth in a decline. Firms also signaled the softest degree of positive sentiment regarding the year-ahead outlook for activity since the start of the year. Manufacturing printed slightly deeper in contraction territory, from 49.8 to 49.4. New orders showed a steeper decline, employment weaker growth. The future, year-ahead output outlook was assessed less rosy than in June. Input price pressures in manufacturing eased, suggesting slowing cost inflation, but accelerated in the services sector. In both, however, output price pressures to the end consumer picked up. This may raise pressure on the BoJ to act, even though officials end last week suggested a change to policy at the July meeting this week isn’t likely. The Japanese yen barely reacted to the data with USD/JPY hovering around Friday’s closing levels of 141.53.
A Week Packed With Earnings and Central Bank Decisions
Last week ended on a caution note after the first earnings from Big Tech companies were not bad, but not good enough to further boost an already impressive rally so far this year. The S&P500 closed the week just 0.7% higher, Nasdaq slipped 0.6%, while Dow Jones recorded its 10th straight week of gains, the longest in six years, hinting that the tech rally could be rotating toward other and more cyclical parts of the economy as well.
This week, the earnings season continues in full swing. 150 S&P500 companies are due to announce their second quarter earnings throughout this week. Among them we have Microsoft, which is pretty much the main responsible of this year’s tech rally thanks to its ChatGPT, Meta, Alphabet, Visa, GM, Ford, Intel, Coca-Cola and some energy giants including Exxon Mobil and Chevron.
On the economic calendar, we have a busy agenda this week as well. Today, we will be watching a series of flash PMI figures to get a sense of how economies around the world felt so far in July, then important central bank meetings will hit the fan from tomorrow. The early data shows that both manufacturing and services in Australia remained in the contraction zone, as Japan’s manufacturing PMI dropped to a 4-month low in July. German figures could also disappoint those watching the EZ numbers.
On the central banks front, the Federal Reserve (Fed), the European Central Bank (ECB) and the Bank of Japan (BoJ) will meet this week, and the first two are expected to announce 25bp hike each to further tighten monetary conditions on both sides of the Atlantic.
Zooming into the Fed, activity on Fed funds futures gives almost 100% chance for this week’s 25bp hike. But many think that this week’s rate hike could be the last of this tightening cycle, as inflation is cooling. But the resilience of the US labour market, and household consumption will likely keep the Fed cautiously hawkish, and not announce the end of the tightening cycle this Wednesday. There is, on the contrary, a greater chance that we will hear Fed Chair Jerome Powell rectify the market expectations and talk about another rate hike in September or in November. Therefore, the risks tied to this week’s FOMC meeting are tilted to the hawkish side, and we have more chance of hearing a hawkish surprise rather than a dovish one. Regarding the market reaction, as this week’s Fed meetings falls in the middle of a jungle of earnings, stock investors will have a lot to price on their plate, so a hawkish statement from the Fed may not directly impact stock prices if earnings are good enough. Bond markets, however, will clearly be more vulnerable to another delay of the end of the tightening cycle. The US 2-year yield consolidates near the 4.85% level this morning, and risks are tilted to the upside. For the dollar, there is room for further recovery as the bearish dollar bets stand at the highest levels on record and a sufficiently hawkish Fed announcement could lead to correction and repositioning.
Elsewhere, another 25bp hike from the ECB is also seen as a done deal by most investors. What investors want to know is what will happen beyond this week’s meeting. So far, at least 2 more 25bp hikes were seen as almost certain by investors. Then last week, some ECB officials cast doubt on that expectation. Now, a September rate hike in the EZ is all but certain. The EURUSD remains under selling pressure near the 1.1120 this morning, the inconclusive Spanish election is adding an extra pressure to the downside.
Finally, the BoJ is expected to do nothing, again, this week. Japanese policymakers will likely keep the policy rate steady in the negative territory and the YCC policy unchanged. The recent U-turn in BoJ expectations, and the broad-based rebound in the US dollar pushed the USDJPY above the 140 again last Friday, and there is nothing to prevent the pair from re-testing the 145 resistance if the Fed is sufficiently hawkish and the BoJ is sufficiently dovish.
A Reversal of Fortunes for US Banks and Technology Stocks
- Prior underperforming US banks rallied last week where the SPDR Banks ETF rose by 6.76%, its best weekly gain seen in 14 months.
- The high growth technology concentrated Nasdaq 100, the top year-to-date performer, underperformed last week, dragged down by Tesla and Netflix ex-post earnings releases.
- Extreme positioning, and complacency bias in Nasdaq 100 increase the risk of a medium-term bearish reversal in technology stocks.
In the past two weeks, we have seen the latest Q2 earnings releases of the major US banks; JP Morgan, Bank of America, Wells Fargo, Citigroup, Goldman Sachs, Morgan Stanley, and one of the high-flying technology-related “Magnificent Seven”, Tesla as well as a Netflix. All the major banks beat earnings expectations except Goldman Sachs, but its disappointing earnings had been well-telegraphed by senior management in public speeches ahead of its result release.
Both Tesla and Netflix have managed to beat their bottom lines too. Interestingly, their respective share price performances ex-post earnings releases move in opposite directions as compared with the US banks. Based on last week’s performance for the week ended 21 July, all the major US banks recorded positive returns; JP Morgan (+3.46%), Bank of America (+9.86%), Wells Fargo (+5.51%), Citigroup (+2.84%), Goldman Sachs (+7.90%), Morgan Stanley (+9.59%) which in turn managed to have a positive spill-over effect to the broader US banking sector where the SPDR S&P Bank exchange-traded fund (ETF) recorded a weekly gain of +6.76% over the same period, its best return since the week of 23 May 2022.
In contrast, Tesla, and Netflix posted dismal weekly returns of -7.59% and -3.26% respectively as of the end of last Friday, 21 July which in turn triggered a negative feedback loop into the high growth, and technology-related broader stock indices; Nasdaq 100 (-0.90%) and iShares Semiconductor ETF (-1.44%).
Sentiment & positioning were significant contributors to Nasdaq 100 & US technology stocks’ underperformance
The main catalysts that contributed to the last week’s negative returns and underperformance of Nasdaq 100 and iShares Semiconductor ETF have been FOMO (“fear of missing out”), complacency, and extreme positioning based on a relative basis.
The Nasdaq 100 is the top-performing major stock index so far globally with a year-to-date gain of +41% as of 21 July versus a loss of -10.8% seen in the SPDR Banking ETF over the same period. Thus, technology-related equities and the Nasdaq 100 have attracted momentum chasers, especially for fund managers or market participants who missed the earlier run-up since March 2023 and the need to beat benchmark stock indices.
In addition, technology equities recorded an eight-week cumulative inflow of around US$15 billion that surpassed their cumulative peaks inflows of 2022 according to a recent BofA Global Investment Strategy research report.
Also, based on recency bias behavioral traits that extrapolate current year-to-date outperformance of Nasdaq 100 into the future, for the months ahead and even next year may have led to a higher level of complacency and extreme level of relative positioning.
US Technology stocks are at risk of further medium-term downside pressure & underperformance
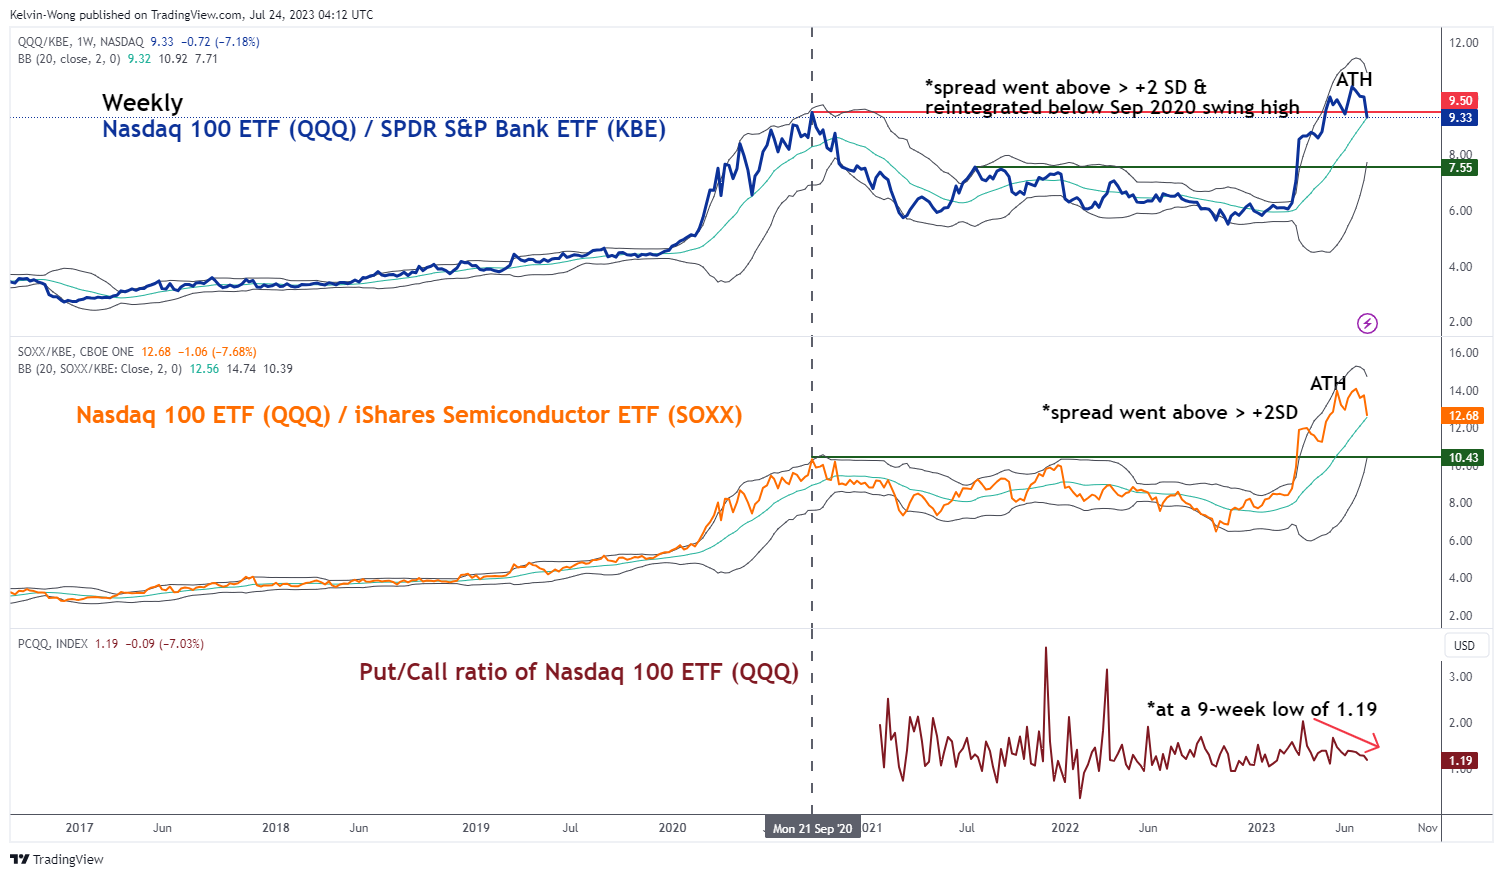
Fig 1: Relative performance of Nasdaq 100 & iShares Semiconductors over SPDR Banking, put/call ratio of Nasdaq 100 as of 21 Jul 2023 (Source: TradingView, click to enlarge chart)
The chart above plots the relative performance (ratio) of Nasdaq 100 ETF (QQQ) over SPDR Banking ETF (KBE), and iShares Semiconductor ETF (SOXX) over SPDR Banking ETF (KBE). Both the ratios QQQ over KBE and SOXX over KBE have reached fresh all-time levels in June 2023 and May 2023 respectively. In addition, these two ratios have hit more than two standard deviations above their respective 20-week moving averages which suggest relatively overstretched bullish positioning in the Nasdaq 100 and semiconductor stocks.
The current reading seen in the options market indicates the bullish momentum of Nasdaq 100 is likely to persist as indicated by the put-call ratio of Nasdaq 100 ETF (QQQ) which measures the number of traded put options divided by call options on the long side. A falling ratio indicates more calls are being bought versus puts which suggests market participants are not afraid of a falling market and have a bullish bias that prices may continue to rise, and if a negative event arises, it can easily reverse prices to the downside due to complacency of market participants. Vice versa for a rising put-call ratio.
Since 15 May 2023, the put-call ratio of Nasdaq 100 ETF (QQQ) has continued to decline and as of 17 July, it stood at 1.19 which is a nine-week low. Therefore, it will be a pivotal week ahead for Nasdaq 100 and the “Magnificent Seven” as market participants await the earnings results and guidance of Microsoft, Alphabet, Texas Instruments (out on Tuesday, 25 July), and Meta Platforms (out on Wednesday, 26 July).
AUD/USD Daily Report
Daily Pivots: (S1) 0.6707; (P) 0.6747; (R1) 0.6772; More...
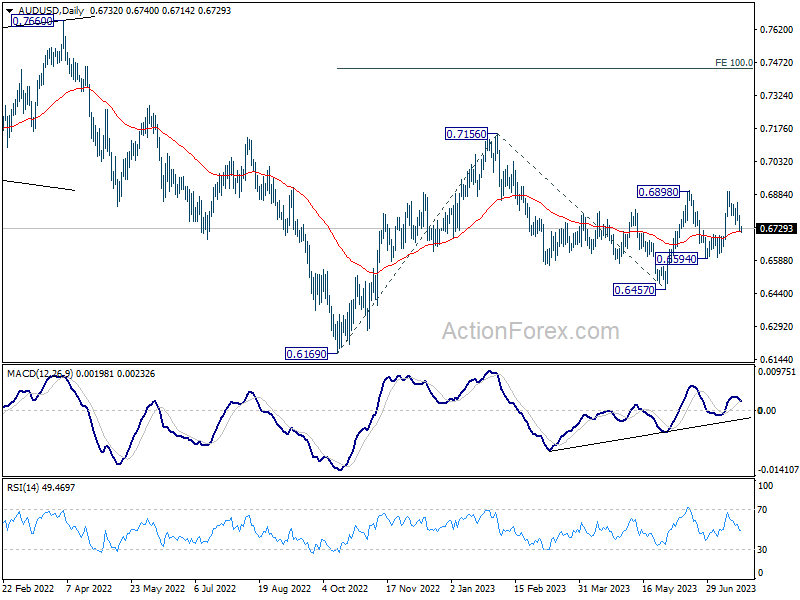
Intraday bias in AUD/USD remains mildly on the downside at this point. Deeper decline should be seen but downside should be contained above 0.6594 support to bring rebound. On the upside, above 0.6845 will bring retest of 0.6898 resistance. Decisive break there will resume rise from 0.6457.
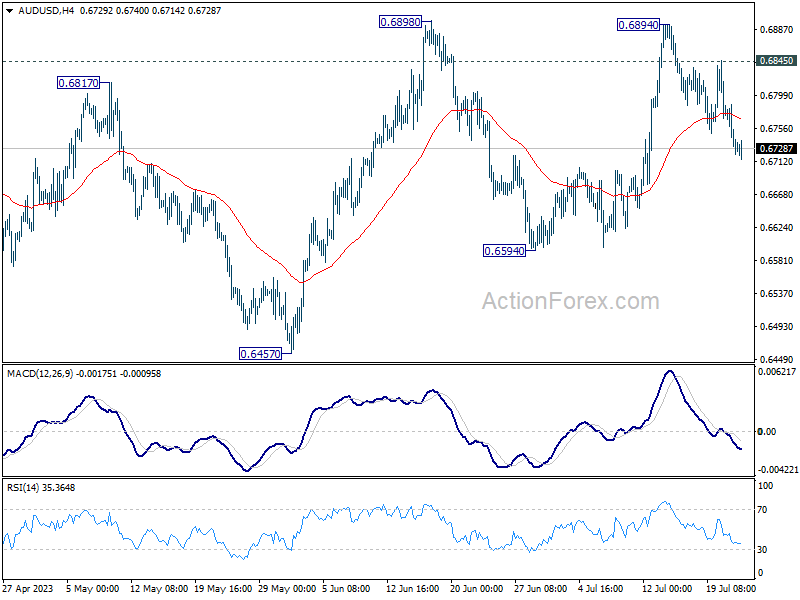
In the bigger picture, price actions from 0.7156 are seen as a correction to the rebound from 0.6169 (2022 low). Break of 0.6898 resistance will argue that rise from 0.6169 is ready to resume through 0.7156. Next target will be 100% projection of 0.6169 to 0.7156 from 0.6457 at 0.7444. For now, this will be the favored case as long as 55 D EMA (now at 0.6715) holds.
PMI Data Highlight Today, But Main Focuses on Fed and ECB Later in the Week
As a typical Monday Asian session commences, activity in the financial markets is somewhat muted. Nikkei is displaying a notable rise, although this primarily reflects continuation of its recent flip-flopping pattern within an established range, indicative of ongoing consolidation. A similar pattern is observed across other major Asian markets as well.
On the currency front, major currency pairs and crosses are bounded within Friday's range for now, with the market awaiting the next move. Releases of PMI data from Eurozone and UK might trigger some volatility today. However, traders' primary focus will undeniably be the upcoming high-profile events - FOMC and ECB interest rate decisions - set to unfold later this week, along with several key economic data releases.
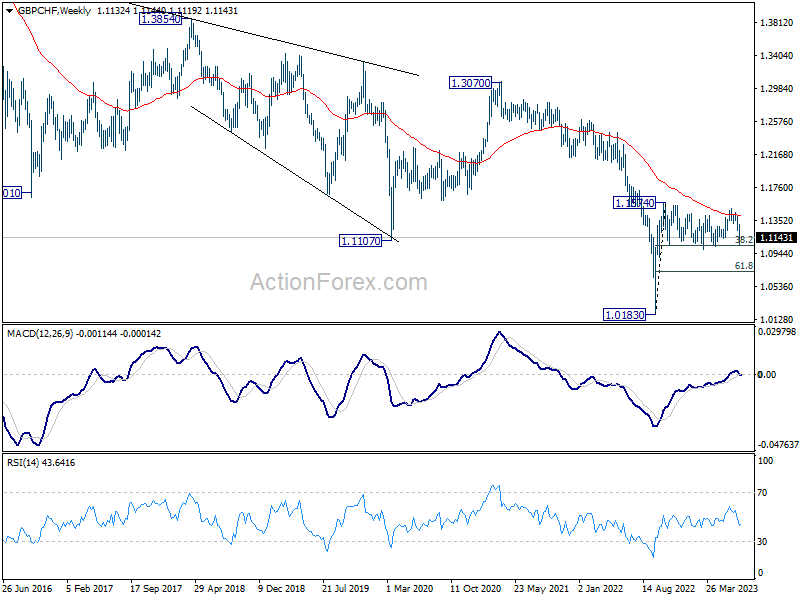
Technically, GBP/CHF will be an interesting one to watch as it's now trying to draw support from the bottom of the medium term range pattern. Strong support is still in favor at around 38.2% retracement of 1.0183 to 1.1574 at 1.1043 to bring rebound. However, sustained break of 1.1043, coupled with prior rejection by 55 W EMA (now at 1.1398) could be a rather bearish signal, which could trigger downside acceleration through 61.8% retracement at 1.0714.
In Asia, at the time of writing, Nikkei is up 1.26%. Hong Kong HSI is down -1.40%. China Shanghai SSE is up 0.08%. Singapore Strait Times is down -0.53%. Japan 10-year JGB yield is down -0.0039 at 0.462.
Japan PMI manufacturing slipped to 49.4, resurgence in price pressures
Japan's PMI Manufacturing dropped slightly from 49.8 in June to 49.4 in July, falling short of the forecasted 50.1. Despite this, PMI Manufacturing Output showed a minor uptick, climbing from 48.1 to 48.4. PMI Services saw a small decline, edging down from 54.0 to 53.9. Composite PMI, indicative of the overall health of the economy, was unchanged at 52.1.
Usamah Bhatti, an Economist at S&P Global Market Intelligence, highlighted that activity among private sector firms in Japan extended its growth streak for the seventh consecutive month. The persistence of this trend is largely attributable to steady and considerable improvement in service providers, while manufacturers reported a softer downturn at the dawn of Q3.
However, Bhatti underscored a less robust demand situation among private sector firms compared to the previous survey period. The latest data points to only a marginal increase in new orders, signaling a possible slowdown in demand.
Notably, the second half of 2023 has seen "renewed strengthening in price pressures" within the private sector. Pace of input price inflation has quickened for the first time since January. This trend is reflected across both manufacturing and service sectors, with both reporting steeper rates of output price inflation.
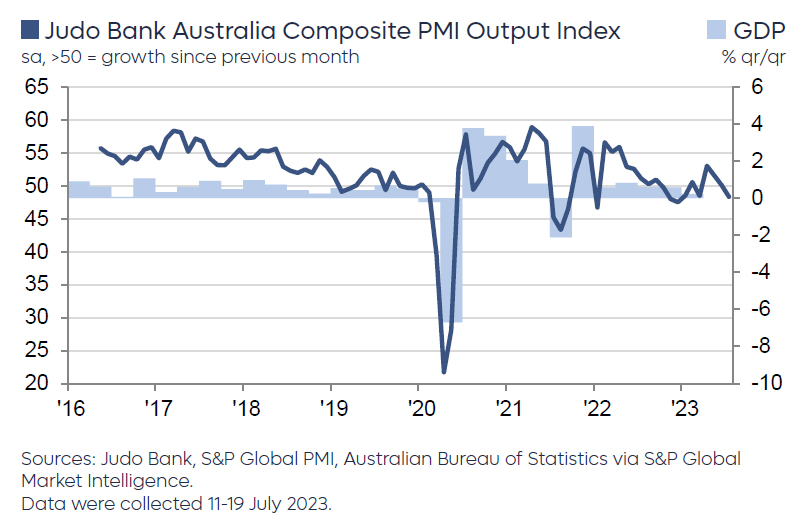
Australia PMI composite fell to 48, but still on narrow path for soft landing
Australia's PMI Manufacturing recorded a mild uptick in July, rising from 48.2 to 49.6, marking a 5-month high, but still falling short of the expansionary threshold of 50. Concurrently, PMI Services took a downward turn from 50.3 to 48.0, hitting a 7-month low. Consequently, Composite PMI, a measure of combined sectors, dipped from 50.1 to 48.3, which is also a 7-month low.
Warren Hogan, Chief Economic Advisor at Judo Bank, attributed the soft July figures predominantly to a dip in business activity in the services sector, which had previously been on a recovery path in 2023. But the "Australian economy remains on the 'narrow path' for a soft landing."
The July Flash report raised some concerns regarding inflation. Despite the slowdown in activity, price indicators trended higher, particularly within the services sector. These inflationary signals remain elevated, pointing to a potential inflation rate of around 4-5%, substantially exceeding RBA's target of 2% to 3%.
Hogan noted that the disinflationary trend evident throughout 2022 "appears to have ceased". As such, July figures will provide critical insights into whether Australia's inflation aligns with the declining trends seen in other countries recently, or if the nation is "set to experience a more sticky inflation trend in 2023/24."
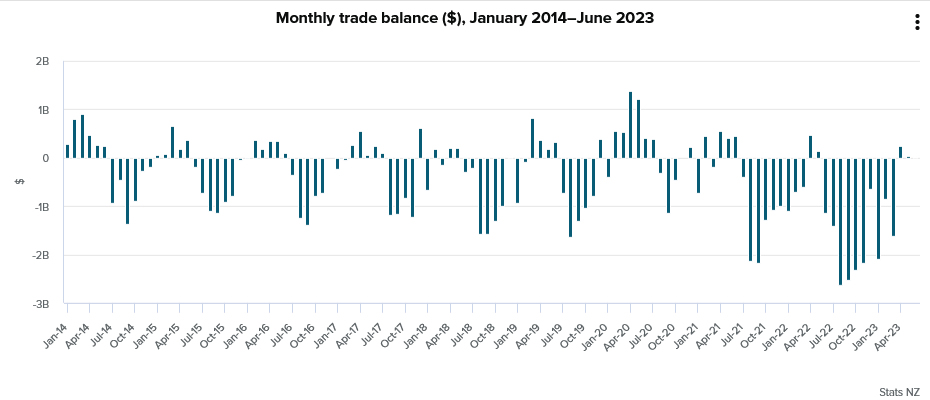
NZ goods exports up 1.3% yoy in Jun, imports down -14% yoy
In June 2023, New Zealand's goods exports observed a modest rise of 1.3% yoy, an equivalent of NZD 84m, taking the total to NZD 6.3B. Conversely, the nation witnessed a significant drop in goods imports by -14.0% yoy, or NZD -1.1B, reducing the total to NZD 6.3B. This left the monthly trade balance at a surplus of NZD 9m, notably below market expectations of NZD 235m.
A deeper look into the country's top trading partners unveiled mixed outcomes in exports. June 2023 saw a decline in total exports to China by NZD -124m (-7.2% yoy), and to EU by NZD -98m (-20%). Moreover, exports to Japan also slipped by NZD -56m (-13%). On a positive note, exports to Australia and US increased by NZD 190m (30%) and NZD 91m (13%) respectively.
In terms of imports, there were notable reductions across the board. China, one of New Zealand's principal import partners, witnessed a drop by NZD -232m (-16% yoy), while EU observed a decrease of NZD -100m (-9.2%). Furthermore, imports from Australia and US fell by NZD -93m (-12%) and NZD -96m (-14%) respectively. South Korea recorded the most substantial decline in exports to New Zealand, with a drop of NZD -136m (-26%).
Fed and ECB hikes could be non-eventual, lots of data to digest
The upcoming week will see high anticipation as both Fed and ECB are widely expected to raise interest rates by 25bps, pushing the rates to 5.25-5.50% and 4.25% respectively. However, both monetary institutions have reached a stage where their subsequent decisions will heavily hinge on data trends. With their next monetary policy meetings scheduled for mid-September, this week's messages are anticipated to be largely non-committal. Although the pledge to combat inflation will be reiterated, neither institution is likely to provide a clear indication of their next move, which will depend on incoming data and new economic projections in September. Thus, these meetings might eventually play out as non-events.
In other central bank activities, BoJ is expected to hold its monetary policy steady this week, including maintaining the current yield cap at 0.50%. BoC will also release summary of deliberations from its last meeting.
The upcoming week will also be bustling with economic data releases. Investors will be closely watching Monday's PMIs from Australia, Japan, Eurozone, UK, and US. Other key data to watch for during the week include US GDP, consumer confidence and PCE inflation, Germany's Ifo business climate and Gfk consumer sentiment, Canadian GDP, as well as Australia's CPI and retail sales.
Here are some highlights for the week:
- Monday: New Zealand trade balance; Australia PMIs; Japan PMIs; Eurozone PMIs; UK PMIs; US PMIs.
- Tuesday: Germany Ifo business climate; US house price index, consumer confidence.
- Wednesday: Japan corporate services price index; Australia CPI; Swiss Credit Suisse economic expectations; Eurozone M3 money supply; US new home sales; BoC minutes; FOMC rate decision.
- Thursday: Australia import prices; Germany Gfk consumer sentiment; ECB rate decision; US GDP, jobless claims, durable goods orders, trade balance, pending home sales.
- Friday: Japan Tokyo CPI, BoJ rate decision; Australia PPI, retail sales; France GDP; Germany CPI flash; Swiss KOF economic barometer; Canada GDP; US personal income and spending and PCE inflation, employment cost index.
AUD/USD Daily Report
Daily Pivots: (S1) 0.6707; (P) 0.6747; (R1) 0.6772; More...
Intraday bias in AUD/USD remains mildly on the downside at this point. Deeper decline should be seen but downside should be contained above 0.6594 support to bring rebound. On the upside, above 0.6845 will bring retest of 0.6898 resistance. Decisive break there will resume rise from 0.6457.
In the bigger picture, price actions from 0.7156 are seen as a correction to the rebound from 0.6169 (2022 low). Break of 0.6898 resistance will argue that rise from 0.6169 is ready to resume through 0.7156. Next target will be 100% projection of 0.6169 to 0.7156 from 0.6457 at 0.7444. For now, this will be the favored case as long as 55 D EMA (now at 0.6715) holds.
Economic Indicators Update
| GMT | Ccy | Events | Actual | Forecast | Previous | Revised |
|---|---|---|---|---|---|---|
| 22:45 | NZD | Trade Balance NZD Jun | 9M | 235M | 46M | 52M |
| 23:00 | AUD | Manufacturing PMI Jul P | 49.6 | 48.2 | ||
| 23:00 | AUD | Services PMI Jul P | 48 | 50.3 | ||
| 00:30 | JPY | Manufacturing PMI Jul P | 49.4 | 50.1 | 49.8 | |
| 07:15 | EUR | France Manufacturing PMI Jul P | 46.1 | 46 | ||
| 07:15 | EUR | France Services PMI Jul P | 48.4 | 48 | ||
| 07:30 | EUR | Germany Manufacturing PMI Jul P | 41.2 | 40.6 | ||
| 07:30 | EUR | Germany Services PMI Jul P | 53.1 | 54.1 | ||
| 08:00 | EUR | Eurozone Manufacturing PMI Jul P | 43.5 | 43.4 | ||
| 08:00 | EUR | Eurozone Services PMI Jul P | 51.5 | 52 | ||
| 08:30 | GBP | Manufacturing PMI Jul P | 46.1 | 46.5 | ||
| 08:30 | GBP | Services PMI Jul P | 53.1 | 53.7 | ||
| 13:45 | USD | Manufacturing PMI Jul P | 46.3 | |||
| 13:45 | USD | Services PMI Jul P | 54.4 |
Technical Outlook and Review
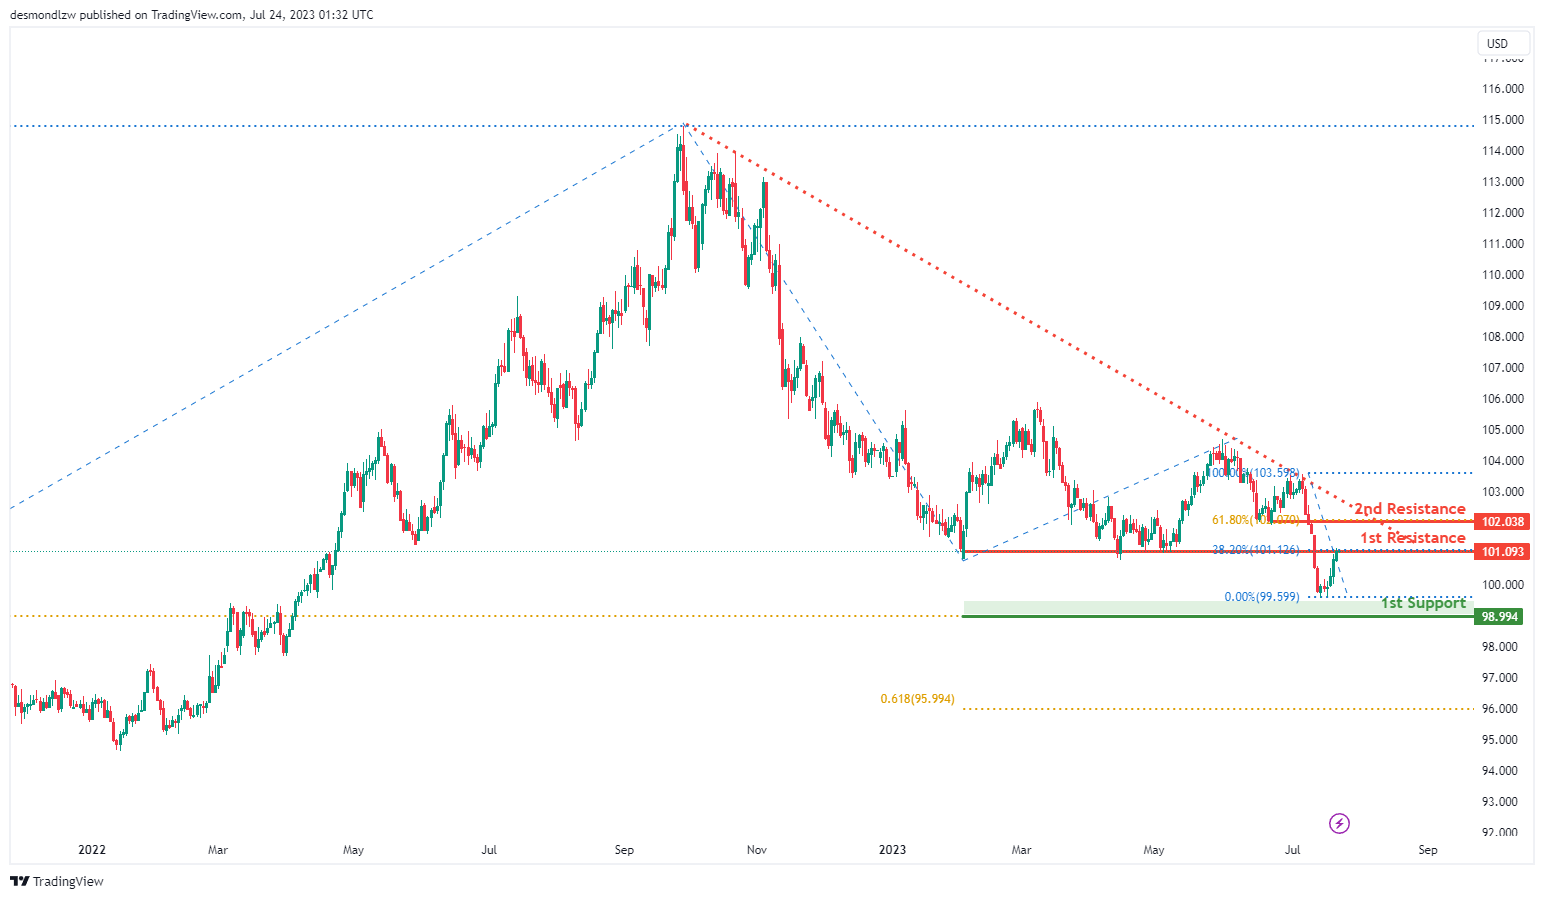
DXY:
The DXY (US Dollar Index) chart indicates a bearish overall momentum, attributed to the price being below a significant descending trend line, suggesting a potential continuation of the bearish trend.
The price may potentially experience a bearish reaction off the 1st resistance level at 101.09, which coincides with the 38.20% Fibonacci retracement, leading to a drop towards the 1st support at 101.03, representing the 61.80% Fibonacci retracement.
Additionally, the 2nd resistance at 102.03 acts as a pullback resistance, aligned with the 61.80% Fibonacci retracement, and could further hinder any upward movement. These resistance and support levels are critical in gauging potential price reactions.
EUR/USD:
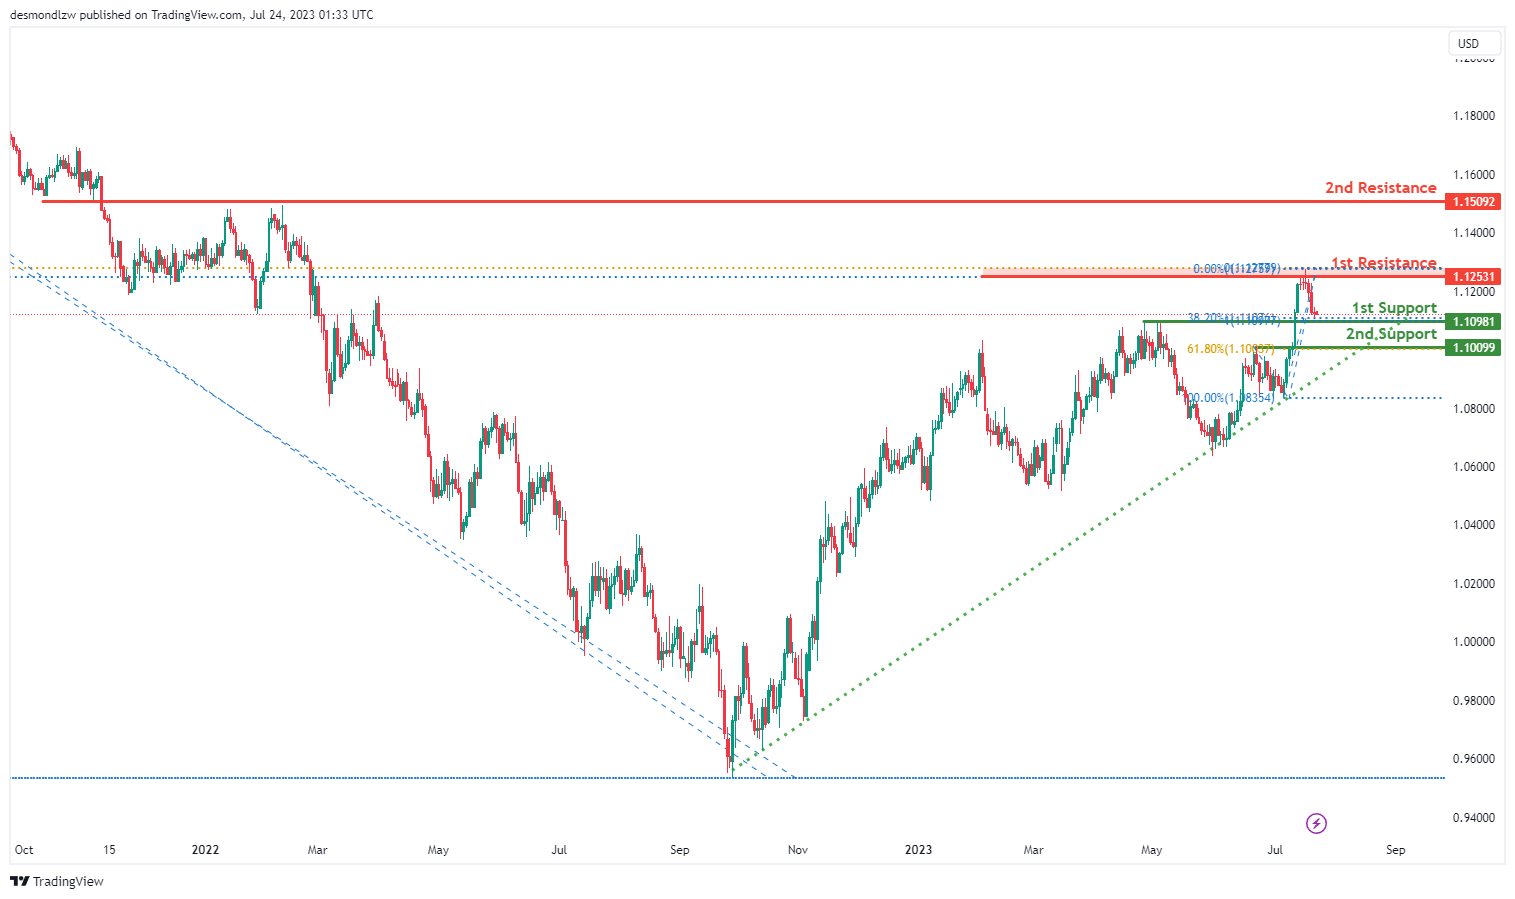
The EUR/USD chart demonstrates a bullish momentum, with the price above a significant ascending trend line, indicating the possibility of further upward movement.
A potential scenario is a bullish bounce off the 1st support level at 1.1098, aligned with the 38.20% Fibonacci retracement, leading the price towards the 1st resistance at 1.1253. This resistance level coincides with the 61.80% Fibonacci retracement and the 100% Fibonacci projection, adding to its significance.
Additionally, the 2nd support at 1.1009 is another pullback support, corresponding to the 61.80% Fibonacci retracement, while the 2nd resistance at 1.1509 acts as an overlap resistance. These levels may play crucial roles in potential price movements.
EUR/JPY:
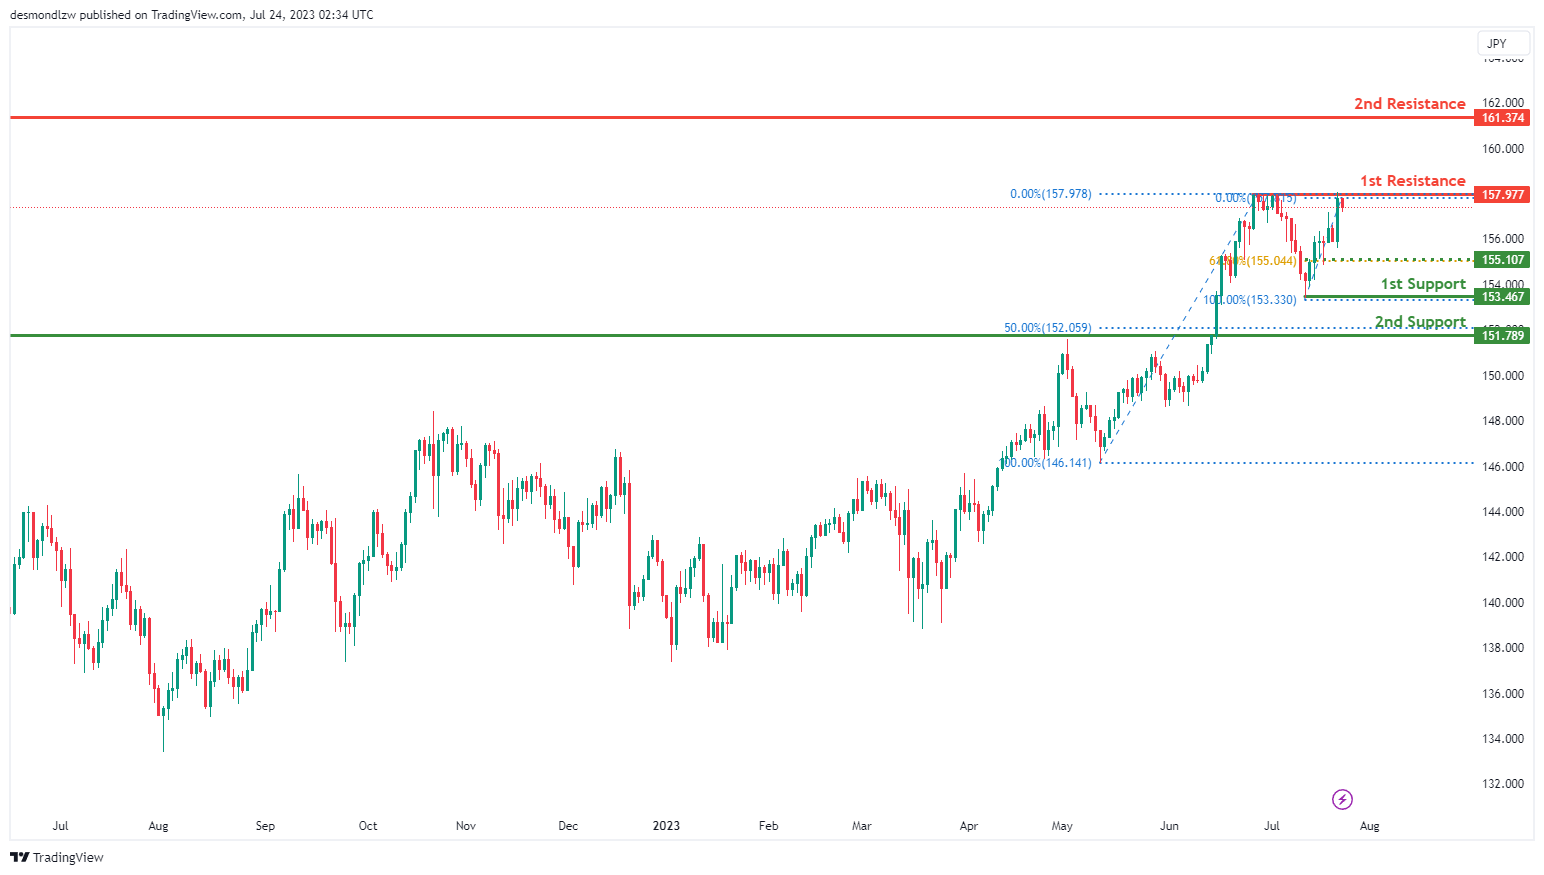
The EUR/JPY instrument is currently displaying a bearish trend. The chart suggests that the price might potentially continue its bearish momentum towards the 1st support level.
The 1st support level is identified at 153.46, which acts as a swing low support and could potentially provide a buffer against further price declines.
If the price further descends, the 2nd support level is located at 151.78, identified as an overlap support, which could provide additional assurance against further price decline.
In the event the price starts to ascend, it could face resistance at 157.97, which is defined by a multi-swing high resistance. If the price surpasses this, the 2nd resistance at 161.37, identified as an overlap resistance, could pose the next substantial barrier to price increases.
An intermediate support level is also present at 155.10, which corresponds to a 61.80% Fibonacci retracement, adding to its significance as a potential support level in the event of price drops.
EUR/GBP:
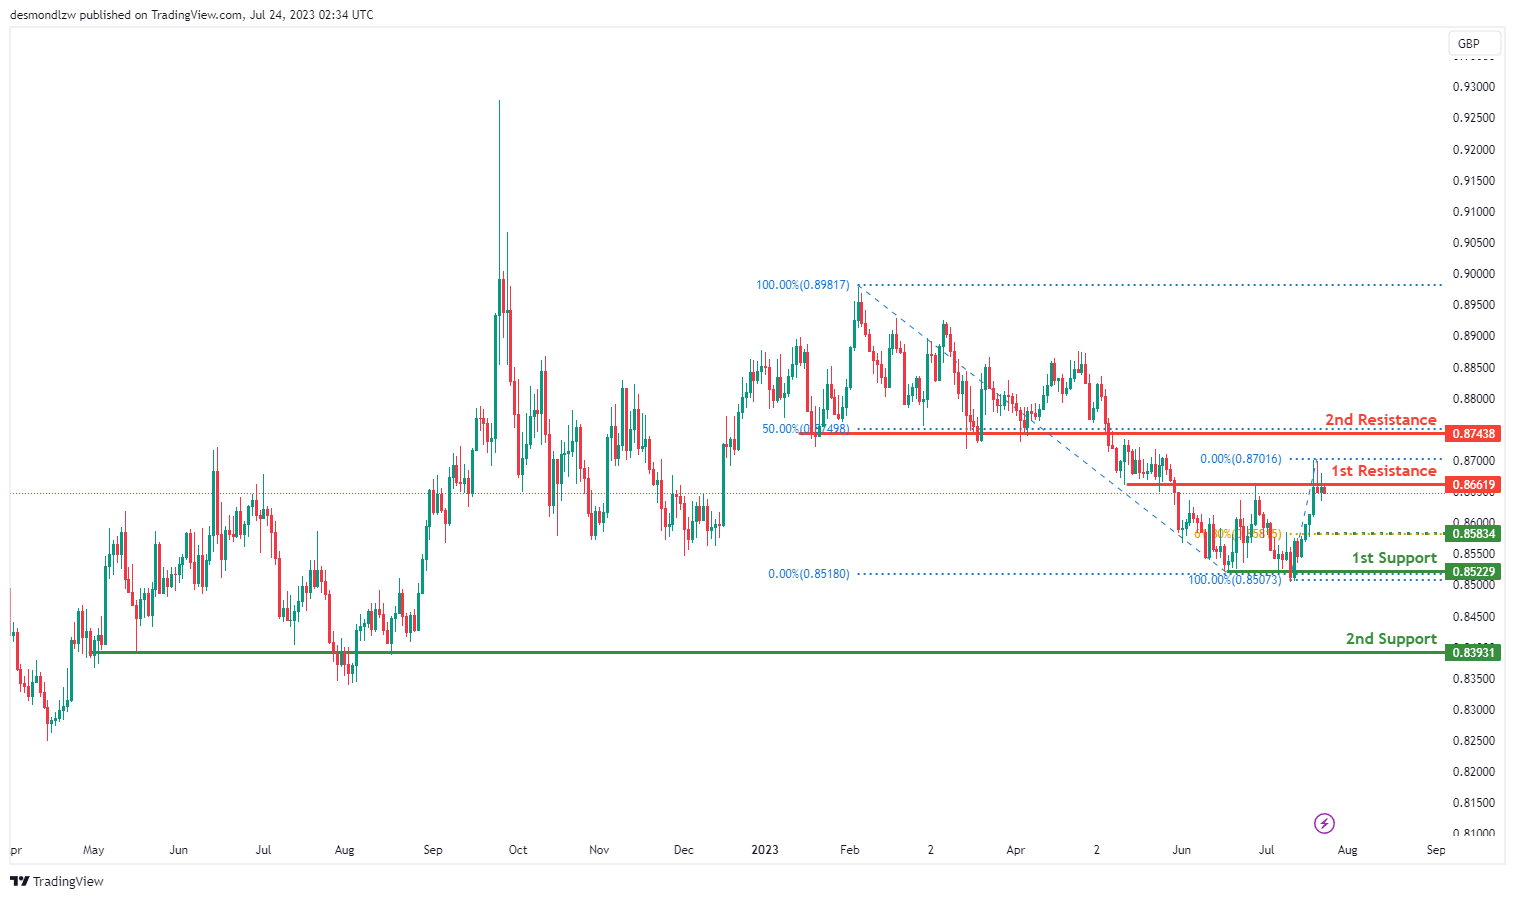
The EUR/GBP pair is currently showing a bearish momentum, suggesting that the price could potentially bounce off the 1st resistance and drop to the 1st support level.
The 1st support level is at 0.8522 and serves as an overlap support, which could provide a degree of price stability. In case the price drops further, the 2nd support at 0.8393, also an overlap support, could offer an additional barrier against further price decline.
In terms of resistance, the 1st resistance level is at 0.8661, and it’s identified as an overlap resistance that could challenge any potential bullish movement. Should the price manage to surpass this, the 2nd resistance at 0.8743, a pullback resistance, could pose the next significant obstacle.
Additionally, there’s an intermediate support at 0.8580, recognized as an overlap support and aligns with the 61.80% Fibonacci retracement level, potentially offering another point of price stability.
GBP/USD:
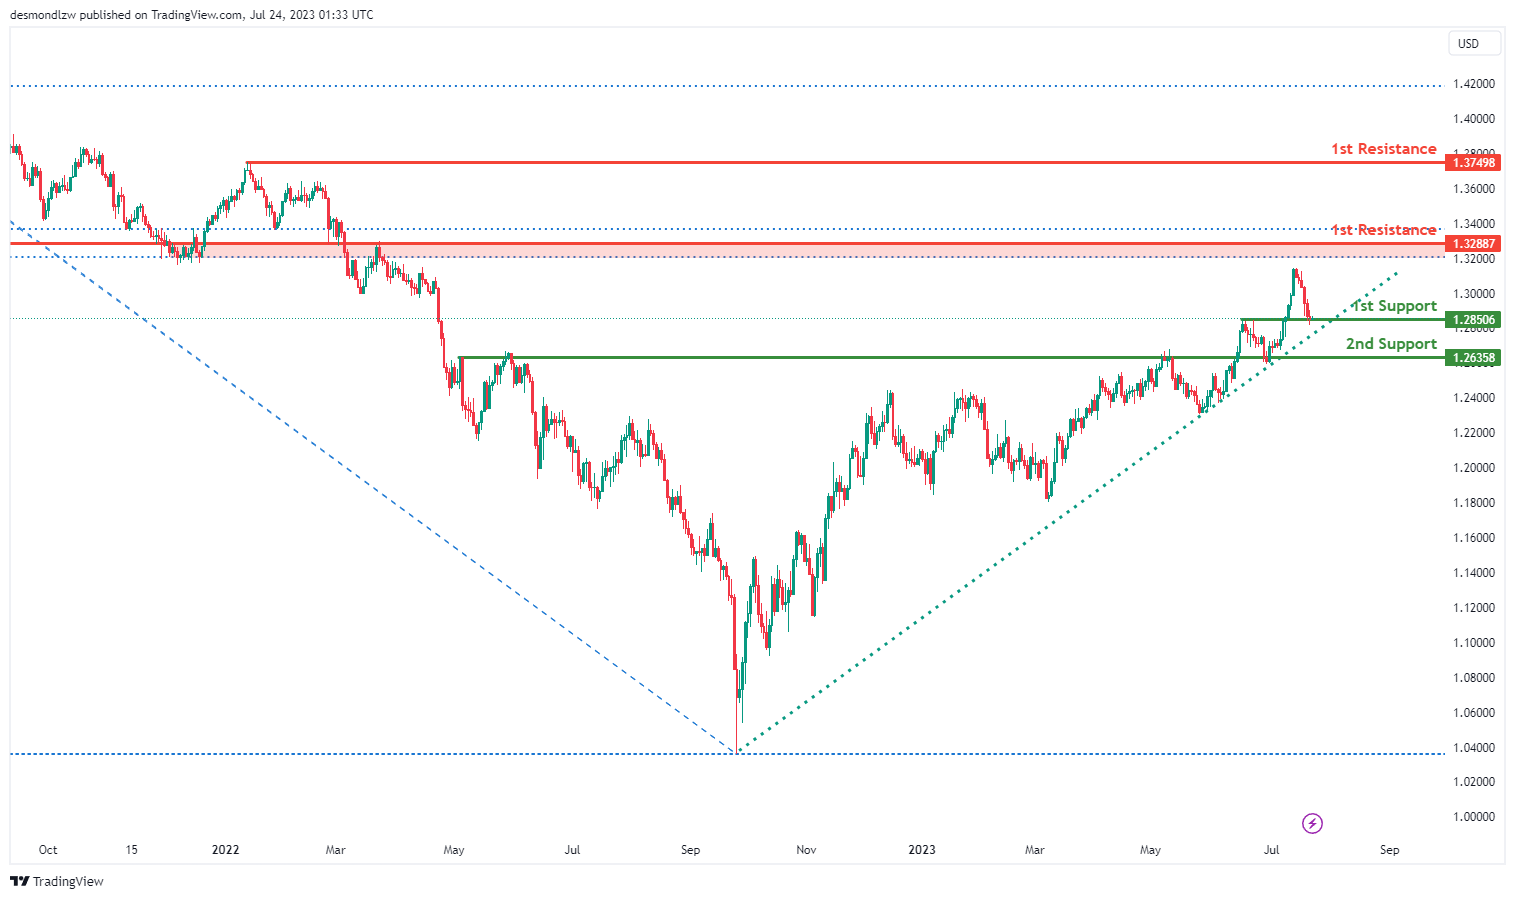
The GBP/USD chart indicates a bullish momentum, with the price above a significant ascending trend line, suggesting the potential for further upward movement.
A possible scenario is a bullish bounce off the 1st support level at 1.2850, recognized as a pullback support, leading the price towards the 1st resistance at 1.3288. This resistance level is an overlap resistance.
Additionally, the 2nd support at 1.2635 acts as another pullback support, while the 2nd resistance at 1.3749 represents a swing high resistance. These levels may play crucial roles in shaping the price’s movement.
GBP/JPY:
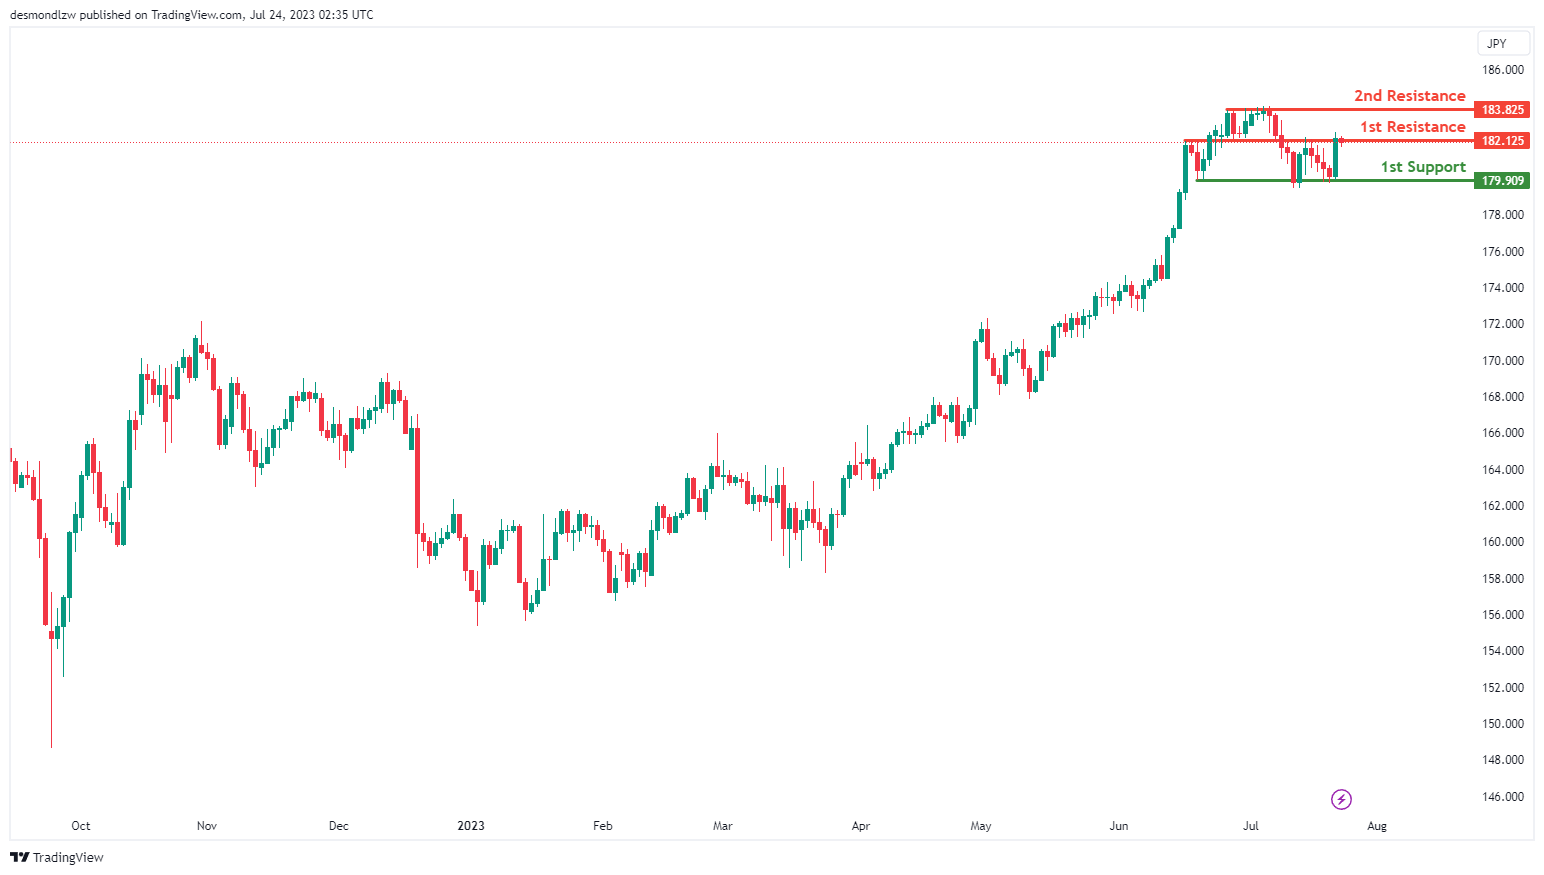
The GBP/JPY pair is currently exhibiting a bearish momentum, suggesting that the price could potentially continue its descent towards the 1st support level.
The 1st support level is situated at 179.91 and is identified as a multi-swing low support, which could offer a degree of stability against further price declines.
On the other hand, if the price starts to ascend, it could face resistance at 182.12, identified as an overlap resistance that might act as a barrier to the price’s upward movement. If the price manages to breach this, the 2nd resistance at 183.82, defined by a multi-swing high resistance, could pose the next significant hurdle to further price increases.
USD/CHF:
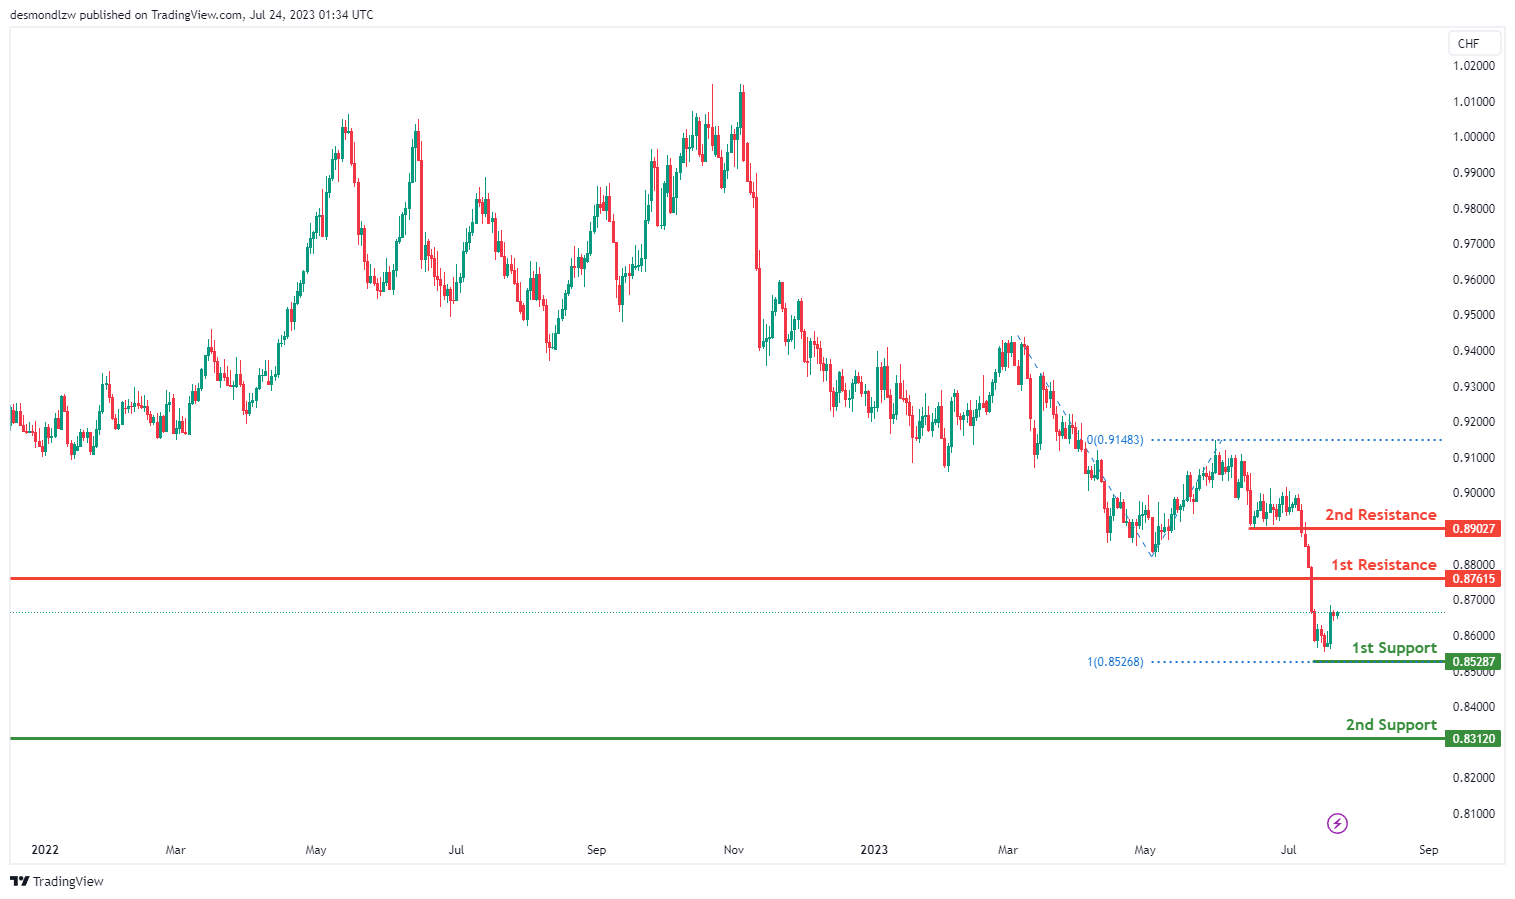
The USD/CHF chart displays a bullish momentum, suggesting the possibility of continued upward movement.
Potential scenario: The price could experience a bullish continuation towards the 1st resistance at 0.8728, identified as a pullback resistance. If the bullish trend persists, the 2nd resistance at 0.8902, which also serves as a pullback resistance, might pose another obstacle to further upward progress.
On the other hand, the 1st support at 0.8528 is significant as it aligns with the 100% Fibonacci projection, while the 2nd support at 0.8312 represents a swing low support. These support levels could act as crucial points in determining the price’s movement.
USD/JPY:
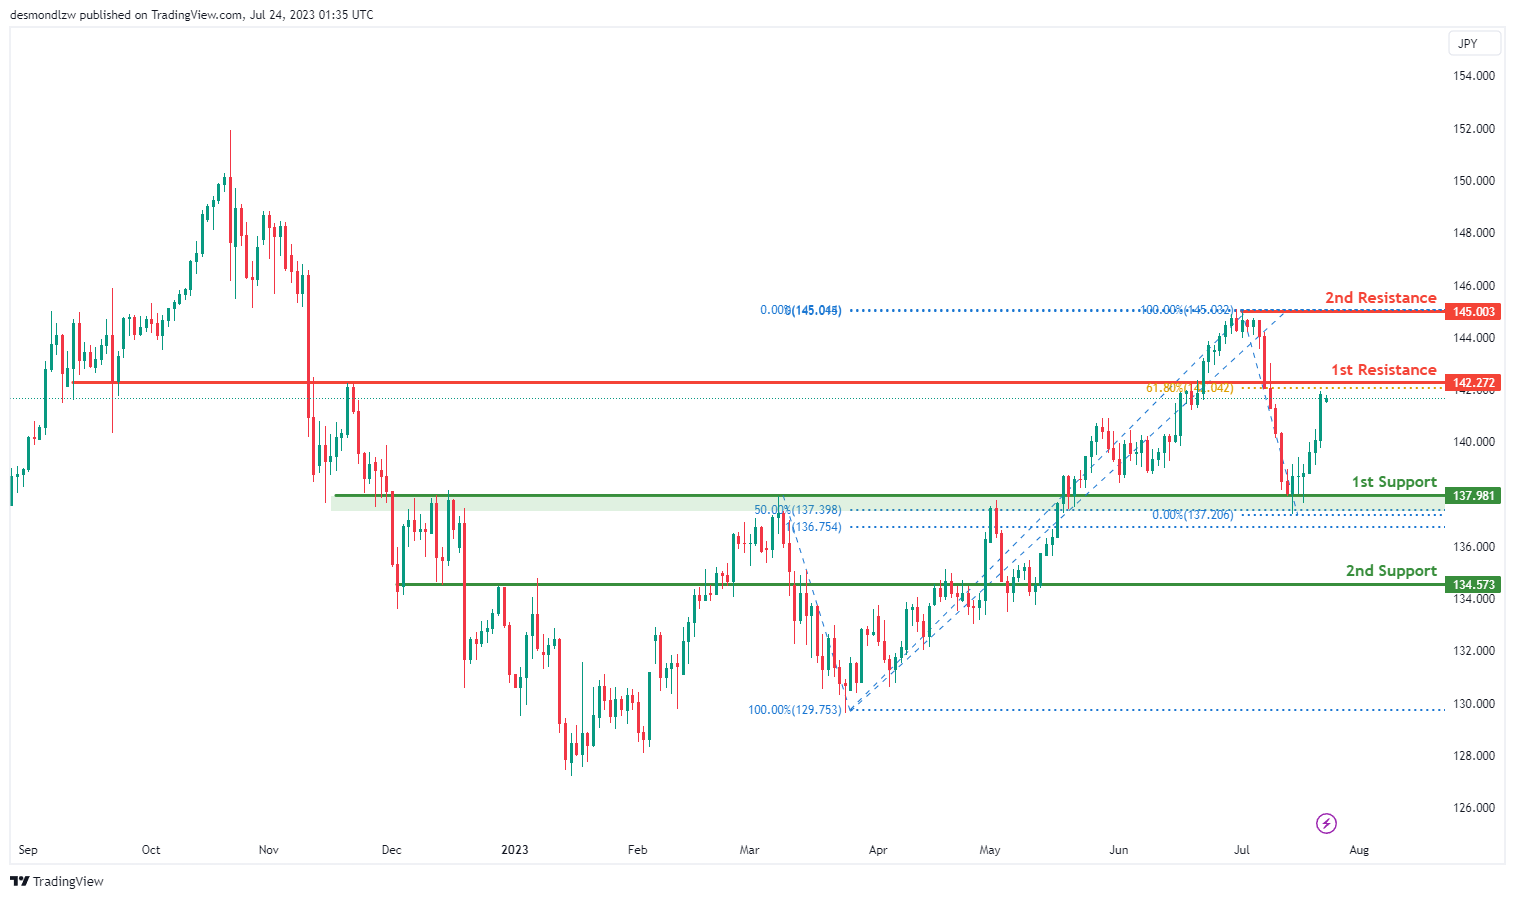
The USD/JPY chart indicates a bearish momentum, suggesting a potential bearish reaction off the 1st resistance level at 142.27, which aligns with a pullback resistance at the 61.80% Fibonacci retracement.
In the event of a downward movement, the 1st support at 137.98 holds significance as an overlap support coinciding with the 50% Fibonacci retracement and 100% Fibonacci projection, indicating a Fibonacci confluence. If the bearish trend continues, the 2nd support at 134.57, another overlap support, may provide additional stability.
On the upside, the 2nd resistance at 145.00 represents a swing high resistance. These support and resistance levels are crucial in determining the price’s potential movement.
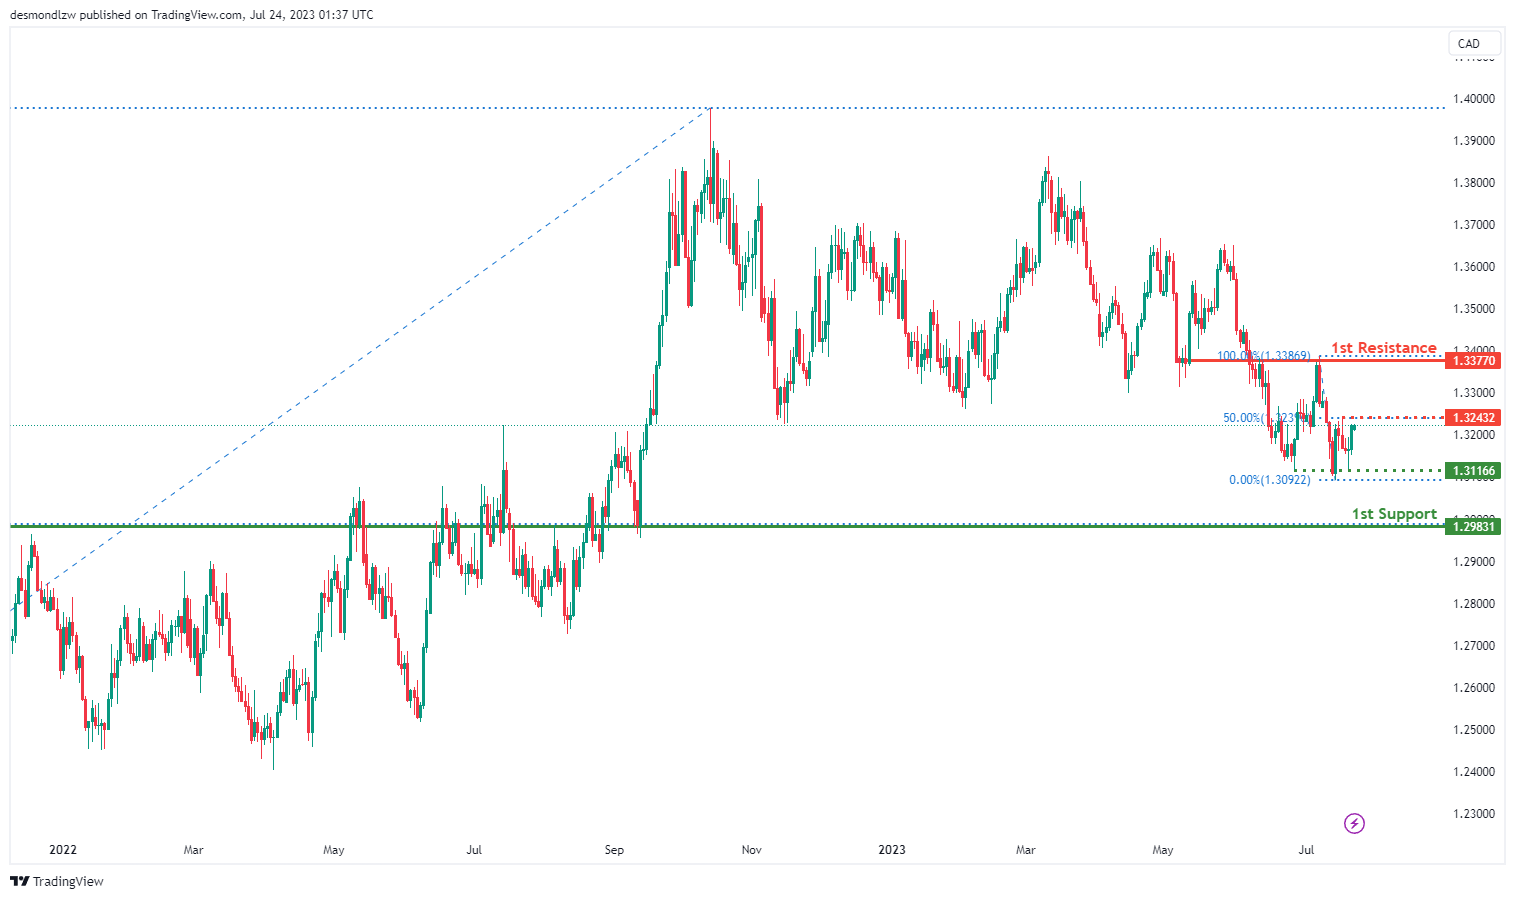
USD/CAD:
The USD/CAD chart exhibits a bullish momentum, indicating a potential continuation of the upward movement towards the 1st resistance level at 1.3377, which is an overlap resistance.
In case of a retracement, the 1st support at 1.2983 acts as an overlap support, and there is an additional intermediate support also at 1.2983, coinciding with a multi-swing low support, providing a strong floor for the price.
On the upside, the intermediate resistance at 1.3116 corresponds to the 50% Fibonacci retracement, adding to its significance as a potential barrier. These support and resistance levels are essential in evaluating the potential direction of the price.
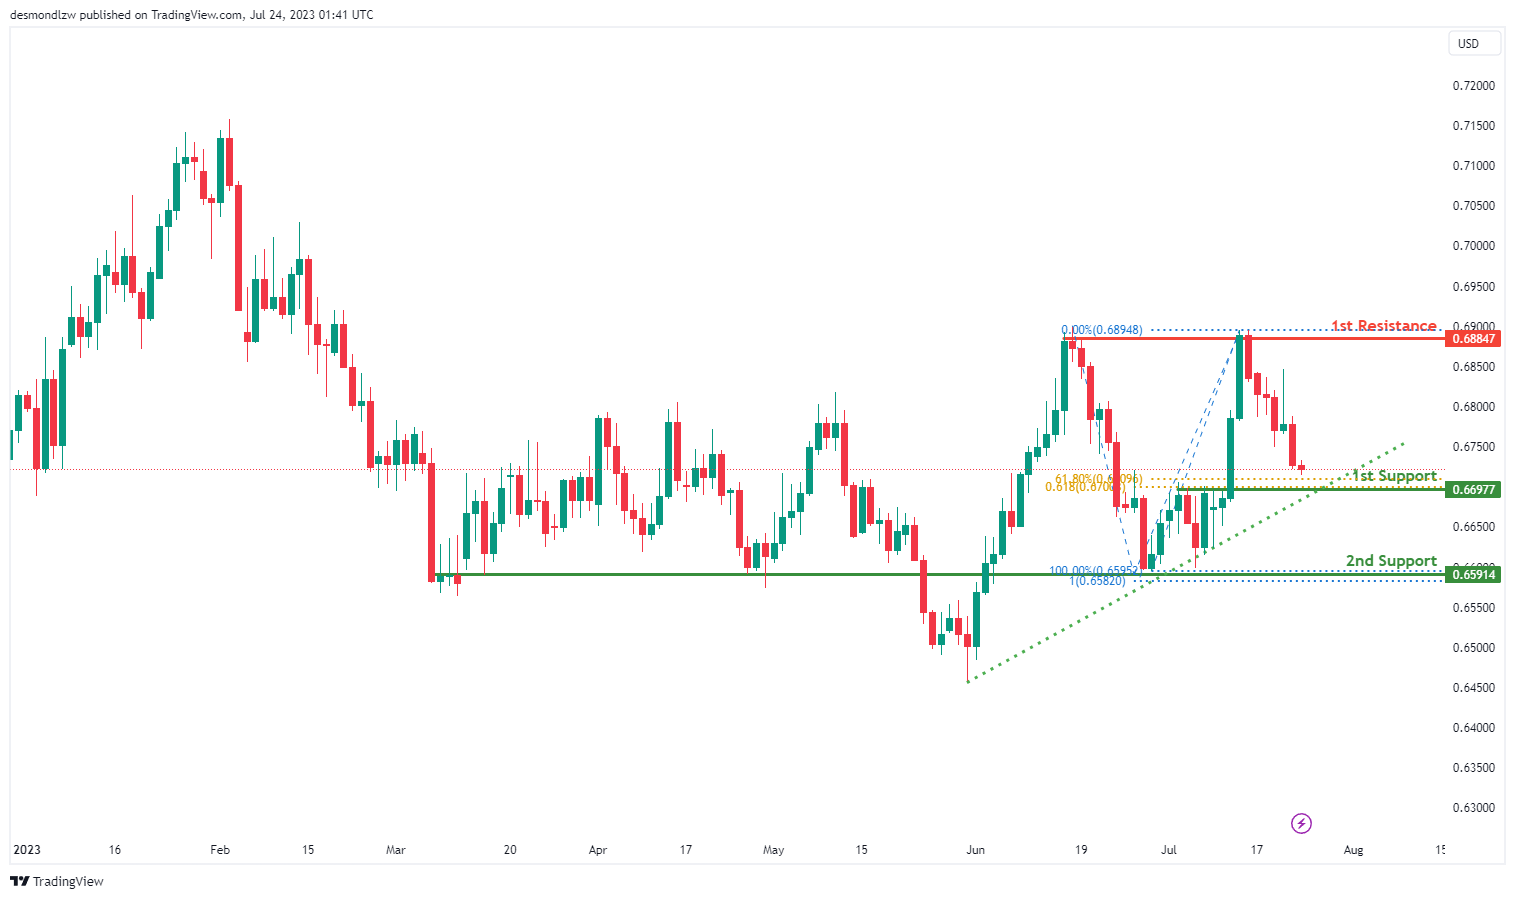
AUD/USD:
The AUD/USD chart demonstrates a bullish momentum, with the price above a major ascending trend line, suggesting the potential for further upward movement.
In case of a retracement, the 1st support at 0.6697 is a pullback support, aligning with both the 61.80% Fibonacci retracement and the 61.80% Fibonacci projection, indicating strong Fibonacci confluence. Additionally, the 2nd support at 0.6591 serves as an overlap support, coinciding with the 100% Fibonacci projection, providing further reinforcement.
On the upside, the 1st resistance at 0.6884 represents a multi-swing high resistance level, which might pose a challenge to the price’s upward progress. These support and resistance levels play a crucial role in evaluating potential price movements.
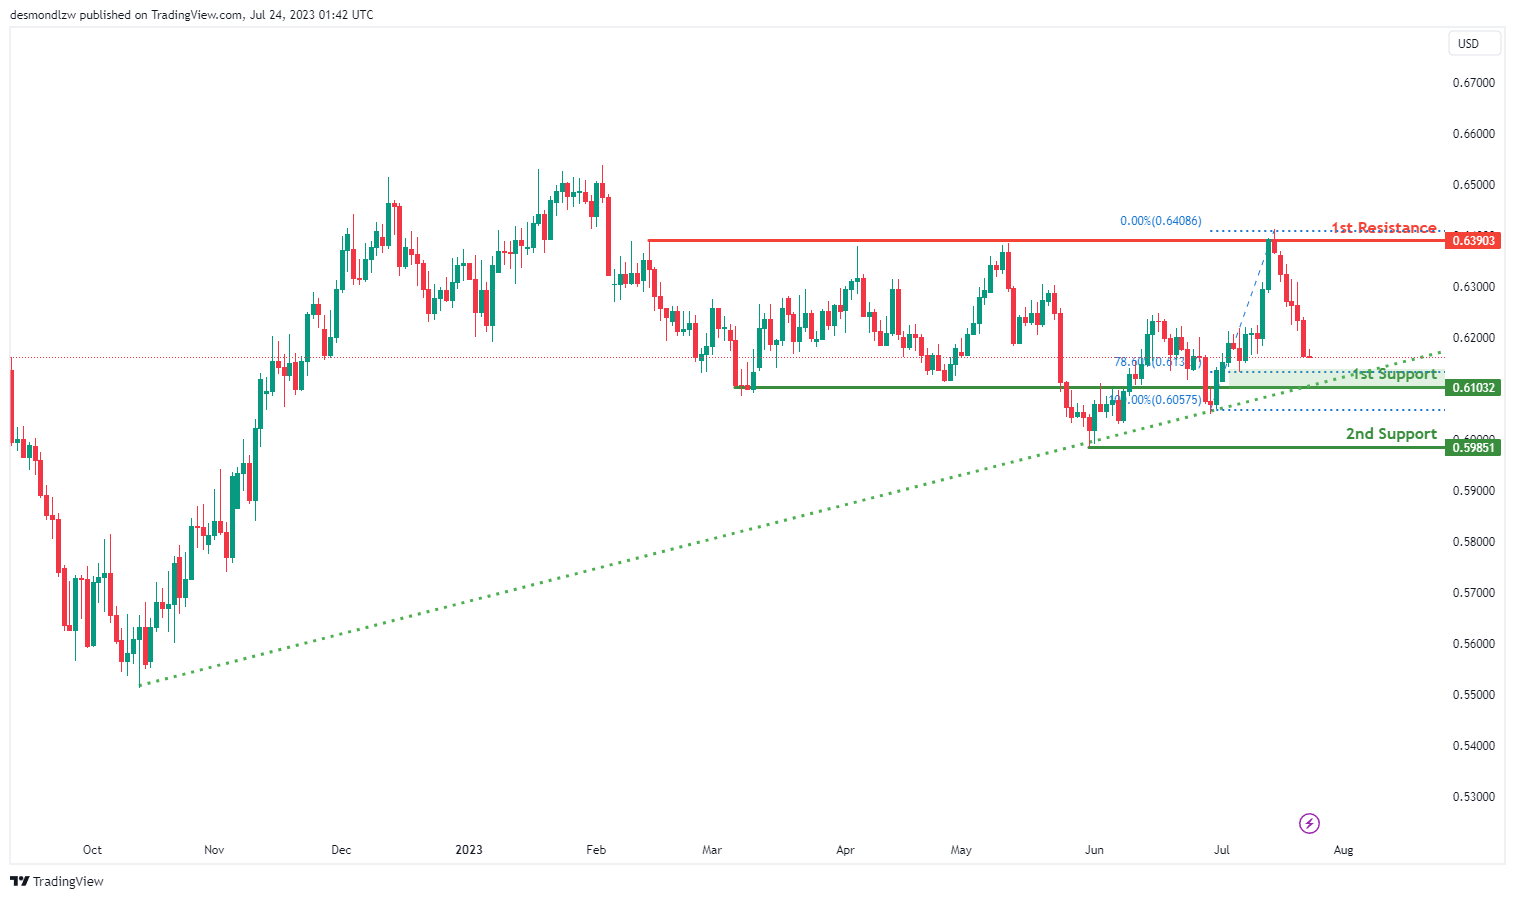
NZD/USD
The AUD/USD chart reflects a bullish momentum as the price remains above a major ascending trend line, suggesting the potential for further upward movement.
If there is a retracement, the 1st support at 0.6103 acts as a pullback support, coinciding with the 78.60% Fibonacci retracement level. Additionally, the 2nd support at 0.5985 is a swing low support.
On the upside, the 1st resistance at 0.6390 represents a significant multi-swing high resistance level, potentially impeding further upward progress. These support and resistance levels play a crucial role in assessing potential price movements.
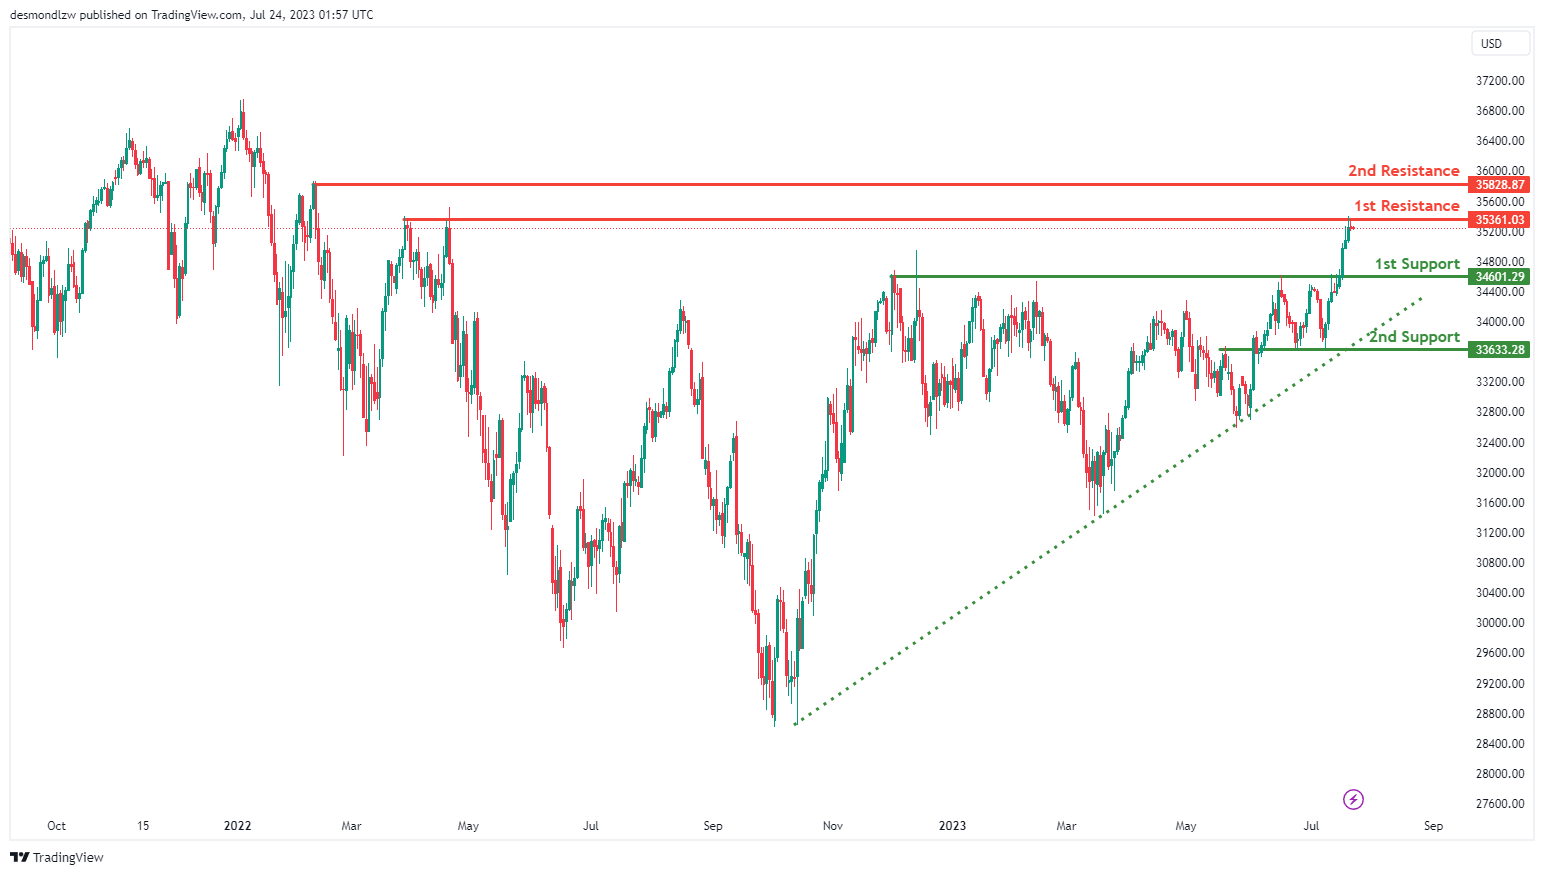
DJ30:
The DJ30 (Dow Jones Industrial Average) is currently displaying a bullish momentum, with the price positioned above a major ascending trend line, suggesting further bullish momentum could be expected.
In the short term, the price could potentially drop further to the 1st support at 34601.29, which is valued for its pullback support property. After reaching this level, the price might bounce back and rise towards the 1st resistance at 35361.03, characterized by its multi-swing high resistance.
If the price slips below the 1st support, the 2nd support level at 33633.28, an overlap support, could provide a safety net. On the other hand, if the price breaks past the 1st resistance, it could encounter the 2nd resistance at 35828.87. This resistance level is significant due to its swing high resistance attribute.
GER30:
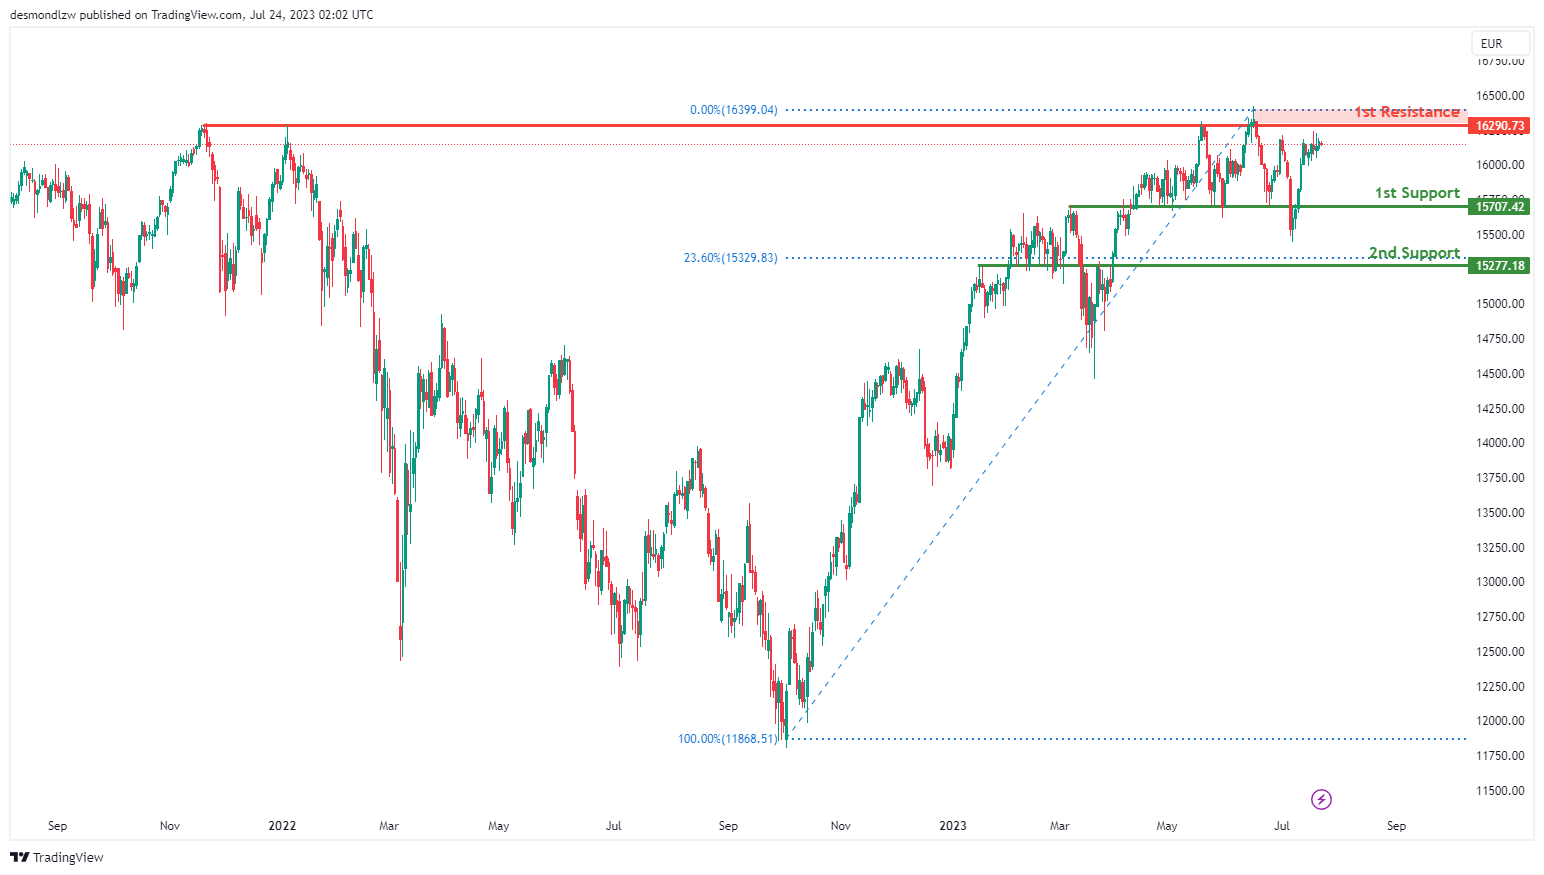
The GER30 (DAX) chartis currently showing a bearish momentum on the chart. The price could potentially make a bearish reaction off the 1st resistance level at 16290.73, characterized by its multi-swing high resistance, and descend to the 1st support level.
The 1st support level is found at 15707.42, which is valuable due to its overlap support property. If the price breaks through this level, it could continue its downward trajectory to the 2nd support at 15277.18. This support level is significant due to its overlap support feature and its alignment with the 23.60% Fibonacci retracement level.
US500
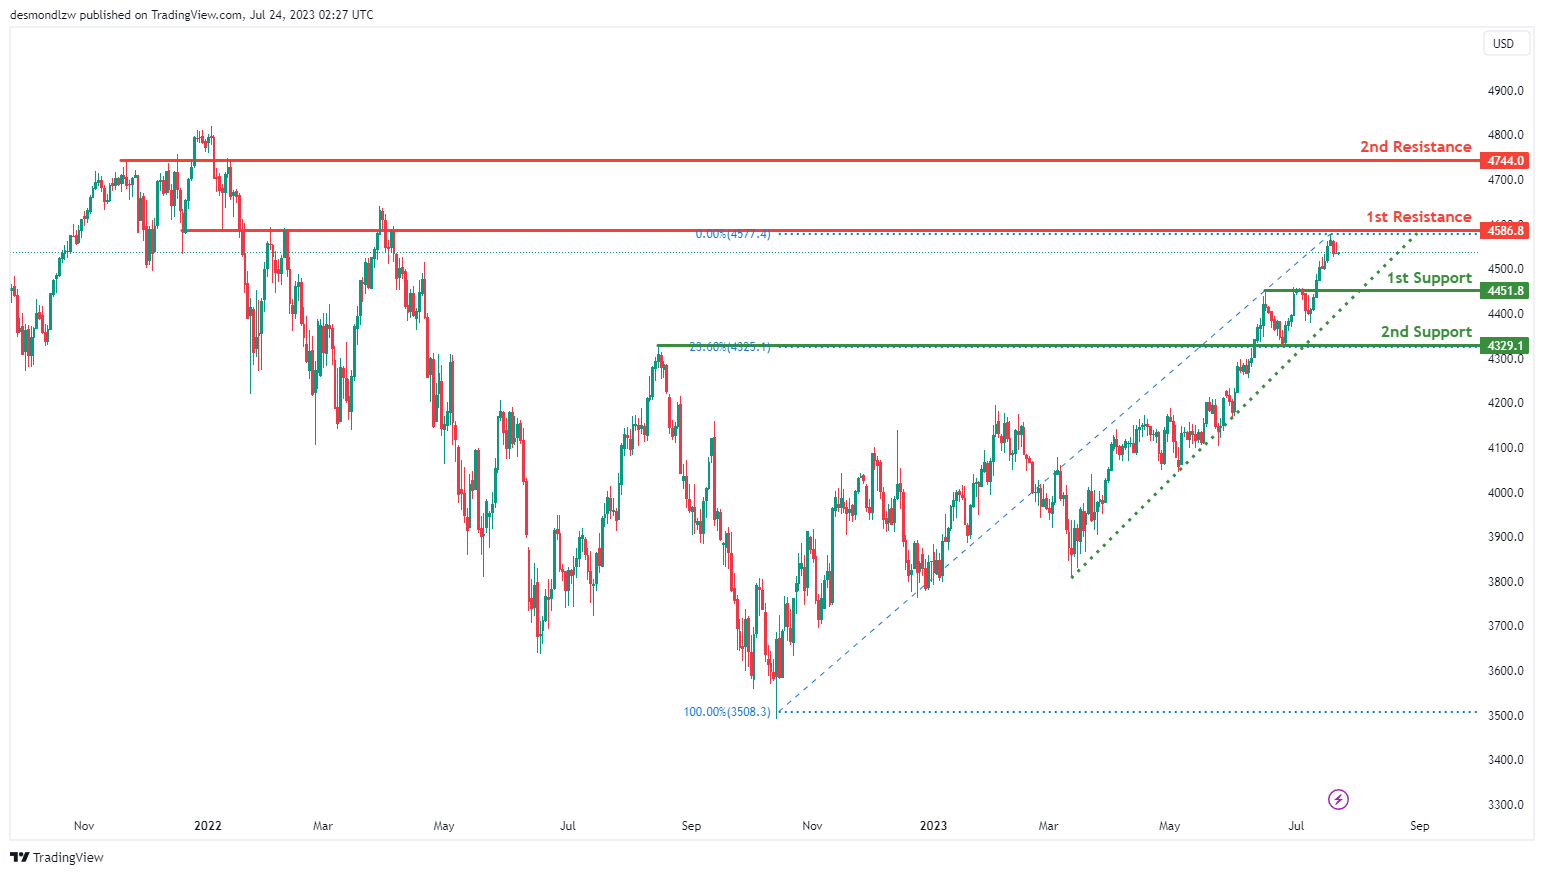
The US500 (S&P 500) chart currently demonstrates a bullish momentum, with the price trending above a major ascending line, suggesting further bullish activity could be forthcoming.
However, in the short term, the price could potentially drop further to the 1st support at 4451.8, which is appreciated for its pullback support attributes. From this level, the price could bounce back and rise towards the 1st resistance at 4586.8, noted for its overlap resistance characteristics.
If the price breaches the 1st support, the 2nd support at 4328.9, which is an overlap support aligned with the 23.60% Fibonacci retracement, could provide a safety net. Conversely, if the price surpasses the 1st resistance, the 2nd resistance at 4744.0, another overlap resistance, could present the next significant barrier.
BTC/USD:
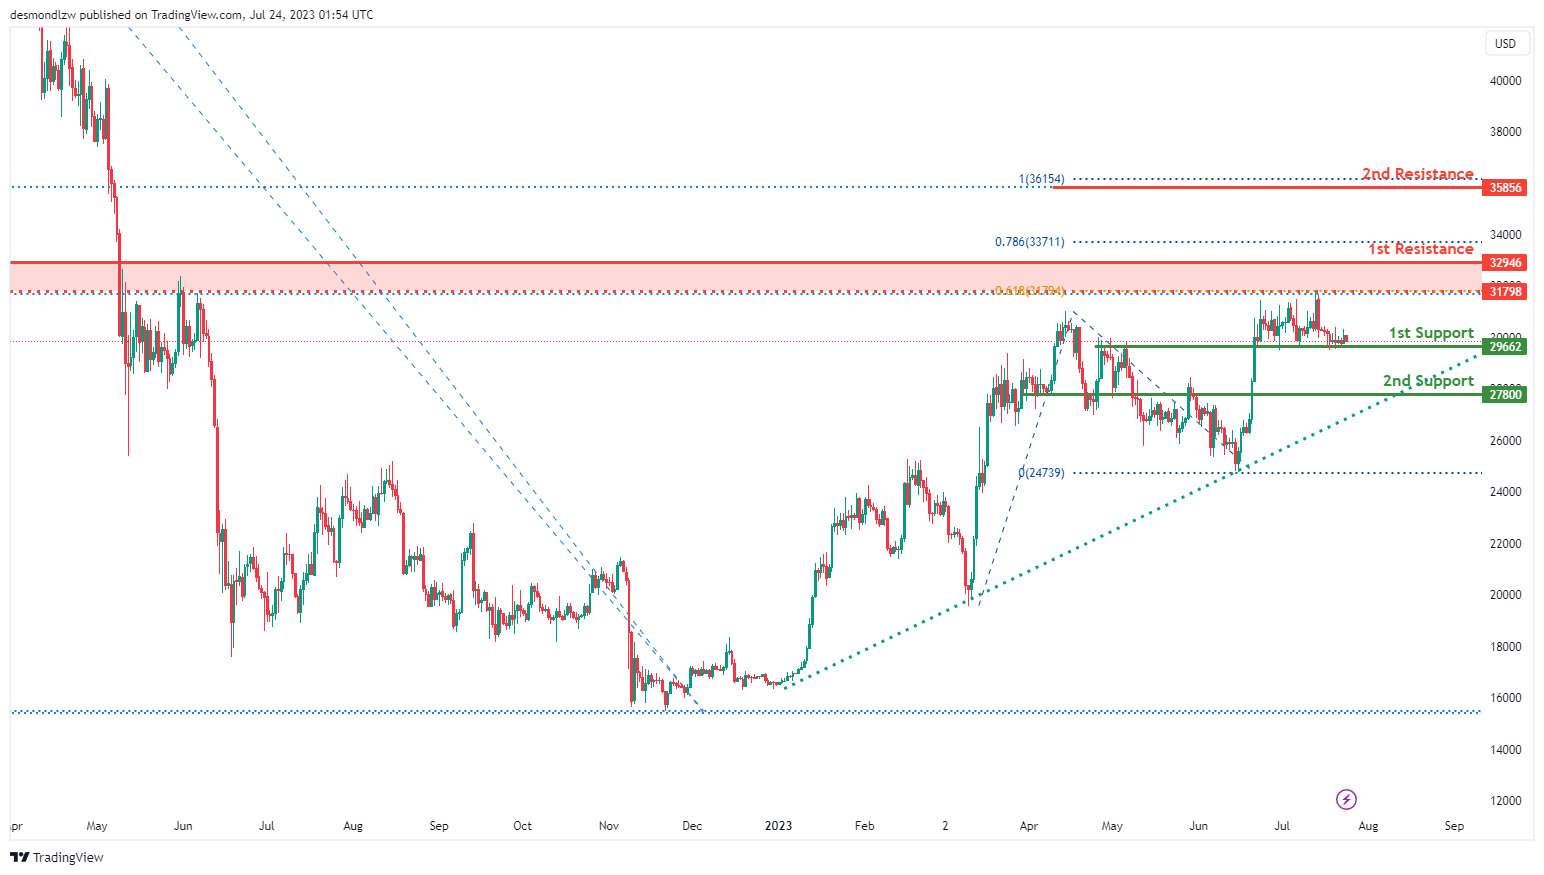
The BTC/USD instrument is currently exhibiting a bullish momentum, largely because the price is above a major ascending trend line, suggesting that further bullish momentum could be anticipated.
The price might potentially make a bullish bounce off the 1st support, situated at 29662, which is valued for its overlap support characteristic, and then head towards the 1st resistance. This resistance is located at 32946 and is significant due to its multi-swing high resistance feature and its position at the 78.60% Fibonacci retracement level.
If the price falls below the 1st support, the 2nd support at 27800, another overlap support, could provide stability. On the other hand, if the price breaks the 1st resistance, it could encounter the 2nd resistance at 35856. This level acts as a swing high resistance and aligns with the 38.20% Fibonacci retracement and 100% Fibonacci projection, indicating a Fibonacci confluence.
Additionally, an intermediate resistance is observed at 31798. It is characterized as an overlap resistance and matches the 50% Fibonacci retracement and 61.80% Fibonacci projection, indicating another Fibonacci confluence.
ETH/USD:
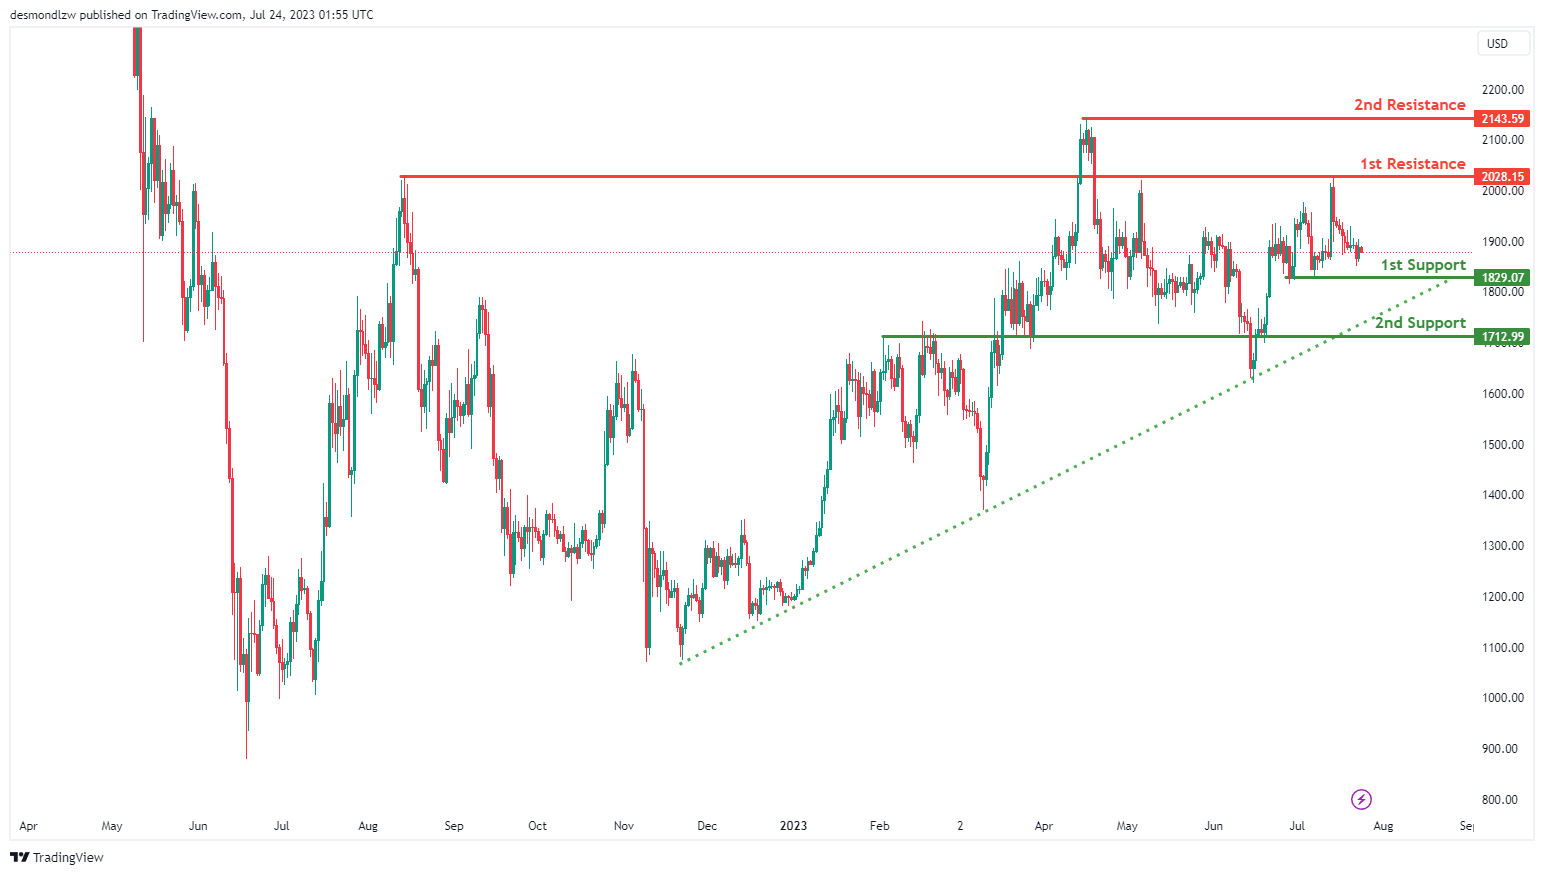
The ETH/USD instrument is currently displaying a bullish momentum. The price is above a major ascending trend line, suggesting potential further bullish movements.
There’s a possibility that the price could make a bullish bounce off the 1st support level, located at 1829.07. This level is beneficial due to its multi-swing low support feature, and it might then head towards the 1st resistance. The 1st resistance is at 2028.15 and is significant due to its overlap resistance property.
If the price dips below the 1st support, the 2nd support at 1712.99, an overlap support, could provide a backstop. Conversely, if the price surpasses the 1st resistance, the 2nd resistance at 2143.59, acting as a swing high resistance, could present the next hurdle for upward price movement.
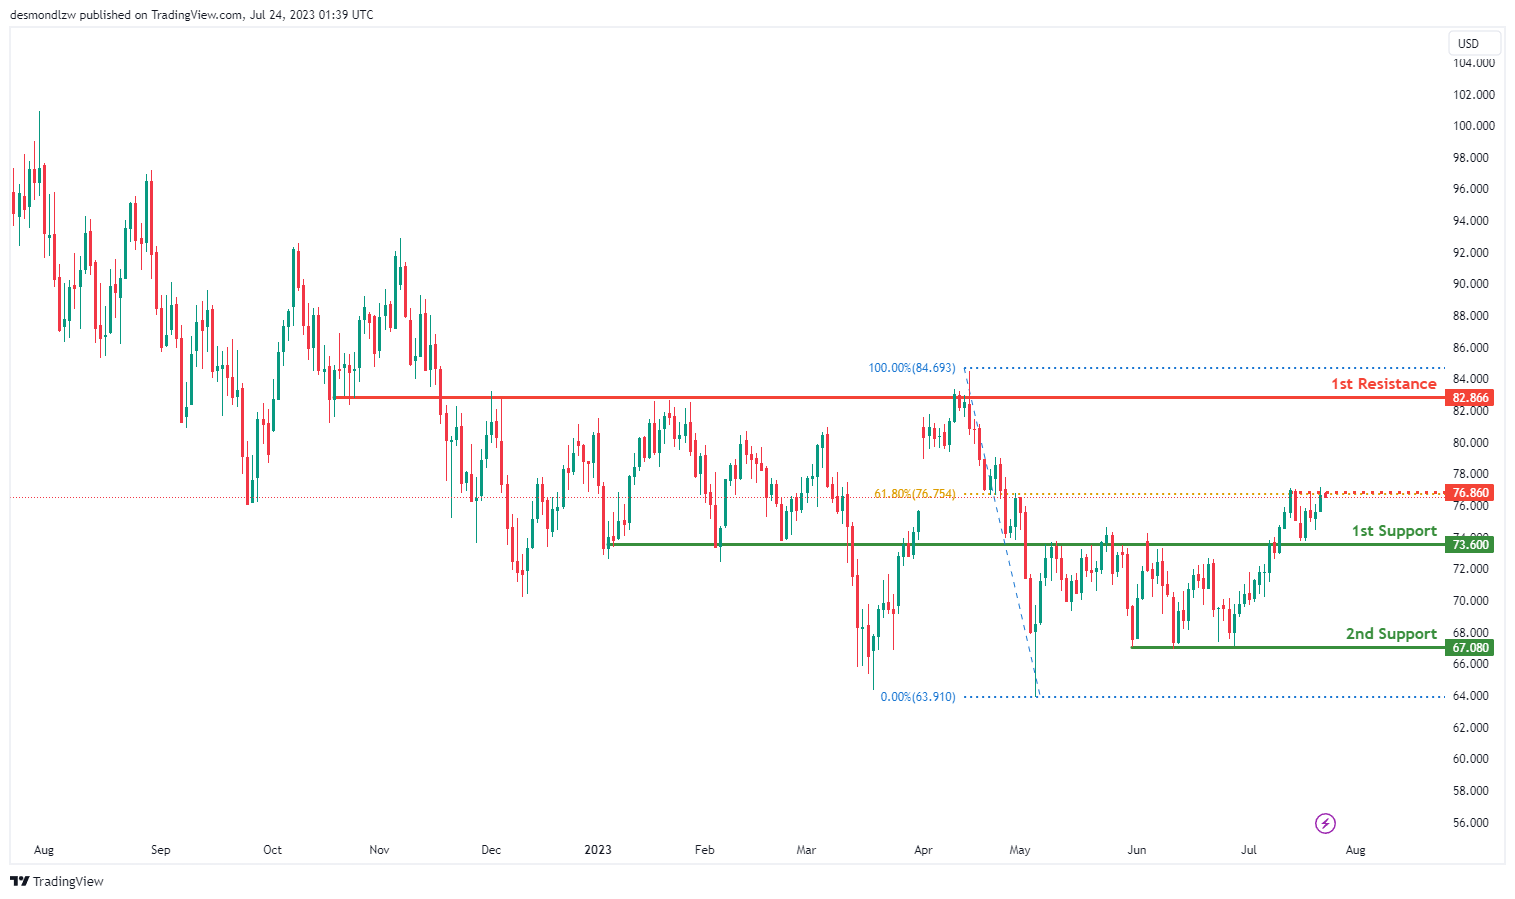
WTI/USD:
The WTI (West Texas Intermediate) chart shows a bullish momentum, indicating the potential for further upward movement.
For potential upward continuation, the 1st support at 73.60 serves as an overlap support, while the 2nd support at 67.08 is a multi-swing low support level.
On the upside, the 1st resistance at 82.86 represents a pullback resistance, and the intermediate resistance at 76.86 aligns with the 61.80% Fibonacci retracement level, adding to its significance. These support and resistance levels are important factors to consider when assessing possible price trends.
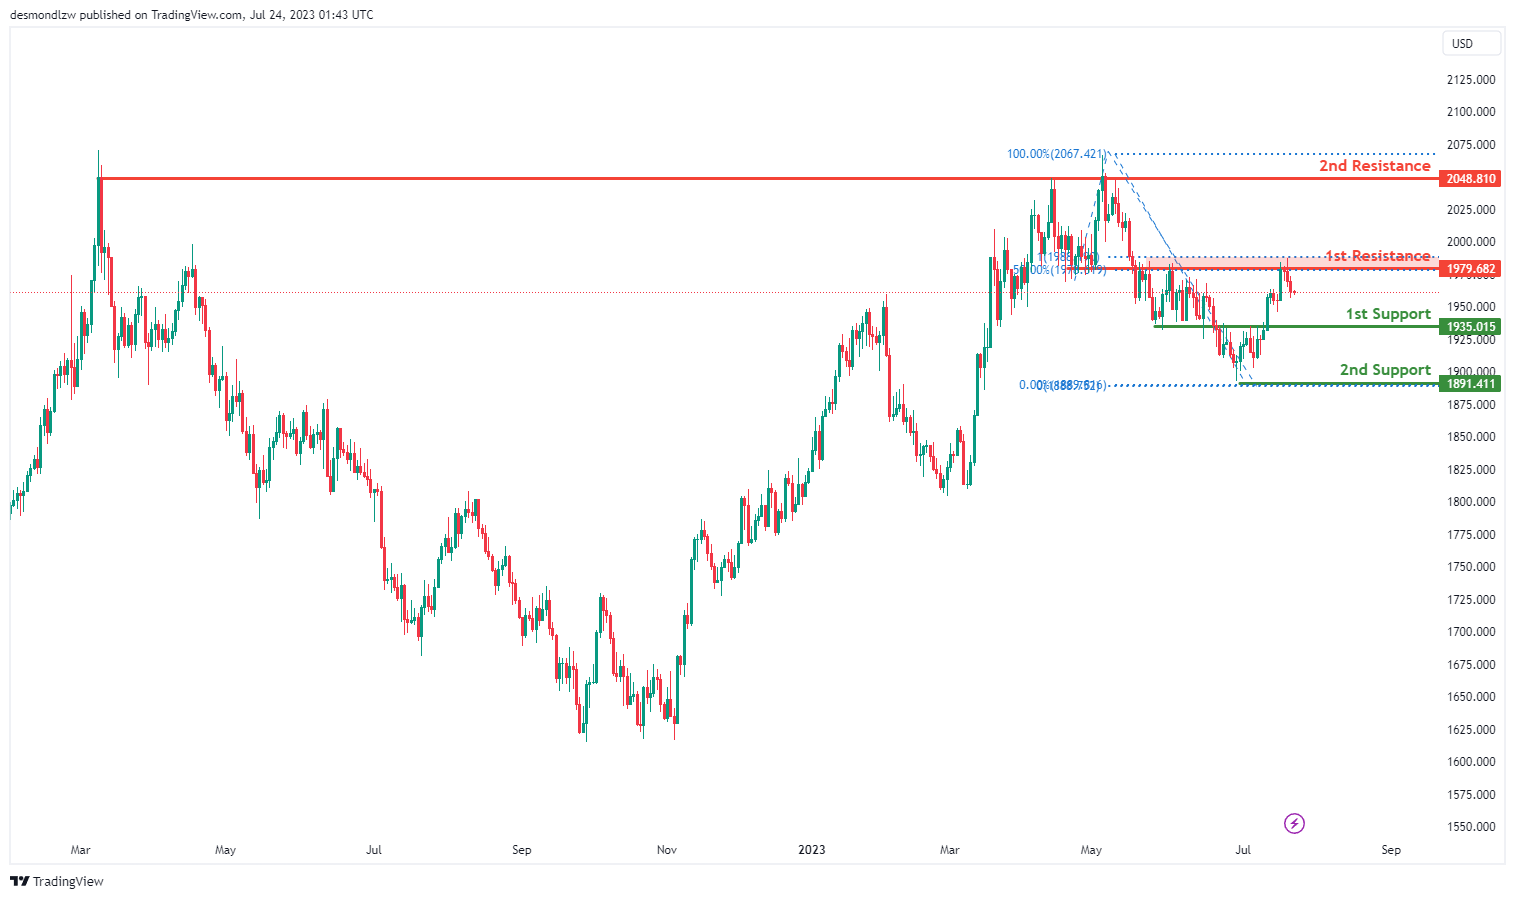
XAU/USD (GOLD):
The XAU/USD chart shows a bearish momentum, suggesting a potential continuation of the downward movement.
For a possible bearish continuation, the 1st support at 1935.01 acts as a pullback support, while the 2nd support at 1891.41 represents a swing low support level.
On the upside, the 1st resistance at 1979.68 is an overlap resistance, coinciding with the 50% and 100% Fibonacci retracement levels. Additionally, the 2nd resistance at 2048.81 serves as a multi-swing high resistance. These support and resistance levels are crucial considerations for assessing the price direction.
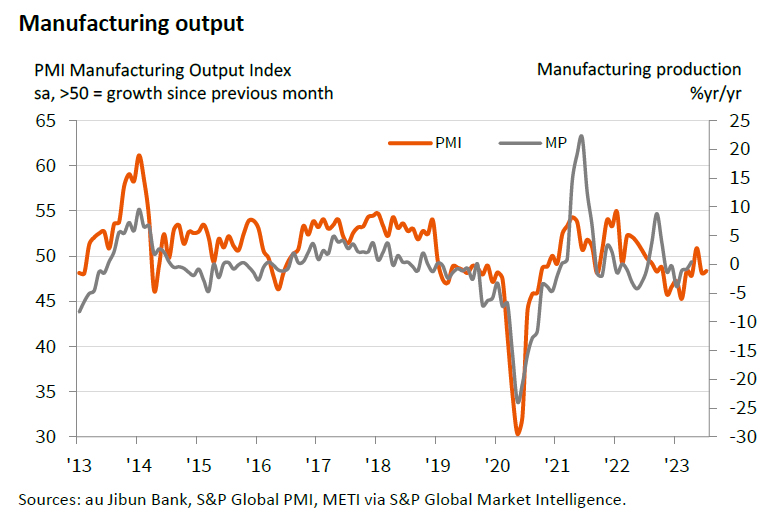
Japan PMI manufacturing slipped to 49.4, resurgence in price pressures
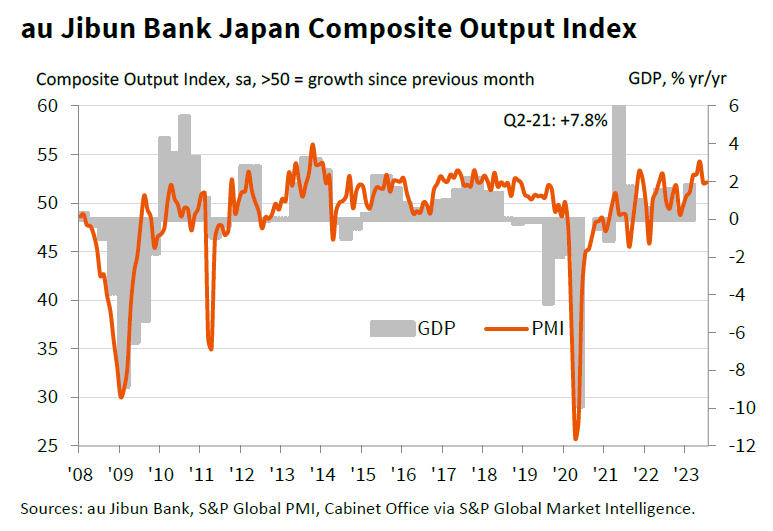
Japan's PMI Manufacturing dropped slightly from 49.8 in June to 49.4 in July, falling short of the forecasted 50.1. Despite this, PMI Manufacturing Output showed a minor uptick, climbing from 48.1 to 48.4. PMI Services saw a small decline, edging down from 54.0 to 53.9. Composite PMI, indicative of the overall health of the economy, was unchanged at 52.1.
Usamah Bhatti, an Economist at S&P Global Market Intelligence, highlighted that activity among private sector firms in Japan extended its growth streak for the seventh consecutive month. The persistence of this trend is largely attributable to steady and considerable improvement in service providers, while manufacturers reported a softer downturn at the dawn of Q3.
However, Bhatti underscored a less robust demand situation among private sector firms compared to the previous survey period. The latest data points to only a marginal increase in new orders, signaling a possible slowdown in demand.
Notably, the second half of 2023 has seen "renewed strengthening in price pressures" within the private sector. Pace of input price inflation has quickened for the first time since January. This trend is reflected across both manufacturing and service sectors, with both reporting steeper rates of output price inflation.
Australia PMI composite fell to 48, but still on narrow path for soft landing
Australia's PMI Manufacturing recorded a mild uptick in July, rising from 48.2 to 49.6, marking a 5-month high, but still falling short of the expansionary threshold of 50. Concurrently, PMI Services took a downward turn from 50.3 to 48.0, hitting a 7-month low. Consequently, Composite PMI, a measure of combined sectors, dipped from 50.1 to 48.3, which is also a 7-month low.
Warren Hogan, Chief Economic Advisor at Judo Bank, attributed the soft July figures predominantly to a dip in business activity in the services sector, which had previously been on a recovery path in 2023. But the "Australian economy remains on the 'narrow path' for a soft landing."
The July Flash report raised some concerns regarding inflation. Despite the slowdown in activity, price indicators trended higher, particularly within the services sector. These inflationary signals remain elevated, pointing to a potential inflation rate of around 4-5%, substantially exceeding RBA's target of 2% to 3%.
Hogan noted that the disinflationary trend evident throughout 2022 "appears to have ceased". As such, July figures will provide critical insights into whether Australia's inflation aligns with the declining trends seen in other countries recently, or if the nation is "set to experience a more sticky inflation trend in 2023/24."
NZ goods exports up 1.3% yoy in Jun, imports down -14% yoy
In June 2023, New Zealand's goods exports observed a modest rise of 1.3% yoy, an equivalent of NZD 84m, taking the total to NZD 6.3B. Conversely, the nation witnessed a significant drop in goods imports by -14.0% yoy, or NZD -1.1B, reducing the total to NZD 6.3B. This left the monthly trade balance at a surplus of NZD 9m, notably below market expectations of NZD 235m.
A deeper look into the country's top trading partners unveiled mixed outcomes in exports. June 2023 saw a decline in total exports to China by NZD -124m (-7.2% yoy), and to EU by NZD -98m (-20%). Moreover, exports to Japan also slipped by NZD -56m (-13%). On a positive note, exports to Australia and US increased by NZD 190m (30%) and NZD 91m (13%) respectively.
In terms of imports, there were notable reductions across the board. China, one of New Zealand's principal import partners, witnessed a drop by NZD -232m (-16% yoy), while EU observed a decrease of NZD -100m (-9.2%). Furthermore, imports from Australia and US fell by NZD -93m (-12%) and NZD -96m (-14%) respectively. South Korea recorded the most substantial decline in exports to New Zealand, with a drop of NZD -136m (-26%).
EUR/USD Corrects Lower, 100 SMA Holds The Key
Key Highlights
- EUR/USD started a downside correction from the 1.1275 zone.
- It broke a key bullish trend line with support near 1.1160 on the 4-hour chart.
- GBP/USD is also correcting lower below the 1.3000 support.
- Crude oil prices climbed higher above the $75.50 resistance level.
EUR/USD Technical Analysis
The Euro attempted a clear move above the 1.1250 level against the US Dollar. EUR/USD failed near 1.1275 and recently started a downside correction.
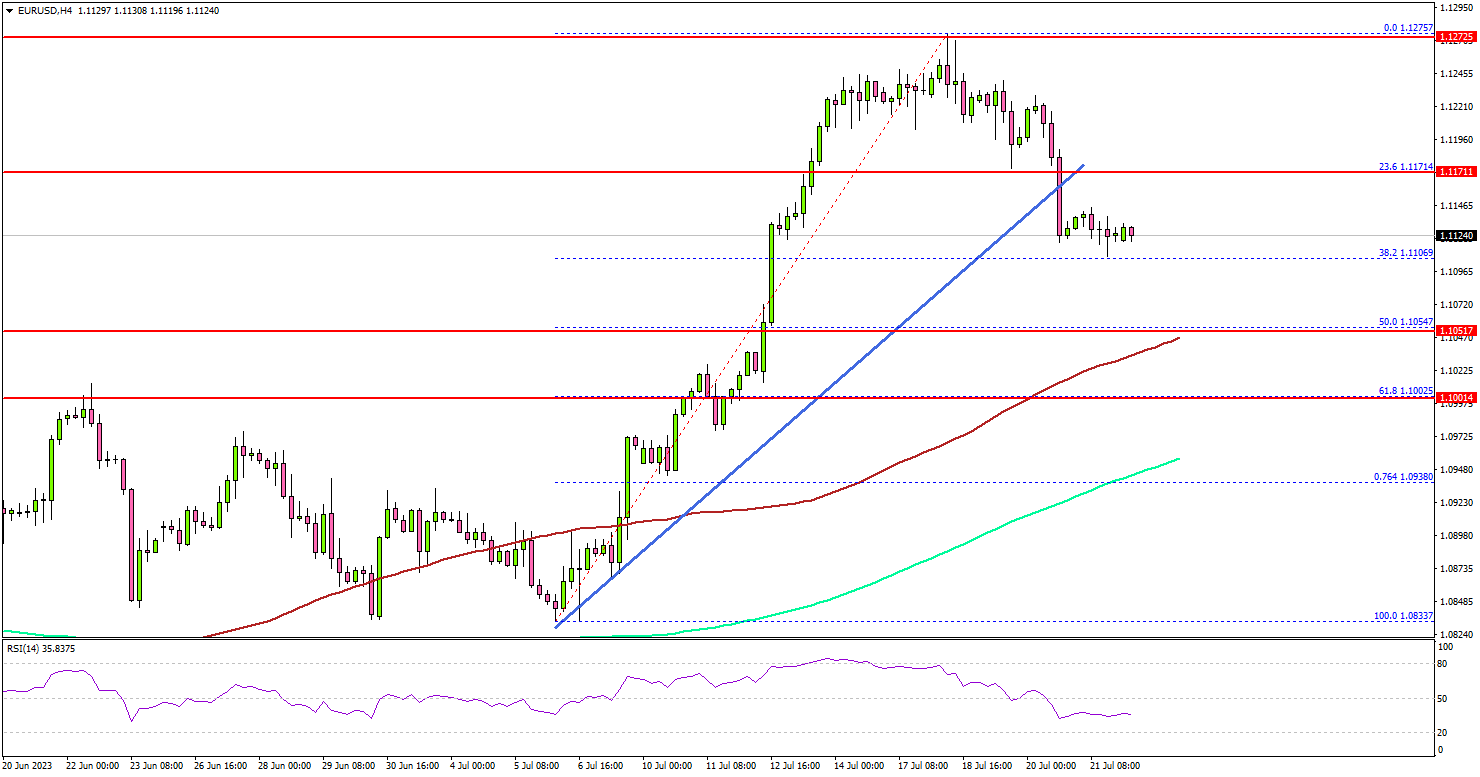
Looking at the 4-hour chart, the pair declined below the 1.1200 support level. There was a move below the 23.6% Fib retracement level of the upward move from the 1.0833 swing low to the 1.1275 high.
Besides, it traded below a key bullish trend line with support near 1.1160 on the same chart. The pair is now approaching the 1.1080 support. The next major support is seen near the 1.1050 level and the 100 simple moving average (red, 4 hours).
The 50% Fib retracement level of the upward move from the 1.0833 swing low to the 1.1275 high is also near 1.1050, below which the pair could test the 200 simple moving average (green, 4 hours).
On the upside, the pair might face resistance near the 1.1170 level. The next resistance is near the 1.1275 level. Any more gains might send the pair toward the 1.1350 level.
Looking at GBP/USD, the pair started a downside correction below the 1.3000 level and might find bids near the 1.2800 zone.
Economic Releases
- Germany’s Manufacturing PMI for July 2023 (Preliminary) - Forecast 41.0, versus 40.6 previous.
- Germany’s Services PMI for July 2023 (Preliminary) - Forecast 53.1, versus 54.1 previous.
- Euro Zone Manufacturing PMI for July 2023 (Preliminary) – Forecast 43.5, versus 43.4 previous.
- Euro Zone Services PMI for July 2023 (Preliminary) – Forecast 51.5, versus 52.0 previous.
- US Manufacturing PMI for July 2023 (Preliminary) – Forecast 46.4, versus 46.3 previous.
- US Services PMI for July 2023 (Preliminary) – Forecast 54.1, versus 54.4 previous.