

Sample Category Title
Sunset Market Commentary
Markets
The July European PMIs painted a bleak picture of the economy. They also all missed expectations. The composite indicator ventured deeper into contraction territory (48.9 from 49.9). Manufacturing is still leading the decline (42.7 from 43.4) with net job losses for a second month straight, a steepening loss of new orders (one of the steepest since 2009) and output at its lowest in 38 months. But cracks start to show in services as well as activity printed at a six-month low of 51.1 (from 52.0). Order inflow posted its first downturn in seven months, causing backlogs to fall for the first time in half a year too as companies try to keep the services engine going. Employment still rises though at the slowest pace since March. The private sector year-ahead outlook was the most meagre since November last year. Prices pressures meanwhile moderated further in July. Lower manufacturing input prices fed through to lower selling prices, which fell for a third successive month and at the sharpest pace since September 2009. In services, upward wage pressures keep input costs above the long-run average, causing prices charged to continue to increase too. That’s keeping the pressure on the ECB to tighten further, even as the pace in both input costs and prices charged slowed further. UK PMI’s were strikingly alike though in terms of absolute levels it is a little less gloomy. The manufacturing downturn deepened (45 from 46.5) and services printed quite a setback (from 53.7 to 51.5), making the whole private economy grow only very marginally (50.7 from 52.8).
The market reaction was a straightforward one. Core bonds rallied, with German Bunds outperforming USTs. Yields in Germany eased 3.8-6.8 bps, the front taking the biggest hit. The 2-y yield struggles to retain the symbolic 3% level. US yields shed 2.3-2.8 bps at the belly and yields in Great Britain drop 5-6.1 bps. UK money markets become increasingly less convinced of a BoE policy rate at 6%, giving it only a 20% chance currently. The euro suffers. EUR/USD hit an intraday low of 1.1066, before recovering some of the losses to trade at 1.1082 currently. The 1.1095 support is extensively being tested. Sterling isn’t in the best shape either following the PMIs but still manages to eke out a gain vs the euro. EUR/GPB eases to 0.864. The Japanese yen profits from easing core bond yields and a risk-off equity environment (EuroStoxx50 -0.5%), even as Bloomberg cited more “people familiar with the matter” that BoJ officials are not convinced (yet) that the current bout of inflation, which will probably result in a sharp upward revision for this fiscal year’s forecast, is sustainable. USD/JPY drops towards 141.01, EUR/JPY erases much of last Friday’s surge to change hands at 156.34.
News & Views
Contrary to the EMU and the UK, sentiment indicators in the Czech Republic and in Hungary painted a slightly different picture. According to the Czech Statistical Office, overall confidence in the Czech economy in July improved 1.1 points to 91.4. The business indicator rose a limited 0.1 pts to 91.1 while the improvement in the consumer confidence indicator was more outspoken with 5.9 points to 92.7. After a two-month decline, confidence in the economy increased in industry (+2.9) and trade (+1.7) but decreased in selected services (-2.5) and in construction (-4.2). Consumer confidence also increased m/m. The number of respondents expecting a deterioration of the overall economic situation in the Czech Republic in the next twelve months decreased. Households were also slightly less worried about their financial situation in the next twelve months. The relative improvement in Czech sentiment compared to EMU doesn’t stop the recent correction of the koruna against the euro. EUR/CZK rose further to 24.17. In the wake of recent softer CPI, Czech National Bank vice governor Zamrazilova last week also openly indicated that the debate on rate cuts has started. At the same she saw a possibility of the koruna weakening more than what was put forward in the latest CNB forecast. GKI economic sentiment in Hungary also improved in July to -17.5 from -20.4 in June. The improvement remains modest but suggest a stabilization after reaching a post-pandemic low of -23.1 in October last year. Business confidence improved to -8.5 from -11.8. Consumer confidence rose only marginally from -44.8 to -43.2. The National Bank of Hungary will decide on monetary policy tomorrow. The Hungarian forint today gains modestly with EUR/HUF holding below the EUR/HUF 380 barrier (EUR/HUF 378.6 currently). The MNB over the previous meeting gradually reduced its overnight emergency rate in two steps to from 18.00% to 16.00%. Another 100 bps cut is expected tomorrow.
USD/JPY Mid-Day Outlook
Daily Pivots: (S1) 140.38; (P) 141.17 (R1) 142.59; More...
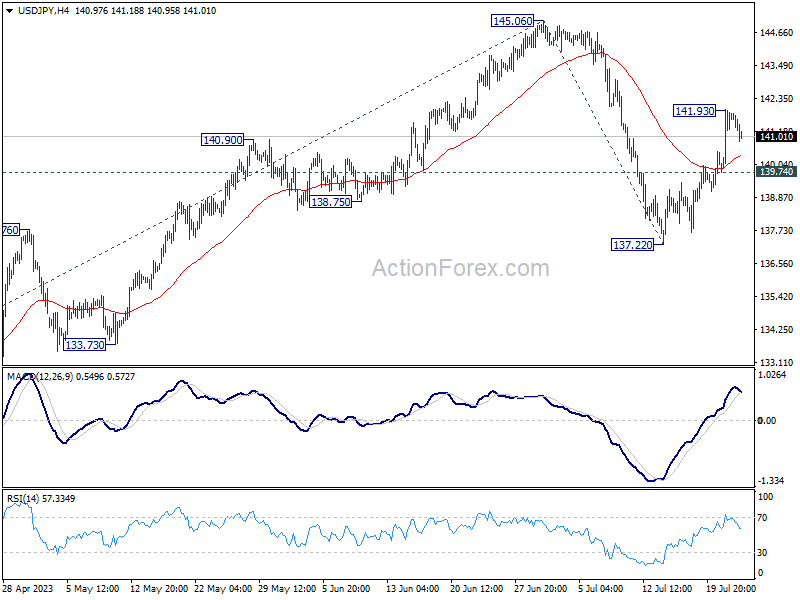
Intraday bias in USD/JPY is turned neutral first with today's retreat. On the upside, above 141.93 will resume the rebound from 137.22 to 145.06 first. Firm break there will target 61.8% projection of 129.62 to 127.22 from 145.06 at 146.76 next. On the downside, below 139.74 minor support will bring retest of 137.22 instead.
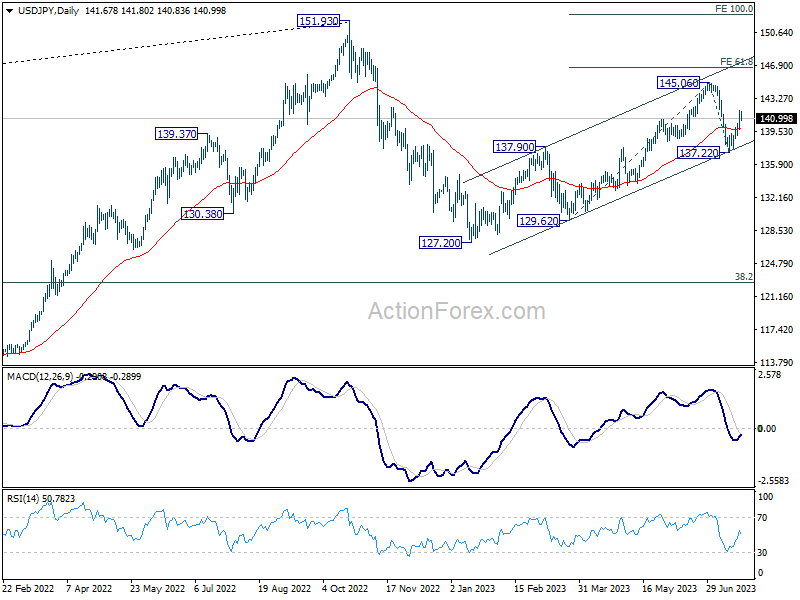
In the bigger picture, overall price actions from 151.93 (2022 high) are views as a corrective pattern. Current development suggests that the second leg (the rise from 127.20) might not be over yet. But even in case of extended rise, strong resistance should be seen from 151.93 to limit upside. Meanwhile, break of 137.22 support should confirm the start of the third leg to 127.20 (2023 low) and below.
USD/CHF Mid-Day Outlook
Daily Pivots: (S1) 0.8640; (P) 0.8659; (R1) 0.8678; More...
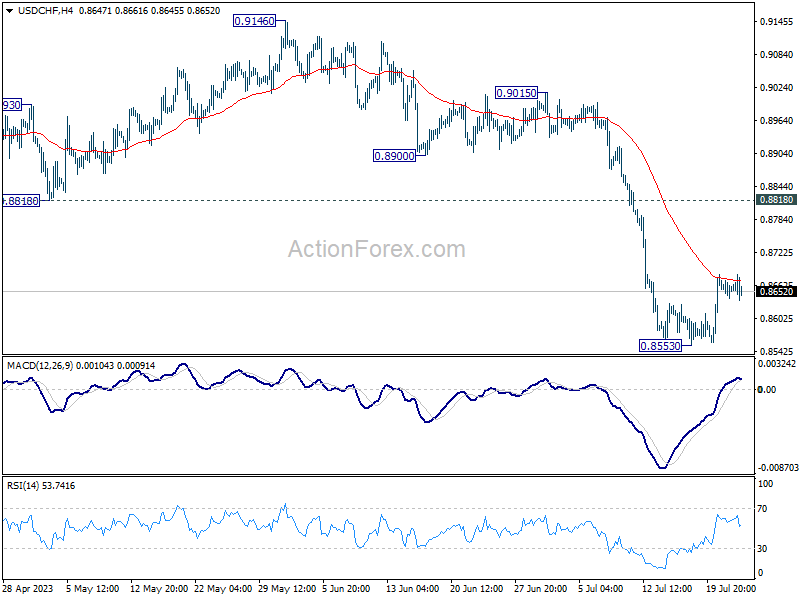
Intraday bias in USD/CHF stays mildly on the upside for the moment. Rebound from 0.8553 short term bottom would target 0.8818 support turned resistance. Rejection by 0.8818 will retain near term bearishness for another decline through 0.8553. Meanwhile for now, risk will stay mildly on the upside as long as 0.8553 holds, in case of retreat.
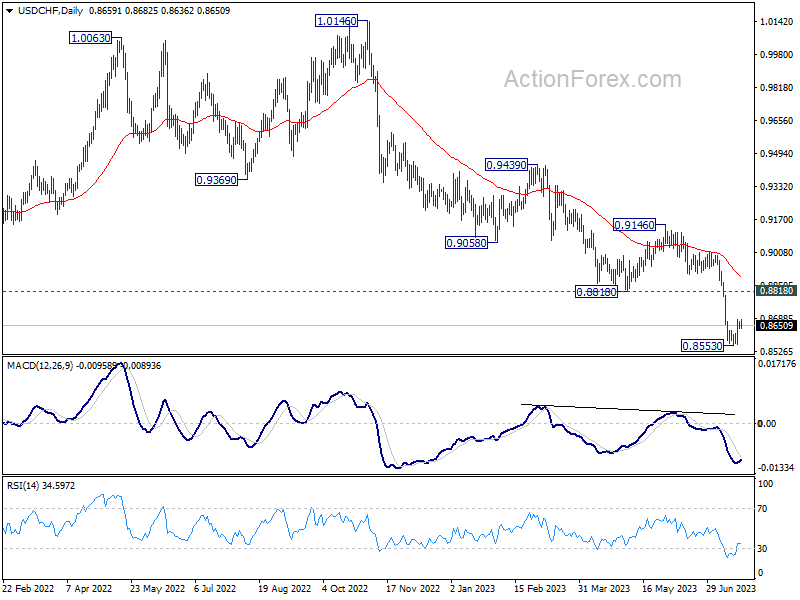
In the bigger picture, the break of 0.8756 (2021 low) indicates break out from the long term range pattern. For now, medium term outlook will stay bearish as long as 0.9146 resistance holds. Further fall would be seen to 61.8% retracement of 0.7065 (2011 low) to 1.0342 (2016 high) at 0.8317 next.
EUR/USD Mid-Day Outlook
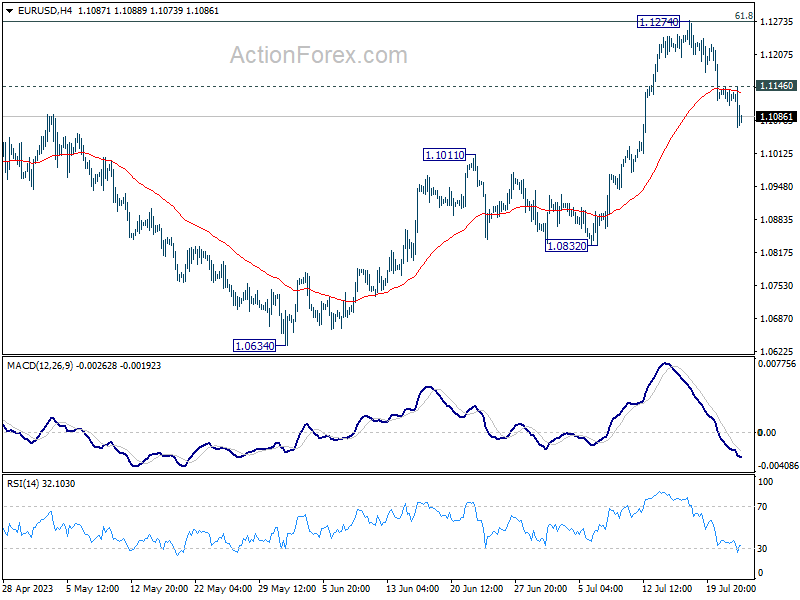
Daily Pivots: (S1) 1.1107; (P) 1.1126; (R1) 1.1144; More...
EUR/USD's fall from 1.1274 short term top is in progress and intraday bias stays on the downside for deeper decline. But outlook will remain bullish as long as 1.1011 resistance turned support holds. Above 1.1146 minor resistance will turn bias back to the upside for retesting 1.1274 high first. However, firm break of 1.1011 will argue that larger correction is underway.
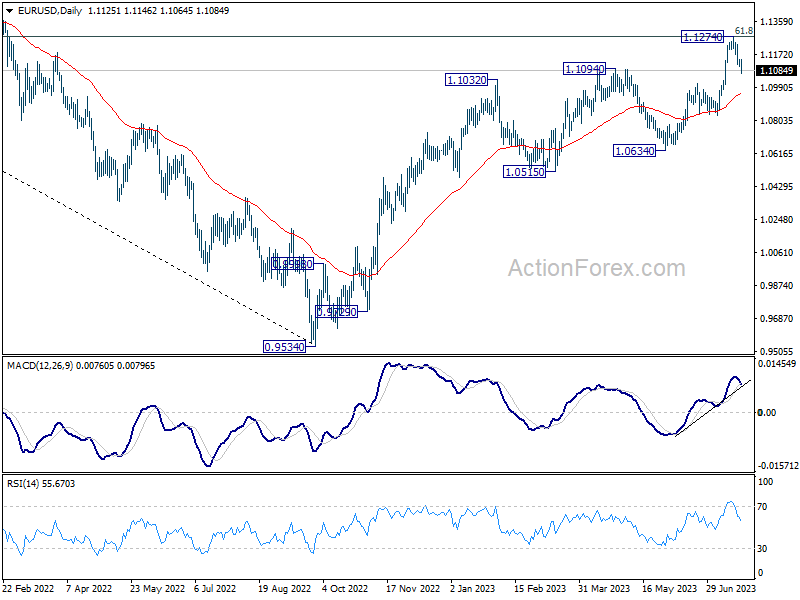
In the bigger picture, rise from 0.9534 is still expected to continue as long as 1.1011 resistance turned support holds. Decisive break of 61.8% retracement of 1.2348 (2021 high) to 0.9534 at 1.1273 will solidify the case of bullish trend reversal and target 1.2348 resistance next. However, firm break of 1.1011 will bring deeper fall back to 1.0634 support next.
GBP/USD Mid-Day Outlook
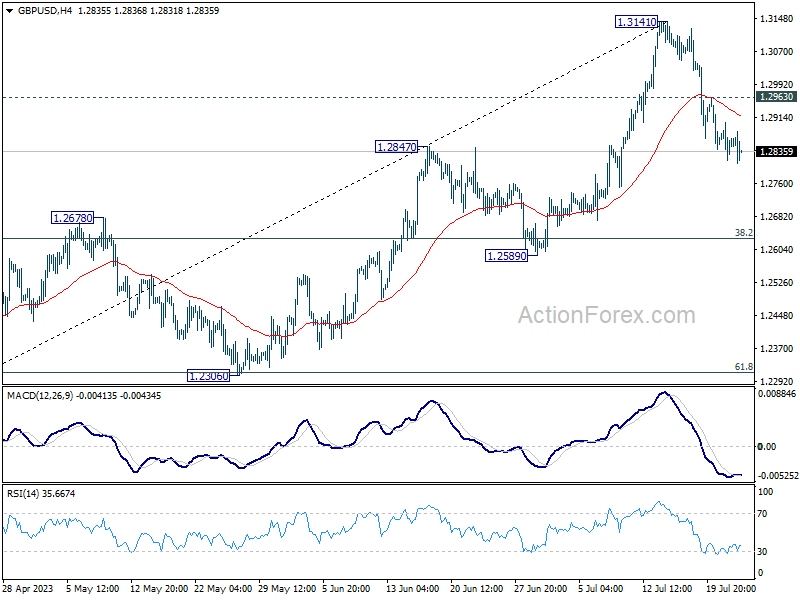
Daily Pivots: (S1) 1.2811; (P) 1.2858; (R1) 1.2899; More...
GBP/USD's decline from 1.3141 short term top continued today and intraday bias remains on the downside. Deeper fall would be seen to 55 D EMA (now at 1.2697) next. On the upside, break of 1.2963 minor resistance will turn bias back to the upside retest 1.3141 high instead.
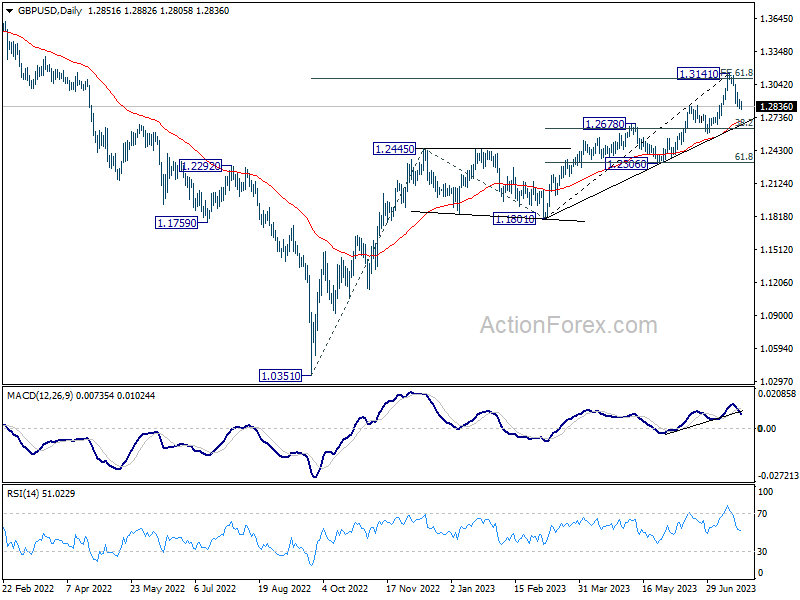
In the bigger picture, as long as 1.2678 resistance turned support holds, rise form 1.0351 (2022 low) is expected to continue. Next target is 100% projection of 1.0351 to 1.2445 from 1.1801 at 1.3895. However, sustained break of 1.2678 will argue that it's at least correcting this rally, with risk of bearish reversal.
Euro and Sterling Sink on Disappointing PMI Data, Bitcoin Tumbling
Euro and British Pound face some downward pressure today, following dismal PMI data that raises concerns about the prospect of further economic contraction in Eurozone and UK. With the German Ifo business climate index on the horizon tomorrow and ECB rate decision due on Thursday, Euro is likely to face additional scrutiny.
Meanwhile, Dollar seems to be in a marginally better position than both the Euro and Sterling. However, it's worth noting that the Greenback is currently seeing a lack of dedicated buying interest. On the other hand, in an interesting twist, Japanese Yen is making a comeback, bolstered by the decline in US and European benchmark treasury yields.
As for commodity currencies, New Zealand and Canadian Dollars appear to be leading the pack. However, Australian Dollar is noticeably lagging behind. Swiss Franc, while performing well against its European counterparts, presents a mixed picture overall.
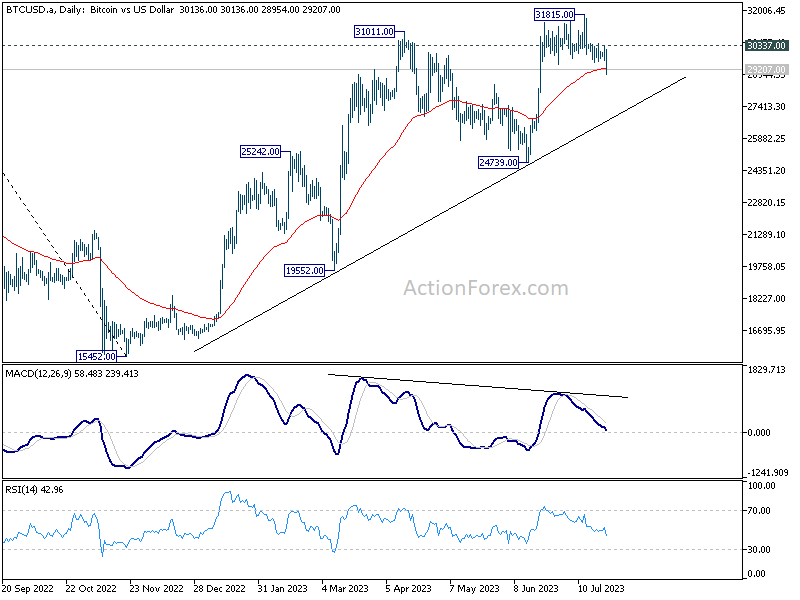
Technically, Bitcoin's break of 55 DMA should confirm short term topping at 31815. Risk will now stay on the downside as long as 30337 resistance holds. Deeper fall should be seen to trend support support at around 26500. While it's premature to conclude that the corrective rebound from 15,452 has run its course, bearish divergence observed in D MACD is a cautionary signal.
In Europe, at the time of writing, FTSE is down -0.23%. DAX is down -0.12%. CAC is down -0.53%. Germany 10-year yield is down -0.089 at 2.407. Earlier in Asia, Nikkei rose 1.23%. Hong Kong HSI fell -2.13%. China Shanghai SSE dropped -0.11%. Singapore Strait Times dropped -0.40%. Japan 10-year JGB yield dropped -0.0148 to 0.451.
UK PMI composite fell to 50.7, reigniting recession fears
UK's economic landscape appears increasingly precarious, as evidenced by disappointing July PMI readings. Manufacturing PMI plunged to a 38-month low of 45.0, from 46.5 and underperforming expectation of 46.1. the Services PMI dipped to a 6-month low of 51.5, falling short of the anticipated 53.1, and down from 53.7. Composite PMI, encapsulating both sectors, dropped to a 6-month low of 50.7 from 52.8.
Chris Williamson, Chief Business Economist at S&P Global Market Intelligence, expressed significant concern over these figures. "The UK economy has come close to stalling in July which, combined with gloomy forward-looking indicators, reignites recession worries," he noted. "July's flash PMI survey data revealed a deepening manufacturing downturn accompanied by a further cooling of the recent resurgence of growth in the service sector."
Further bolstering this pessimistic outlook, forward-looking indicators, such as order book inflows, levels of work-in-hand, and future business expectations, suggest a potential weakening of growth in the coming months. Williamson warned, "these all point to growth weakening further in the months ahead, adding to a risk of GDP falling in the third quarter."
While this decline in growth and demand paints a gloomy picture, there's a silver lining in the form of cooling inflationary pressures. "Although ongoing upward wage pressures mean service sector price growth remains elevated, the survey data signal further, potentially marked, falls in consumer price inflation in the months ahead," added Williamson.
Eurozone PMI manufacturing down o 38-mth low, PMI services at 6-mth low
Eurozone's economic outlook appears increasingly gloomy as latest PMI readings for manufacturing and services sectors disappoint, suggesting further contraction may lie ahead. Manufacturing PMI declined to 42.7 in July from 43.4, a 38-month low and below expectations of 43.5. Simultaneously, Services PMI dropped to a 6-month low of 51.1, short of the projected 51.5, and down from 52.0. Composite PMI, reflecting both sectors, sank to an 8-month low of 48.9, down from 49.9.
Cyrus de la Rubia, Chief Economist at Hamburg Commercial Bank, expressed his concern, stating, "Manufacturing continues to be the Achilles heel of the eurozone. Producers have cut their output again at an accelerated pace in July, while the services sector's activity is still expanding, though at a much slower rate than earlier in the year." He further warned, "The eurozone economy will likely move further into contraction territory in the months ahead, as the services sector keeps losing steam."
This less than encouraging data will surely unsettle ECB, as cost pressures in the private sector remain persistent, particularly in the substantial services sector. "The latest PMI reading is not going to please ECB officials...Thus, ECB president Christine Lagarde will certainly stick to her guns and hike interest rates by 25 bp at the next monetary meeting at the end of July," de la Rubia explained.
Meanwhile, France's manufacturing PMI slid to a 38-month low at 44.5, down from 46.0, while its services PMI fell to 47.4, a 29-month low, from 48.0. The composite PMI followed suit, dropping to a 32-month low at 46.6, down from 47.2.
Germany's manufacturing PMI took a dive from 40.6 to 38.8, also a 38-month low. Services declined to a 5-month low at 52.0 from 54.1, and the composite PMI fell to an 8-month low of 48.3, down from 50.6.
Japan PMI manufacturing slipped to 49.4, resurgence in price pressures
Japan's PMI Manufacturing dropped slightly from 49.8 in June to 49.4 in July, falling short of the forecasted 50.1. Despite this, PMI Manufacturing Output showed a minor uptick, climbing from 48.1 to 48.4. PMI Services saw a small decline, edging down from 54.0 to 53.9. Composite PMI, indicative of the overall health of the economy, was unchanged at 52.1.
Usamah Bhatti, an Economist at S&P Global Market Intelligence, highlighted that activity among private sector firms in Japan extended its growth streak for the seventh consecutive month. The persistence of this trend is largely attributable to steady and considerable improvement in service providers, while manufacturers reported a softer downturn at the dawn of Q3.
However, Bhatti underscored a less robust demand situation among private sector firms compared to the previous survey period. The latest data points to only a marginal increase in new orders, signaling a possible slowdown in demand.
Notably, the second half of 2023 has seen "renewed strengthening in price pressures" within the private sector. Pace of input price inflation has quickened for the first time since January. This trend is reflected across both manufacturing and service sectors, with both reporting steeper rates of output price inflation.
Australia PMI composite fell to 48, but still on narrow path for soft landing
Australia's PMI Manufacturing recorded a mild uptick in July, rising from 48.2 to 49.6, marking a 5-month high, but still falling short of the expansionary threshold of 50. Concurrently, PMI Services took a downward turn from 50.3 to 48.0, hitting a 7-month low. Consequently, Composite PMI, a measure of combined sectors, dipped from 50.1 to 48.3, which is also a 7-month low.
Warren Hogan, Chief Economic Advisor at Judo Bank, attributed the soft July figures predominantly to a dip in business activity in the services sector, which had previously been on a recovery path in 2023. But the "Australian economy remains on the 'narrow path' for a soft landing."
The July Flash report raised some concerns regarding inflation. Despite the slowdown in activity, price indicators trended higher, particularly within the services sector. These inflationary signals remain elevated, pointing to a potential inflation rate of around 4-5%, substantially exceeding RBA's target of 2% to 3%.
Hogan noted that the disinflationary trend evident throughout 2022 "appears to have ceased". As such, July figures will provide critical insights into whether Australia's inflation aligns with the declining trends seen in other countries recently, or if the nation is "set to experience a more sticky inflation trend in 2023/24."
NZ goods exports up 1.3% yoy in Jun, imports down -14% yoy
In June 2023, New Zealand's goods exports observed a modest rise of 1.3% yoy, an equivalent of NZD 84m, taking the total to NZD 6.3B. Conversely, the nation witnessed a significant drop in goods imports by -14.0% yoy, or NZD -1.1B, reducing the total to NZD 6.3B. This left the monthly trade balance at a surplus of NZD 9m, notably below market expectations of NZD 235m.
A deeper look into the country's top trading partners unveiled mixed outcomes in exports. June 2023 saw a decline in total exports to China by NZD -124m (-7.2% yoy), and to EU by NZD -98m (-20%). Moreover, exports to Japan also slipped by NZD -56m (-13%). On a positive note, exports to Australia and US increased by NZD 190m (30%) and NZD 91m (13%) respectively.
In terms of imports, there were notable reductions across the board. China, one of New Zealand's principal import partners, witnessed a drop by NZD -232m (-16% yoy), while EU observed a decrease of NZD -100m (-9.2%). Furthermore, imports from Australia and US fell by NZD -93m (-12%) and NZD -96m (-14%) respectively. South Korea recorded the most substantial decline in exports to New Zealand, with a drop of NZD -136m (-26%).
GBP/USD Mid-Day Outlook
Daily Pivots: (S1) 1.2811; (P) 1.2858; (R1) 1.2899; More...
GBP/USD's decline from 1.3141 short term top continued today and intraday bias remains on the downside. Deeper fall would be seen to 55 D EMA (now at 1.2697) next. On the upside, break of 1.2963 minor resistance will turn bias back to the upside retest 1.3141 high instead.
In the bigger picture, as long as 1.2678 resistance turned support holds, rise form 1.0351 (2022 low) is expected to continue. Next target is 100% projection of 1.0351 to 1.2445 from 1.1801 at 1.3895. However, sustained break of 1.2678 will argue that it's at least correcting this rally, with risk of bearish reversal.
Economic Indicators Update
| GMT | Ccy | Events | Actual | Forecast | Previous | Revised |
|---|---|---|---|---|---|---|
| 22:45 | NZD | Trade Balance NZD Jun | 9M | 235M | 46M | 52M |
| 23:00 | AUD | Manufacturing PMI Jul P | 49.6 | 48.2 | ||
| 23:00 | AUD | Services PMI Jul P | 48 | 50.3 | ||
| 00:30 | JPY | Manufacturing PMI Jul P | 49.4 | 50.1 | 49.8 | |
| 07:15 | EUR | France Manufacturing PMI Jul P | 44.5 | 46.1 | 46 | |
| 07:15 | EUR | France Services PMI Jul P | 47.4 | 48.4 | 48 | |
| 07:30 | EUR | Germany Manufacturing PMI Jul P | 38.8 | 41.2 | 40.6 | |
| 07:30 | EUR | Germany Services PMI Jul P | 52 | 53.1 | 54.1 | |
| 08:00 | EUR | Eurozone Manufacturing PMI Jul P | 42.7 | 43.5 | 43.4 | |
| 08:00 | EUR | Eurozone Services PMI Jul P | 51.1 | 51.5 | 52 | |
| 08:30 | GBP | Manufacturing PMI Jul P | 45 | 46.1 | 46.5 | |
| 08:30 | GBP | Services PMI Jul P | 51.5 | 53.1 | 53.7 | |
| 13:45 | USD | Manufacturing PMI Jul P | 46.3 | |||
| 13:45 | USD | Services PMI Jul P | 54.4 |
EURCHF Bears’ Patience Rewarded for Now
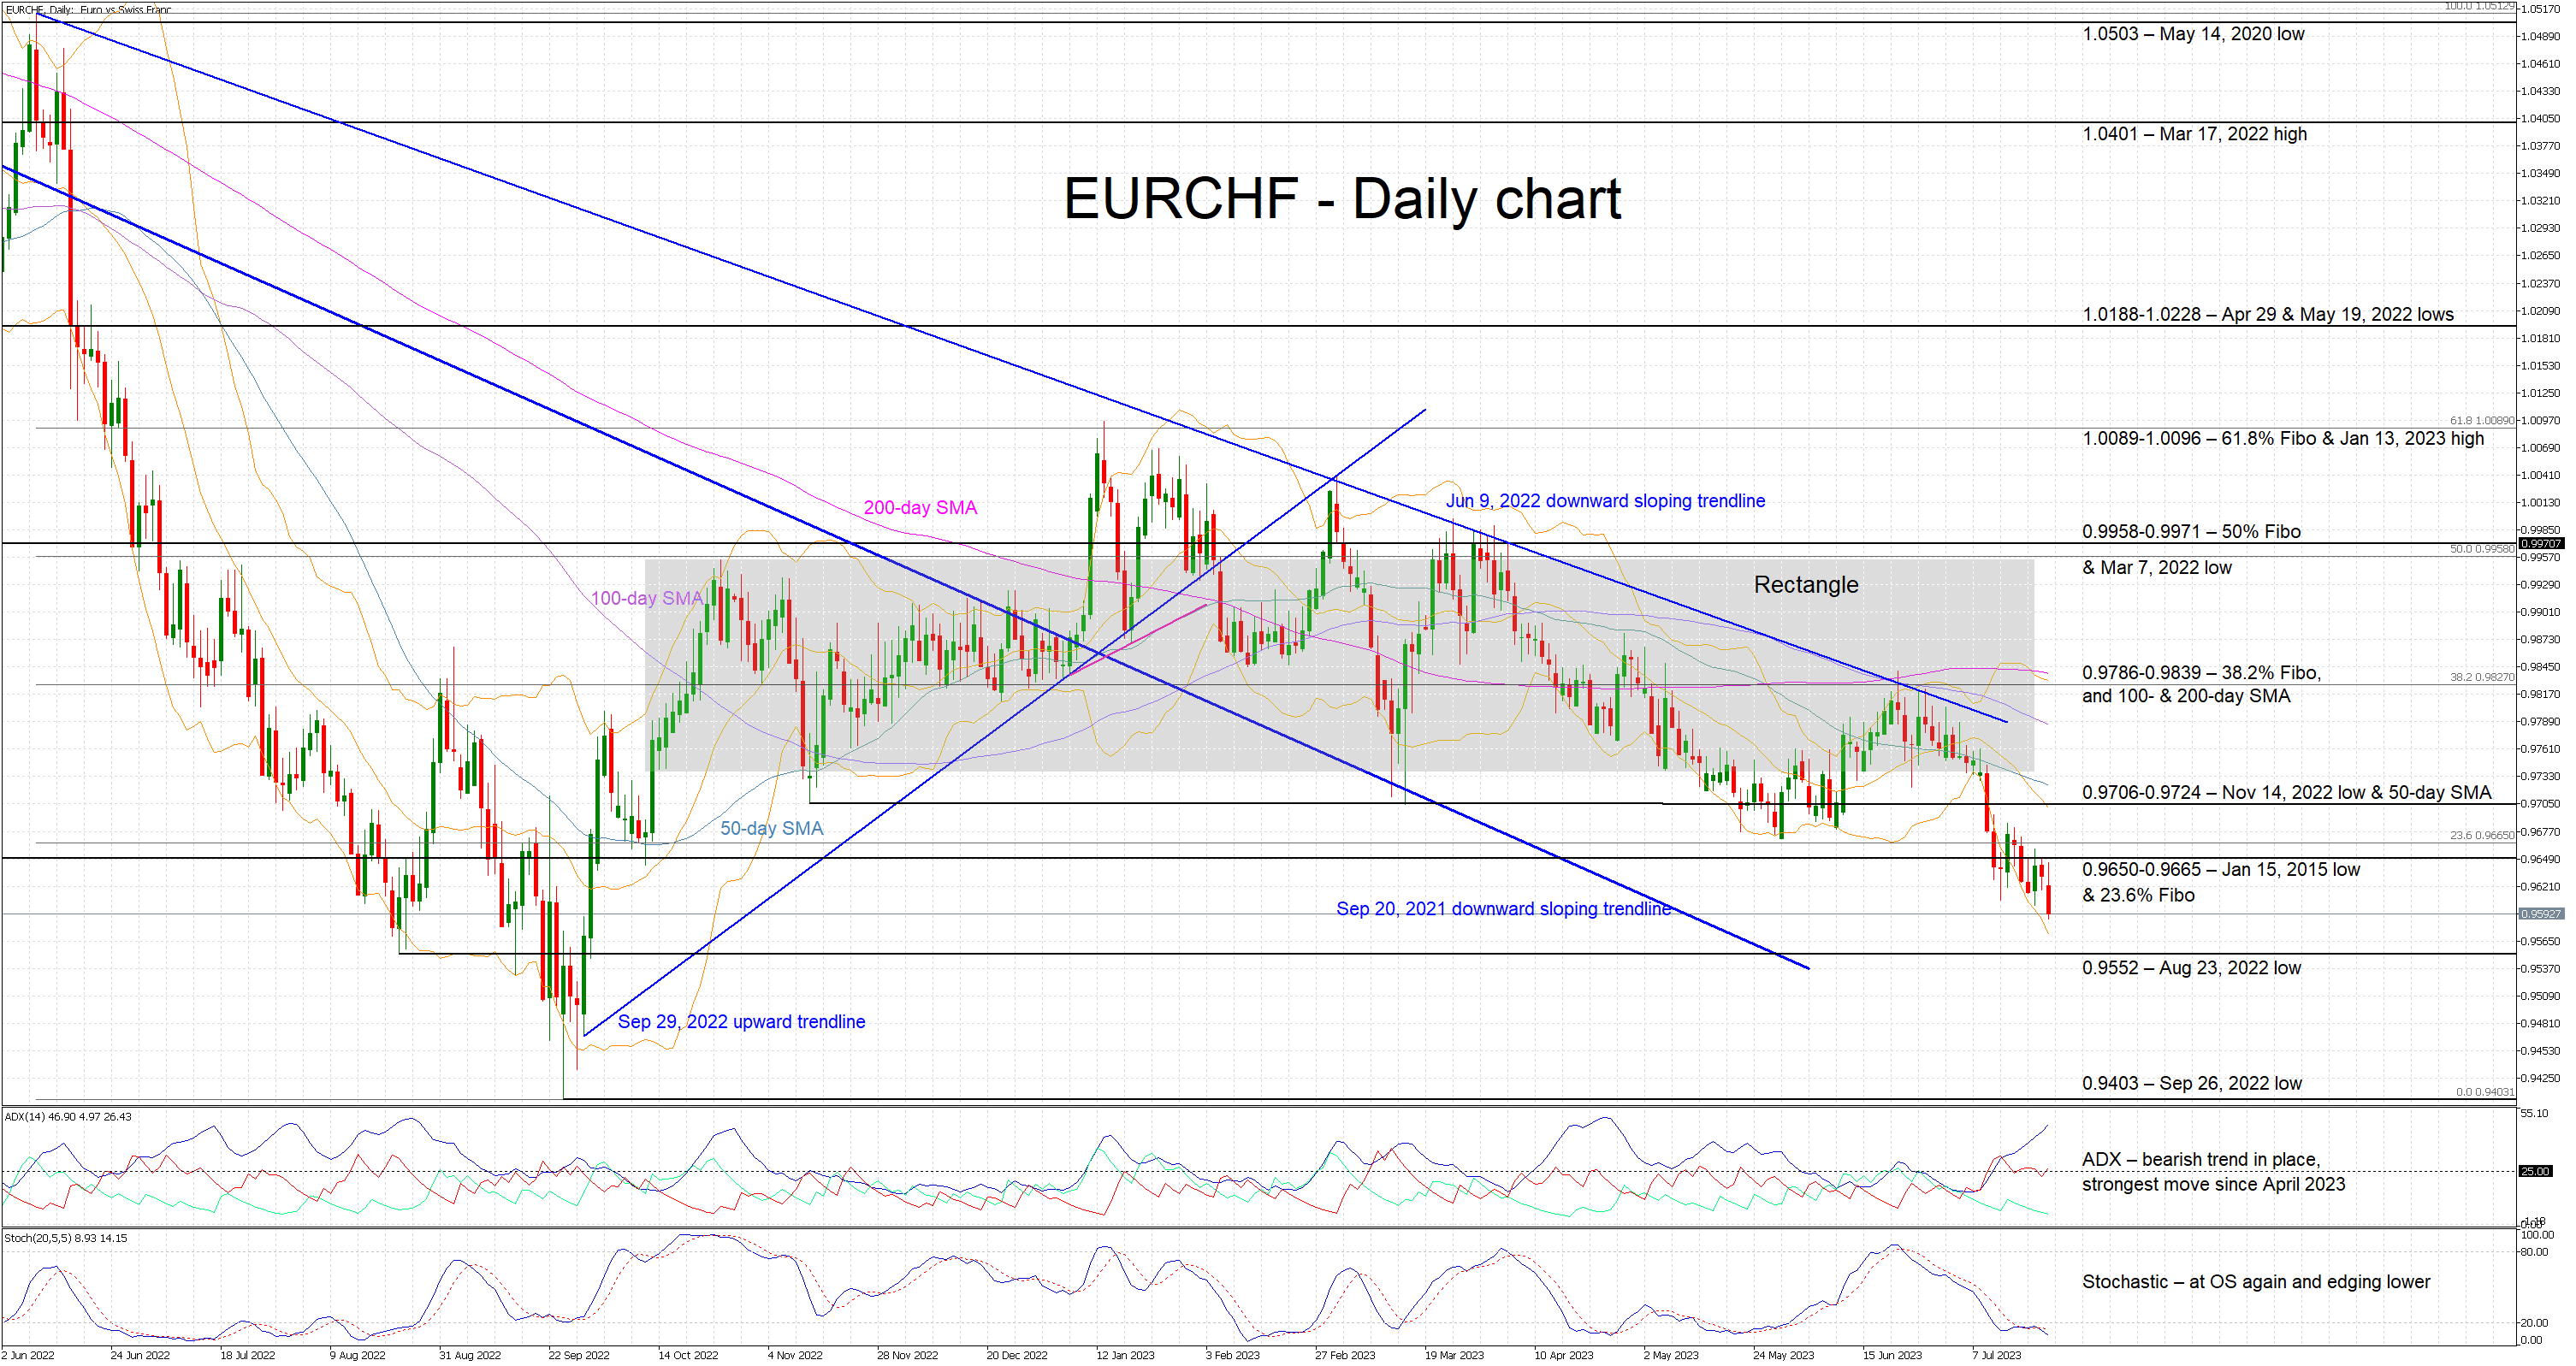
EURCHF is trading at a new 2023 low as the breakout from the 10-month-old rectangle appears to be valid. This is the lowest EURCHF print since September 30, 2022 with the pair not being very far from the all-time low of 0.9403. Bearish pressure has been dominating the price action since mid-January 2023, with the bulls appearing unable to stage a significant recovery, particularly after the mid-March events.
In the meantime, the Average Directional Movement Index (ADX) confirms the strength of the current downleg as it trades to the highest level since late-April. Crucially, the stochastic oscillator remains stuck in its oversold territory and exhibits a tendency to record a lower low. This indicator can stay in this region for a while. A valid bullish breakout is needed for the market to start considering a possible reversal in EURCHF.
Should the bears decide to push EURCHF even lower, the first target standing in their way is the August 23, 2022 low at 0.9552. If successful in breaking this level, the door would then open for a more sizeable move towards the 0.9403 area, and the chance to record a new all-time low.
On the other hand, the bulls are probably frustrated by their inability to record a decent rally. They would like to reclaim the key 0.9650-0.9665 range that is defined by the January 15, 2015 low and the 23.6% Fibonacci retracement of the June 9, 2022 – September 26, 2022 downtrend respectively. Even higher, the 0.9706-0.9724 area should prove stronger to overcome, but if successful, the bears could then have a go at pushing EURCHF back inside the aforementioned rectangle.
To sum up, the bears remain in control of the market with the momentum indicators on their side. However, any sign of complacency is bound to be picked upon by the bulls as they are desperate for a rally towards the 0.9706 area.
CADJPY Calling The Rally After Elliott Wave Double Three
Hello fellow traders. In this technical article we’re going to take a look at the Elliott Wave charts of CADJPY forex pair, presented in members area of the of our website. As our members know, CADJPY is showing impulsive bullish sequences in the cycle from the 94.069 low. Consequently , we recommended members to avoid selling the pair and keep favoring the long side.The pair is bullish against the 98.36 low. Recently we got nice 3 waves pull back that unfolded as Elliott Wave Double Three Pattern. The pair found buyers right at the equal legs and made rally as expected. In further text we are going to explain Elliott Wave Forecast and Double Three Pattern.
Before we take a look at the real market example, let’s explain Elliott Wave Double Three pattern.
Elliott Wave Double Three Pattern
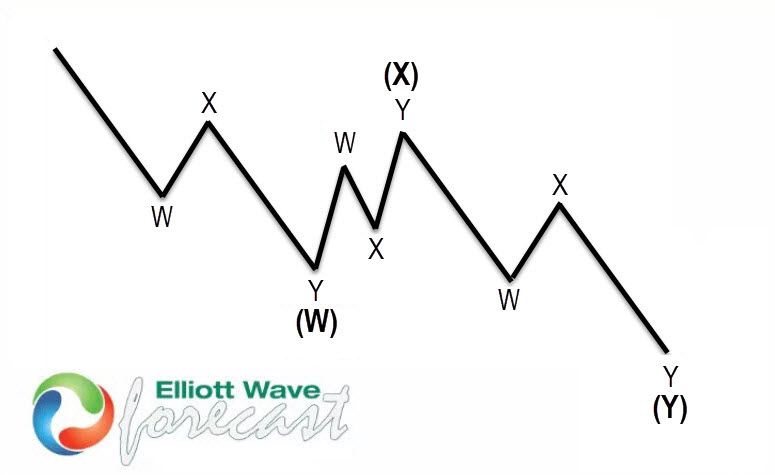
Double three is the common pattern in the market , also known as 7 swing structure. It’s a reliable pattern which is giving us good trading entries with clearly defined invalidation levels.
The picture below presents what Elliott Wave Double Three pattern looks like. It has (W),(X),(Y) labeling and 3,3,3 inner structure, which means all of these 3 legs are corrective sequences. Each (W) and (Y) are made of 3 swings , they’re having A,B,C structure in lower degree, or alternatively they can have W,X,Y labeling.
CADJPY Elliott Wave 4 Hour Chart 07.17.2021
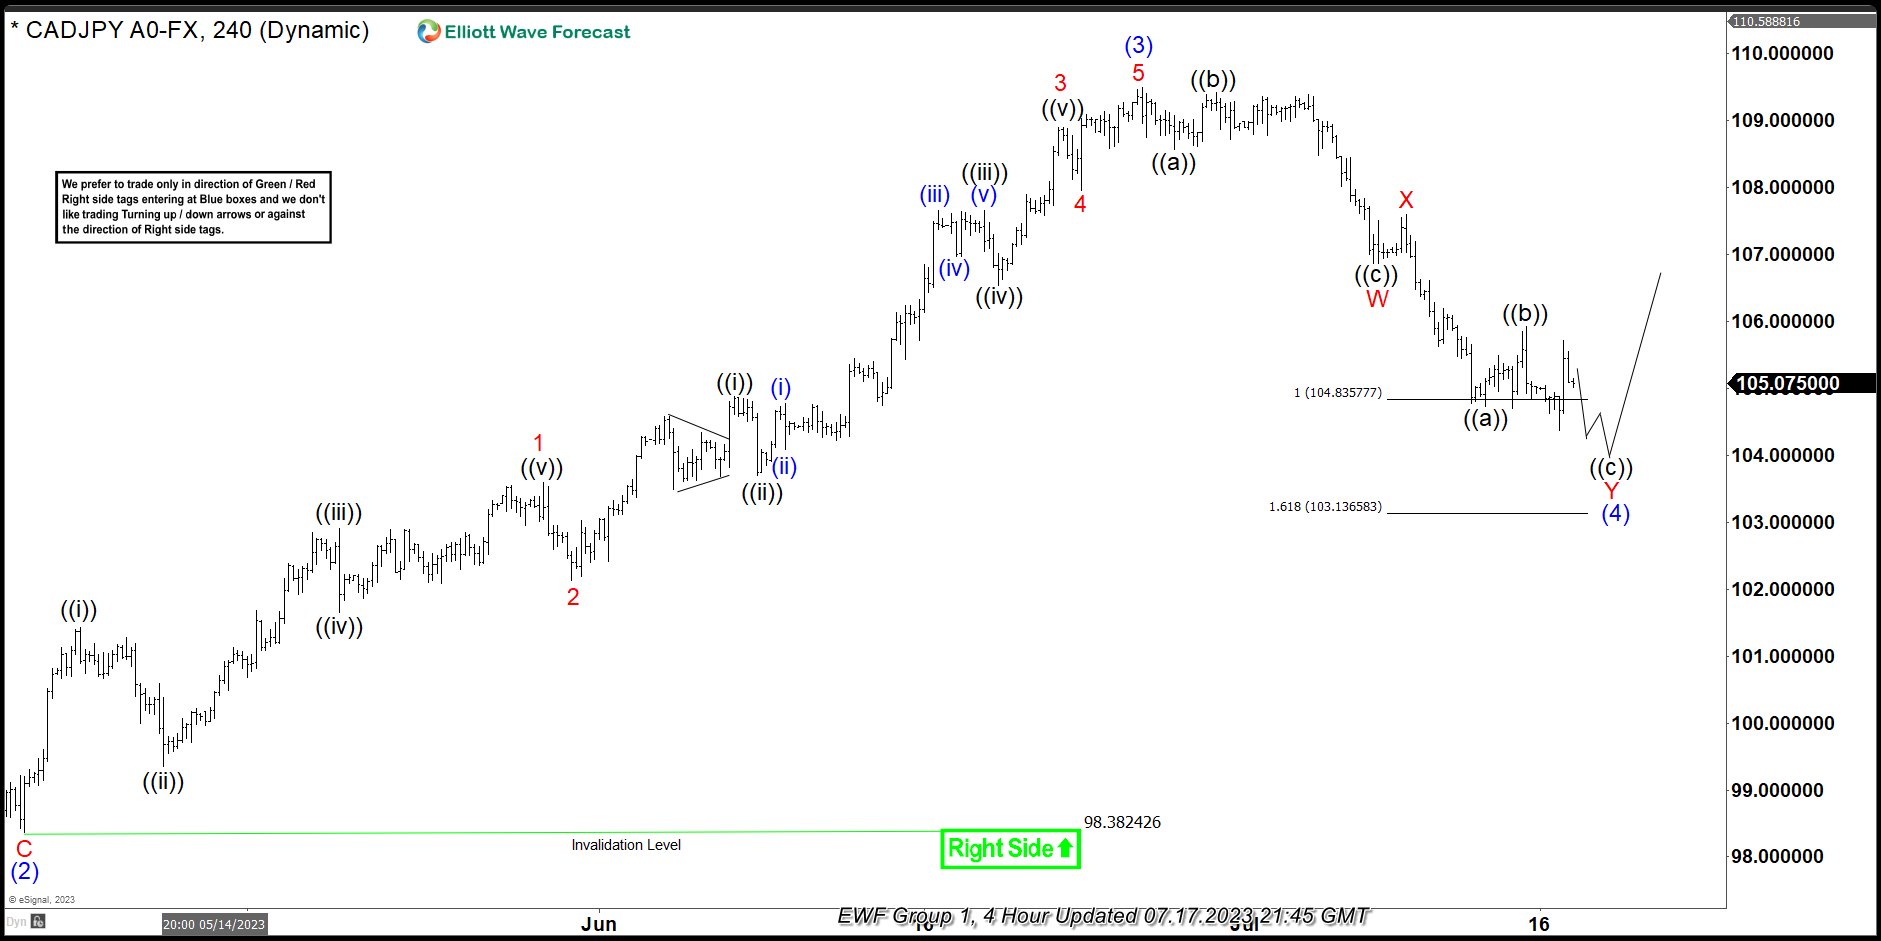
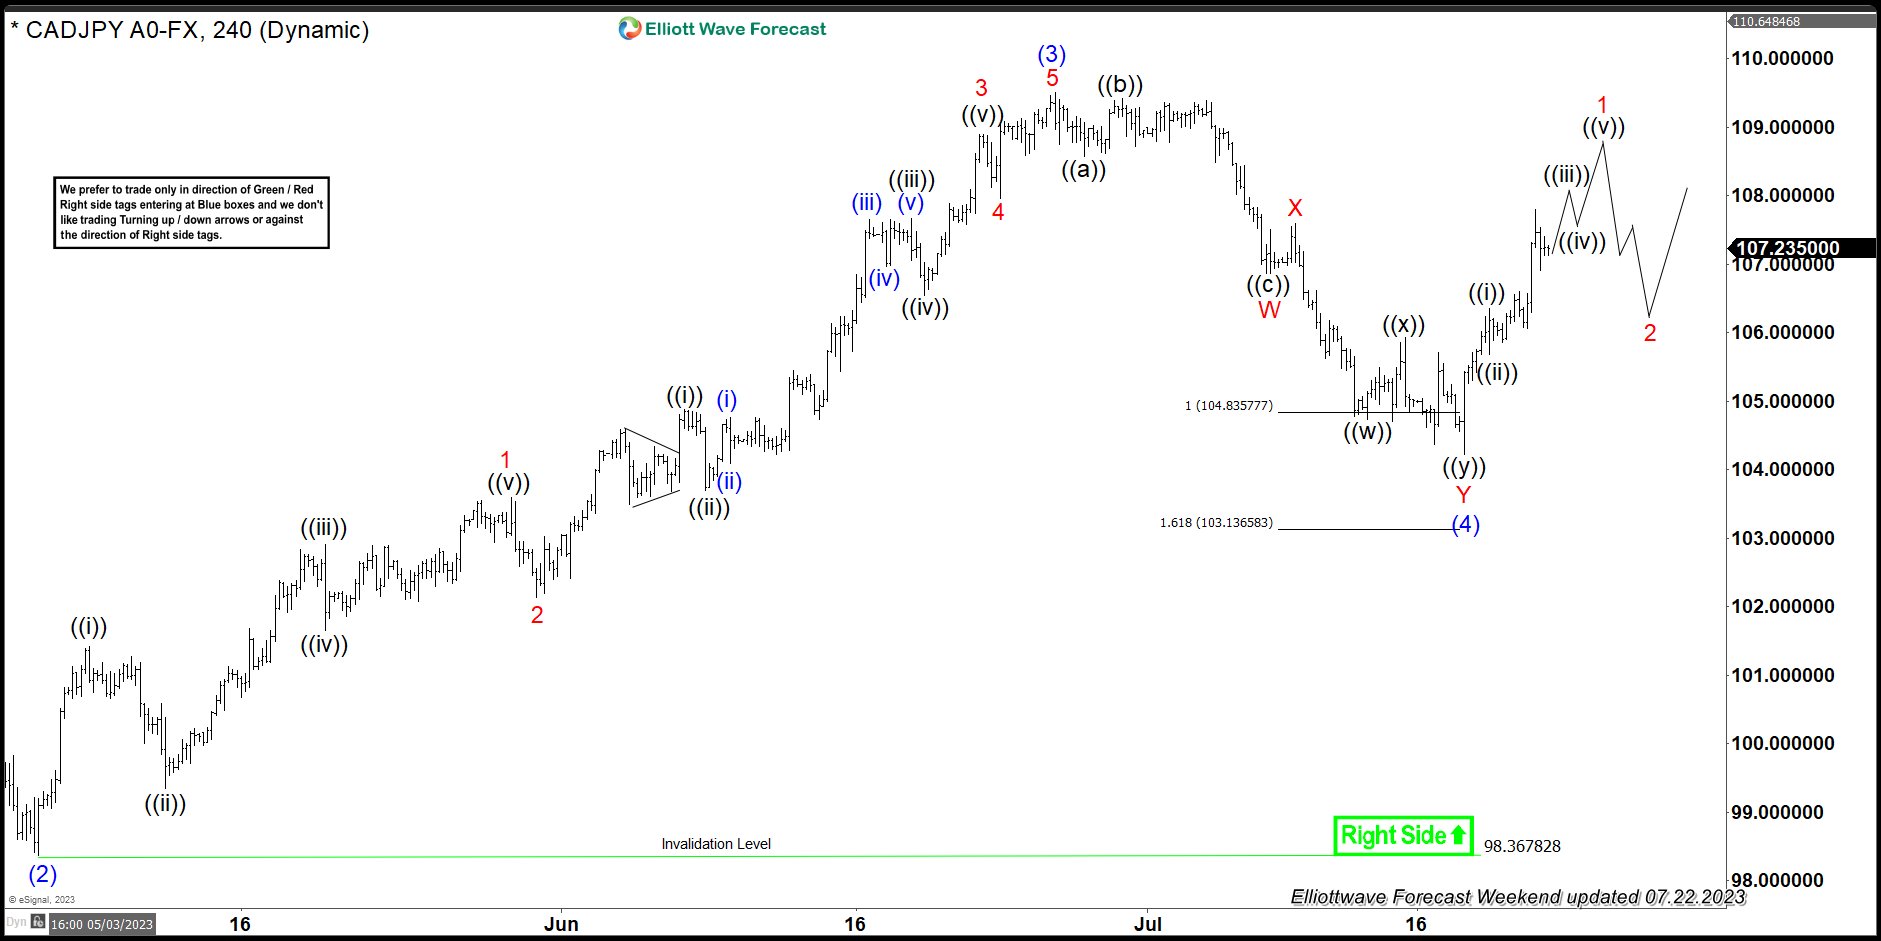
The pair has made 5 waves up in the rally from the 98.38.71 low which is considered to be wave (3) of larger bullish cycle. Current view suggests the pair can be still doing (4) blue correction that is unfolding as Elliott Wave Double Three Pattern with WXY red inner labeling. First leg W is showing corrective sequences – 3 waves down ((a))((b))((c)). Then we got 3 waves bounce in X red in shallow correction. The price has already reached extreme zone at 104.835-103.136. However wave Y red still can see another wave down to complete the pattern. We expect buyers to appear soon.
CADJPY Elliott Wave 4 Hour Chart 07.22.2021
Current view suggests the pair completed wave (4) blue pull back as a 7 swing pattern at the 104.24 low. The buyers appeared and we got nice reaction from the equal legs area. As far as the pivot at 104.24 low holds, the pair should ideally continue trading higher. Break of (3) blue is needed to confirm next leg up is in progress.
GBP/USD: Second Doji Signals That Bears Might Be Losing Traction
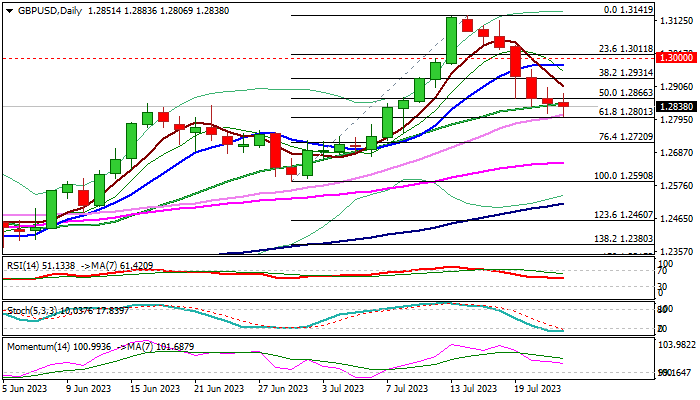
Cable edged lower in early Monday and hit new marginally lower two-week low, after bears probed through pivotal supports at 1.2866/48 (Fibo 50% of 1.2590/1.3141 / 20DMA) though losses were limited and near-term action influenced by Friday’s Doji candle, being so far in the same shape.
Bears pressure next pivot at 1.2801 (Fibo 61.8%) violation of which would further weaken near-term structure for deeper pullback.
On the other hand, oversold stochastic and neutral RSI, suggest that bears may take a breather above 1.2800 zone, with bearish bias expected to remain intact while the price action stays below broken Fibo 38.2% level at 1.2931, while acceleration through upper pivots at 1.2974/1.3000 (10DMA / psychological) would revive bulls and signal an end of corrective phase.
Res: 1.2866; 1.2904; 1.2931; 1.2974.
Sup: 1.2801; 1.2750; 1.2720; 1.2673.
NASDAQ 100 Technical: Bullish Exhaustion Sighted
- Last week, Nasdaq 100 underperformed against the other major US stock indices.
- Nasdaq 100 failed to have a weekly close above 15,690 key medium-term resistance and ended with a weekly bearish “Shooting Star” candlestick pattern.
- Key near-term support will be at 15,270 (20-day moving average).
Last week, the year-to-date highly flying technology-concentrated Nasdaq 100 underperformed with a weekly loss of -0.90% versus weekly gains seen in other major US stock indices; S&P 500 (+0.69%), Dow Jones Industrial Average (+2.08%), and Russell 2000 (+1.51%).
The underperformance of the Nasdaq 100 has been caused by the “Magnificent Seven” cohort with weekly losses seen in Telsa (-7.59%), Alphabet (-4.30%), Meta (-4.73%), Amazon (-3.48%), and Nvidia (-2.55%).
Nasdaq 100 failed to have a weekly close above 15,690 key medium-term resistance
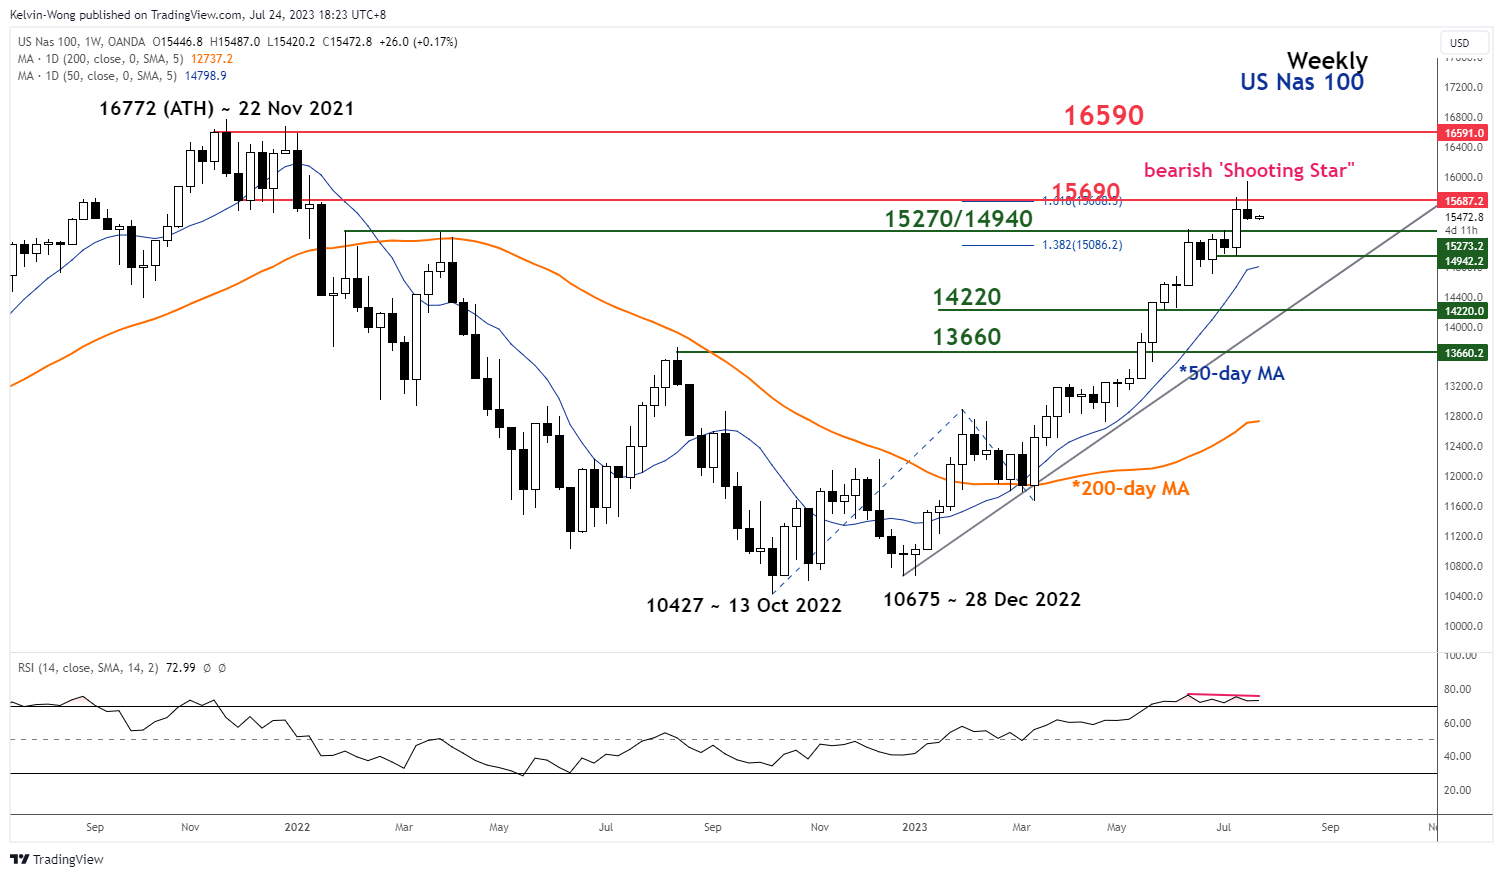
Fig 1: Nasdaq 100 major trend as of 24 Jul 2023 (Source: TradingView, click to enlarge chart)
The initial price actions of the US Nas 100 Index (a proxy for the Nasdaq 100 futures) breached above the 15,690 key medium-term resistance in the first half of last week but reintegrated below it last Thursday, 20 July, and failed to have a weekly close above 15,690.
In addition, it has formed a weekly bearish “Shooting Star” candlestick pattern which indicates that the bullish sentiment of the medium-term up move in place since the March 2023 low is likely to be exhausted (see weekly chart).
Also, the weekly RSI oscillator has traced out a bearish divergence signal at its overbought region which suggests medium-term and major upside momentum has started to wane. These observations increase the risks of a potential multi-week corrective decline below 15,690.
Price actions evolved into a minor downtrend phase
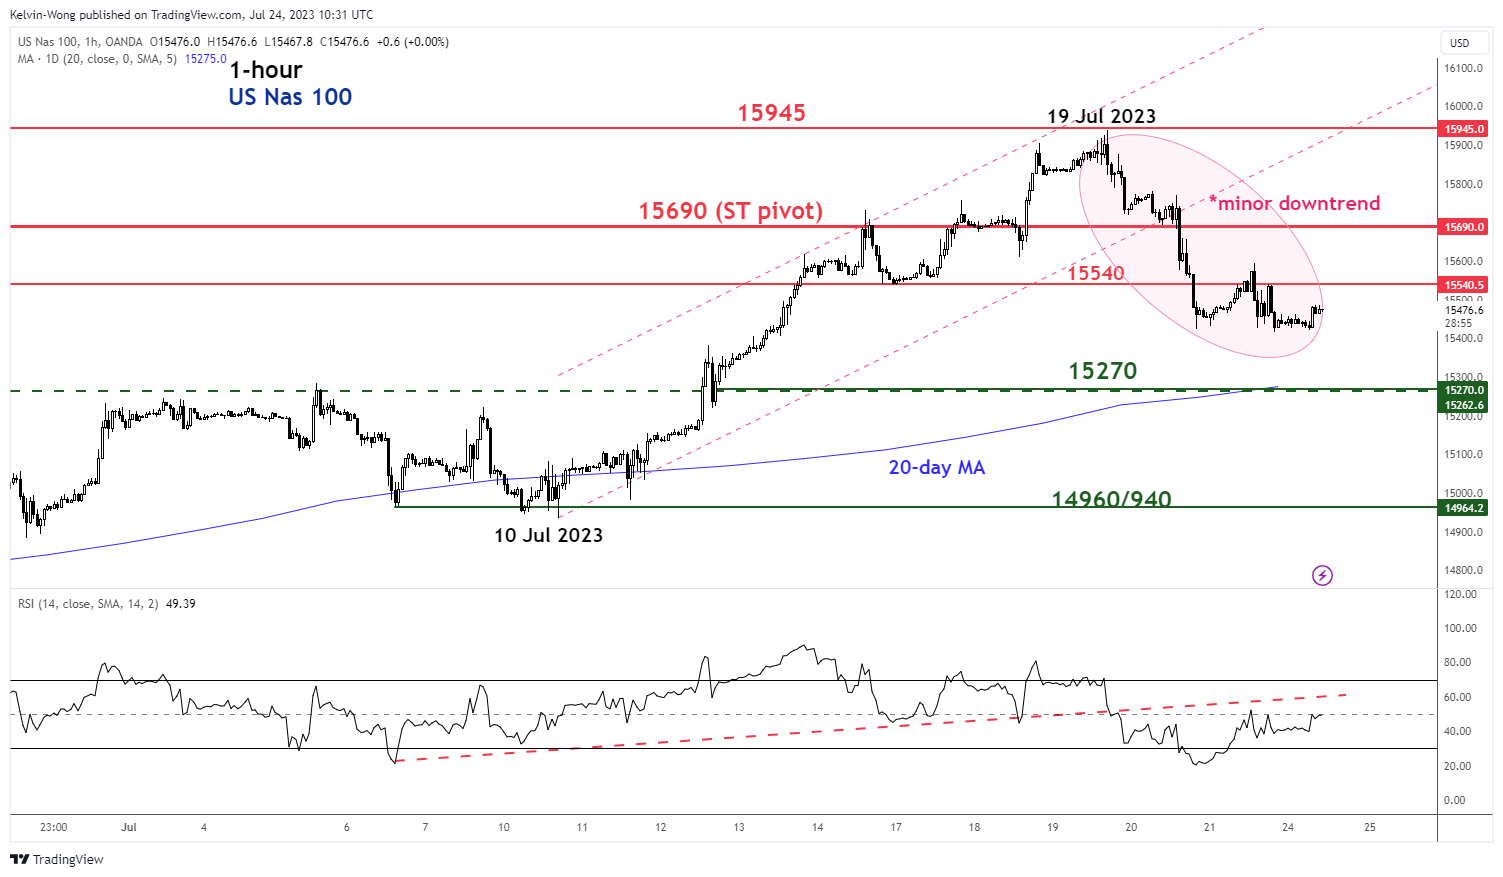
Fig 2: Nasdaq 100 minor short-term trend as of 24 Jul 2023 (Source: TradingView, click to enlarge chart)
Since its 19 July 2023 intraday high of 15,937, the price actions of the Index have traced out a series of “lower highs and lower lows” which indicate a minor downtrend phase is in progress.
Watch the 15,690 key pivotal resistance to maintain the minor downtrend with the next near-term support coming in at 15,270 (also the 20-day moving average).
However, a clearance above 15,690 negates the bearish tone to see the next resistance at 15,945.