

Sample Category Title
EUR/GBP Daily Outlook
Daily Pivots: (S1) 0.8612; (P) 0.8636; (R1) 0.8653; More...
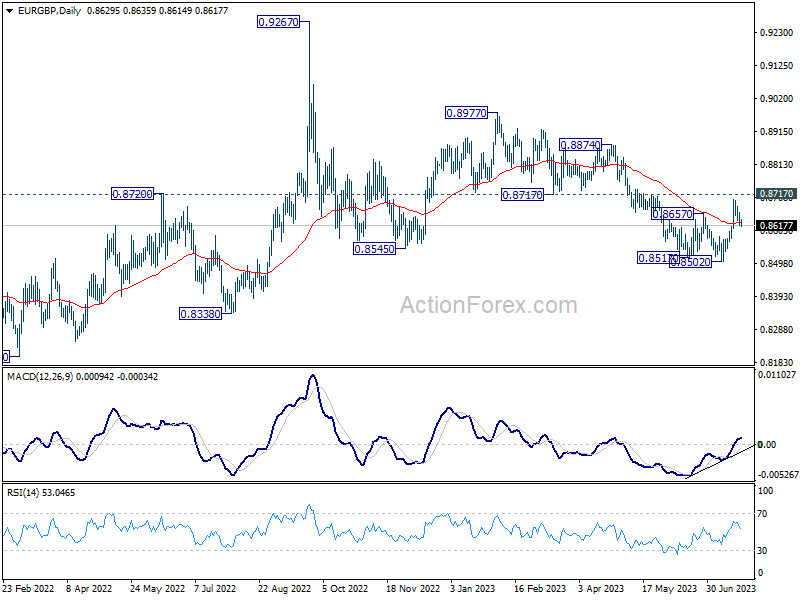
Intraday bias in EUR/GBP stays neutral with focus on 0.8619 minor support. Strong rebound from there and decisive break of 0.8717 support turned resistance will solidify that fall from 0.8977 has completed a five-wave decline. Further rally should then be seen to 0.8977 resistance next. On the downside, though, below 0.8619 minor support will mix up the outlook and turn bias back to the downside for retesting 0.8502 low.
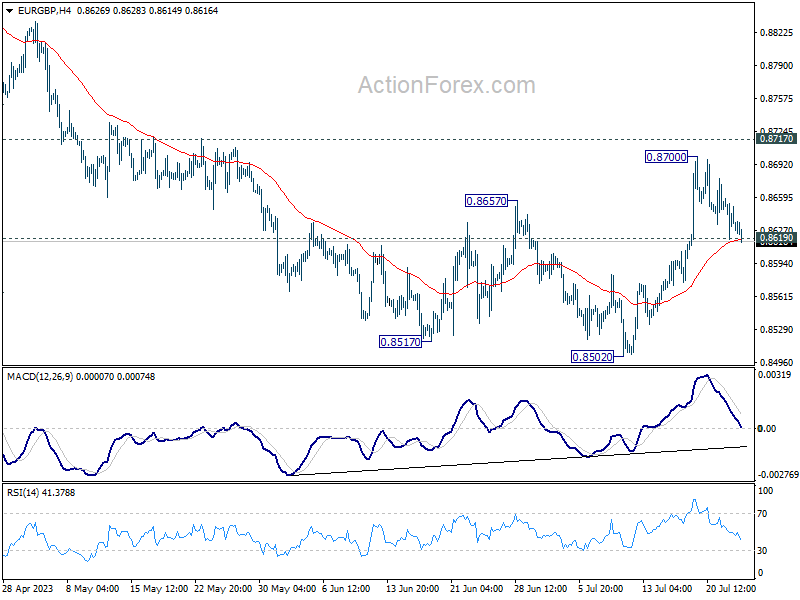
In the bigger picture, the down trend from 0.9267 (2022 high) is seen as part of the long term range pattern from 0.9499 (2020 high). Firm break of 0.8717 support turned resistance will argue that it has completed with three waves down to 0.8502. Further break of 0.8977 will bring retest of 0.9267 high. Nevertheless, break of 0.8502 will resume the decline towards 0.8201 (2022 low).
Little Reason to Expect EUR/USD to Easily Regain 1.1095 Ahead of Fed/ECB Meetings
Markets
Disappointing EMU July PMI’s set the tone for global trading yesterday morning. The composite measure dropped further into contraction territory (48.9 from 49.9) as activity in the manufacturing sector slumped further (42.7 from 43.4). Growth in the services sector remains positive (51.1 from 52.0) but is eroding too. Orders are declining both in manufacturing and services, causing companies to work through still existing backlogs. Employment in manufacturing is being reduced while growth in the services sector slows markedly. The disinflation process in the manufacturing sector continues. Higher wages still support higher costs and output prices in the services sector, but also here the pace of growth slows. The later remains an important factor in the ECB deliberation process on monetary policy. Even so, the negative EMU growth outlook still pushed EMU yields substantially lower. German yields initially dropped up to 7 bps +, but the bond rally eased during the US trading session. At the end of the day German yields dropped between 4.8 bps (2 & 5-y yield) and 1.2 bps (30-y). Momentum in US Treasuries gradually decoupled from what happened in Europe. The decline in US PMI’s was much more modest (composite 52.0 from 53.2) with a positive surprise from the manufacturing sector (49.0 from 46.3). Investors apparently also were a bit cautious to aggressively bid for the US 2-y auction going into Wednesday’s Fed decision. US yields finally gained between 8.2 bps (2-y) and 2.5 bps (30-y). US equities (S&P 500 +0.4%) outperformed Europe (EuroStoxx 50 -0.19%). Divergence in the outlook for activity and in yields propelled the dollar, especially against the euro. EUR/USD decisively dropped below the 1.1095 support to close at 1.1064. The UK PMI’s basically showed a similar picture compared to Europe (composite from 52.8 to 50.7). Still sterling slightly outperformed the single currency. EUR/GBP closed at 0.8627.
Today, Asian markets (except Japan) mostly trade in positive territory as investors see growing sings of Chinese authorities preparing additional measure to support activity, in particular the property sector. The yuan strengthens substantially (USD/CNY 7.149). The Aussie dollar profits too (AUD/USD 0.677). US yields are taking a breather after yesterday’s uptick an so does the dollar (DXY 101.3, EUR/USD 1.1076). Later today, The German IFO survey is expected to confirm yesterday’s poor PMI reading. Going into the ECB meeting, we also keep a close eye at the ECB lending survey. In the US, consumer confidence (Conference Board) is expected to improve from 109.7 to 112. Recent US consumer related data showed quite resilient. Investors probably will remain cautious to place big bets going into the Fed and the ECB meeting. Even so, the downside in US yields probably is better protect compared to Europe. In this context, there is also little reason to expect EUR/USD to easily regain the 1.1095 previous top ahead of the Fed/ECB meetings. The EUR/USD technical picture shows some cracks.
News and views
Germany is readying a €20bn subsidy package to support its semiconductor manufacturing industry. The move comes as the country seeks less international reliance for supplies of critical components, a strategy of which the flaws were laid bare after Covid and geopolitical tensions wrecked overseas supply chains. It can also be seen as a response to the US Inflation Reduction Act to attract investment. The money will be distributed to companies by 2027 and will be drawn from the Climate and Transformation Fund. The latter is an off-budget pot, originally designed for financing Germany’s decarbonization. But its scope is being increasingly expanded as the government vows to return to fiscal constraint after years of Covid and energy crisis spending.
International wheat prices over the course of a couple of days rose to the highest level in five months. The surge started when Russia withdrew from the UN-brokered deal to allow for Ukrainian grain export via the Black Sea last week. Adding to the upward pressures is yesterday’s Russian drone attack on a grain storage silo in Ukraine, resulting in a 2.6% wheat price increase, before paring gains to about 1%. After hitting the lowest level since December 2020, wheat currently trades about 33% higher at around $768/bu this morning. It comes amid other sharp price rises in the likes of rice (highest in more than two years) as crops are being threatened by the El Niño weather pattern. It is also bad news for central banks. Global food inflation was finally easing but that disinflation process may be thwarted by the current developments.
EUR/AUD Daily Outlook
Daily Pivots: (S1) 1.6359; (P) 1.6460; (R1) 1.6516; More...
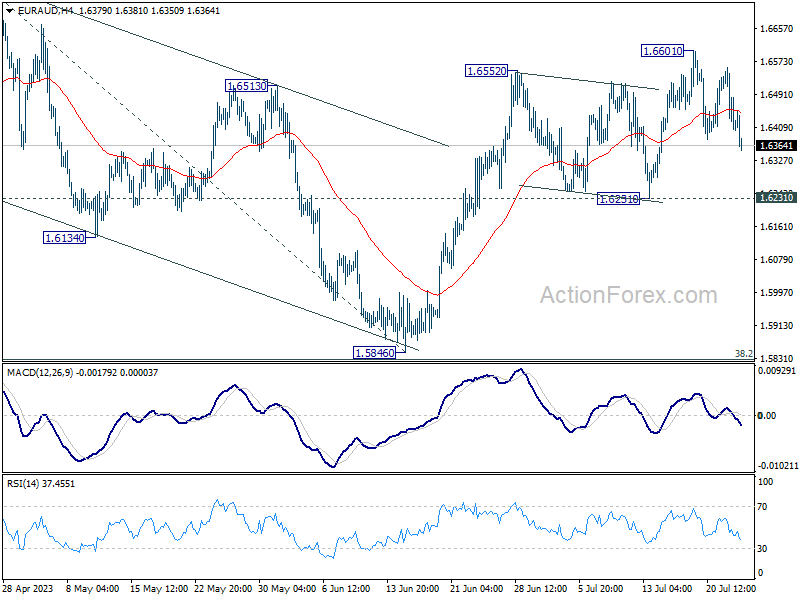
EUR/AUD's pull back from 1.6601 extends lower today but stays well above 1.6231 support. Intraday bias remains neutral first and outlook stays cautiously bullish. On the upside, break of 1.6601 will resume the rebound from 1.5846 and target 1.6785 high next. However, firm break of 1.6231 will bring deeper fall to extend the corrective pattern from 1.6785.
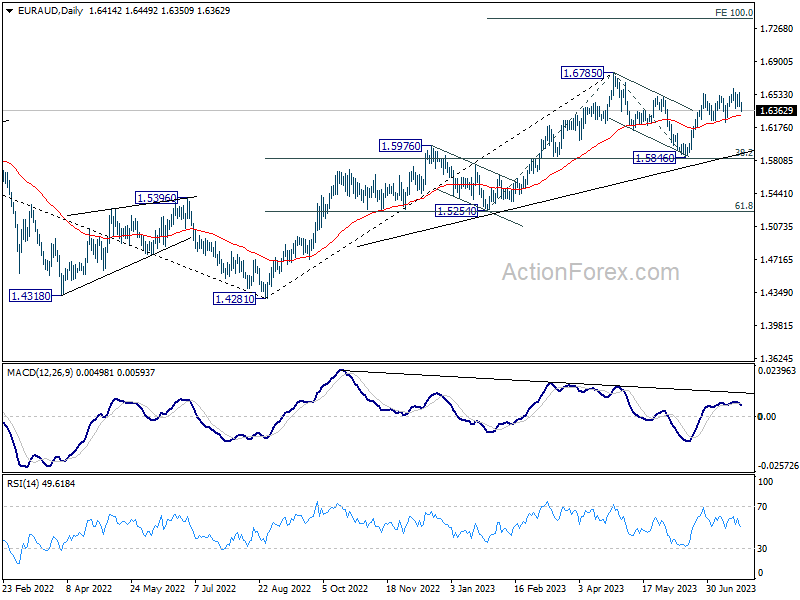
In the bigger picture, with 38.2% retracement of 1.4281 to 1.6785 at 1.5828 intact, rally from 1.4281 is still in progress. Firm break of 1.6785 will confirm rise resumption. Next target is 100% projection of 1.5254 to 1.6785 from 1.5846 at 1.7377. On the other hand, rejection by 1.6785 will extend the corrective pattern with another fall leg. But outlook will stay bullish as long as 1.5828 holds.
Aussie Rises With Yuan and Copper, Gold Poised for Rebound
Australian Dollar advances broadly today, buoyed by optimism surrounding news of stimulus from the Chinese government. This positive outlook has also lifted sentiment for Chinese Yuan and Copper. New Zealand Dollar has similarly benefited from this favorable sentiment, which is providing support to Sterling as well. Meanwhile, Dollar is slightly softening, alongside Yen and Swiss Franc.
Having stabilized from yesterday's sell-off following the PMI results, Euro now anticipates guidance from Germany's Ifo Business Climate Index. However, it's highly probable that traders will refrain from placing significant bets until FOMC and ECB rate decisions on Wednesday and Thursday respectively.
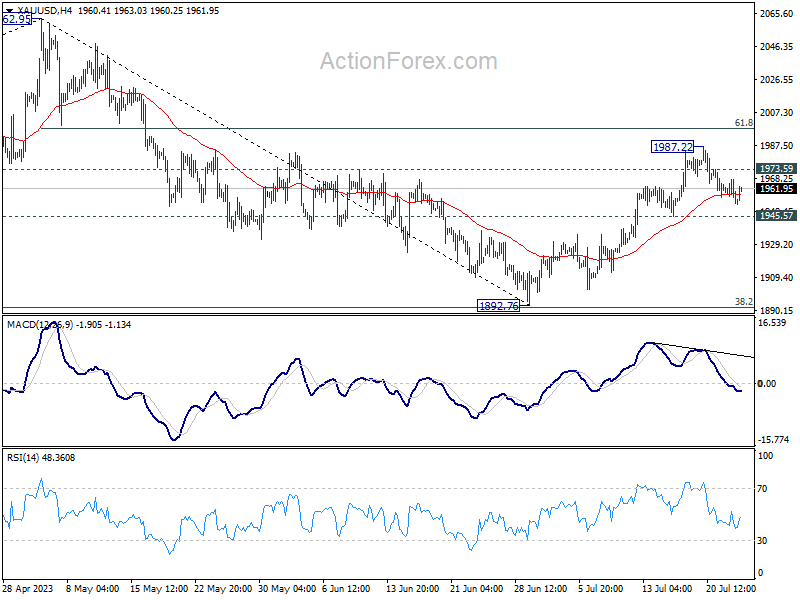
Technically, it could be about time for Gold to finish the pull back from 1987.22. Break of 1973.59 minor resistance will indicate that rebound from 1892.76 is ready to resume through 1987.22 to take on 2000 psychological level. If realized, that might come with renewed selloff in Dollar. On the other hand, break of 1945.57 support could prompt deeper selloff back to 1892.76 low, and that would be accompanied by extended rebound in the greenback.
In Asia, Nikkei closed down -0.15%. Hong Kong HSI is up 3.74%. China Shanghai SSE is up 2.01%. Singapore Strait Times is up 0.37%. Japan 10-year JGB yield is up 0.0136 at 0.465. Overnight, DOW rose 0.52%. S&P 500 rose 0.40%. NASDAQ rose 0.19%. 10-year yield rose 0.020 to 3.857.
HSI and Yuan surge as China pledges policy adjustments
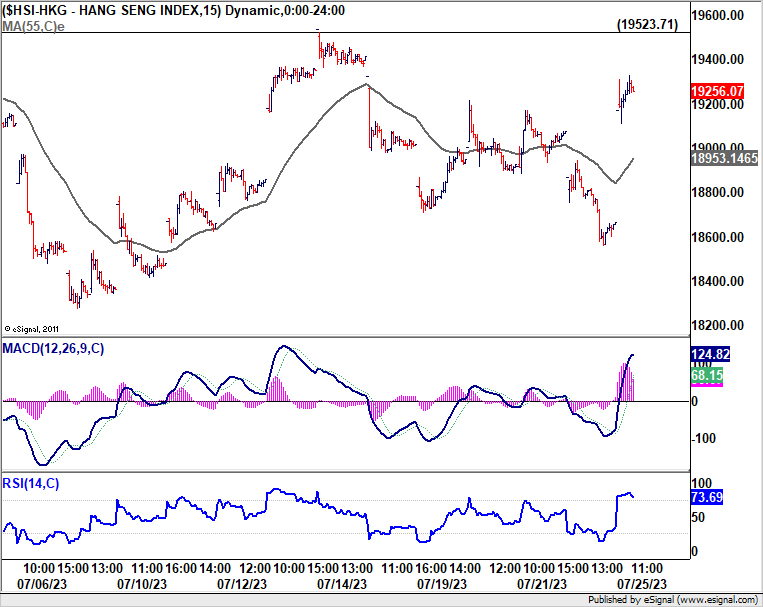
Hong Kong stocks are having a strong rebound today, concurrently with a surge in Chinese Yuan. These dynamic shifts come in the wake of a promise from China's Politburo to "adjust and optimize policies in a timely manner" for its troubled property sector. The top decision-making body has also underscored its commitment to promoting stable employment as a strategic objective. Other pledges include efforts to stimulate consumer spending and manage debt risks, and an intention to implement "counter-cyclical" policy.
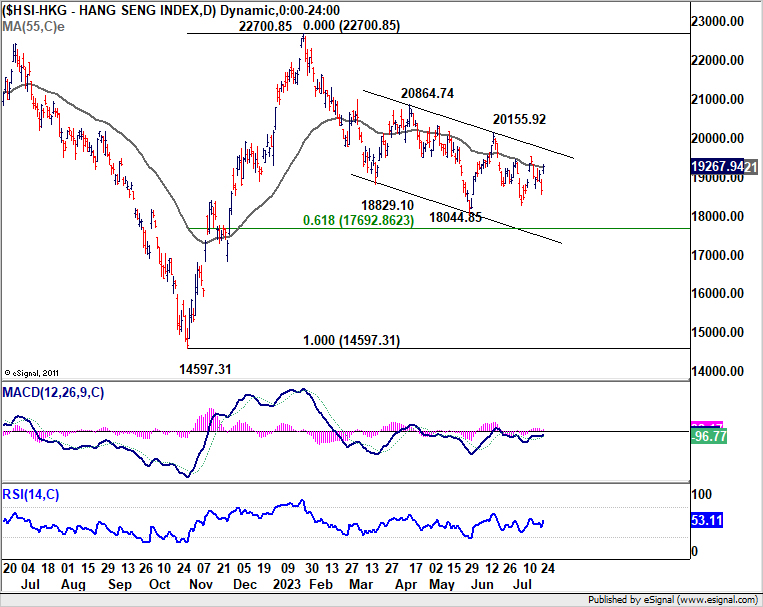
HSI opened with a substantial gap up and, at the time of writing, is trading over 3% higher. However, from a technical standpoint, HSI will need to convincingly overcome resistance level at 19523.71 and 55 D EMA to neutralize near-term bearish ness. Failing to do so, the decline from 22700.85 – whether it's seen as a corrective move or part of a larger downtrend – is still expected to extend beyond 18044.85 low.
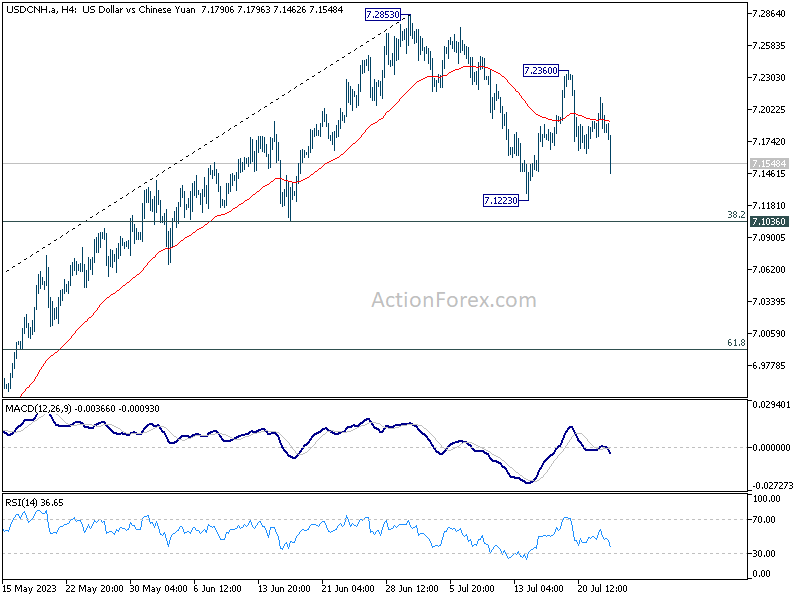
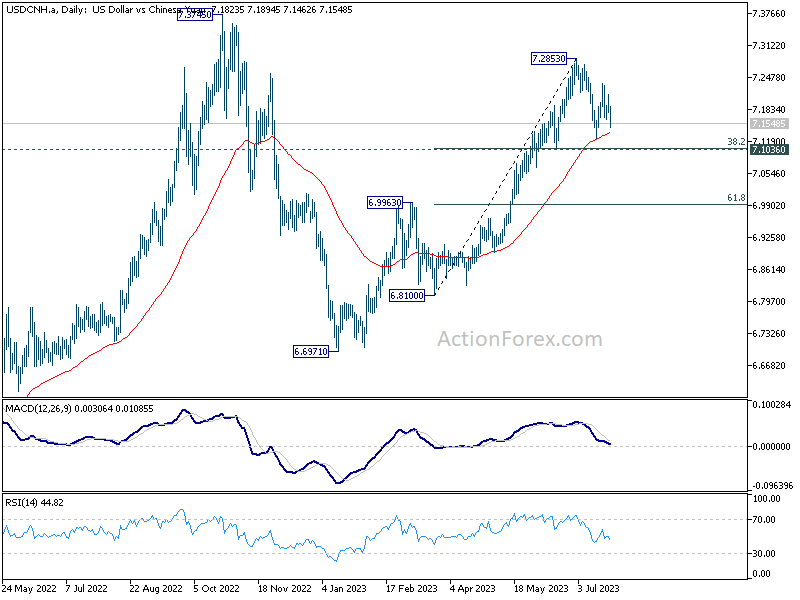
Meanwhile, USD/CNH is diving notably too. Market rumors suggest that major state-owned banks have been observed selling US Dollars to buy Yuan in both onshore and offshore spot markets to bolster Yuan exchange rate. On the whole, USD/CNH is seen as extending the corrective pattern from 7.2853 only. In case of deeper fall, strong support could emerge at around 38.2% retracement of 6.810 to 7.2853 at 7.1037 to bring rebound.
Copper and Aussie rally on China's stimulus optimism
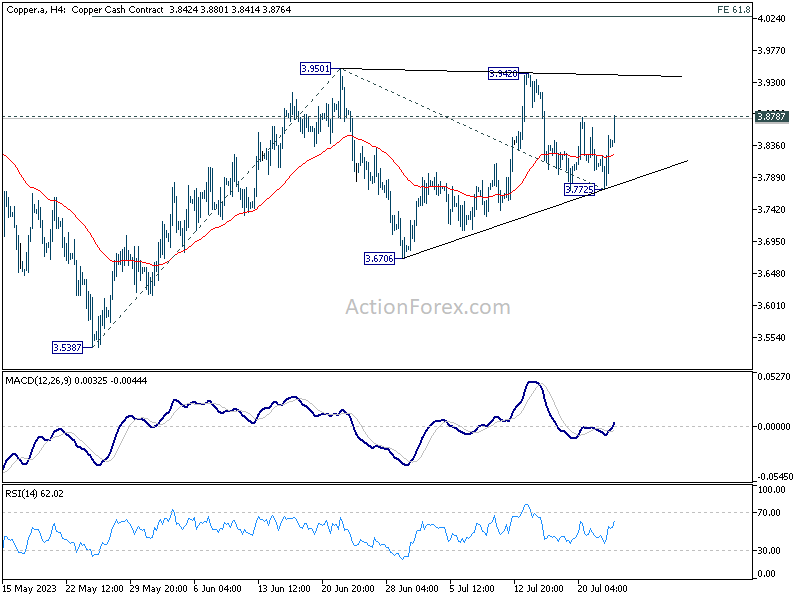
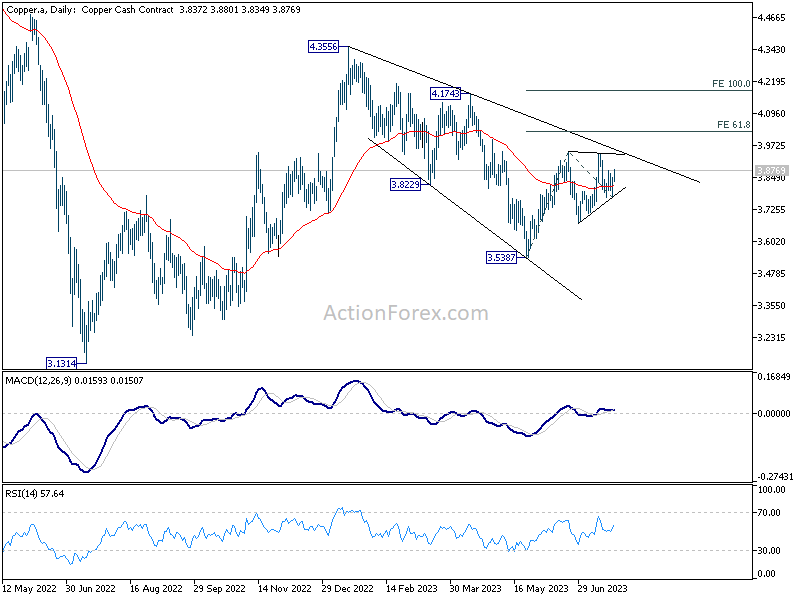
Copper rises notably today, on optimism of fiscal stimulus in China, or at least some policy adjustment. Australian Dollar is also taken higher too, even though it lags in momentum. The moves come with strong rally in Hong Kong stocks and Chinese Yuan in the background.
As for Copper, immediate focus in now on 3.8787 resistance. Firm break there will confirm that fall from 3.9420 has completed. That would also indicate the completion of the three-wave corrective pattern from 3.9501 at 3.7725. Further rise should then be seen to retest 3.9501 first. Firm break there will resume whole rise from 3.5387 to 61.8% projection of 5.5387 to 3.9501 from 3.7725 at 4.0267 next.
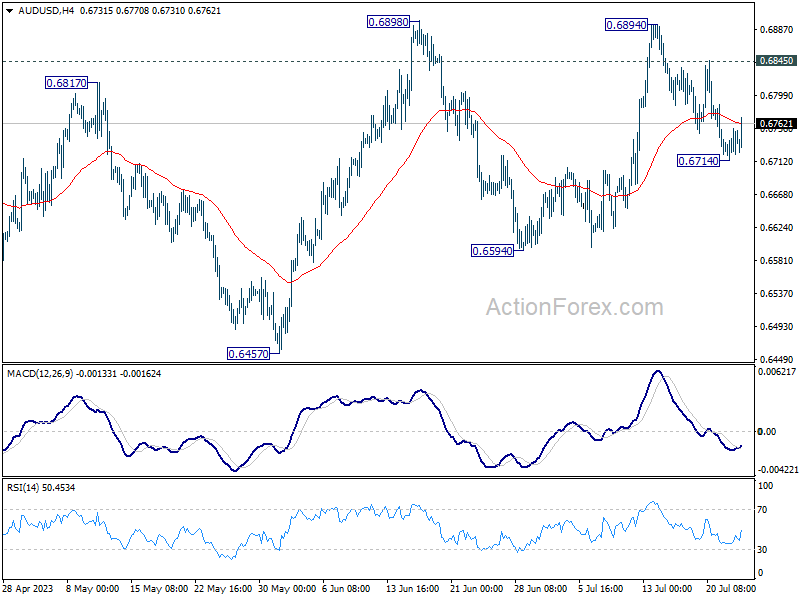
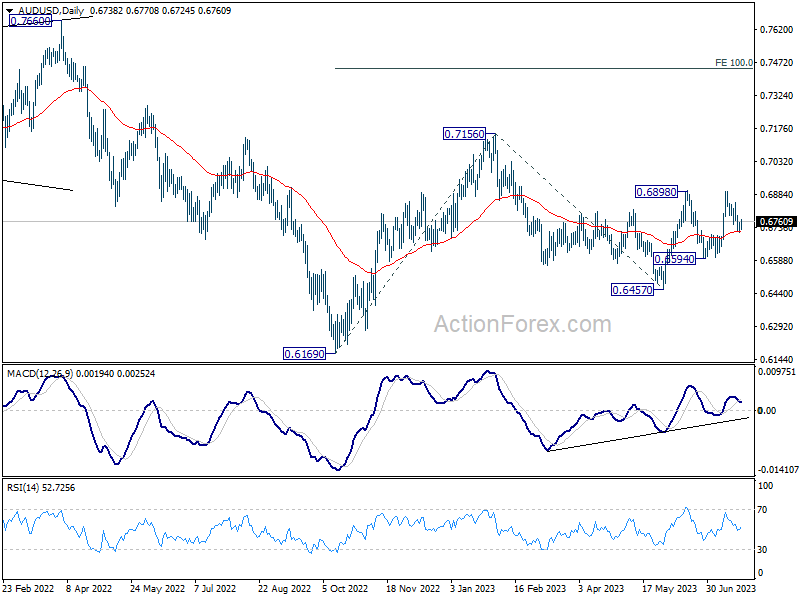
As for AUD/USD, a temporary low was formed at 0.6714 with current recovery. If the rally in Copper continues to gather strength, it could aid AUD/USD in pushing through 0.6845 resistance, or even surpassing 0.6898 to resume the entire rebound from 0.6457.
Looking ahead
Germany Ifo business climate is the main focus in European session. US consumer confidence will be the highlight in US session while house price index will also be released.
EUR/AUD Daily Outlook
Daily Pivots: (S1) 1.6359; (P) 1.6460; (R1) 1.6516; More...
EUR/AUD's pull back from 1.6601 extends lower today but stays well above 1.6231 support. Intraday bias remains neutral first and outlook stays cautiously bullish. On the upside, break of 1.6601 will resume the rebound from 1.5846 and target 1.6785 high next. However, firm break of 1.6231 will bring deeper fall to extend the corrective pattern from 1.6785.
In the bigger picture, with 38.2% retracement of 1.4281 to 1.6785 at 1.5828 intact, rally from 1.4281 is still in progress. Firm break of 1.6785 will confirm rise resumption. Next target is 100% projection of 1.5254 to 1.6785 from 1.5846 at 1.7377. On the other hand, rejection by 1.6785 will extend the corrective pattern with another fall leg. But outlook will stay bullish as long as 1.5828 holds.
Economic Indicators Update
| GMT | Ccy | Events | Actual | Forecast | Previous | Revised |
|---|---|---|---|---|---|---|
| 08:00 | EUR | Germany IFO Business Climate Jul | 88 | 88.5 | ||
| 08:00 | EUR | Germany IFO Current Assessment Jul | 93 | 93.7 | ||
| 08:00 | EUR | Germany IFO Expectations Jul | 83 | 83.6 | ||
| 13:00 | USD | S&P/Case-Shiller Home Price Indices Y/Y May | -1.40% | -1.70% | ||
| 13:00 | USD | Housing Price Index M/M May | 0.60% | 0.70% | ||
| 14:00 | USD | Consumer Confidence Jul | 112.1 | 109.7 | ||
| 14:00 | USD | Richmond Fed Manufacturing Index Jul | -10 | -7 |
Fed Meeting, Microsoft Earnings
There was nothing in the list of flash PMI data released yesterday morning to make investors think that economic activity in Europe is doing fine. All numbers were in the red, they all missed expectations. German and French manufacturing plunged further in the contraction zone and German manufacturing PMI even plunged below 39, a number we have not seen since summer 2020, which was the heart of the pandemic. The war, the energy prices, and/or the European Central Bank (ECB) tightening are taking a toll on the German manufacturing. And even the German car sector is struggling. Tesla for example sold more cars in H1 than Volkswagen, BMW, Mercedes and Porsche combined. Cherry on top of the bad news, the Spanish PPI showed an 8% contraction versus -10% penciled in by analysts. The EURUSD plunged below the 1.11, the trend and momentum indicators turned negative hinting that the selloff in the runoff to Thursday’s ECB meeting could extend toward the 1.10 mark, as the soft economic data brought forward the expectation that the ECB is certainly approaching the end the most aggressive tightening cycle of its relatively short history. But the softer-than-expected fall in Spanish PPI still keeps some hawks defending the idea that the ECB won’t stop fighting inflation if inflation doesn’t cool enough.
Don’t look now, but across the Channel, the PMI numbers didn’t look better. The UK manufacturing PMI fell to 45, while the composite PMI avoided the contraction territory by just a few points. Cable sold off to the lowest level in two weeks and is now testing the May to now ascending channel’s base, as traders put more weight on the damage that the rising Bank of England (BoE) rates will do to the British economy, than on the good they might do to sterling holders.
Across the Atlantic Ocean, the picture was a little but more mixed. US manufacturing remained in the contraction zone but contracted much slower than expected by analysts, but services and overall activity grew more slowly than expected, still. The US dollar index gained for the 5th consecutive session and is consolidating above the 101 level at the time of writing, as investors continue positioning for the Fed meeting that starts today.
The Fed starts its two-day policy meeting in just a couple of hours from now, and will highly likely announce a 25bp hike on Wednesday. But what Fed officials will also do is to remind investors that the tightening cycle is probably not over and that there will probably be another rate hike on the US’ horizon. So yes, there is a great chance that the Fed will spoil your mood if you are among those thinking that this week’s rate hike will be the last for this tightening cycle in the US.
Markets
US stocks traded higher yesterday with the S&P500 adding 0.40% and Nasdaq 0.14% after its special rebalancing. The US 2-year yield advanced past 4.90% and fell this morning. While the VIX index shows no sign of a particular stress from equity traders, BoFA’s MOVE index is close to 110 level, versus around the 60 level prior to the Q3 of 2021: bond traders remain very much uncertain about the number of additional rate hikes that the Fed could deliver. And there is no line in the sand, the Fed will continue hiking if the US jobs market, consumption and housing market remain resilient to interest rate hikes.
Microsoft earnings
Today, Microsoft is due to announce its Q2 earnings after the bell. Focus is on whether, and by how much Microsoft benefited from the AI craze and how much AI boosted growth for Azure – which was under pressure since a couple of quarters due to macro factors. On Friday, a Goldman Sachs analyst reiterated his buy rating for MSFT and revised his price target from $350 to $400 a share. But because there is too much optimism in the market, it may be gently time to take profit, wait for the next bullish wave and rotate toward where the next action is expected to happen.
The Magnificent Seven thrived so far this year and the un-magnificent 493 other stocks remained mostly on the sidelines. What we see these days is that the un-magnificent other stocks are also catching up with the rally. Today, 70% of the S&P 500 stocks trade above their 200-DMA. Morgan Stanley’s Mike Wilson said that ‘they were wrong’ regarding their bearish stock market expectation this year, while JP Morgan’s Kolanovic insists that a selloff is coming. And one day, he will be right!
Technical Outlook and Review
DXY:
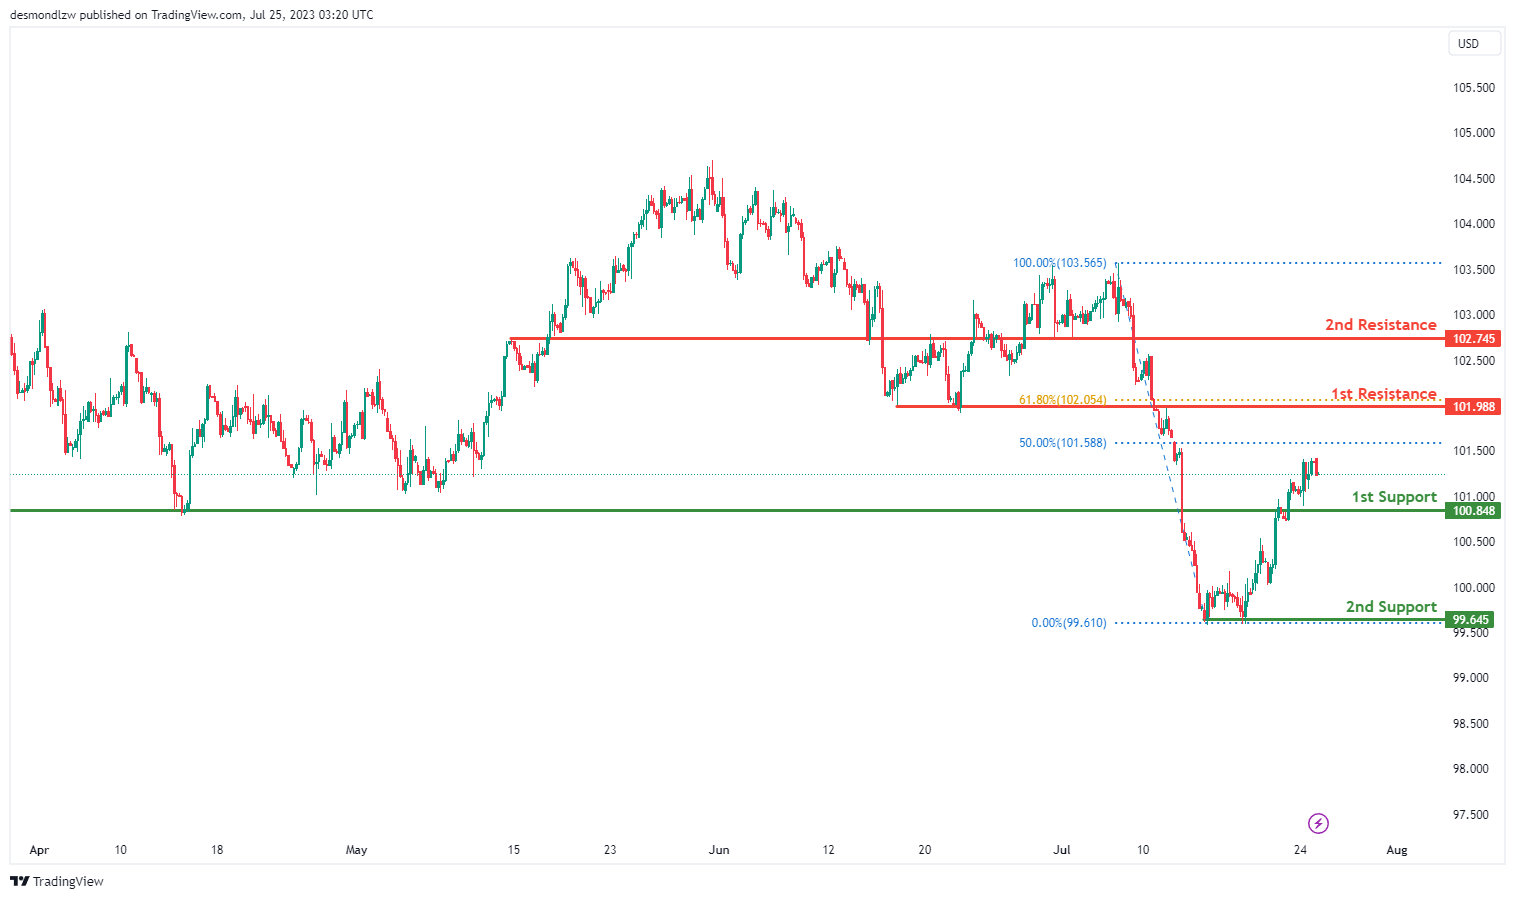
The DXY chart indicates a bullish momentum, suggesting a potential bullish continuation towards the 1st resistance level at 101.98. This resistance level is identified as an overlap resistance and coincides with the 61.80% Fibonacci retracement.
In case of a downward move, the 1st support at 100.84, an overlap support, may act as a significant level of backing. Additionally, the 2nd support at 99.64 represents a multi-swing low support.
On the upside, the 2nd resistance at 102.74 is recognized as a pullback resistance. These support and resistance levels play a crucial role in determining the potential price movement.
EUR/USD:
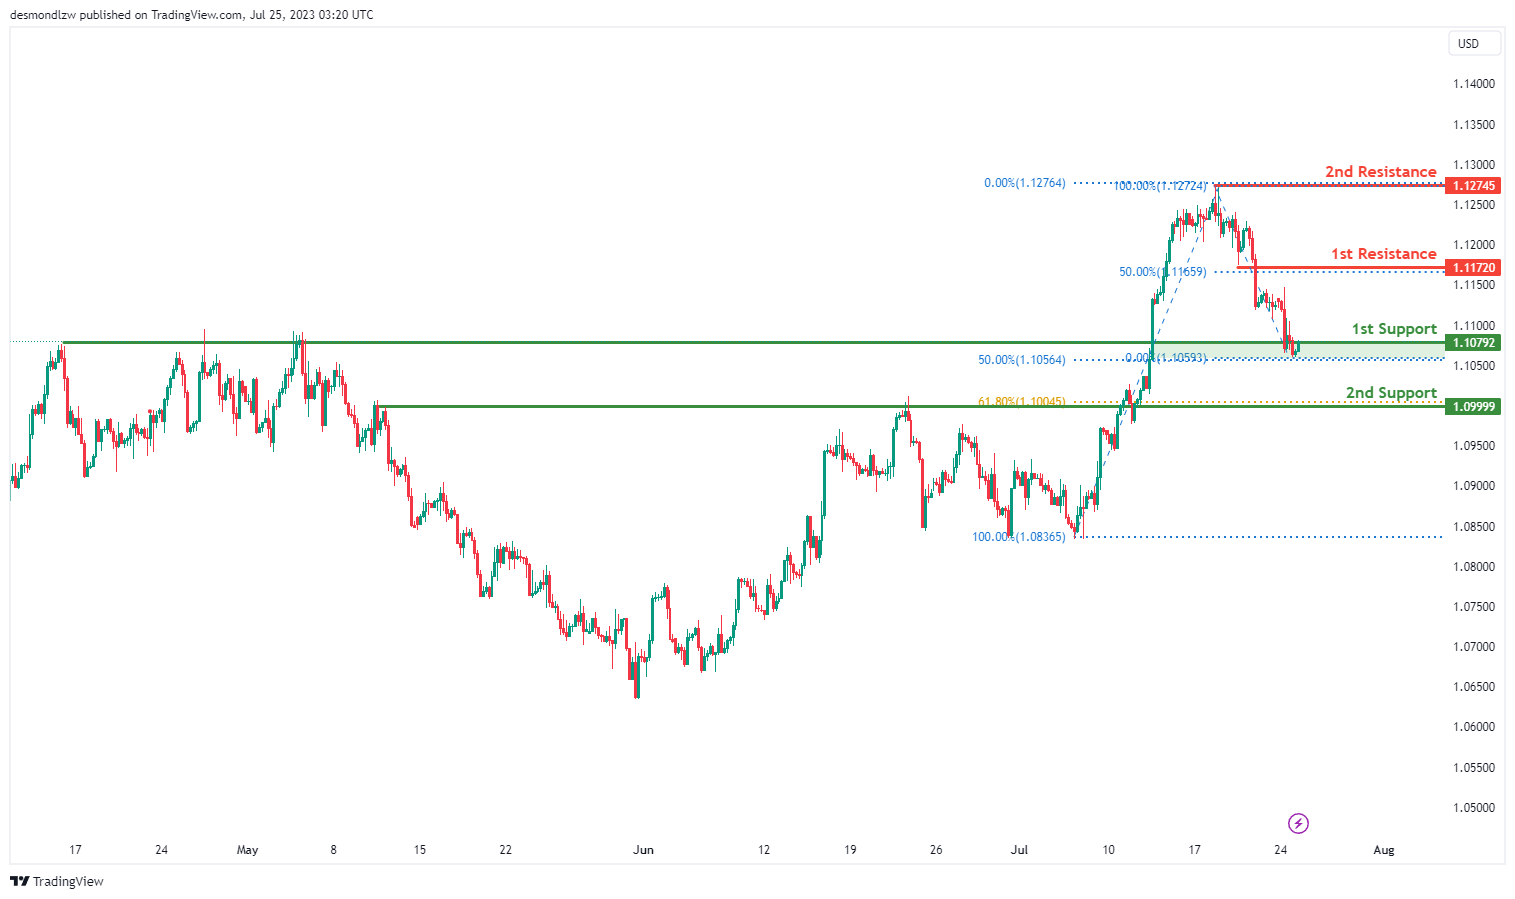
The EUR/USD chart exhibits a bullish momentum, indicating a potential bullish bounce off the 1st support level at 1.1079, aligned with the 50% Fibonacci retracement. This may lead the price towards the 1st resistance at 1.1172, which represents a pullback resistance also coinciding with the 50% Fibonacci retracement.
Furthermore, the 2nd support at 1.0999 acts as another pullback support, corresponding to the 61.80% Fibonacci retracement. On the upside, the 2nd resistance at 1.1274 is recognized as a significant swing high resistance. These support and resistance levels play crucial roles in potential price movements.
EUR/JPY:
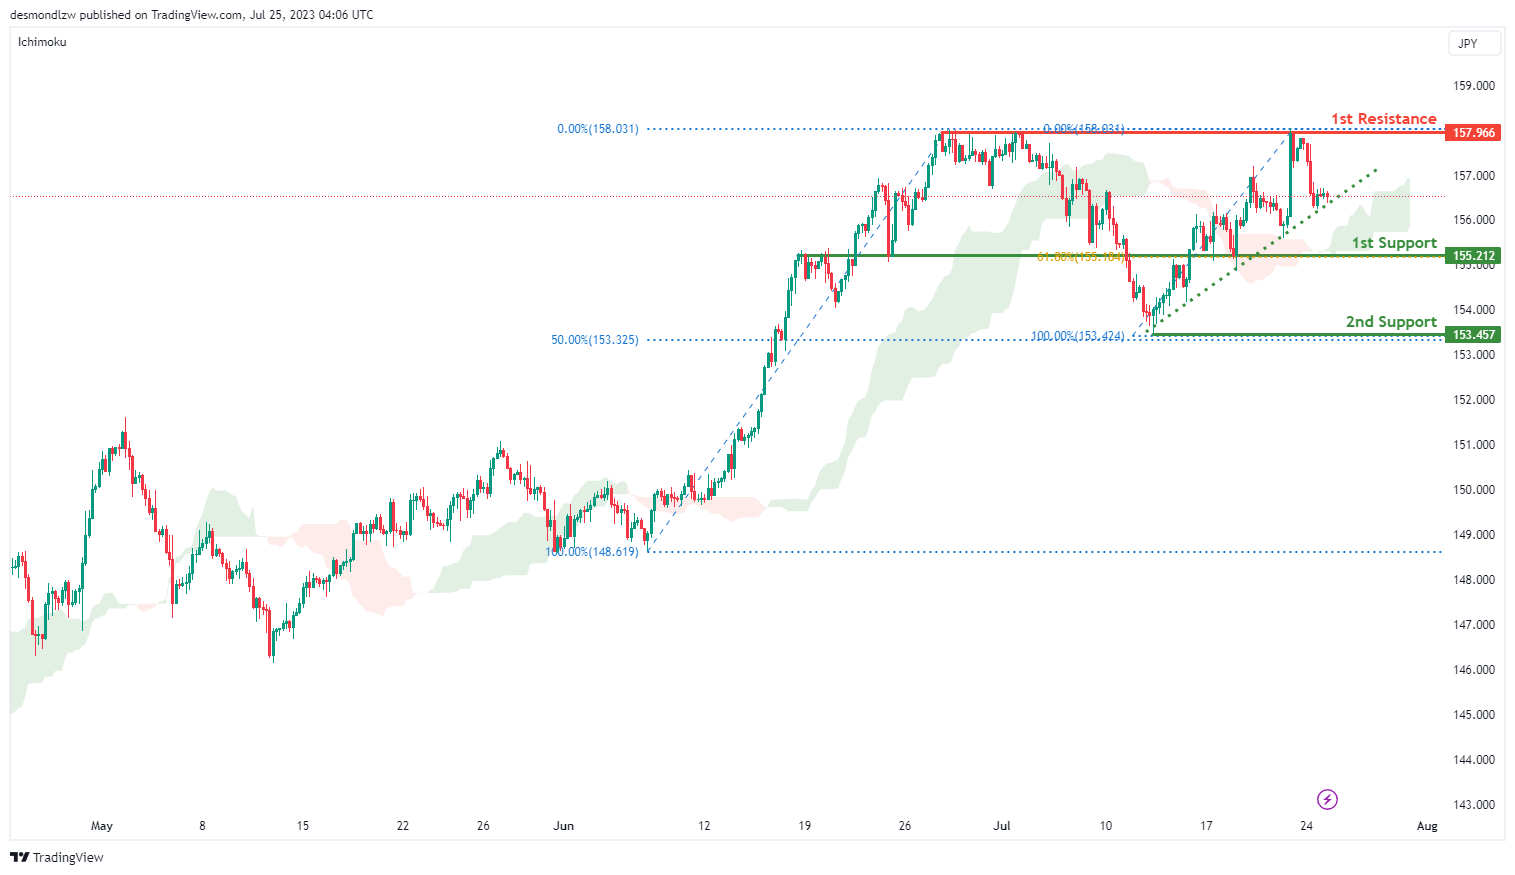
The EUR/JPY chart currently displays a bullish momentum, predominantly because the price is above the bullish Ichimoku cloud, suggesting further potential bullish continuation towards the 1st resistance level.
The 1st support level is situated at 155.21, corresponding with an overlap support and the 61.80% Fibonacci retracement level. This could potentially mark a significant point of buying interest, which could stimulate upward price movements.
Meanwhile, the 2nd support level stands at 153.45, and it coincides with a swing low support and the 50% Fibonacci retracement level. This might serve as another area of potential buying interest.
On the other hand, the 1st resistance level is positioned at 157.96, indicating a multi-swing high resistance. This could possibly apply significant selling pressure, potentially halting or reversing the upward price trajectory.
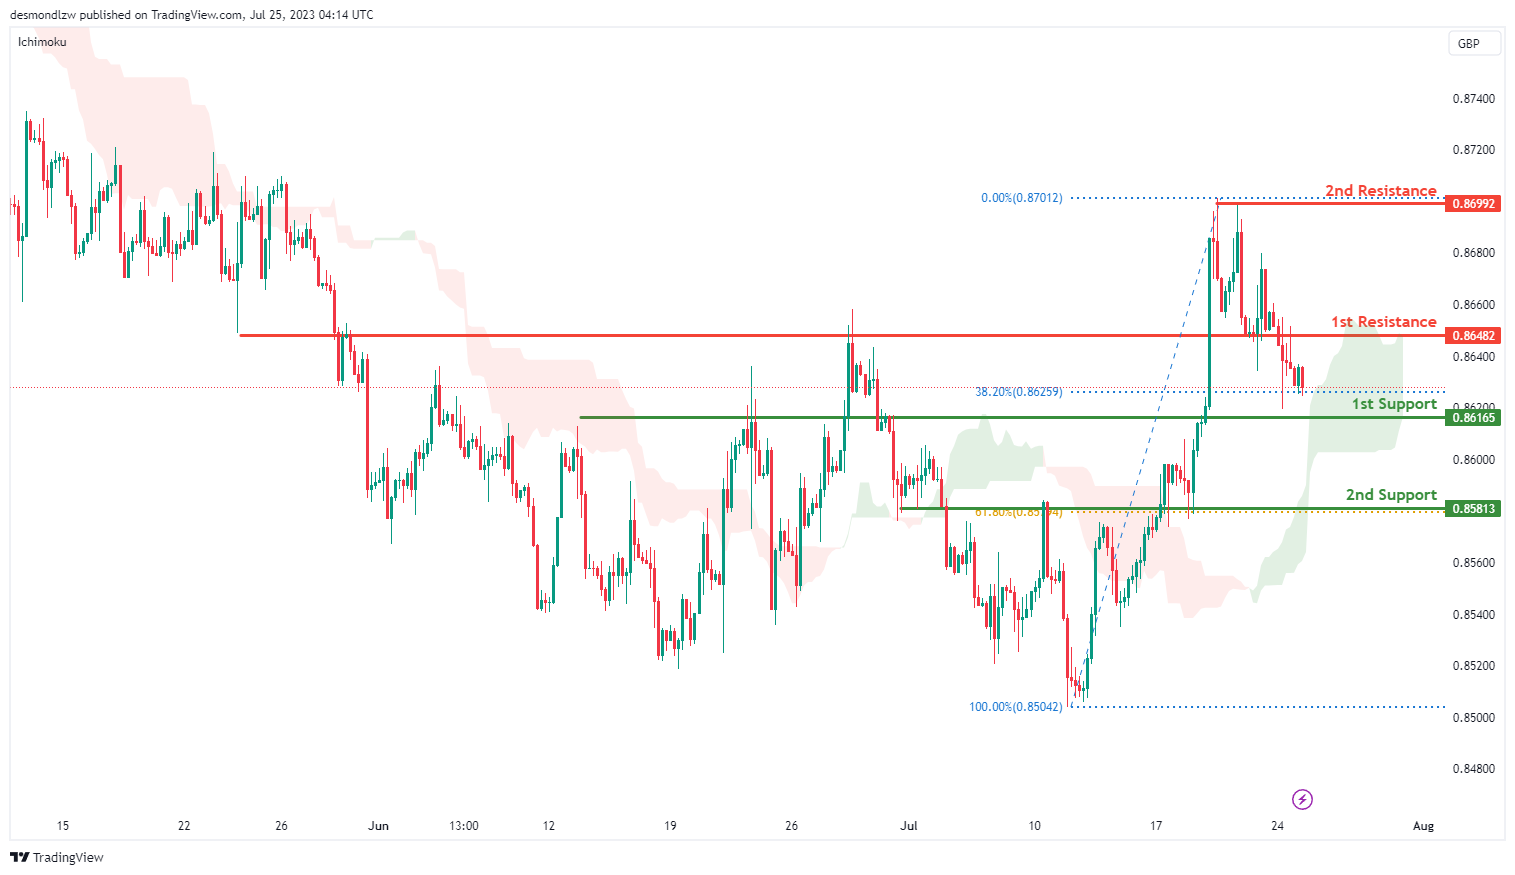
EUR/GBP:
The EUR/GBP chart is currently showing a bullish momentum. This is largely due to the price being above the bullish Ichimoku cloud, suggesting a potential bullish bounce off the 1st support and a consequent rise towards the 1st resistance.
The 1st support level is at 0.8616 and is significant as an overlap support, along with being a 38.20% Fibonacci retracement level. This could possibly denote a point of buying interest, causing a price bounce and upward movement.
The 2nd support level is situated at 0.8581. As an overlap support and a 61.80% Fibonacci retracement level, it could serve as another potential area of buying interest.
On the flip side, the 1st resistance level is at 0.8648, denoting an overlap resistance. This could potentially be a point of selling pressure, likely halting upward price progression.
The 2nd resistance level, at 0.8699, represents a swing high resistance and could serve as an additional barrier for price ascent.
GBP/USD:
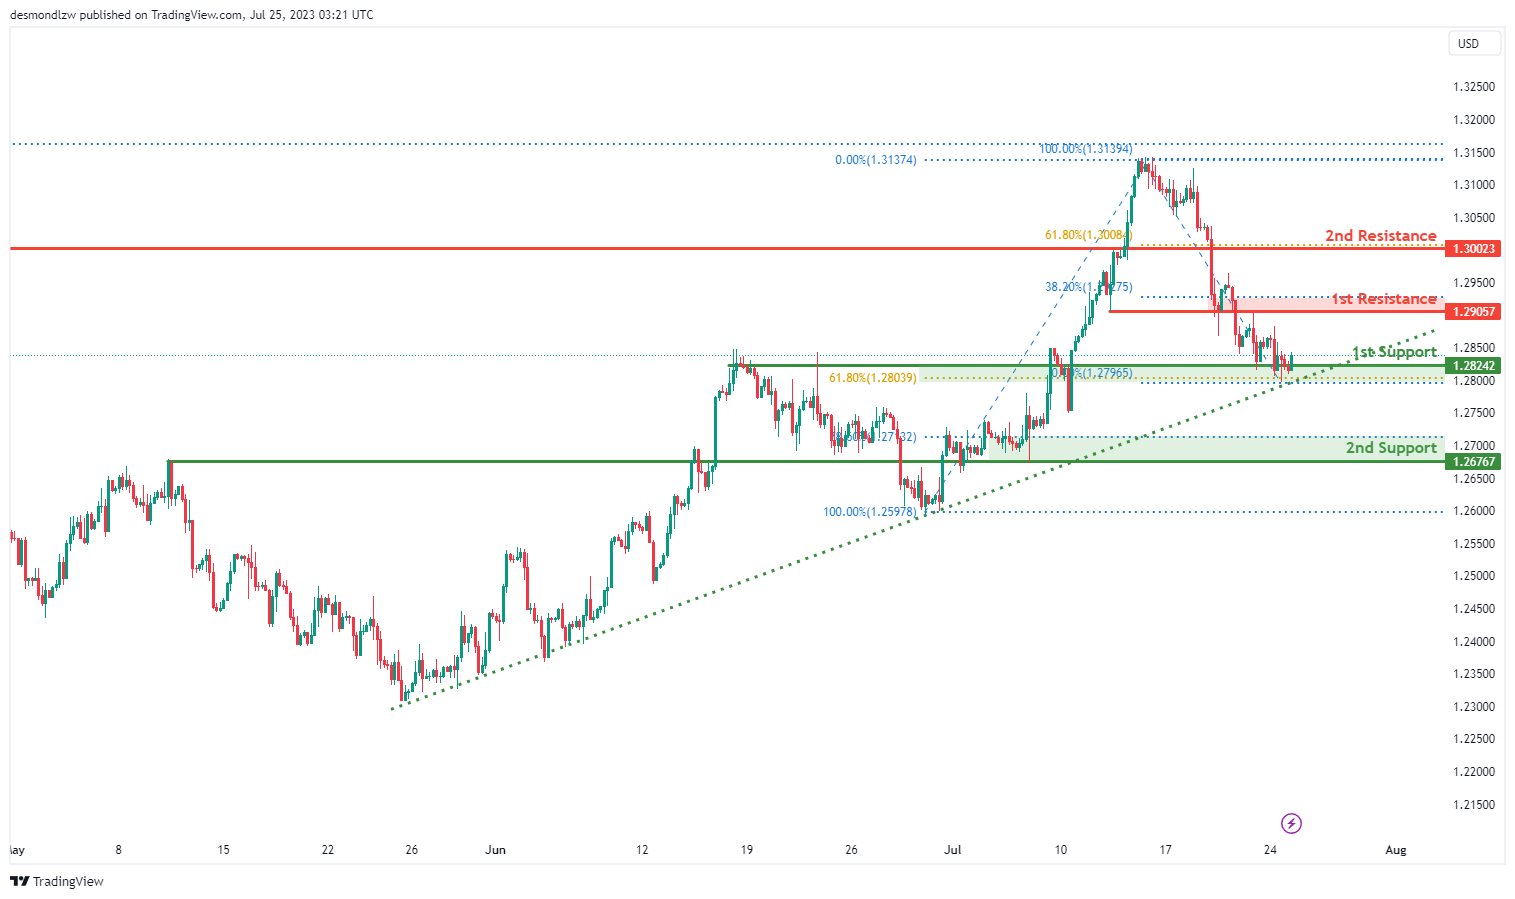
The GBP/USD chart shows a bullish momentum, with the price above a major ascending trend line, indicating the potential for further upward movement.
A possible scenario is a bullish bounce off the 1st support level at 1.2824, coinciding with the 61.80% Fibonacci retracement, leading the price towards the 1st resistance at 1.2905. This resistance level is an overlap resistance, also aligned with the 38.20% Fibonacci retracement.
Moreover, the 2nd support at 1.2676 acts as another overlap support, corresponding to the 78.60% Fibonacci retracement. On the upside, the 2nd resistance at 1.3002 represents a pullback resistance, coinciding with the 61.80% Fibonacci retracement. These support and resistance levels are important factors that may influence the price’s movement.
GBP/JPY:
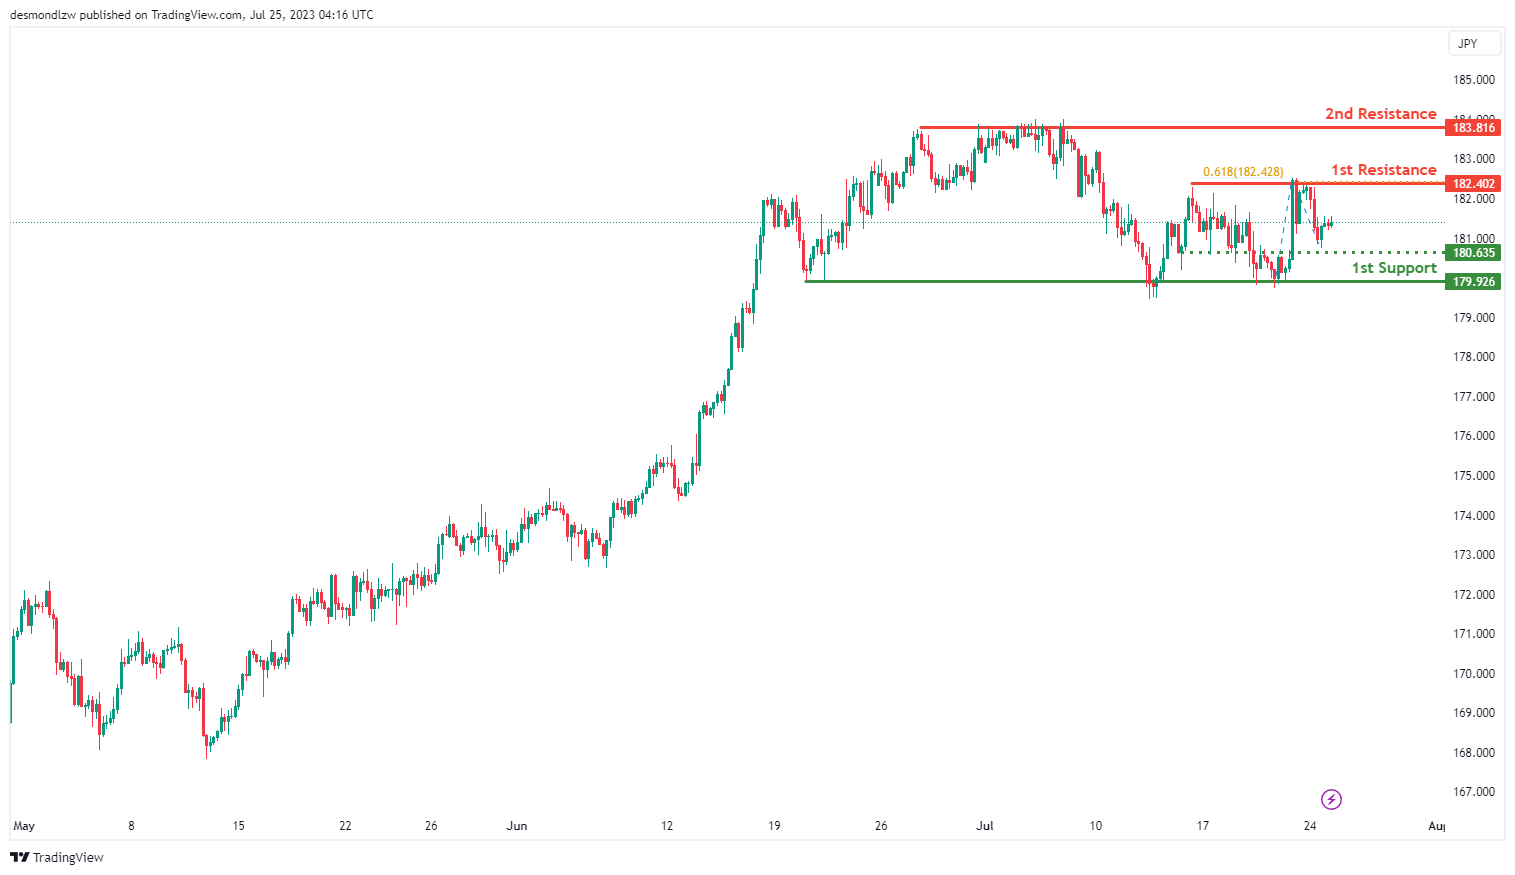
The GBP/JPY chart is currently displaying a neutral momentum, with the price expected to fluctuate between the 1st resistance and 1st support levels.
The 1st support level, located at 179.92, represents a multi-swing low support. This could serve as a significant point of buying interest, halting downward movement.
The intermediate support level is at 180.63 and serves as an overlap support, offering additional potential buying interest.
On the other hand, the 1st resistance level, at 182.40, is a multi-swing high resistance that also coincides with the 61.80% Fibonacci projection level. This could potentially signify a point of selling pressure, potentially reversing the price trend.
The 2nd resistance level is at 183.81, representing another multi-swing high resistance. This level could serve as an additional selling pressure point, likely limiting further price ascents.
USD/CHF:
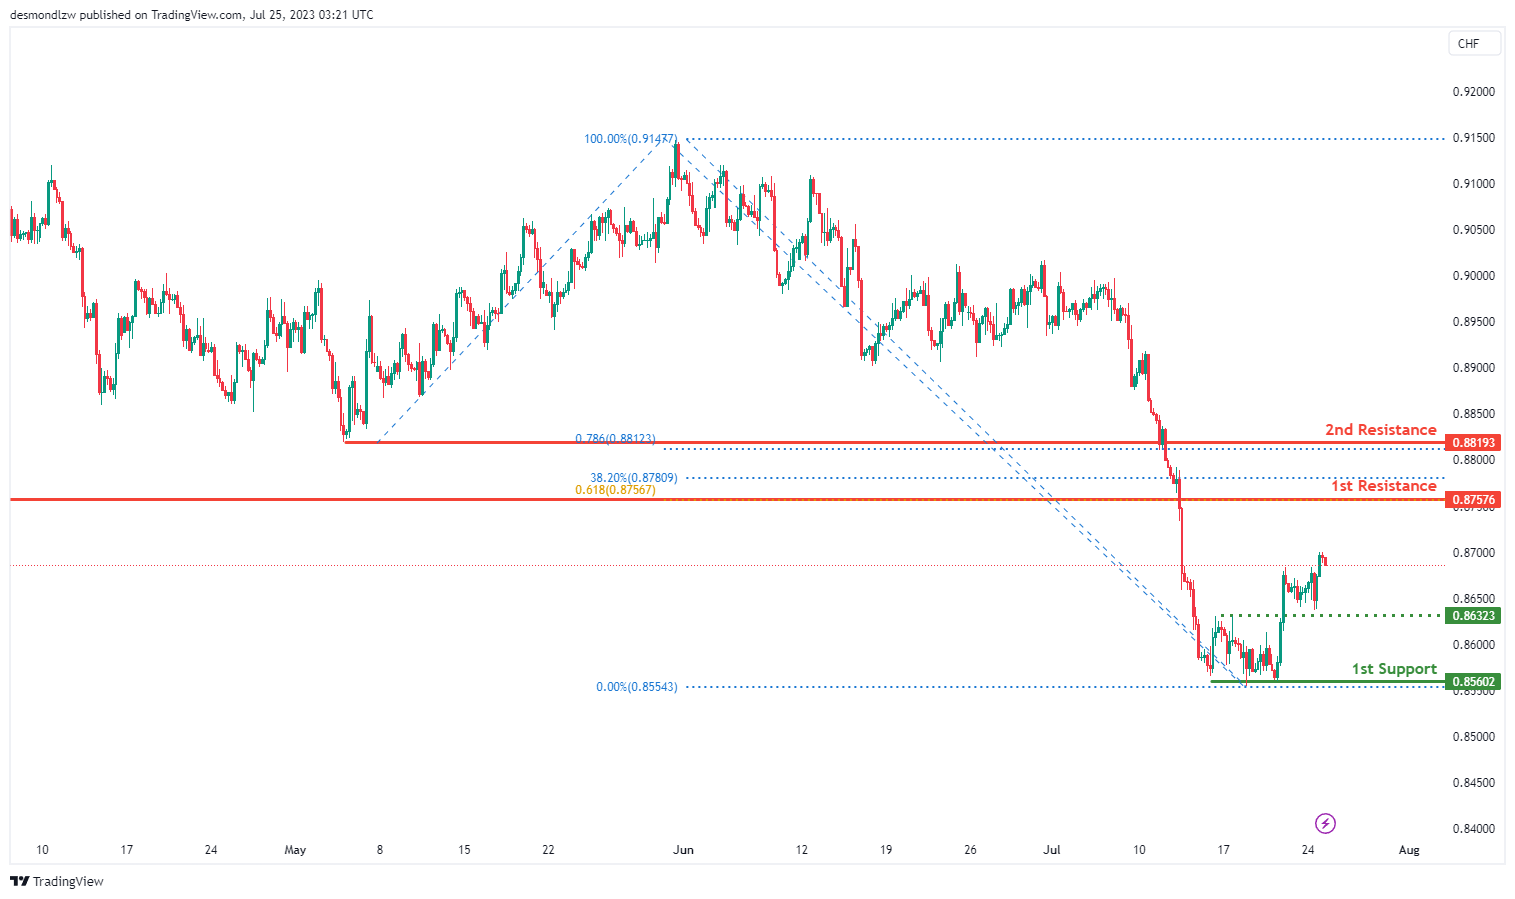
The USD/CHF chart indicates a bullish momentum, suggesting a potential continuation of the upward movement towards the 1st resistance level.
The 1st support at 0.8560 is significant as it represents a multi-swing low support. Additionally, the intermediate support at 0.8632 acts as an overlap support.
On the upside, the 1st resistance at 0.8757 is an important level, coinciding with a pullback resistance, the 38.20% Fibonacci retracement, and the 61.80% Fibonacci projection, indicating a Fibonacci confluence. Furthermore, the 2nd resistance at 0.8819 serves as a pullback resistance, aligned with the 78.60% Fibonacci projection.
USD/JPY:
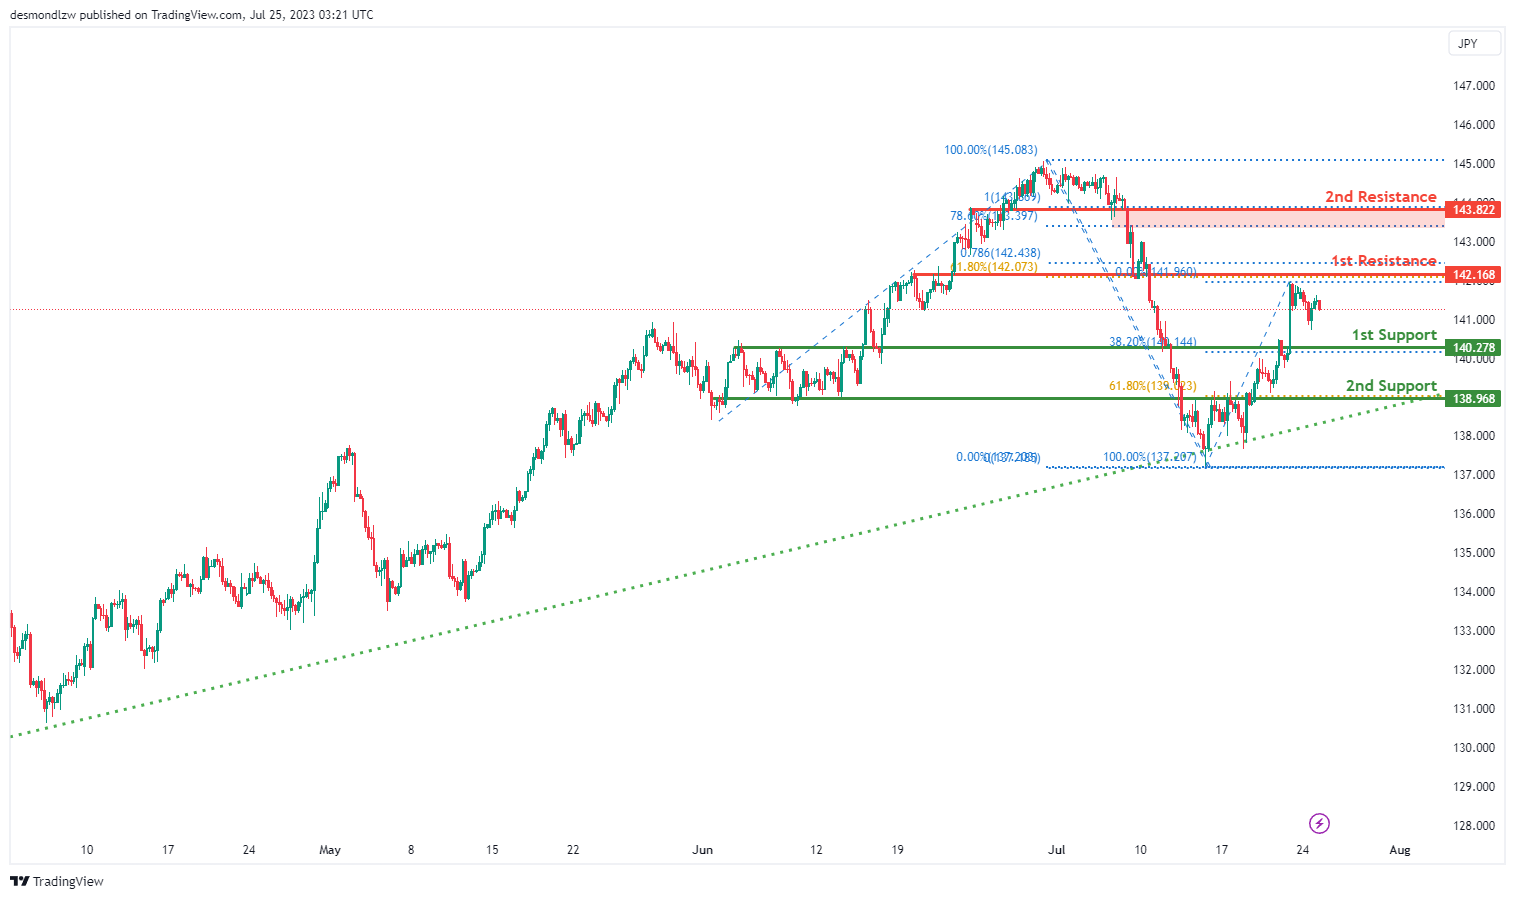
The USD/JPY chart exhibits a prevailing bullish momentum, underlined by the price remaining above a significant ascending trend line. This indicates a strong potential for further upward movement in the market.
In the near term, there is a likelihood of a price retracement towards the 1st support level located at 140.27. This support level is reinforced by the 38.20% Fibonacci retracement, making it a crucial pullback support. Subsequently, a price rebound from this level may lead to an upward advance towards the 1st resistance level at 142.16. This resistance level holds notable importance, as it coincides with both an overlap resistance and the 61.80% Fibonacci retracement, further reinforced by the presence of the 78.60% Fibonacci projection, indicating a confluence of Fibonacci levels. Additionally, the 2nd resistance level at 143.82 acts as another significant pullback resistance, also aligned with the 78.60% Fibonacci projection.
USD/CAD:
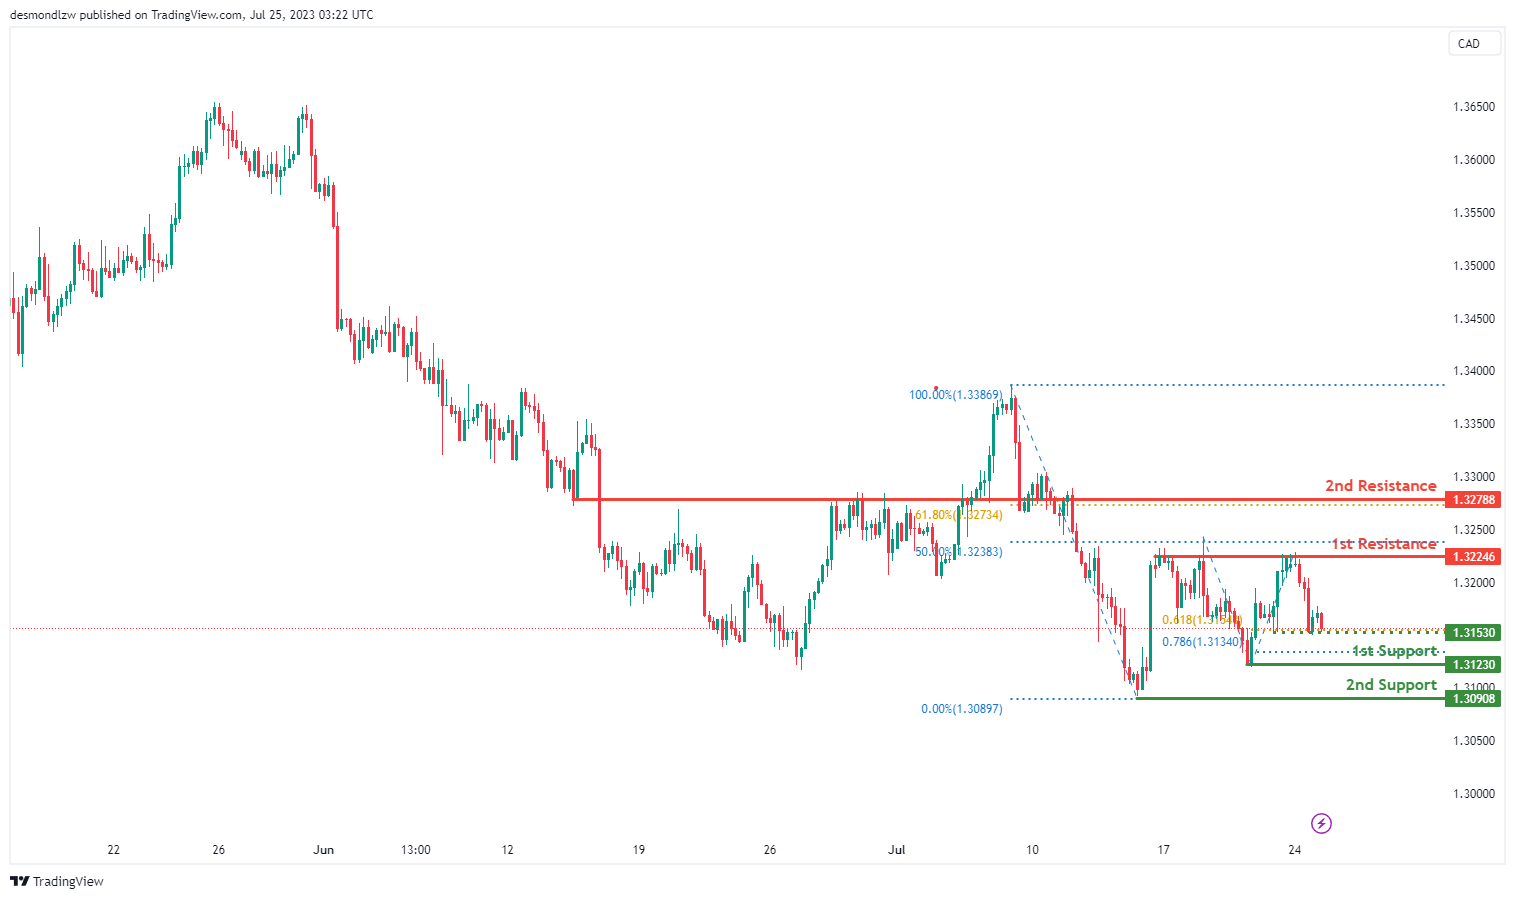
The USD/CAD chart displays a prevailing bearish momentum, indicating a potential continuation of the downward movement.
In the event of further decline, the 1st support level at 1.3123 holds significance as it aligns with a swing low support and the 78.60% Fibonacci projection, adding to its importance. Additionally, the 2nd support at 1.3090 represents another swing low support level.
On the upside, the 1st resistance at 1.3278 acts as a notable multi-swing high resistance, coinciding with the 50% Fibonacci retracement. Moreover, the 2nd resistance at 1.3278 serves as a pullback resistance and aligns with the 61.80% Fibonacci retracement.
Furthermore, there is an intermediate support at 1.3153, which is a multi-swing low support and is reinforced by the 61.80% Fibonacci projection.
AUD/USD:
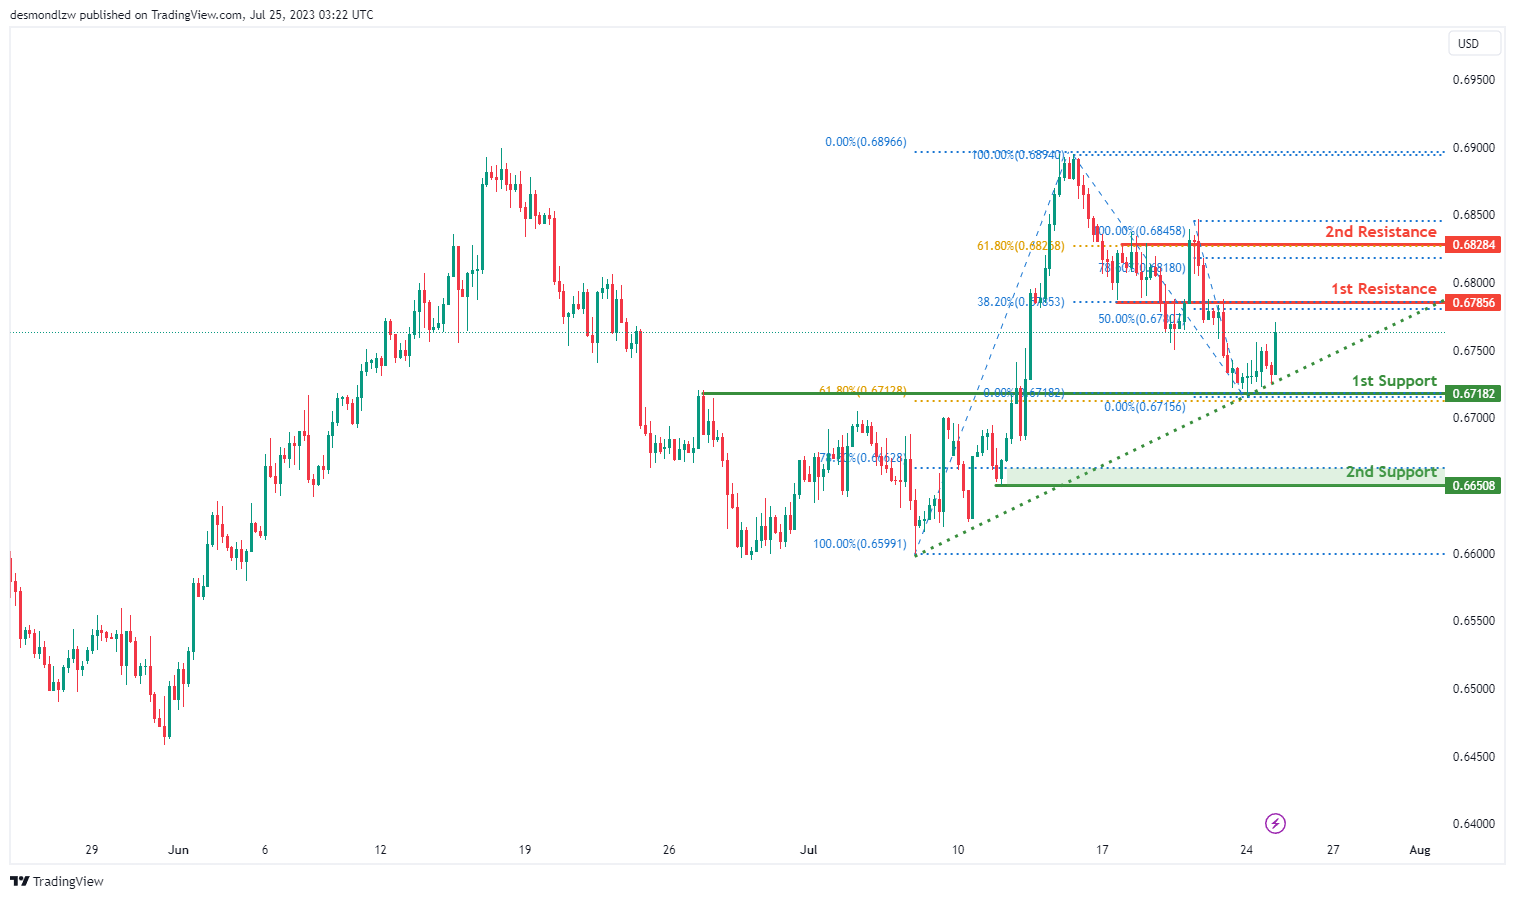
The AUD/USD chart demonstrates a prevailing bullish momentum, with the price above a major ascending trend line, suggesting the potential for further upward movement.
In the event of continued bullishness, the 1st support level at 0.6718 holds significance as it aligns with an overlap support and the 61.80% Fibonacci retracement, adding to its importance. Additionally, the 2nd support at 0.6650 represents another support level, coinciding with the 78.60% Fibonacci retracement.
On the upside, the 1st resistance at 0.6785 acts as a notable overlap resistance, coinciding with the 50% Fibonacci retracement and the 38.20% Fibonacci retracement, indicating Fibonacci confluence. Moreover, the 2nd resistance at 0.6828 represents a multi-swing high resistance and aligns with the 61.80% Fibonacci retracement.
NZD/USD
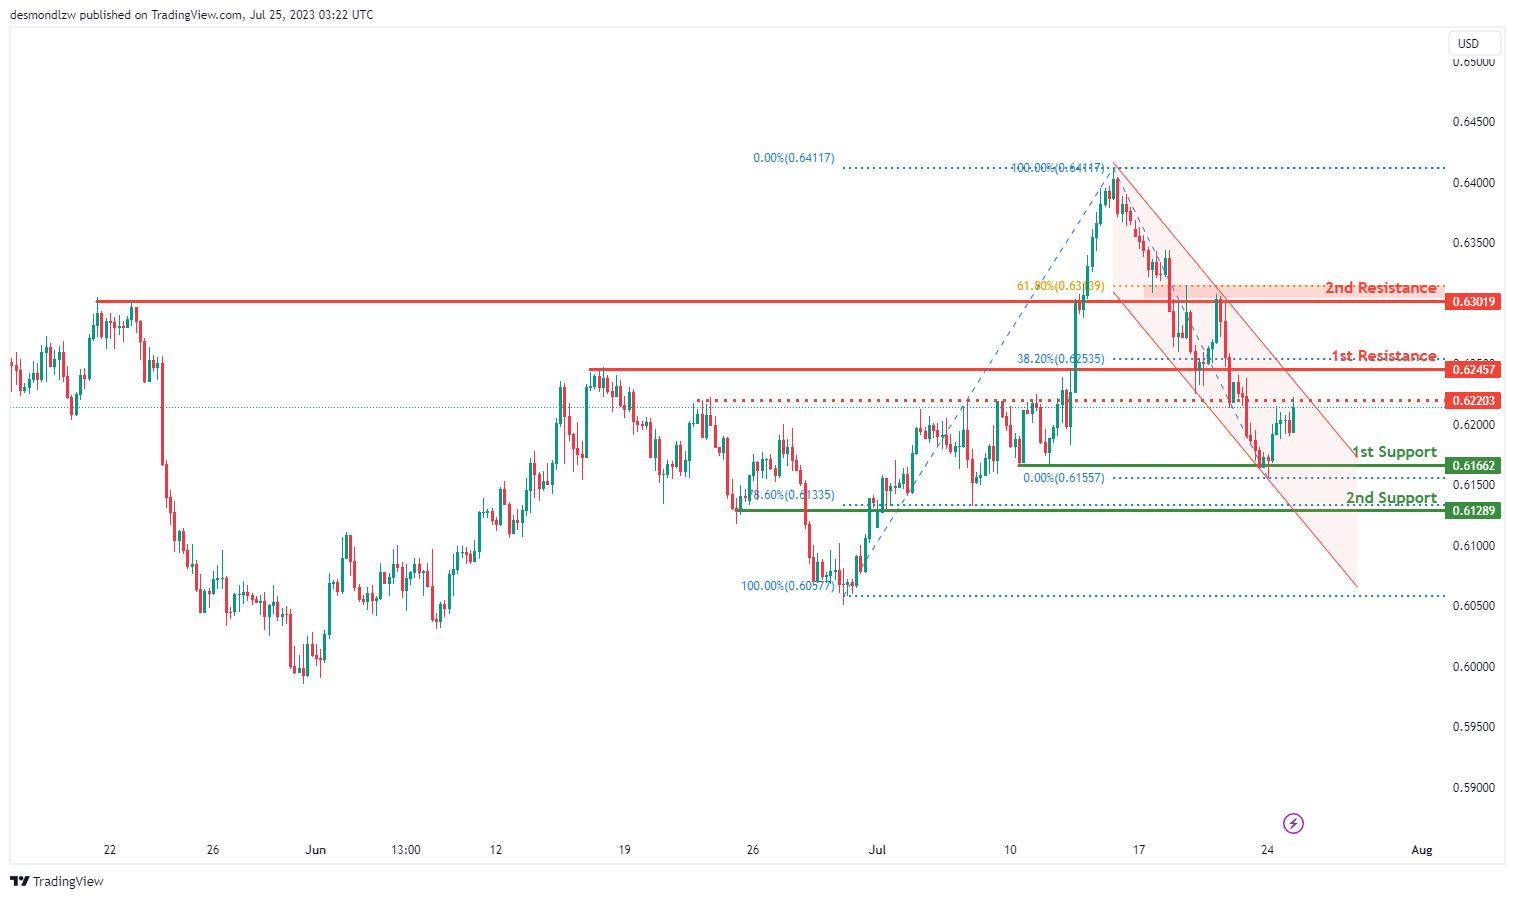
The NZD/USD chart shows a clear bearish momentum, as the price is currently within a descending channel, indicating the potential for further downward movement.
Considering the bearish scenario, a possible price action could involve a bearish reaction off the 1st resistance level at 0.6245, which aligns with an overlap resistance and the 38.20% Fibonacci retracement. This reaction might lead the price to drop towards the 1st support at 0.6166, identified as a multi-swing low support.
Furthermore, the 2nd support level at 0.6128 represents another crucial area as it coincides with the 78.60% Fibonacci retracement, providing additional support against further downward movement.
On the other hand, intermediate resistance at 0.6220 acts as an overlap resistance, while the 2nd resistance at 0.6301 rep
DJ30:
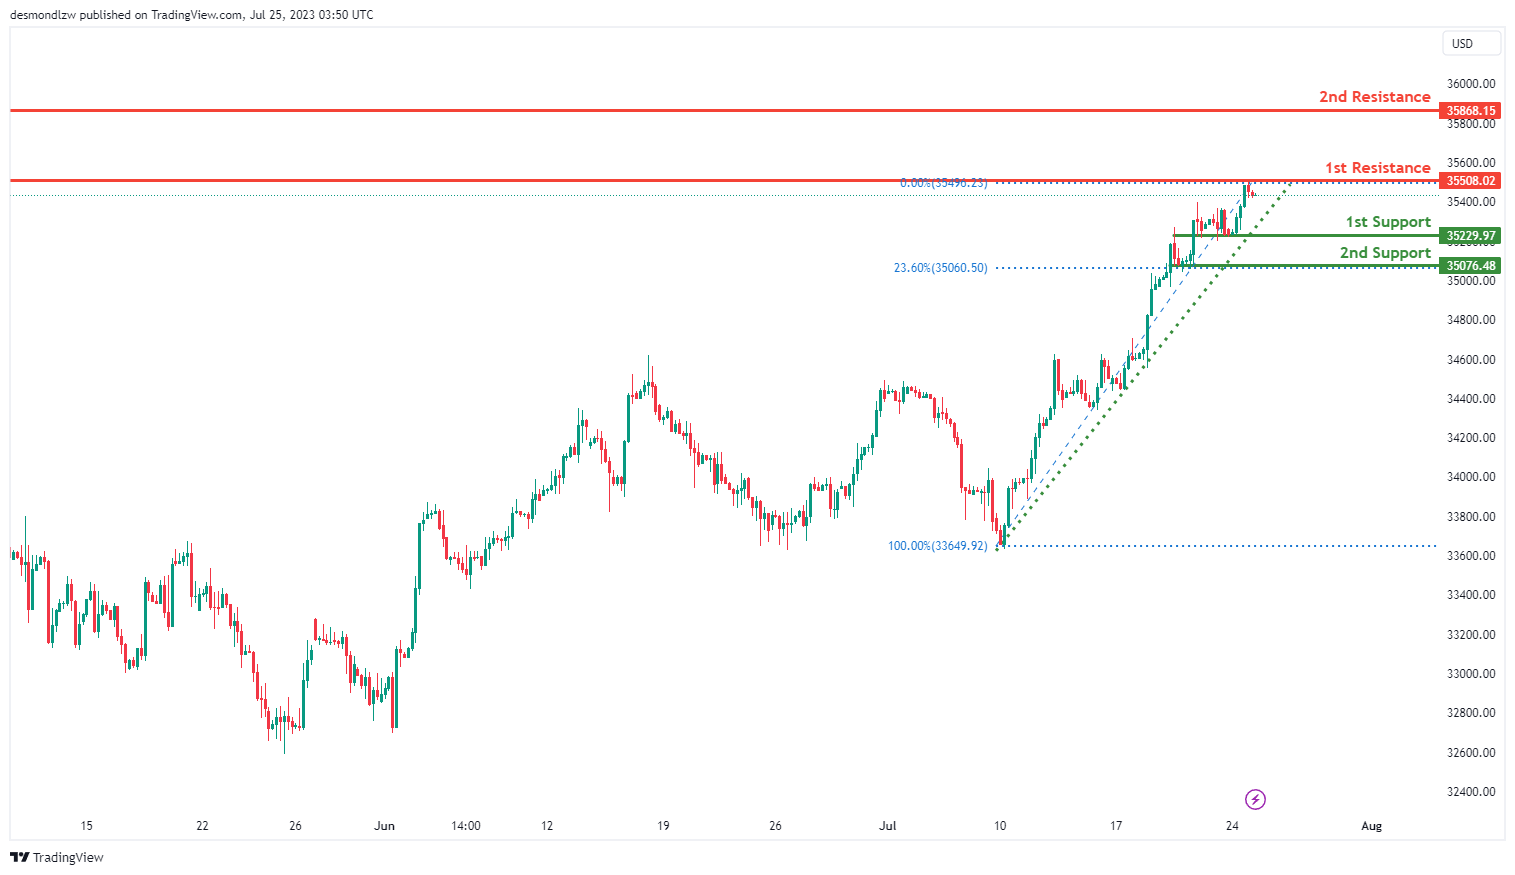
The DJ30 (Dow Jones Industrial Average) chart exhibits a bullish momentum, underlined by the fact that the price is above a major ascending trend line, thereby suggesting a potential continuation of this bullish trend towards the 1st resistance level.
The 1st support level is situated at 35229.97 and acts as a pullback support, which could indicate an area where the price may find buying interest.
The 2nd support level, standing at 35076.48, also functions as a pullback support and coincides with the 23.60% Fibonacci retracement level. This level could offer additional buying interest, fortifying the lower boundaries of the price movement.
On the upside, the 1st resistance level is pegged at 35508.02 and represents a multi-swing high resistance, indicating potential selling pressure which might cause a price pullback.
The 2nd resistance level, marked at 35868.15, corresponds to a swing high resistance level, suggesting another potential area of selling interest which might lead to a further price downturn upon reaching this level.
GER30:
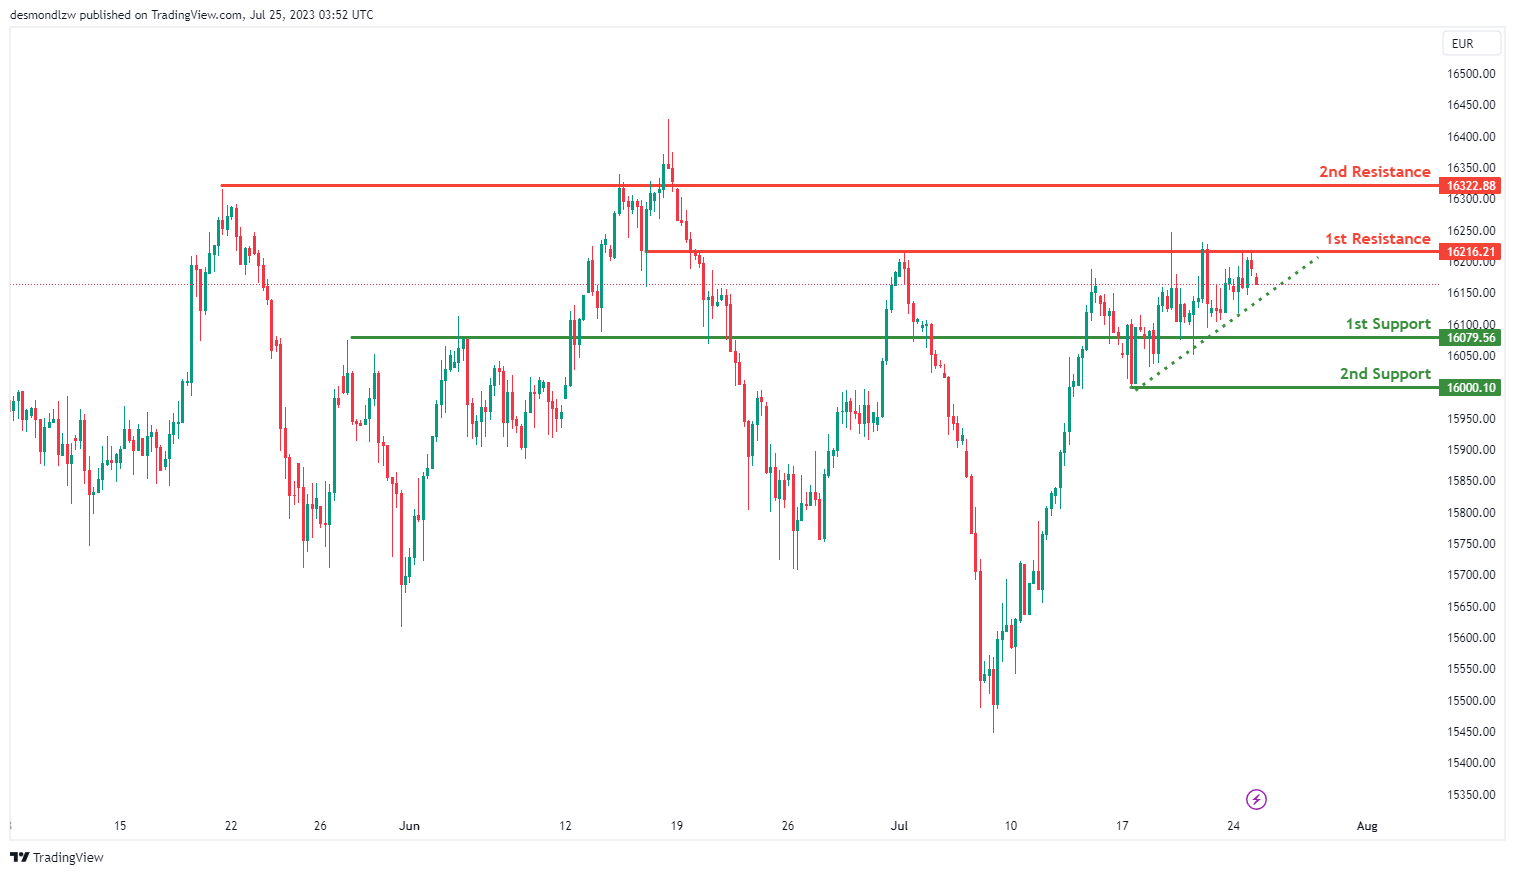
The GER30 (DAX) chart is presently exhibiting a bearish momentum. Interestingly, the price is above a major ascending trend line, suggesting the possibility of further bullish momentum, but a bearish continuation towards the 1st support level is expected.
The 1st support level is identified at 16079.56, acting as an overlap support. This level could serve as a potential area of buying interest, possibly causing a price bounce.
The 2nd support level is situated at 16000.10, functioning as a swing low support, indicating another potential region where buyers could step in and drive the price upward.
In terms of resistance, the 1st resistance level is located at 16216.21. This level, recognized as an overlap resistance, could provide significant selling pressure, potentially halting any upward price movements.
Similarly, the 2nd resistance level, marked at 16322.88, is also an overlap resistance, which could act as an additional barrier to any upward price momentum.
US500
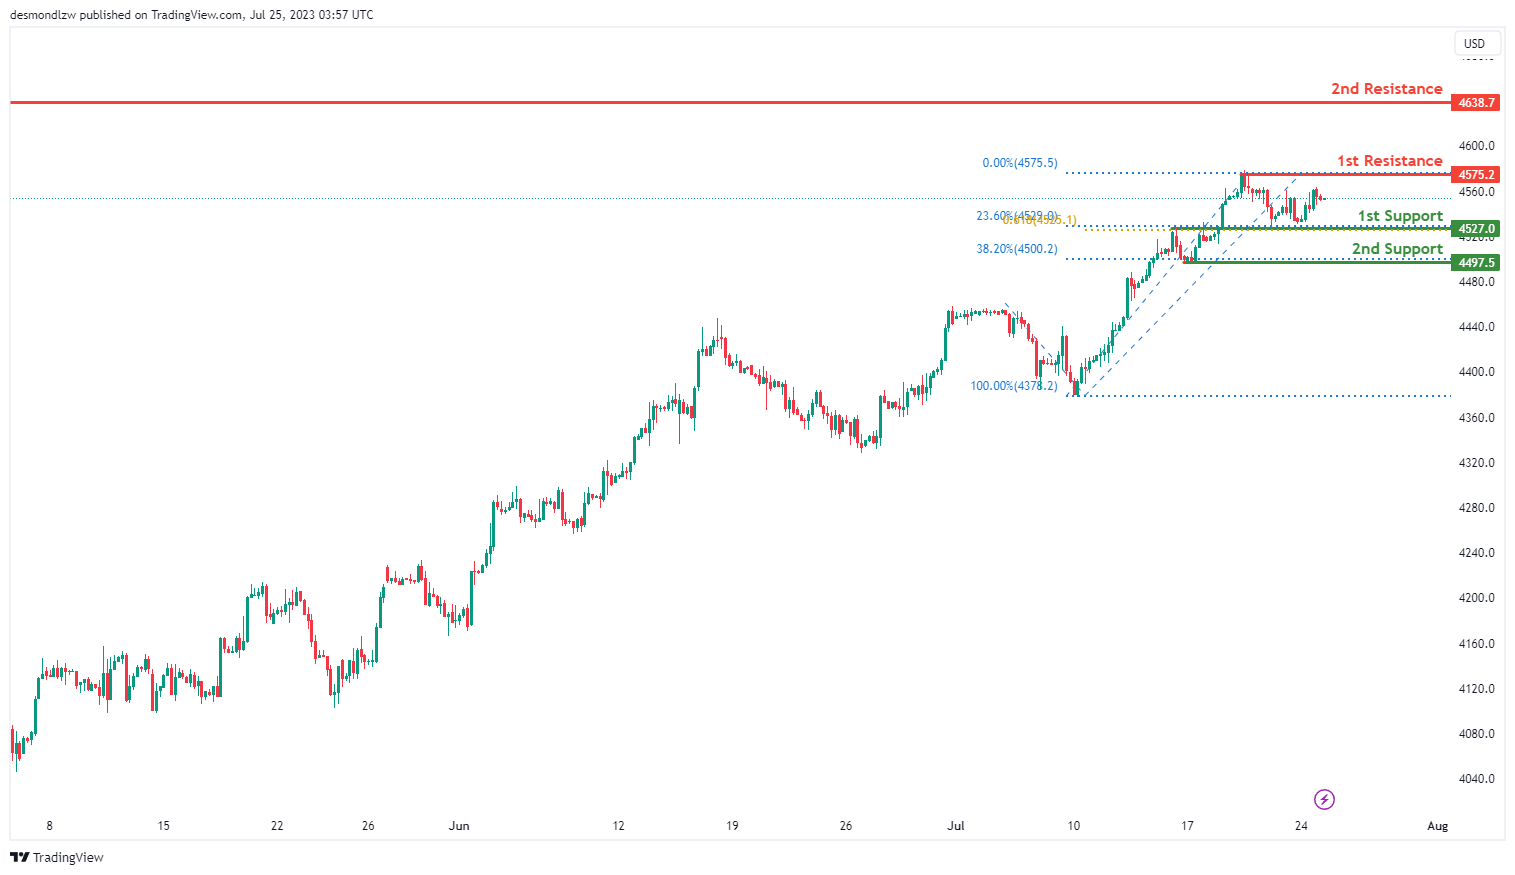
The US500 (S&P 500) chart currently presents a neutral momentum, suggesting that the price could fluctuate between the 1st resistance and 1st support levels.
The 1st support level is pinpointed at 4527.0 and is identified as a pullback support. This level is further reinforced by the 23.60% Fibonacci retracement and the 61.80% Fibonacci projection, indicating a Fibonacci confluence that could potentially stimulate buying interest.
The 2nd support level stands at 4497.5, representing a swing low support. This level aligns with the 38.20% Fibonacci retracement, potentially serving as another area of buying interest that could stimulate an upward price bounce.
On the other hand, the 1st resistance level is located at 4575.2. This level acts as a swing high resistance and could provide significant selling pressure, potentially stalling any upward price movements.
Furthermore, the 2nd resistance level is marked at 4638.7. It also serves as a swing high resistance and could act as another significant barrier to upward price movements.
BTC/USD:
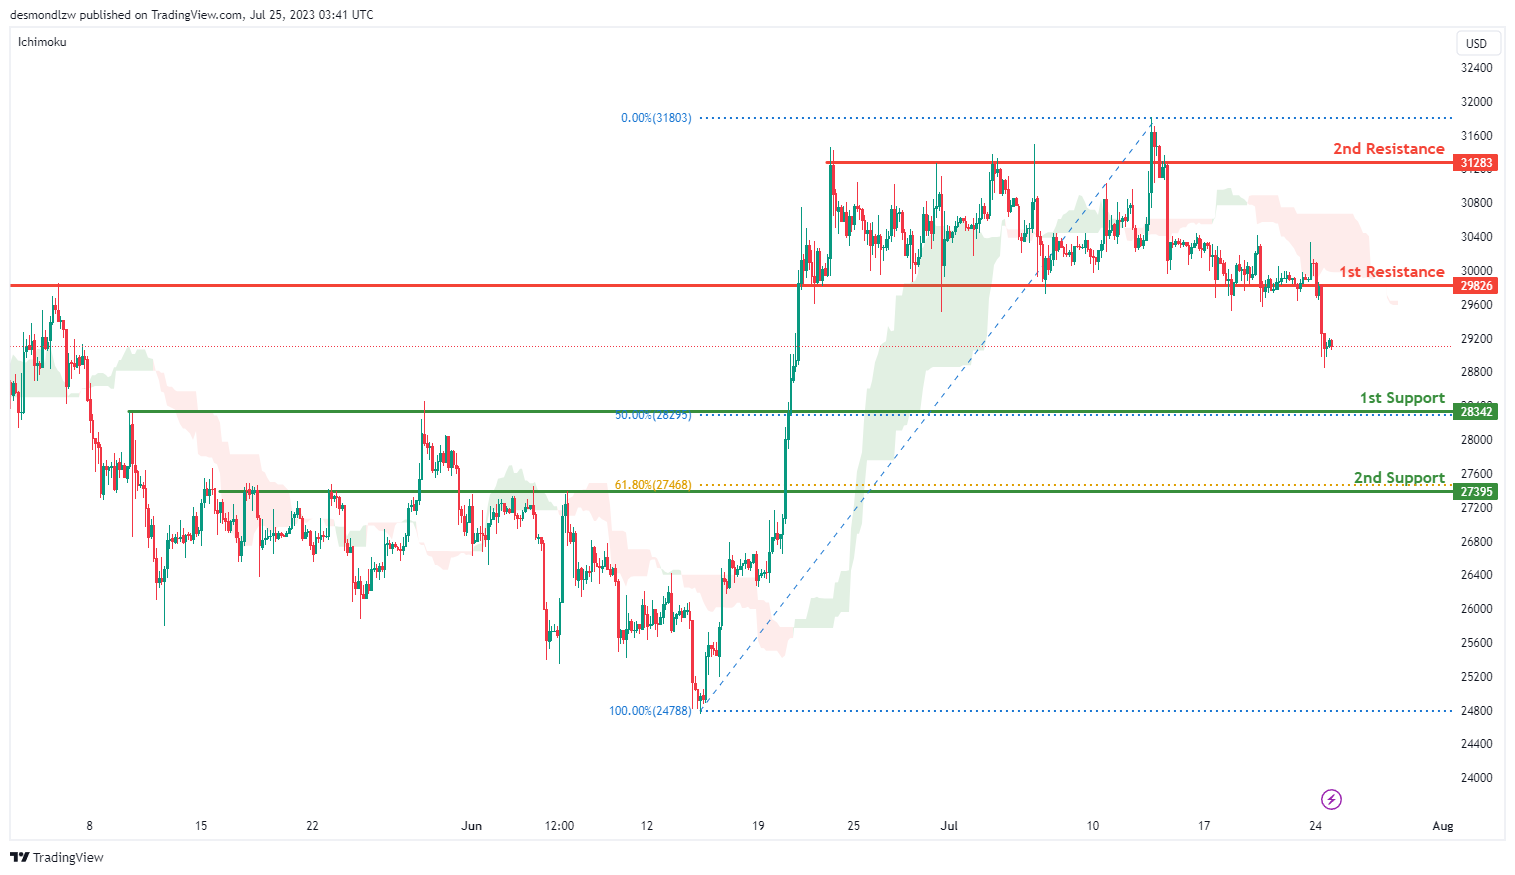
The BTC/USD chart currently displays a bearish trend, with the price positioned below the bearish Ichimoku cloud, contributing to the negative momentum. The expectation is for a bearish continuation towards the 1st support level.
The 1st support level, identified at 28342, stands as a pullback support and coincides with the 50% Fibonacci retracement level, suggesting that it could serve as a substantial area of buying interest. A second support level can be found at 27395, which functions as an overlap support and aligns with the 61.80% Fibonacci retracement level, indicating another potential area of significant buying interest.
In terms of resistance, the 1st level is located at 29826 and acts as an overlap resistance. This suggests that it could present a substantial barrier to further price ascents, and potentially attract selling pressure. The 2nd resistance level is found at 31283, also an overlap resistance, implying it could serve as an additional point of selling pressure and a potential obstacle for price growth.
ETH/USD:
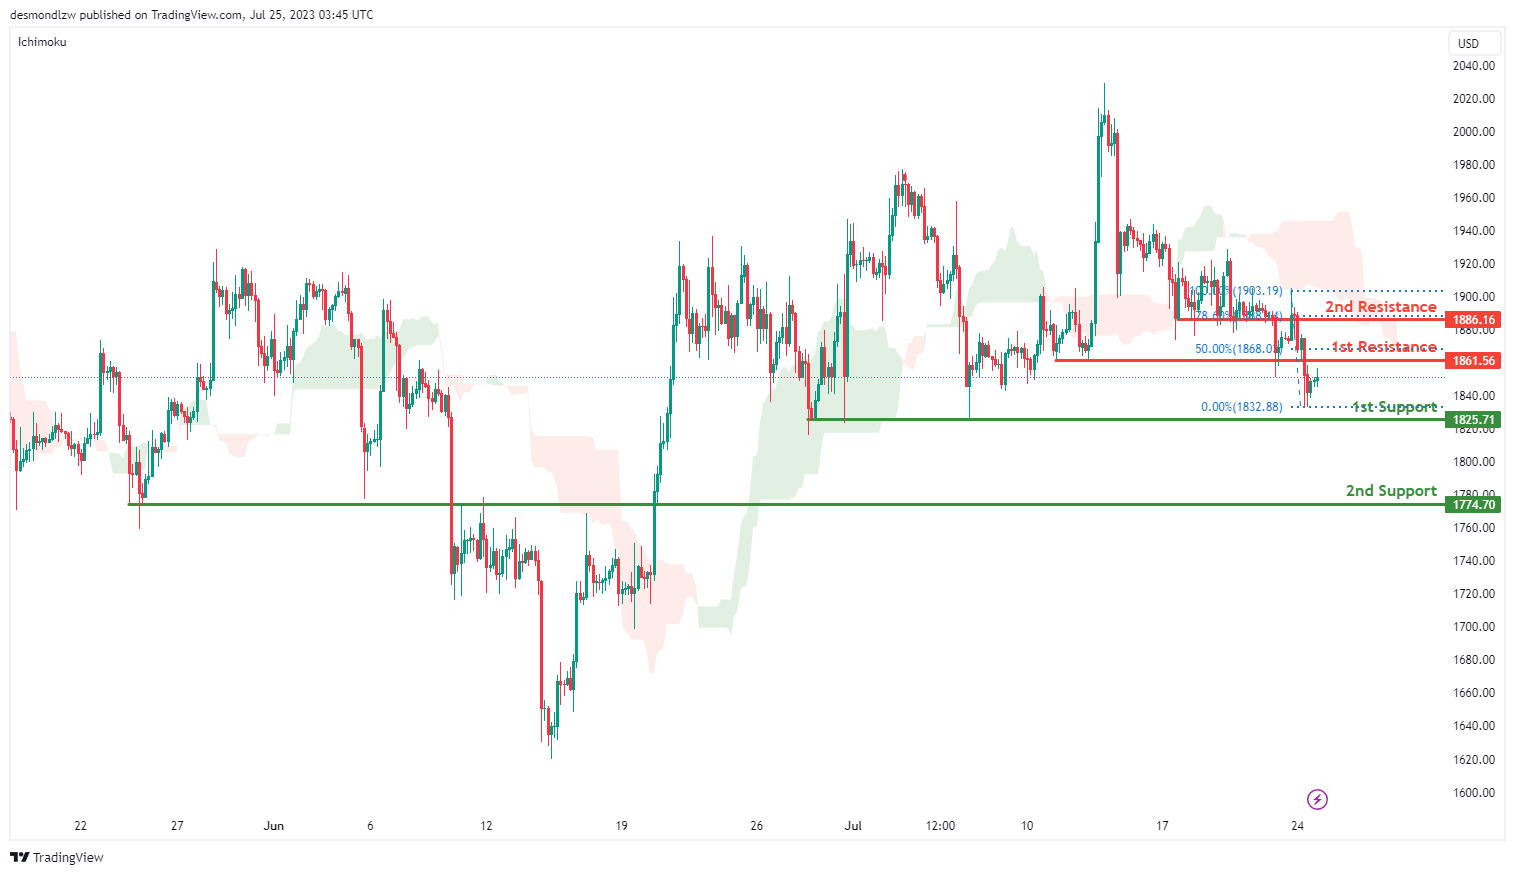
The ETH/USD chart is currently demonstrating a bearish momentum, with the price being positioned below the bearish Ichimoku cloud, which suggests an expected bearish continuation towards the 1st support level.
The 1st support level is set at 1825.71, functioning as a multi-swing low support, and could serve as a key area for potential buying interest.
The 2nd support level is found at 1774.70, operating as an overlap support. This level further bolsters the lower boundaries of the price movement and can act as an additional stronghold for buyers.
On the upside, the 1st resistance level is at 1861.56. This pullback resistance coincides with the 50% Fibonacci retracement level, indicating a potential area of selling pressure.
The 2nd resistance level is marked at 1886.16. This overlap resistance also aligns with the 78.60% Fibonacci retracement level, suggesting another significant hurdle for upward price movements, and possibly a region of increased selling pressure.
WTI/USD:
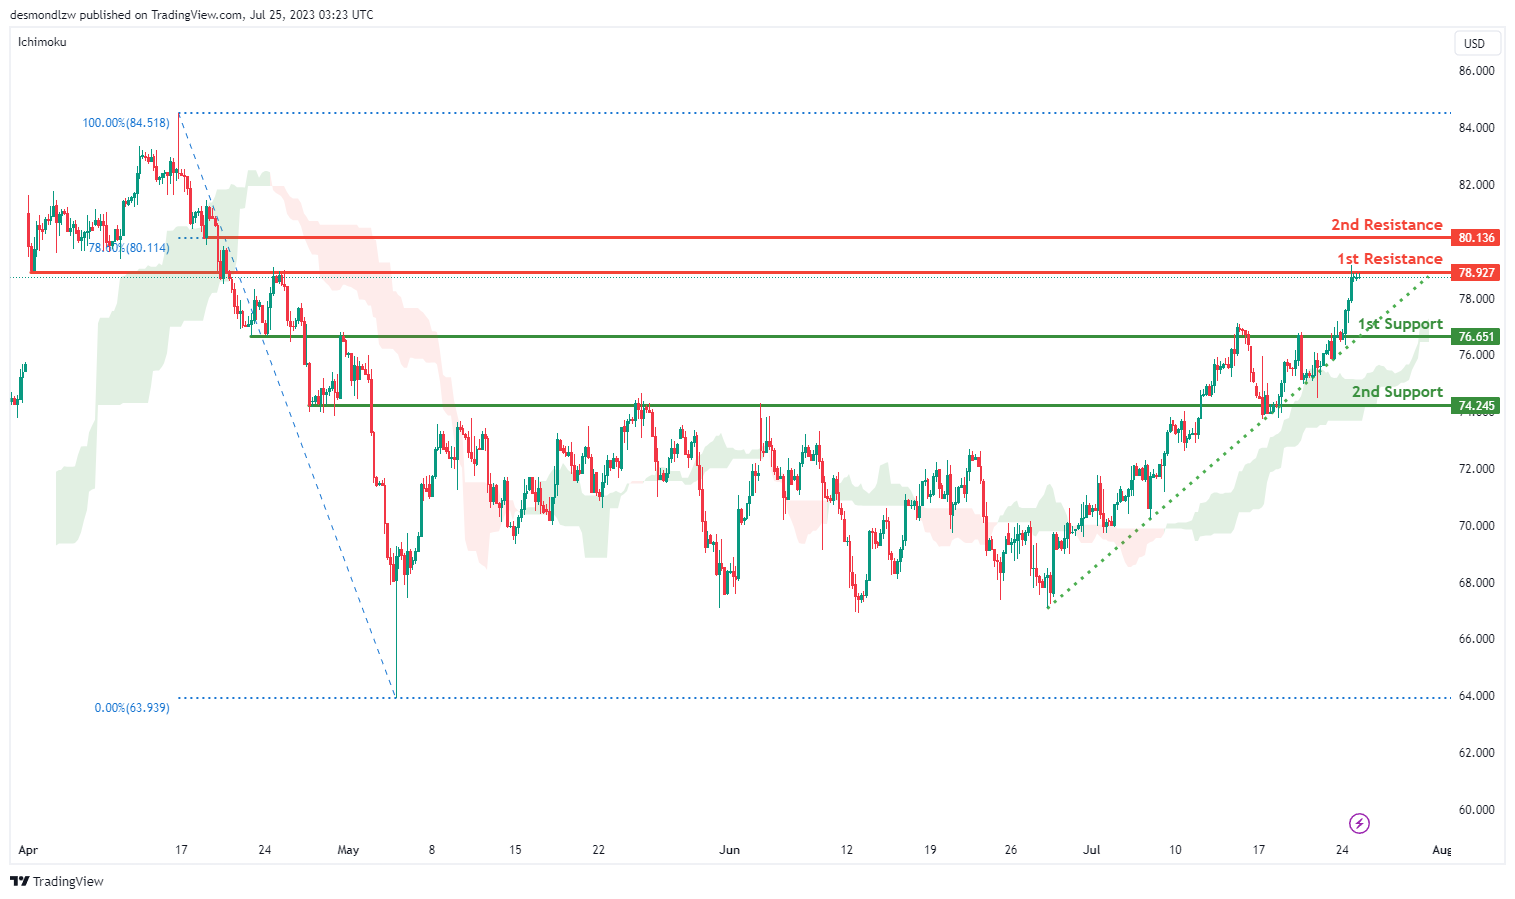
The WTI (West Texas Intermediate) chart displays a bullish momentum, supported by the fact that the price is above the bullish Ichimoku cloud and follows an ascending trend line, which acts as a support line.
However, despite the overall bullish momentum, a possible scenario indicates a potential bearish reaction off the 1st resistance level at 78.92. This resistance level is considered an overlap resistance, suggesting a possible price pullback towards the 1st support at 76.65, which is recognized as a pullback support.
Should the bearish reaction continue, the 2nd support at 74.24 may act as another essential area, functioning as an overlap support.
On the other hand, the 2nd resistance at 80.13 represents a significant level, coinciding with the 78.60% Fibonacci retracement, and may provide resistance against further upward movement.
XAU/USD (GOLD):
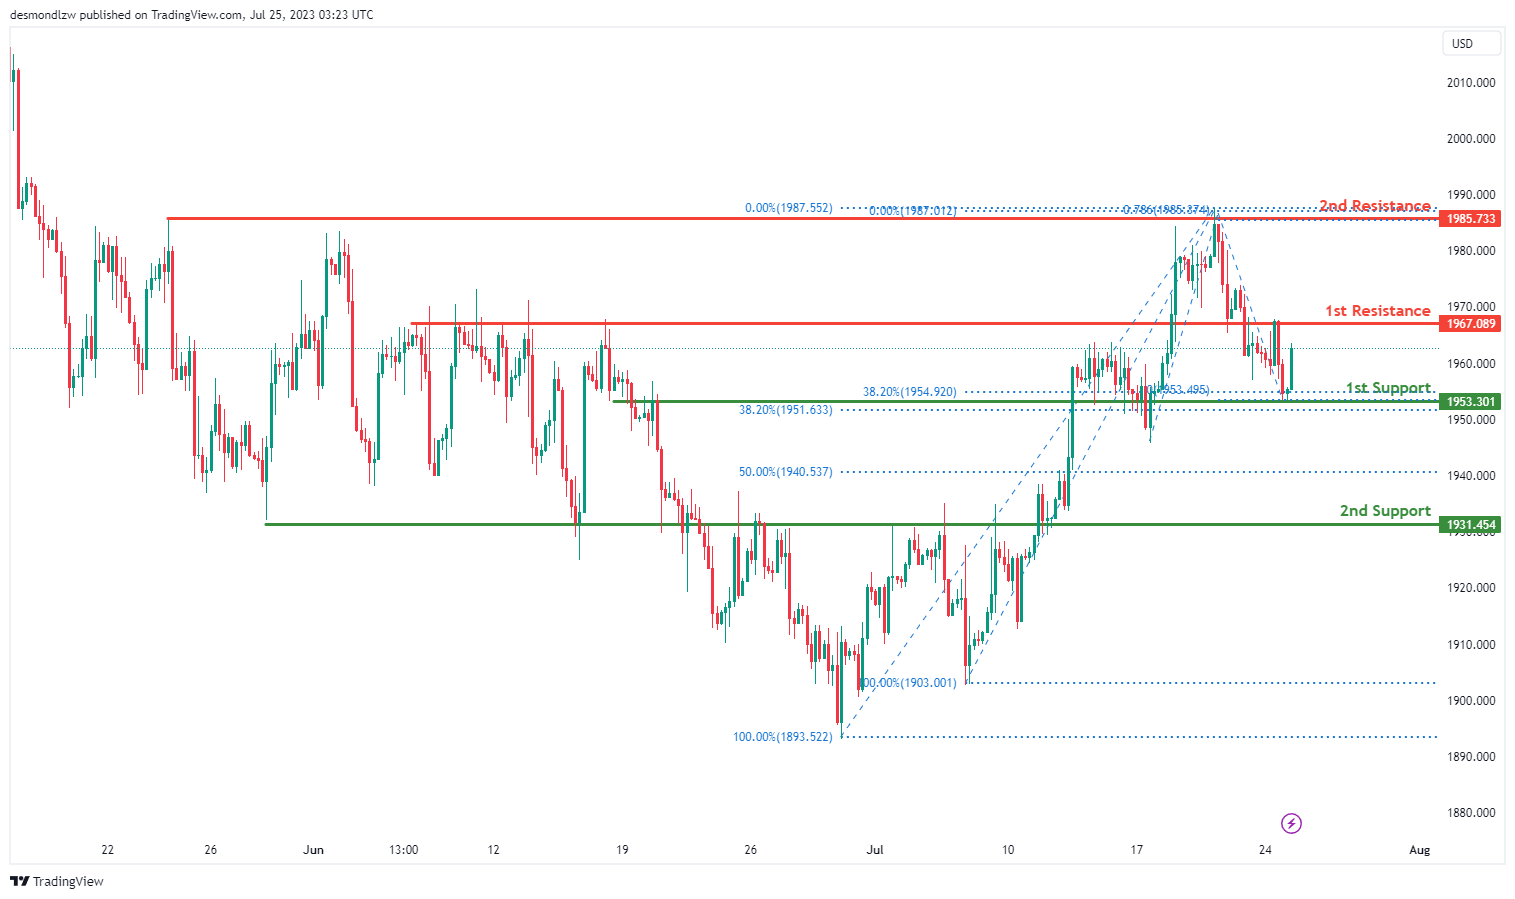
The XAU/USD (Gold against the US Dollar) chart indicates a bullish momentum, suggesting the potential for further upward movement.
In this scenario, a possible continuation towards the 1st resistance at 1967.08 is anticipated. This resistance level is recognized as an overlap resistance, which could potentially hinder the price’s upward progress.
On the downside, the 1st support at 1953.30 is considered crucial, as it aligns with the 38.20% Fibonacci retracement and another 38.20% Fibonacci retracement, indicating a Fibonacci confluence. Additionally, the 2nd support at 1931.45 acts as an overlap support, further reinforcing its significance as a potential price floor.
In case of further bullish momentum, the 2nd resistance at 1985.73 is identified as a multi-swing high resistance, indicating a challenging barrier for the price.
Copper and Aussie rally on China’s stimulus optimism
Copper rises notably today, on optimism of fiscal stimulus in China, or at least some policy adjustment. Australian Dollar is also taken higher too, even though it lags in momentum. The moves come with strong rally in Hong Kong stocks and Chinese Yuan in the background.
As for Copper, immediate focus in now on 3.8787 resistance. Firm break there will confirm that fall from 3.9420 has completed. That would also indicate the completion of the three-wave corrective pattern from 3.9501 at 3.7725. Further rise should then be seen to retest 3.9501 first. Firm break there will resume whole rise from 3.5387 to 61.8% projection of 5.5387 to 3.9501 from 3.7725 at 4.0267 next.
As for AUD/USD, a temporary low was formed at 0.6714 with current recovery. If the rally in Copper continues to gather strength, it could aid AUD/USD in pushing through 0.6845 resistance, or even surpassing 0.6898 to resume the entire rebound from 0.6457.
HSI and Yuan surge as China pledges policy adjustments
Hong Kong stocks are having a strong rebound today, concurrently with a surge in Chinese Yuan. These dynamic shifts come in the wake of a promise from China's Politburo to "adjust and optimize policies in a timely manner" for its troubled property sector. The top decision-making body has also underscored its commitment to promoting stable employment as a strategic objective. Other pledges include efforts to stimulate consumer spending and manage debt risks, and an intention to implement "counter-cyclical" policy.
HSI opened with a substantial gap up and, at the time of writing, is trading over 3% higher. However, from a technical standpoint, HSI will need to convincingly overcome resistance level at 19523.71 and 55 D EMA to neutralize near-term bearish ness. Failing to do so, the decline from 22700.85 – whether it's seen as a corrective move or part of a larger downtrend – is still expected to extend beyond 18044.85 low.
Meanwhile, USD/CNH is diving notably too. Market rumors suggest that major state-owned banks have been observed selling US Dollars to buy Yuan in both onshore and offshore spot markets to bolster Yuan exchange rate. On the whole, USD/CNH is seen as extending the corrective pattern from 7.2853 only. In case of deeper fall, strong support could emerge at around 38.2% retracement of 6.810 to 7.2853 at 7.1037 to bring rebound.
Will July Rate Hike Be One and Done for Fed?
After a short break in June, the Fed is expected to announce its eleventh rate hike on Wednesday at 18:00 GMT. Most analysts think this will be the last rate increase of the tightening cycle that began in March 2022, but they will seek confirmation and look for signs of a possible rate cut next year. If the Fed dismisses these rumors and takes more time to assess the effects from previous tightening, the greenback could still gain new traction.
“Tightening is not over yet” is a phrase that has been ringing in investors' ears for a couple of months now. The Fed has been hiking interest rates every single meeting since March 2022, from nearly zero to a range of 5.0-5.25%, applying its most aggressive monetary tightening policy by historical standards.
As it pledged, the Fed left rates steady in June, but it indicated that two additional quarter-percentage point rate increases are on the way in the remainder of the year. It’s not clear whether the Fed wanted to take some time to assess the impact from previous rate increases as the Fed chief explained, or rather provide a breather to the financial sector as the Treasury department refills its coffers following the scrapping of the debt ceiling. In any case, the hawkish guidance revived the dollar’s rally until a faster-than-expected drop in CPI readings flipped back those gains.
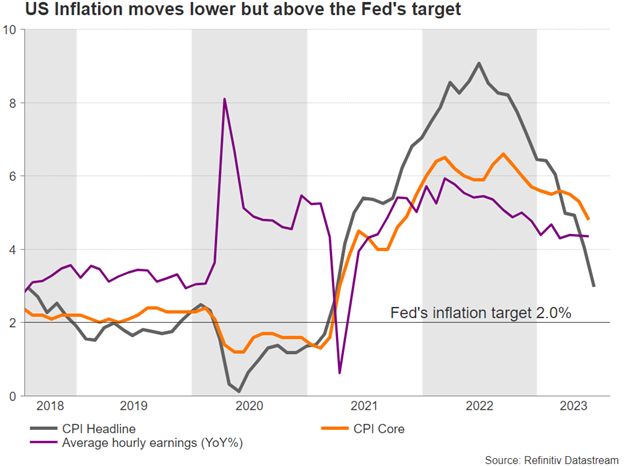
Headline inflation fell notably to 3.0% in June to the lowest since March 2021 and since before the aggressive rate increases started to take effect. The fall in the core measure to 4.8% from 5.3% before was also good news, though the gap with the central bank’s 2.0% target remained wide, suggesting that Americans are still feeling the pinch in their wallets. Hence, another 25bps rate hike is a done deal according to futures markets, especially as job openings keep outpacing job seekers and wage growth remains relatively robust compared to pre-pandemic levels. Besides, the Fed might want to follow the rate hike signal it sent during June’s gathering as the latest hawkish communication from Fed policymakers suggests.
What's next?
Now the real question should be what the Fed will do after the summer. The majority of policymakers expected rates to rise twice by the end of the year in June, but investors are currently prepared for one-and-done. What’s more striking is that 2024 rate cut pricing persists despite policymakers consistently playing down the case, with investors foreseeing 125 bps of monetary easing. Hence, for the US dollar to preserve its recovery above the 100 level against a basket of major currencies, the Fed will need to dismiss the rate cut scenario and keep the door open for further tightening from September onwards. At this point, it is also important to mention that promises for lower interest rates could play out during the 2024 election campaigns, but that might be a story for another day.
Terminating the tightening phase at this current stage could be premature, as price stability is not in sight yet. Therefore, the Fed could still cite the resilience in the US economy and say that the fight against inflation is not over yet if it aims to extend its current hawkish guidance. But after three bank closures and given the uncertainty about when and how previous rate hikes will hit the economy, the central bank may adopt a neutral tone regarding the September meeting. There are two more CPI inflation and employment reports before its next gathering, while the Jackson’s Hole central bank symposium is scheduled for Aug.24-26. Therefore, the Fed might want to ensure a sustainable decline in inflation and see serious signs of a decelerating economy before announcing the end of the tightening phase.
Market reaction
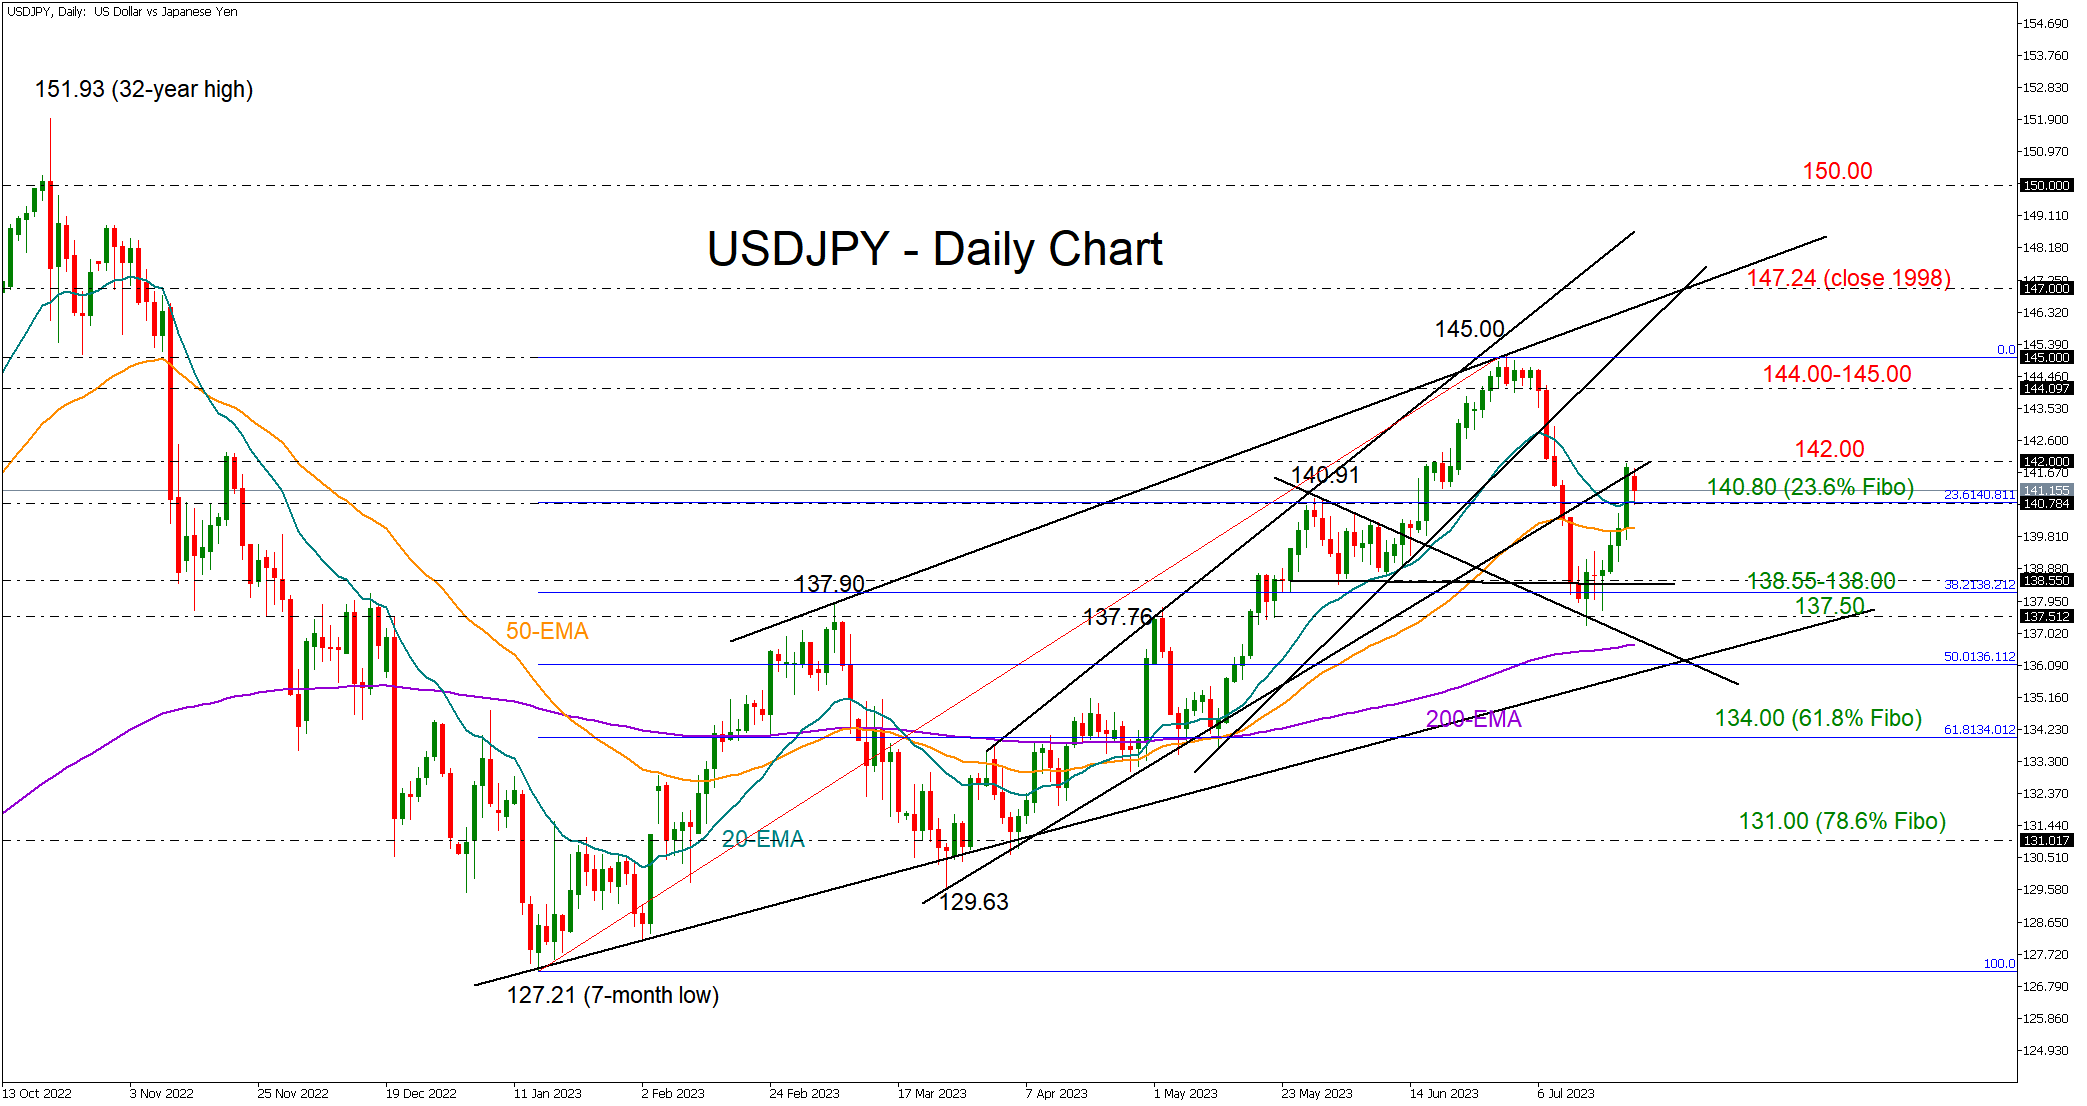
In FX markets, a neutral stance could limit dollar gains unless Powell judges that interest rates should stay elevated for longer and rate hikes could still happen in the coming months. In this case, dollar/yen could climb the 142.00 wall and run towards the crucial 144.00-145.00 resistance zone. The 147.00-147.24 region could attract attention in the event of steeper increases. A less hawkish communication from the ECB and BoJ this week could bode well for the greenback too.
Alternatively, if the Fed appears satisfied with the drop in inflation, questioning the need for additional rate increases, the US dollar could drift lower. Initial support could develop around the 140.00 level, a break of which could stabilize somewhere between 138.50 and 138.00. A decisive step lower could meet the 200-day exponential moving average at 136.70. Overall, any signals that the Fed has reached its terminal interest rate could trigger a new bearish wave.
AUD/USD Technical: Rebounded Right at 200-day Moving Average
- AUD is the biggest gainer (+0.22%) against the USD in today’s Asian morning session.
- The current rebound of the AUD/USD has taken shape right at the key 200-day moving now acting as support at 0.6700.
- Intermediate resistance for the AUD/USD stands at 0.6835.
Since the 20 July 2023 intraday high of 0.6847, the AUD/USD has declined by 132 pips to print a low of 0.6715 yesterday, 24 July in light of short-term bearish sentiment seen in China equities due to the continuation of bleak key economic data (Q2 GDP, retail sales, youth unemployment, housing prices) that indicates weak internal demand environment, and heightened risk of a deflationary spiral in China.
Interestingly, the 132 pips slide has managed to find support on the key 200-day moving average and staged a bounce of 41 pips to print a current intraday high of 0.6756 in today’s Asian morning session. The Aussie dollar is the strongest currency against the USD with an intraday gain of +0.22% that surpassed the other majors, GBP (+0.13%), JPY (+0.13%), NZD (+0.11%), EUR (+0.08%), CHF (+0.05%), CAD (+0.02%) at this time of the writing during today, 25 July Asian morning session.
Today’s outperformance of the AUD/USD has been reinforced by China’s top decision-making body, the Politburo which issued a statement of “hope” at the end of its meeting yesterday that vowed to implement counter-cyclical policy to boost consumption, more support for the property market, and ease local government debt.
The medium-term trend is still sideways
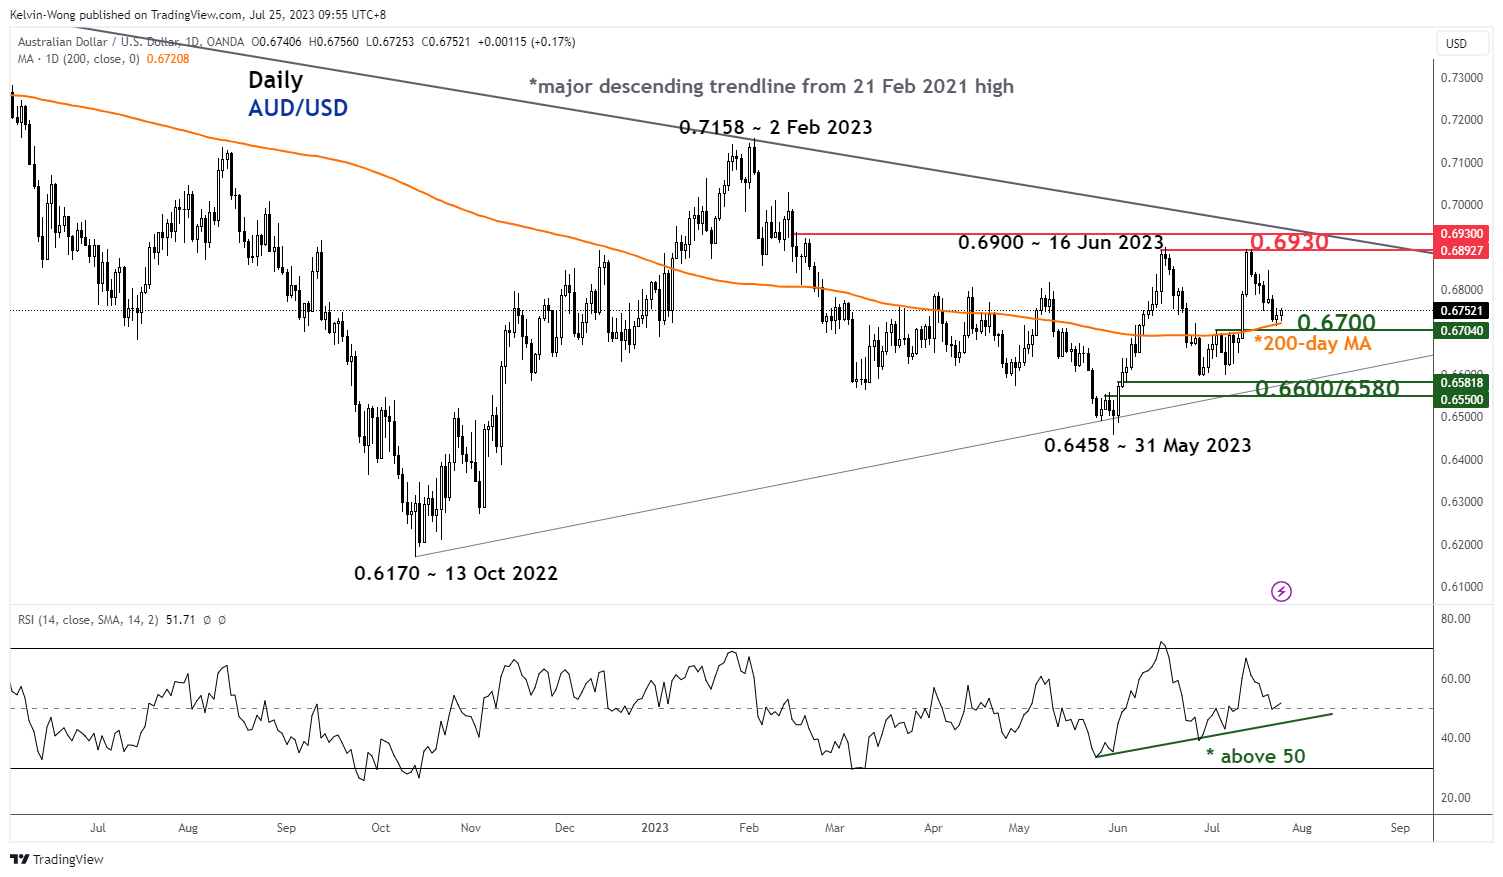
Fig 1: AUD/USD medium-term trend as of 25 Jul 2023 (Source: TradingView, click to enlarge chart)
The medium-term trend of the AUD/USD is still trapped with a sideways range configuration between 0.6930 and 0.6580.
Held at key 200-day moving average with bullish short-term momentum
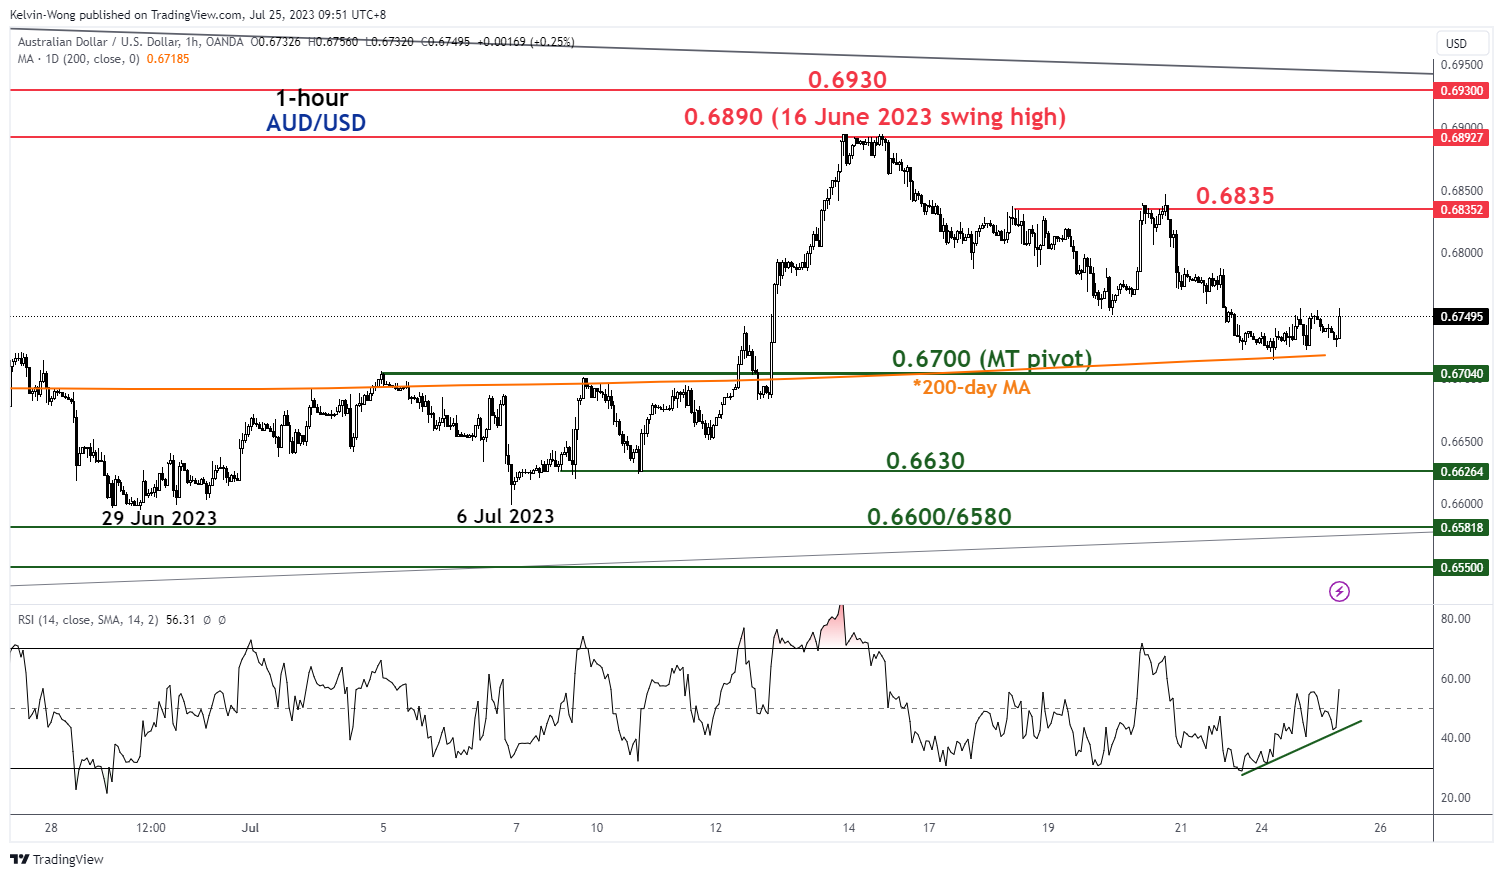
Fig 2: AUD/USD minor short-term trend as of 25 Jul 2023 (Source: TradingView, click to enlarge chart)
In conjunction with the current rebound right at the 200-day moving average, the hourly RSI oscillator has traced out a series of “higher lows” after an exit from its oversold region and has yet to reach its overbought region. These observations suggest that short-term momentum has turned bullish.
Watch the 0.6700 key medium-term pivotal support to maintain the bullish tone with intermediate resistance coming in at 0.6835 and a clearance above it sees 0.6890 next (also the 16 June 2023 swing high).
On the flip side, failure to hold above 0.6700 negates the bullish tone to expose the next near-term support at 0.6630.