

Sample Category Title
NZ BNZ PMI fell to 47.5, sector remains entrenched in contraction
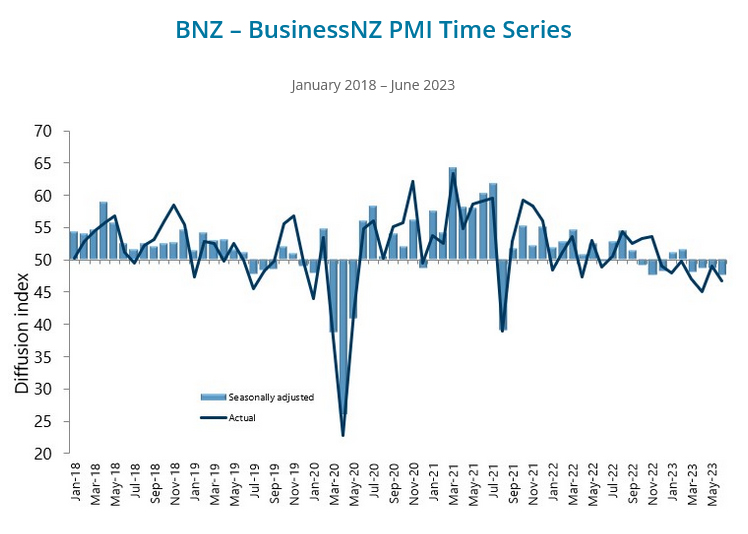
New Zealand's manufacturing sector is experiencing a continuous contraction according to BusinessNZ Performance of Manufacturing Index. The Index showed a drop from 48.7 in May to 47.5 in June, marking another month of activity below the crucial 50.0 point mark which separates expansion from contraction.
An analysis of the sub-indices revealed mixed performances across different facets of the sector. While production showed a modest rise from 46.0 to 47.5, new orders experienced a significant drop from 50.2 to 43.8. Meanwhile, employment levels decreased from 49.3 to 47.0. Both finished stocks and deliveries saw rises, from 51.6 to 52.2 and 46.1 to 50.5 respectively.
Alongside this contraction in activity, the report noted an increase in negative sentiment among manufacturers. In June, the proportion of negative comments increased to 74.5%, up from 66.7% in May and 70.3% in April. According to manufacturers, the primary negative influences on current activity are declining demand, inflationary pressures, and issues surrounding production and staffing.
BusinessNZ's Director, Advocacy Catherine Beard, pointed out the persisting contraction in the sector, saying, "the sector remains entrenched in contraction, with eight of the last ten months showing overall activity below the 50.0 point mark."
Fed Beige Book: Slight increase in economic activity and modest price rises
Fed's Beige Book report noted that the "overall economic activity increased slightly since late May." Notably, the level of economic development varied across the twelve districts, with five districts reporting growth, five noticing no change, and two marking modest declines.
The Beige Book described a cautiously optimistic picture for the future, stating that "overall economic expectations for the coming months generally continued to call for slow growth."
Despite the uneven growth rate, the districts generally agreed on the direction of price changes. The report noted that "prices increased at a modest pace overall, and several districts noted some slowing in the pace of increase."
Looking ahead, the report suggests that the "price expectations were generally stable or lower over the next several months".
The employment situation was characterized by a modest rise, with the Beige Book stating that "employment increased modestly this period, with most districts experiencing some job growth."
US Inflation: Great Progress, But Risks Remain
Headline inflation is now a fraction of its peak level; however, by itself, shelter’s contribution is greater than the FOMC’s 2.0%yr target.
In June, both the headline and core CPI outcomes were below expectations at 0.2%, leaving the respective annual rates at 3.0%yr and 4.8%yr, materially below their 2022 peaks of 9.1%yr and 6.6%yr. The so called ‘Supercore’ measure (core services ex housing) was midway between the headline and core prints at 4.0%yr and compares to a peak in 2022 of 6.5%yr.
In the underlying detail is clear evidence of a broad-based deceleration in price pressures. On a six-month annualised basis, inflation for ‘food at home’ has slowed from 12.5% last July to 2.5%; while ‘food away from home’ has eased from 10.8% in October to 6.3%. Inflation for goods ex energy and food is also only a fraction of its 2021 peak rate, 2.6% compared to 13.9%. Though in recent months, there has been considerable variability in price outcomes by item.
Whereas apparel has experienced consistent monthly gains of 0.3% over the past four months and new vehicle prices are little changed, used car prices rose 4.4% in both April and May and then only declined 0.5% in June. Conversely for services, while medical care and education prices are marginally lower over the past four months and recreation costs modestly higher, airline fares have plunged, -2.6%; -3.0%; and -8.1% in April to June to be 18.9% lower than a year ago. Clearly the post-pandemic re-opening has run its course; but, as for used cars, some sectors still face an imbalance between demand and supply.
The most important area of the economy facing such a concern is housing. While the shelter component of the CPI, which is primarily determined by rents, has decelerated from an average reading of 0.7% through Q1 to 0.5% in Q2, that still equates to a 6% annualised pace for Q2, twice the average pace back to 1994. Given its 35% headline CPI weight, shelter is currently contributing 2.1ppts to inflation on an annualised basis. For core, the contribution is larger still at 2.6ppts as shelter’s weight within the core is 43.5%.
This is a critical point to highlight: shelter has the capacity to create at or above target outcomes for inflation by itself if current rates of rent inflation persist. Our baseline expectation is instead that it will follow the market rent measures down through the remainder of the year to a still above average 4.5% annualised pace at December, allowing headline inflation to ease to 2.0% annualised. But clearly there are risks to the upside.
Changing tack, the Federal Reserve’s July Beige Book was also released overnight and was constructive for the outlook. Economic activity was reported to have “increased slightly since May”, employment only “modestly”. Most significant for inflation is that the “unusually high [labour market] turnover rates in recent years appear to be returning to pre-pandemic norms” and contacts “in multiple Districts reported that wage increases were returning to or nearing pre-pandemic levels”.
While not a factor for shelter, these outcomes support the case for a continued deceleration in discretionary service categories of inflation such as ‘food away from home’ and travel, particularly as momentum in goods input costs has already receded. The “reluctance to raise prices because consumers had grown more sensitive” shown by contacts in some districts in May to July is therefore likely to gain greater traction ahead, further helping to moderate inflation outside of housing. Price pressures seen as “generally stable or lower over the next several months” support this thesis.
With respect to the implications for the FOMC, as above we anticipate that by year end, six-month annualised inflation will be at 2.0%yr, albeit with the risk of a higher pulse if the shelter component shows greater persistence. On an annual basis, that equates to a 2.6%yr annual rate against the FOMC’s 3.2%yr expectation as per their June forecasts. At year-end, we also expect to see the unemployment rate around 4.0%, in line with the FOMC’s current expectation, and annual GDP growth of 0.7%yr, below the FOMC’s 1.0%yr forecast. Note, part of the difference between our and the FOMC’s expectation for growth through 2023 is a contraction in Q4 2023, which we see as the first part of a small technical recession over the six months to March 2024.
We therefore see the FOMC progressively becoming more focused on the risks to activity through the second half of 2023, having completed the tightening cycle in July with a 25bp hike to 5.375% and highlighted the need for policy to remain contractionary for an extended period at August’s Jackson Hole Symposium. The most likely timing for the first cut is therefore March 2024 when we expect a 25bp reduction (note, previously we had forecast 50bps of cuts in Q1 2024, but the January meeting now seems too early and 50bps at March too sudden). Rate cuts are then expected to continue at 50bps per quarter through Q2 2024 to Q2 2025, leaving the fed funds rate at 2.625% mid-2025 (unchanged from our prior forecast). At that level, the fed funds rate is best considered broadly neutral, being in line with the FOMC’s 2.50% ‘longer run’ expectation. As is the case in late-2023, the prime risk for 2024 and 2025 is that shelter inflation is stronger than currently forecast, leaving little room for inflation elsewhere in the consumer basket.
Crude Oil Price Extends Rally Above $75, US CPI Eases To 3%
Key Highlights
- Crude oil price started a fresh increase above the $72.50 resistance.
- A key bullish trend line is forming with support near $73.90 on the 4-hour chart.
- EUR/USD surged above the 1.1050 and 1.1080 resistance levels.
- The US CPI declined from 4% to 3% in June 2023 (YoY).
Crude Oil Price Technical Analysis
Crude oil price remained strong above the $70 level against the US Dollar. The price started a fresh increase and was able to clear a major hurdle at $72.50.
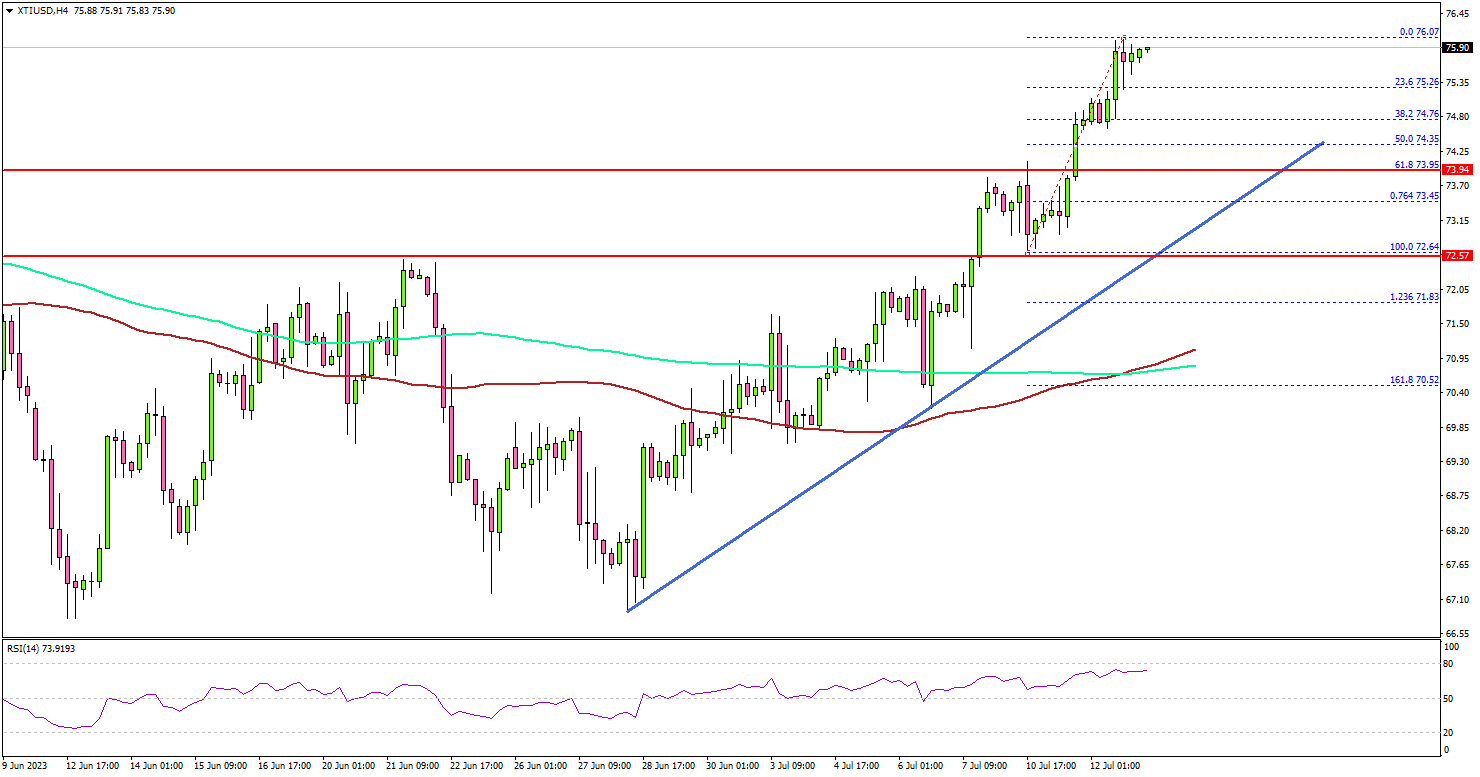
Looking at the 4-hour chart of XTI/USD, the price settled above the $73.50 level, the 100 simple moving average (red, 4-hour), and the 200 simple moving average (green, 4-hour).
The bulls even pumped the price above the $75 resistance. It tested the $76 level and started a consolidation. On the downside, initial support is near the $74.75 level. The next major support sits near the $74.00 level.
There is also a key bullish trend line forming with support near $73.90 on the same chart. Any more losses might call for a test of the $72.50 support zone in the coming days.
On the upside, the first major resistance is near the $76.50 level. The next major resistance is near the $78.00 level, above which the price may perhaps accelerate higher. In the stated case, it could even revisit the $80 resistance.
Looking at EUR/USD, the pair gained bullish momentum after there was a close above the 1.1010 level. It surged above the 1.1050 resistance and then 1.1100.
Economic Releases to Watch Today
- US Initial Jobless Claims - Forecast 250K, versus 248K previous.
- US Producer Price Index for June 2023 (MoM) – Forecast +0.2%, versus -0.3% previous.
- US Producer Price Index for June 2023 (YoY) – Forecast +0.4%, versus +1.1% previous.
Gold – Boosted by US Inflation Data But Recovery Still Early
- Recent range highs broken after CPI release
- Lower inflation could increase gold’s appeal
- One more rate hike expected from the Fed
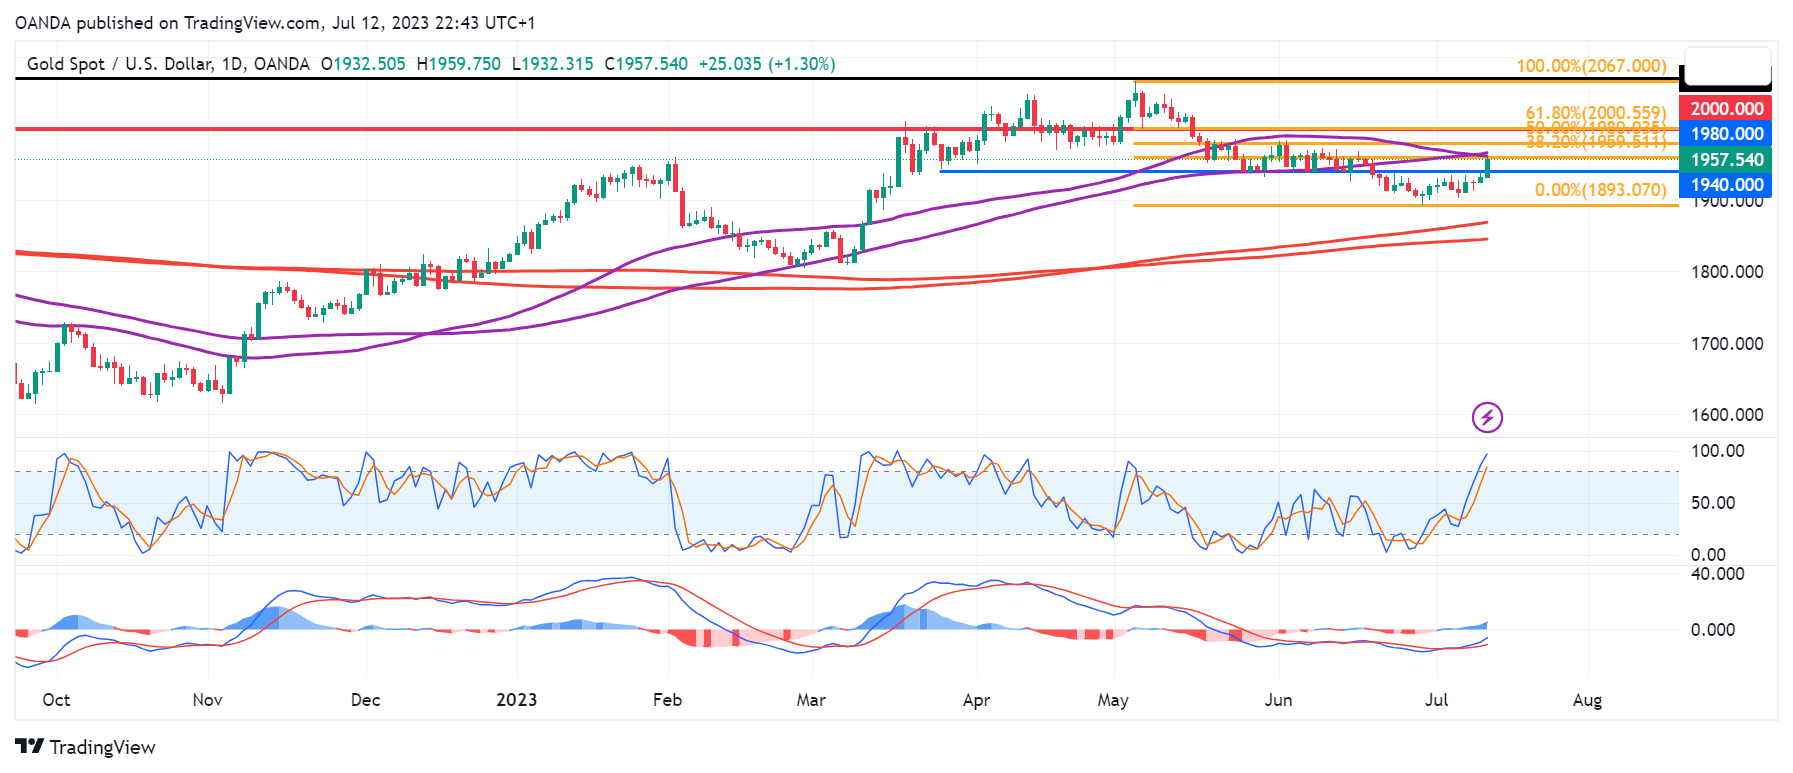
The US inflation data gave gold just the boost it needed to break back above $1,940 after failing to pierce that level in recent days.
The yellow metal has been range-bound in recent weeks between $1,900 and $1,940 and today’s report did what the jobs data failed to do; it provided the catalyst for a breakout.
Gold Daily
Source – OANDA on Trading View
There remains plenty of resistance ahead for gold and today’s move doesn’t necessarily suggest the correction we’ve seen since May is over but it’s a massive step in the right direction. If the inflation data continues to improve then that could be bullish for gold.
The next tests for gold are $1,940, $1,960, and $2,000, which roughly represent the 38.2%, 50%, and 61.8% Fibonacci retracement levels from the May high to the June lows.
The inflation data may have come too late to change the outcome of the July Fed meeting, especially in light of the June jobs report, but it may alter the central bank’s language if it does hike by another 25 basis points. It’s going to be a big summer of data.
EURCAD Wave Analysis
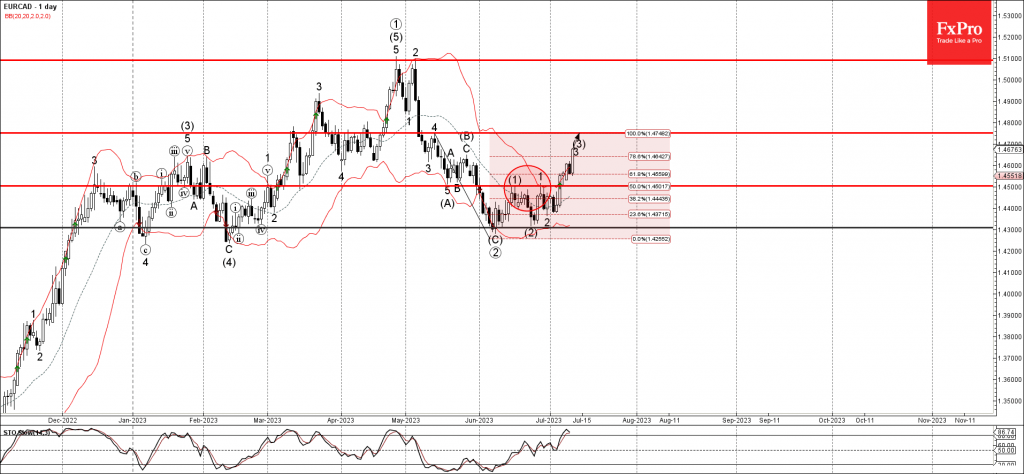
- EURCAD broke resistance level 1.4500
- Likely to rise to resistance level 1.4750
EURCAD continues to rise after the earlier breakout of the resistance level 1.4500, which stopped the two of the previous impulse waves (1) and 1, as can be seen below.
The breakout of the resistance level 1.4500 accelerated the active upward impulse waves 3 and (3).
Given the strong bullish euro sentiment, EURCAD can be expected to rise further toward the next resistance level 1.4750 (top of wave 4 from May).
GBPUSD Wave Analysis
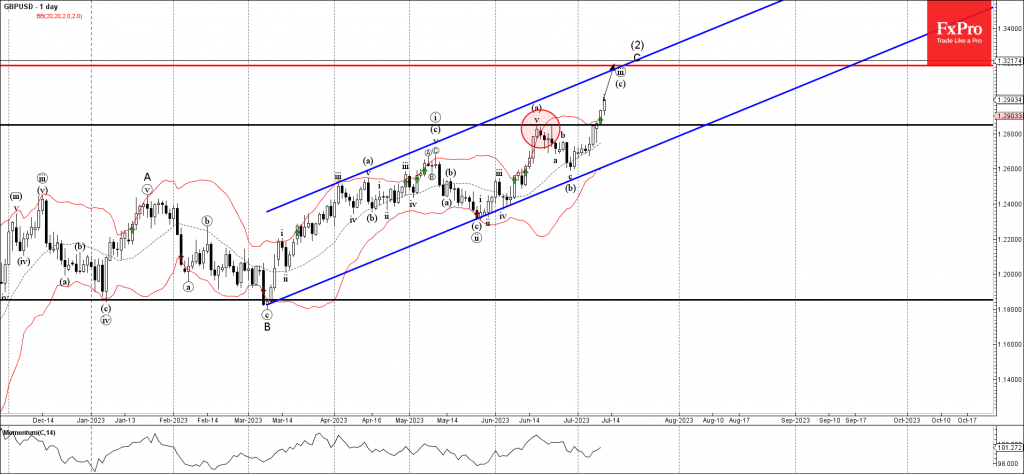
- GBPUSD broke key resistance level 1.2850
- Likely to rise to resistance level 1.3190
Sterling under the strong bullish pressure after the price broke the key resistance level 1.2850, which stopped the previous impulse wave (a) in the middle of June.
The breakout of the resistance level 1.2850 continues the active sharp upward impulse wave C of the weekly ABC correction (2) from last year.
Given the prevailing daily uptrend and strong USD sales across the FX markets, Sterling can be expected to rise further toward the next resistance level 1.3190 (target for the completion of wave C, intersecting with the daily up channel from March).
Bank of Canada Takes Their Policy Rate 25 bps Higher
The Bank of Canada raised the overnight rate by 25 basis points, to 5%, while stating that it will continue with Quantitative Tightening (QT). With the hike, the policy rate is now at its highest level since 2001.
On economic growth the Bank stated that "Canada's economy has been stronger than expected" and that recent data signals more persistent excess demand in the economy. The Bank also flagged the recent pick up in the housing market and that conditions in the job market remain tight, with wage growth hovering around 4-5%.
On inflation, it stated that while "CPI inflation has come down largely as expected so far this year, the downward momentum has come more from lower energy prices, and less from easing underlying inflation." In addition, it noted that "underlying price pressures appear more persistent than anticipated" and that "businesses are still increasing their prices more frequently than normal". Finally, policymakers re-iterated. their concern that progress towards the 2% inflation target could stall.On the future path of policy, the Bank will "be evaluating whether the evolution of excess demand, inflation expectations, wage growth and corporate pricing behaviour are consistent with achieving the inflation target." This is unchanged from the April statement.
Accompanying the Bank's policy statement was a fresh set of forecasts. Real GDP is now seen as expanding by 1.8% this year (versus 1.4% in April), 1.2% in 2024 (1.3%) and 2.4% in 2025 (nearly unchanged). In the near-term, growth is expected to be 1.5% in both the second and third quarters of this year.
Notably, the Bank's inflation projections have been materially upgraded. By 2023Q4, inflation is seen at 2.9%, versus 2.5% in their April projection. They've also pushed out when they see inflation hitting the 2% target, with that now anticipated to happen in the middle of 2025, as opposed to the end of 2024 in their April forecast.
Key Implications
Today's rate hike demonstrates that the Bank of Canada is not satisfied with the modest cooling in inflation and wage pressures that has been seen since its June hike. As it outlined in the statement, it's concerned about excess demand and core inflation that are proving to be more persistent than what policymakers had expected.
So, where does policy go from here? The onus is on the incoming data, which we think will show enough weakness over the coming months for policymakers to remain on hold for the next few quarters. We're already seeing signs that job markets are softening, with vacancies well below prior peaks, the unemployment rate on the rise, wage growth beginning to moderate.
However, this view is not without risks. A big factor behind the persistence in excess demand and inflation noted by the Bank of Canada has been robust consumption. The Bank is counting on household spending slowing down in coming quarters but are cognizant of the risks. Our own forecast sees consumption slowing down materially in coming quarters, with this softness more apparent in 2024. Should household spending prove more resilient than policymakers anticipate, this would offer a pathway to higher rates.
Housing is also clearly weighing on the Bank's mind, given the recent pickup in activity and recent signs of resilience to its hike in June. The performance of this sector will also play an important role in any decision on rates moving forward.
US Inflation Slows, But Fed Has the Last Word
The US consumer price index slowed to an annual rate of 3.0% in June from 4.0% the previous month. This was slightly below the expected 3.1%. Core inflation slowed to 4.8% from 5.3%, and 5.0% expected. This is the ninth consecutive report where an indicator has been in line or weaker than expected, but we see a different market reaction.
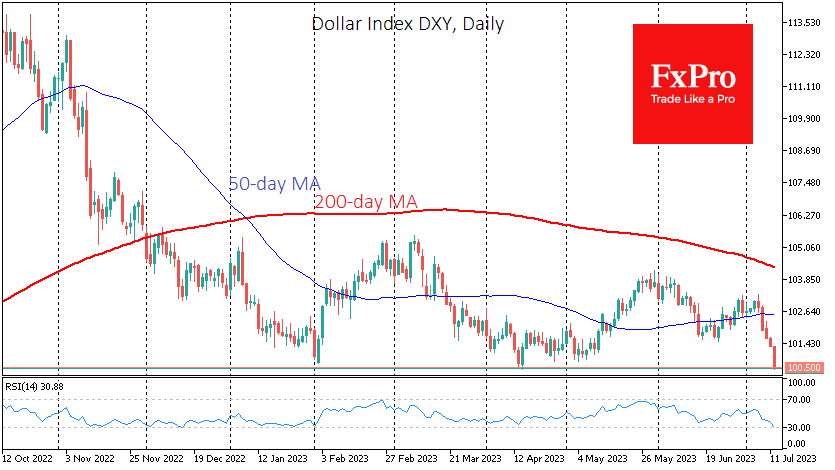
This time the markets are confident, risk appetite is rising, and the dollar is falling as the latest report has fuelled speculation that the Fed will not need to stick to its plan of two rate hikes this year or will allow for a quicker reversal to policy easing next year.
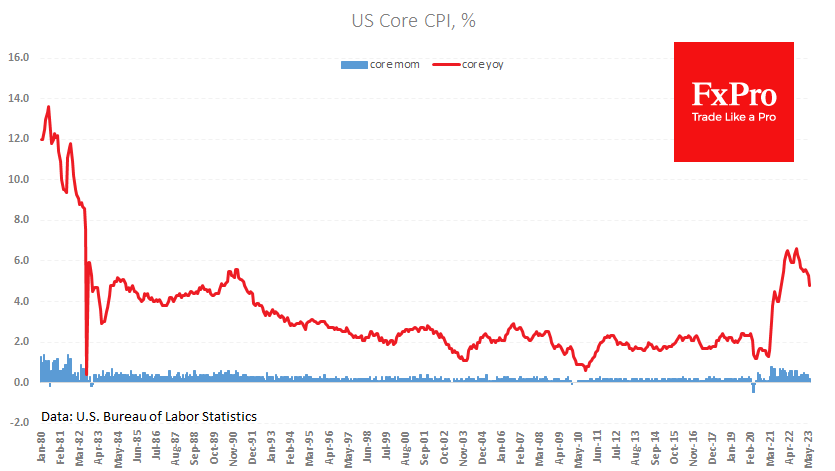
Traders’ and investors’ attention should now turn to the Federal Reserve’s assessment of the latest data. In addition to the speeches by Barkin, Kashkari and Bostic, the Fed’s Beige Book will be released today, which will be used as the basis for the Fed’s observations at the July meeting.
While the Fed is often wrong in its forecasts, it is still the Fed that has the final say on interest rate decisions. Despite the constant inflation surprises, FOMC members remain hawkish in their comments, regularly pointing out that the fight against inflation is not over.
After the latest inflation report, the dollar index was close to its lowest level since April 2022, losing more than 12% from its peak last September. This decline creates additional pro-inflationary pressure, unlikely to please the central bank.