Sample Category Title
USDJPY Sellers Could Stay in Play
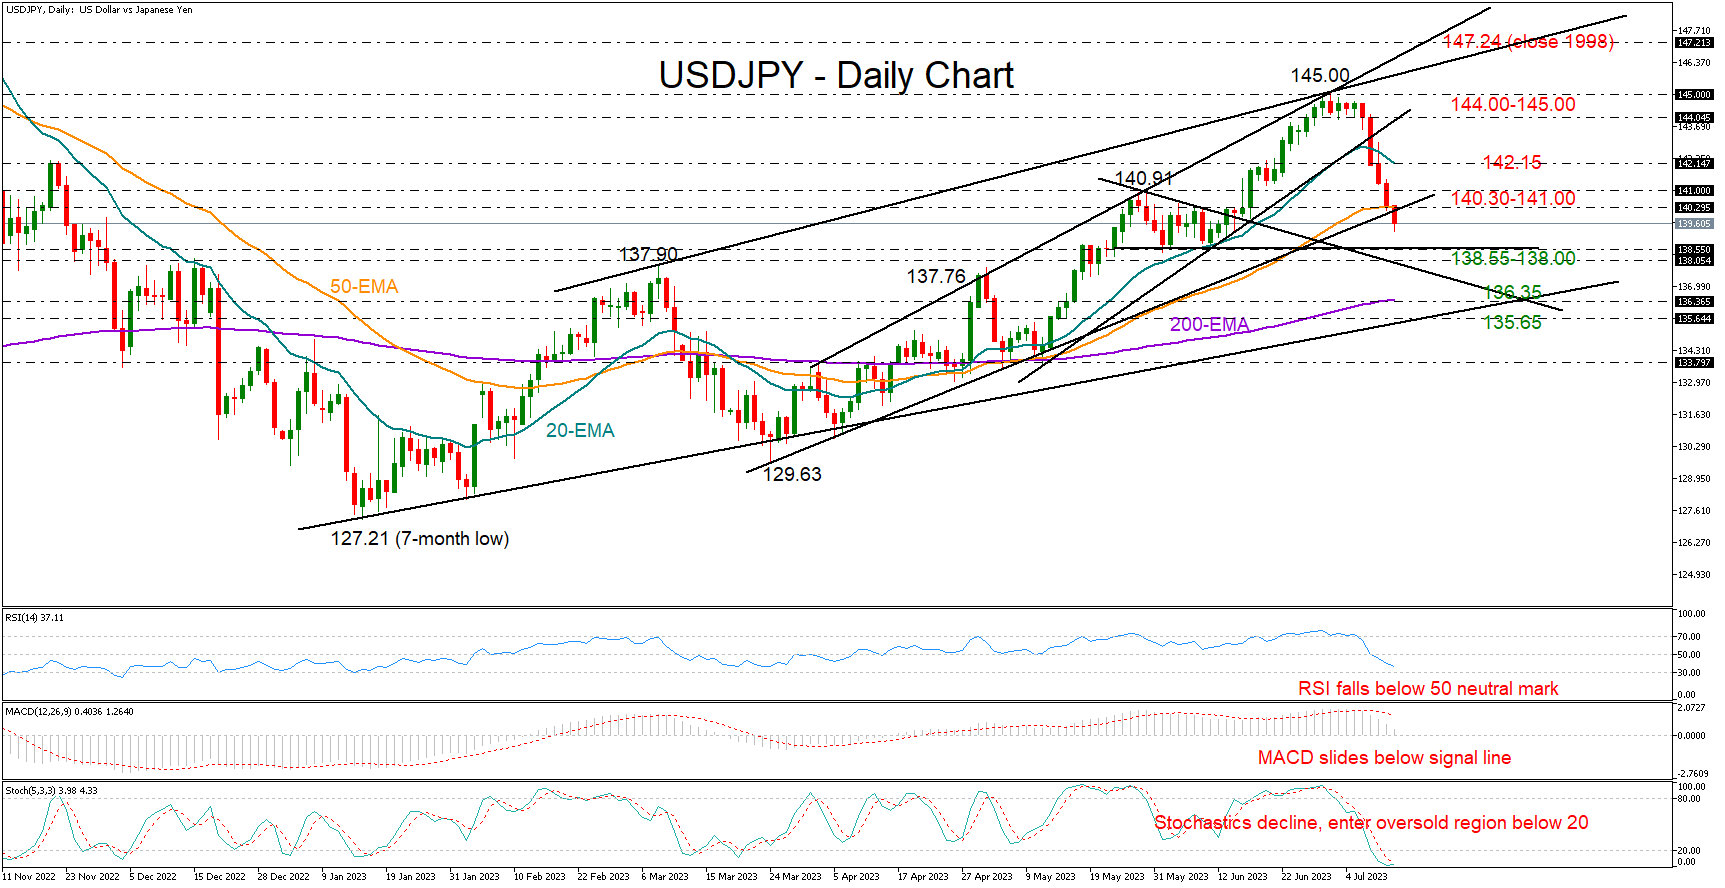
USDJPY has been sold aggressively since the NFP release last Friday, falling by almost 2.0% to a one-month low of 139.30.
The bears snapped the latest bullish wave from mid-June, which peaked at 145.00, currently aiming for a close below the 50-day exponential moving average (EMA) and the support trendline from the March low at 140.30.
Given the negative trajectory in the momentum indicators, the freefall in the price is expected to gain another leg to enter the 138.55-138.00 constraining zone, where the price stabilized back in June. It’s worthy to note that the 20-period EMA in the weekly chart is flattening within the same boundaries. Hence, a decisive close lower, and more importantly below 137.50, could renew selling pressures, shifting the spotlight to the 200-day EMA at 136.35. A drop below the 2023 ascending trendline at 135.65 would then signal a trend deterioration in the long-term picture.
An upside reversal, however, could be underway as the stochastic oscillator seems to be looking for a pivot within the oversold region below 20. Should the bulls take control immediately, pushing the pair back above the 140.30-141.00 area, they may initially pause around the 20-day EMA at 142.15. Even higher, traders would like to see an advance above the 144.00-145.00 zone and beyond the two ascending lines in order to raise their buying orders.
In brief, USDJPY could remain downbeat in the coming sessions, with traders looking for support within the 138.55-138.00 region. A bounce above 140.30-141.00 could reduce downside risks.
USDCAD Lower Again; Stochastic Could Dictate the Next Move
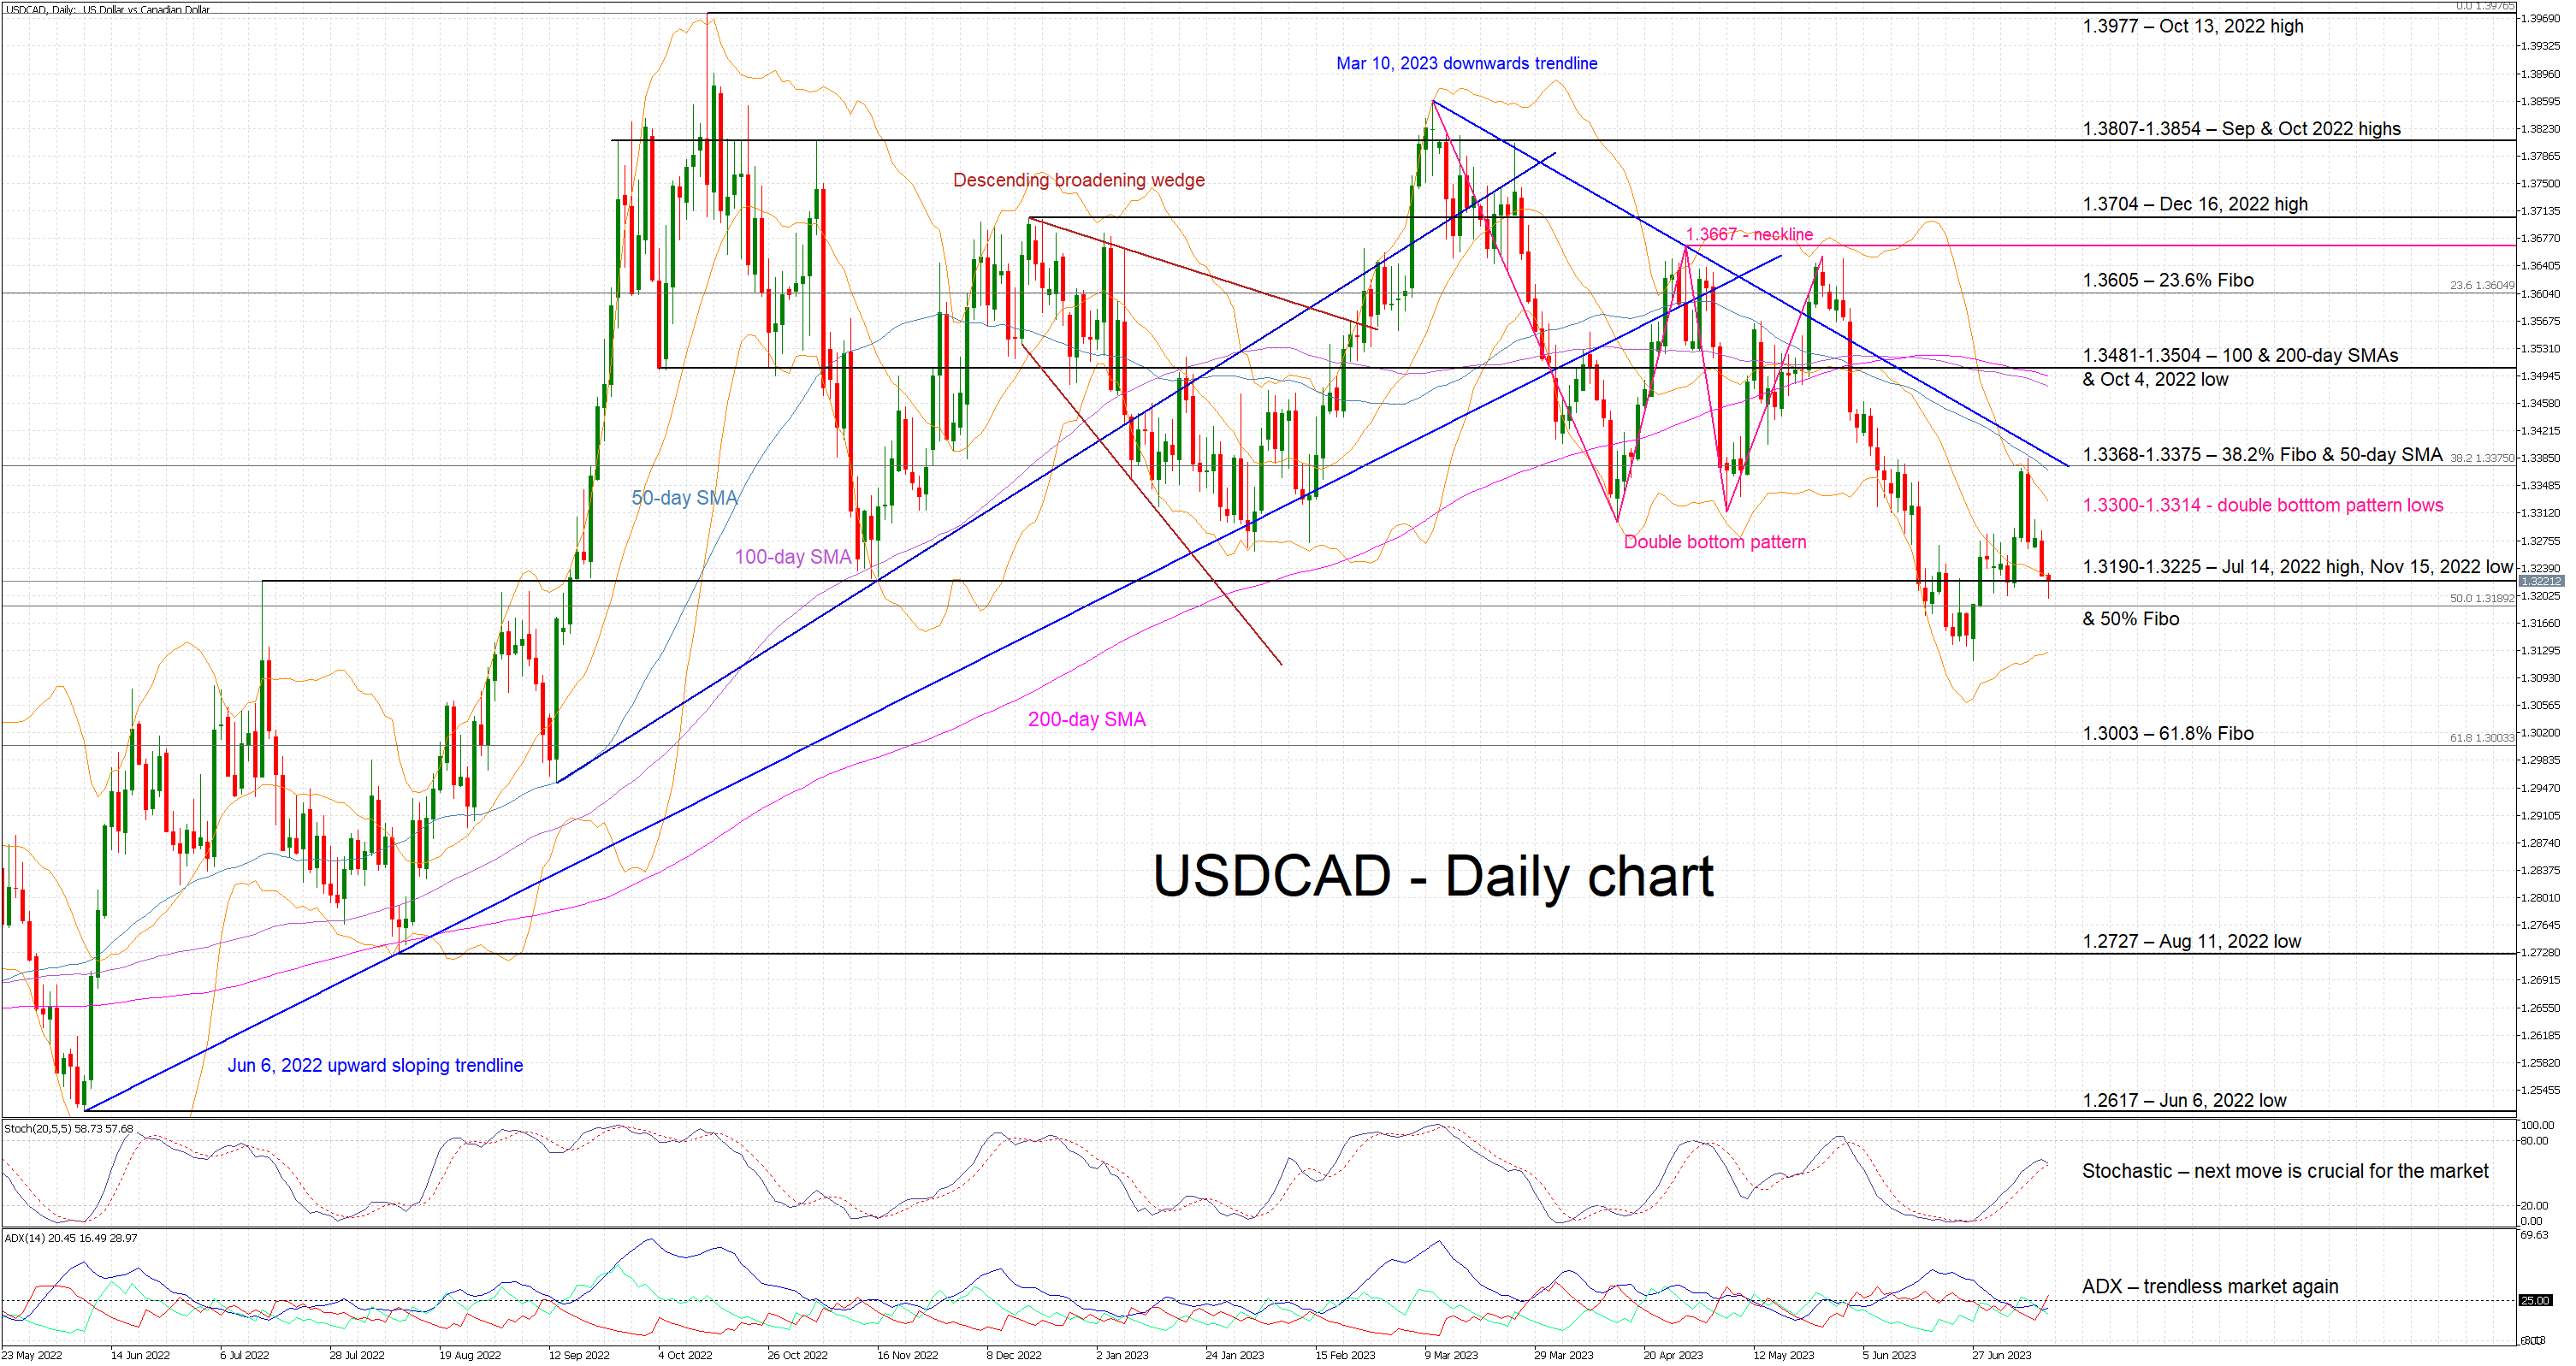
USDCAD’s recovery proved very short-lived as the pair has been dropping aggressively over the past four sessions. It is currently hovering inside the busy 1.3190-1.3225 area with the bears probably keen on continuing the recent series of lower highs and lower lows. The next trough has to occur below the 1.3116 low recorded on June 27 in order to keep this structure intact and valid.
The continued convergence of the 100- and 200-day simple moving averages (SMAs) supports the possibility of another sizeable move, but the bears have to look at the momentum indicators for clues on the direction of this next move. With the Average Directional Movement Index (ADX) not supporting the current downleg and still pointing to a range-trading market, the focus turns to the stochastic oscillator. This indicator is currently battling with its moving average (MA) and its next move will probably send a strong signal of the likely direction of the next leg in USDCAD.
If the stochastic manages to break below its MA, the bears would feel more confident in breaking the current 1.3190-1.3225 range that is defined by the July 14, 2022 high, the November 15, 2022 low and 50% Fibonacci retracement of the April 5, 2022 – October 13, 2022 uptrend respectively. The bears would then have the chance of recording a lower low, below the 1.3116 level, and then be able to target the 61.8% Fibonacci retracement at 1.3003.
Should the stochastic bounce higher, the bulls could try to stage another small upleg. The 1.3300-1.3314 range is unlikely to trouble them much but the same cannot be said for the busier 1.3368-1.3375 area. This is populated by the 38.2% Fibonacci retracement and the 50-day SMA, and proved too strong for the bulls at their July 7 attempt. If successful, the door will then be open for a retest of the key 1.3481-1.3504 range.
To sum up, USDCAD bears are keen on recording another lower low but their fate rests in the hands of the stochastic oscillator.
AUD/USD Technical: Bulls Rejected at 20 and 200-day Moving Averages ahead of US CPI
- Short-term momentum is likely to have turned negative as seen in the hourly RSI.
- Key short-term resistance stands at 0.6720.
- Intermediate supports to watch will be at 0.6630 and 0.6600/6580.
This is a follow-up analysis of our prior report, “AUD/USD Technical: Positive momentum ahead of RBA” published on 4 July 2023.
The price actions of the AUD/USD have staged the expected push-up and met the first resistance of 0.6720 as it printed a current intraday high of 0.6742 in today, 12 July Asian session.
Short-term elements are suggesting the risk of a short-term retreat as the release of the US CPI data looms later today at 1230 GMT.
Reintegrated below 20 and 200-day moving averages
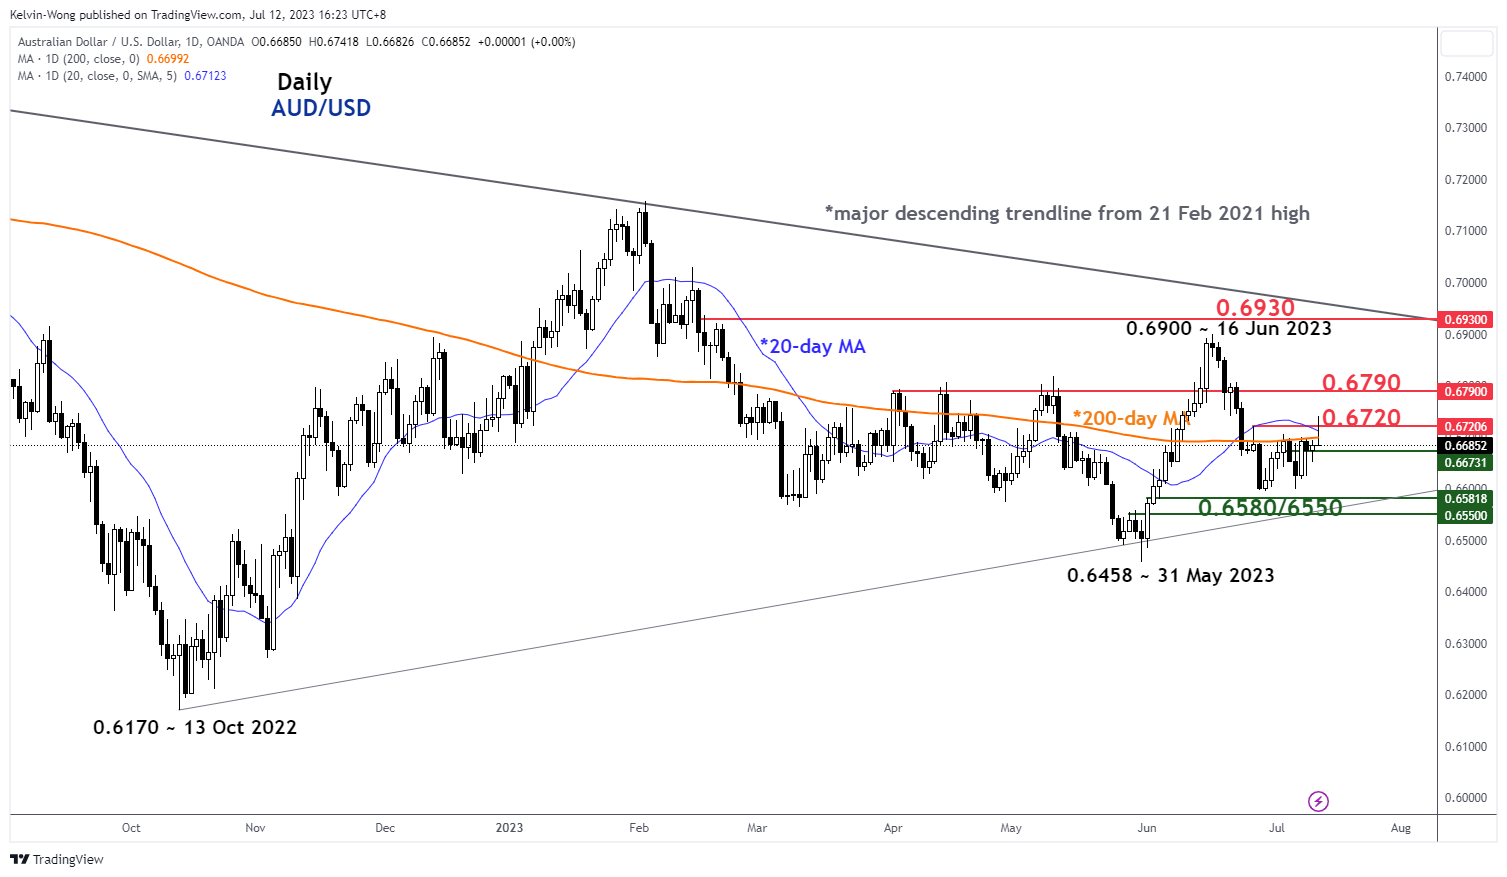
Fig 1: AUD/USD medium-term trend as of 12 Jul 2023 (Source: TradingView, click to enlarge chart)
The recent one and half week of rebound of +145 pips seen on the AUD/USD from its minor swing low of 29 June 2023 has stalled at the key 20 and 200-day moving averages which confluences with the 27 June 2023 swing high and the 38.2 % Fibonacci retracement of the prior minor decline from 16 June 2023 high of 0.6900 to 29 June 2023 low as well as the 1.236 Fibonacci extension of the rebound from 29 June 2023 low to 4 July 2023 high projected from 6 July 2023 low.
Short-term momentum has turned negative
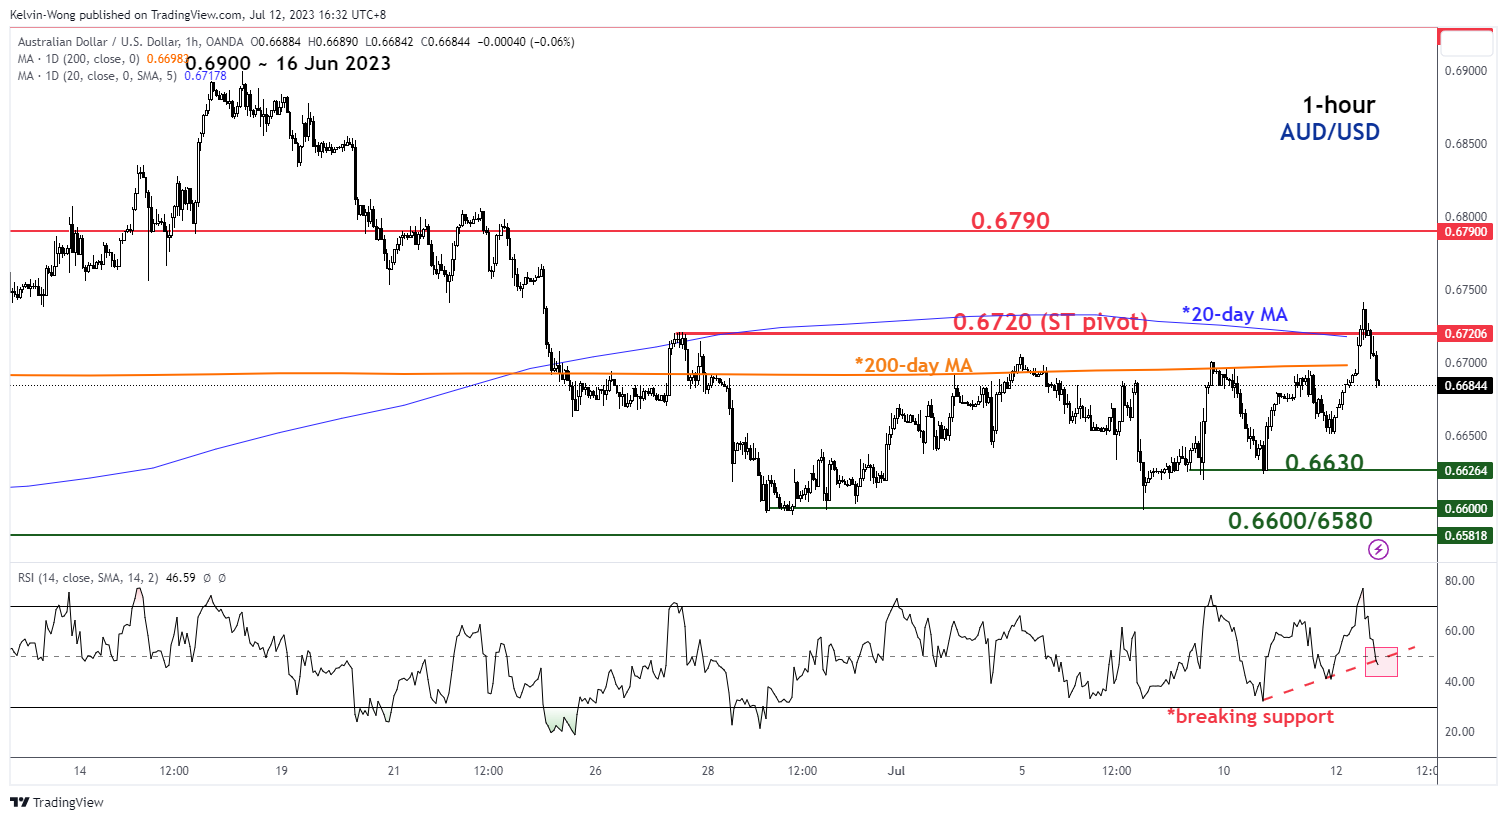
Fig 2: AUD/USD minor short-term trend as of 12 Jul 2023 (Source: TradingView, click to enlarge chart)
The hourly RSI oscillator has just exited its overbought region (above the 70 level) today and right now, it is attempting to break below its parallel ascending support at the 49 level which suggests that short-term momentum is likely to have turned negative.
Watch the 0.6720 key short-term pivotal resistance to maintain a bearish tone; a break below 0.6630 exposes the next support at 0.6600/6580.
However, a clearance above 0.6720 negates the short-term bearish tone to see the next resistance at 0.6790 (also, close to the 61.8% Fibonacci retracement of the prior minor decline from 16 June 2023 high of 0.6900 to 29 June 2023 low).
Bitcoin is Gaining Momentum
Market picture
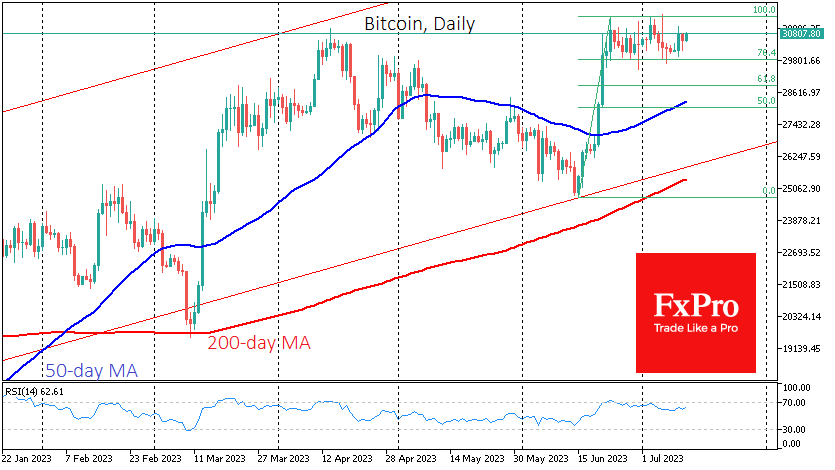
Crypto market capitalisation rose by 0.5% on the day, approaching 1.2 trillion. The trend of capitalisation growth has been in place since the beginning of the week. Although the bulls’ attempt to accelerate has failed to gain traction, the market is approaching these local highs again as of early Wednesday afternoon.
Bitcoin is up 0.6% at $30.8K and is approaching the upper boundary of its short-term range at $31.4K. Only a break above this level will indicate that the market is ready for further gains, with potential targets near $35.5K by the end of the month.
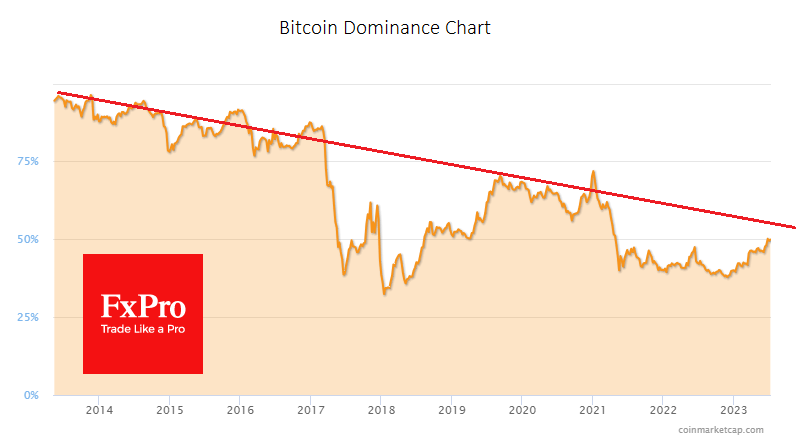
Bitcoin’s capitalisation is 50% of the total market and has been trending higher since the end of last year, coinciding with the turnaround in global equity indices. At the same time, it remains in a long-term downtrend, thanks to increasing competition from altcoins. However, increasing regulatory pressure poses a more significant threat to the latter.
The market is experiencing a period of “reaccumulation”, which often occurs when halving is imminent, Glassnode notes. Previous such periods have resulted in several months of sideways trading. The Network Value to Transactions Ratio (NVT Ratio) indicator, based on 28 DMAs, suggests a “fair value” for Bitcoin of $35,900, above current prices for the first time since November 2022.
Spot trading volumes on centralised exchanges increased by 10.4% in June, while cryptocurrency futures trading volumes rose by 9.5%.
News background
According to K33 Research, employment in the cryptocurrency sector fell by 10% last year, from 210,000 to 190,000. The industry has around 10,000 companies with a total value of about $180 billion.
Bank of England Governor Andrew Bailey said that Bitcoin and other cryptocurrencies do not meet the standards of money. He said they are better classified as “highly speculative investments”.
The UK’s Financial Conduct Authority (FCA) has shut down 26 crypto ATMs in various cities nationwide for illegally offering cryptocurrencies. The regulator also warned consumers of these services that they could lose their money.
After the BRICS countries launch a gold-backed cryptocurrency in August, the US dollar will “die”, and bitcoin will rise to $120,000 in 2024, warned Robert Kiyosaki. He once again urged people to buy gold, silver, and bitcoin.
New Zealand Dollar Pares Gains as RBNZ Holds Rates
- New Zealand’s central bank takes a pause after 12 consecutive hikes
- New Zealand Manufacturing PMI expected to show manufacturing is stalled
- US inflation expected to decline to 3.1%
The New Zealand dollar showed some gains after the Reserve Bank of New Zealand paused rates, but has given up most of those gains. In the European session, NZD/USD is trading at 0.6206, up 0.14%.
RBNZ takes a breather
There was no dramatic surprise from the RBNZ, which kept interest rates on hold at Wednesday’s meeting, as expected. The central bank has been aggressive, raising rates 12 straight times since August 2021 until Wednesday’s meeting. This leaves the cash rate at 5.50%.
The RBNZ had signalled that it would take a break, with Deputy Governor Hawkesby stating last month that there would be a “high bar” for the RBNZ to continue raising rates. Today’s rate statement said that interest rates were constraining inflation “as anticipated and required”, adding that “the Committee is confident that with interest rates remaining at a restrictive level for some time, consumer price inflation will return to within its target range.” The RBNZ did not issue any updated forecasts or a press conference with Governor Orr, which might have resulted in some volatility from the New Zealand dollar.
The central bank has tightened rates by some 525 basis points, which has dampened the economy and chilled consumer spending. Is this current rate-tightening cycle done? The central bank would like to think so, but that will depend to a large extent on whether inflation continues to move lower toward the Bank’s inflation target of 1-3%.
The pause will provide policymakers with some time to monitor the direction of the economy and particularly inflation. If inflation proves to be more persistent than expected, there’s every reason to expect the aggressive RBNZ to deliver another rate hike later in the year.
New Zealand releases Manufacturing PMI for June on Wednesday after the rate decision. The manufacturing sector has contracted for three straight months, with readings below the 50.0 line, which separates contraction from expansion. The PMI is expected to rise from 48.9 to 49.8, which would point to almost no change in manufacturing activity.
The US will release the June inflation report later in the day. Headline inflation is expected to fall from 4.0% to 3.1%, but core CPI is expected to rise to 5.3%, up from 5.0%. If core CPI does accelerate, that could raise market expectations for a September rate hike. A rate increase is all but a given at the July 27th meeting, with the probability of a rate hike at 92%, according to the CME FedWatch tool.
NZD/USD Technical
- 0.6184 is a weak support level. Below, there is support at 0.6148
- 0.6260 and 0.6383 are the next resistance lines
Risk Assets Hope for Slowing Inflation
Today’s US inflation data release is set to heavily influence the outlook on future Fed rate hikes. As things stand, a July hike is all but priced in, though Fed Funds futures expect just about a one-in-three chance of an additional hike for the rest of the year.
Markets are anticipating further evidence of softening inflationary pressures, with a slowdown in both the headline CPI as well as the core year-on-year prints, down to 3.1% and 5% respectively.
Should the CPI numbers come in below market expectations, that could cut the Fed some slack in this rate-hike cycle. Such a narrative may bolster risk assets, while heaping more downward pressure on the US dollar that’s wilting as markets doubt whether the FOMC’s two projected hikes will indeed materialise.
However, should US inflation remain stubbornly elevated, that should embolden the FOMC hawks while prompting markets to ramp up bets for that post-July rate hike. Such repricing should offer some relief for dollar bulls while prompting the likes of gold and oil to pare recent gains.
GBP/JPY Daily Outlook
Daily Pivots: (S1) 180.88; (P) 181.44; (R1) 182.07; More...
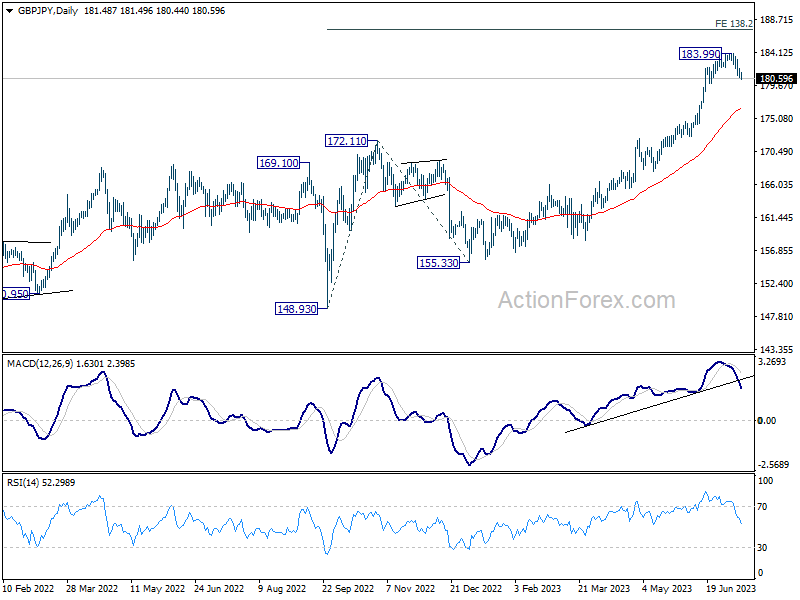
Intraday bias in GBP/JPY remains on the downside as fall from 183.99 short term top is in progress for 179.90. Firm break there will target 55 D EMA (now at 176.39). On the upside, above 182.00 minor resistance will turn intraday bias neutral first.
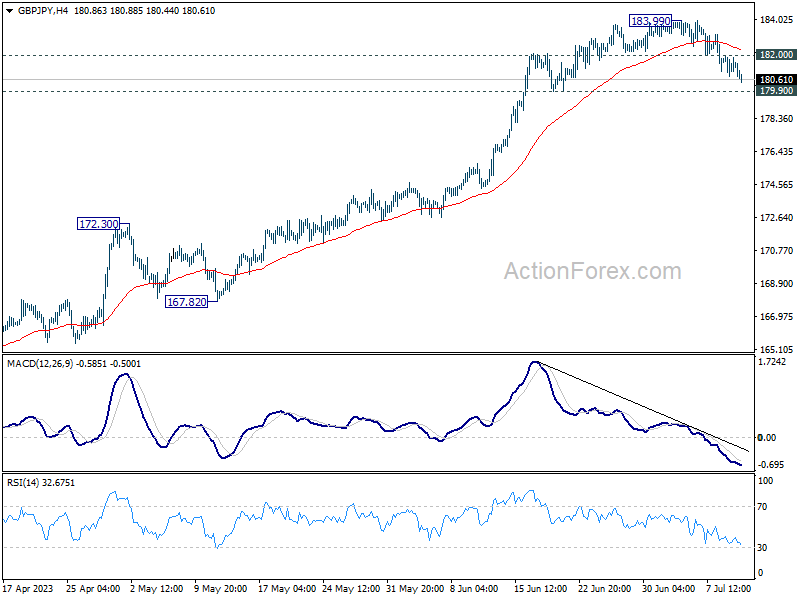
In the bigger picture, as long as 172.11 resistance turned support holds, uptrend from 123.94 (2020 low) is expected to continue. On resumption, next target is 195.86 (2015 high). Nevertheless, firm break of 172.11 will argue that larger correction is already underway.
EUR/JPY Daily Outlook
Daily Pivots: (S1) 153.90; (P) 154.79; (R1) 155.39; More....
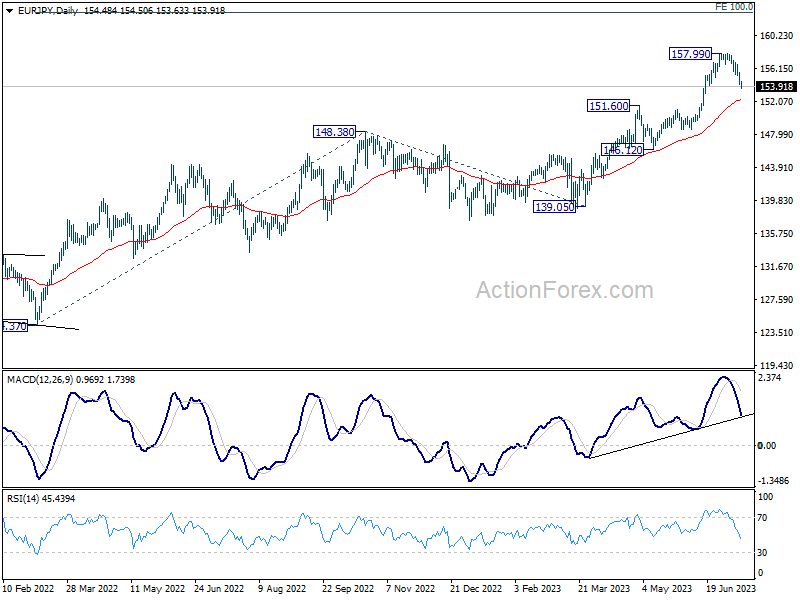
EUR/JPY's fall from 157.99 is in progress and intraday bias remains on the downside. Sustained trading below 154.03 support will argue that it's at least correcting the whole rise from 139.05. Deeper fall would be seen to 55 D EMA (now at 152.28). On the upside, above 155.66 minor resistance will turn intraday bias neutral and bring consolidations first.
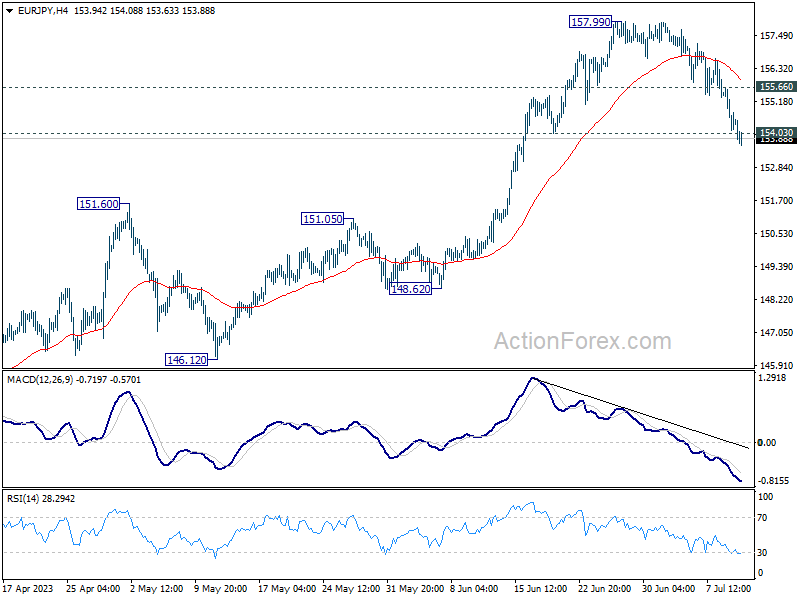
In the bigger picture, as long as 151.60 resistance turned support holds, rise from 114.42 (2020 low) is in progress. On resumption, next target is 100% projection of 124.37 to 148.38 from 138.81 at 162.82. Nevertheless, sustained break of 151.60 will argue that larger correction is already underway.
EUR/GBP Daily Outlook
Daily Pivots: (S1) 0.8491; (P) 0.8526; (R1) 0.8548; More...
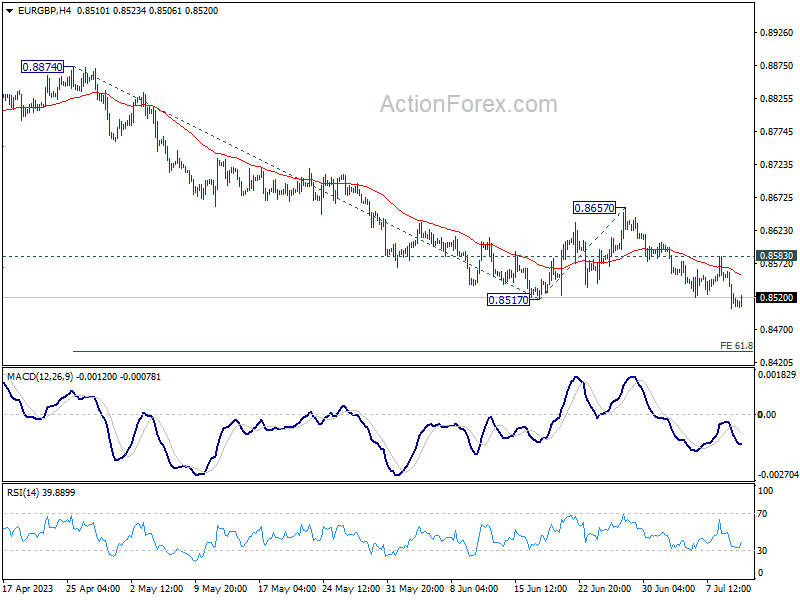
Intraday bias in EUR/GBP remains on the downside for the moment. Current decline from 0.8977 is in progress for 61.8% projection of 0.8874 to 0.8517 from 0.8650 at 0.8436. On the upside, above 0.8583 minor resistance will turn intraday bias neutral first. But near term outlook will remain bearish as long as 0.8657 resistance holds, in case of recovery.
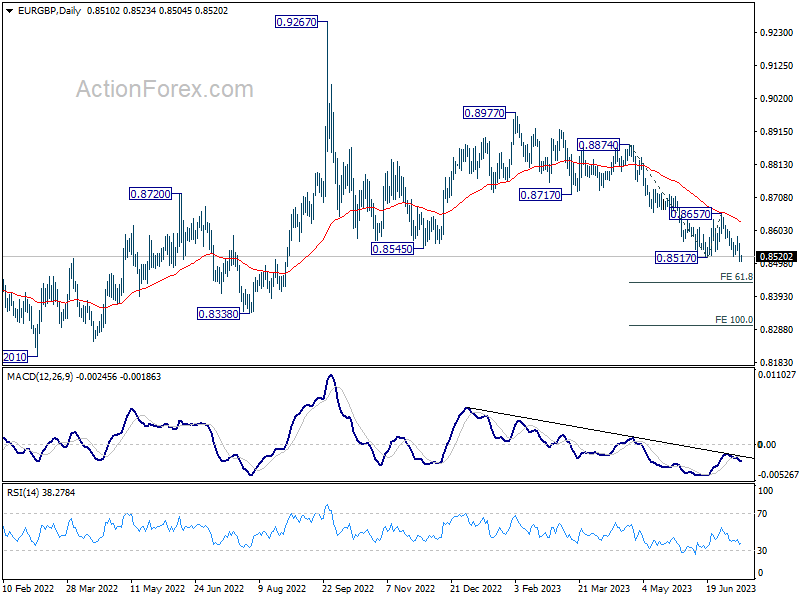
In the bigger picture, the down trend from 0.9267 (2022 high) is still in progress. It's seen as part of the long term range pattern from 0.9499 (2020 high). Deeper fall could be seen towards 0.8201 (2022 low). But strong support should be seen from there to bring reversal. This will now remain the favored case as long as 0.8657 resistance holds.
EUR/AUD Daily Outlook
Daily Pivots: (S1) 1.6436; (P) 1.6479; (R1) 1.6508; More...
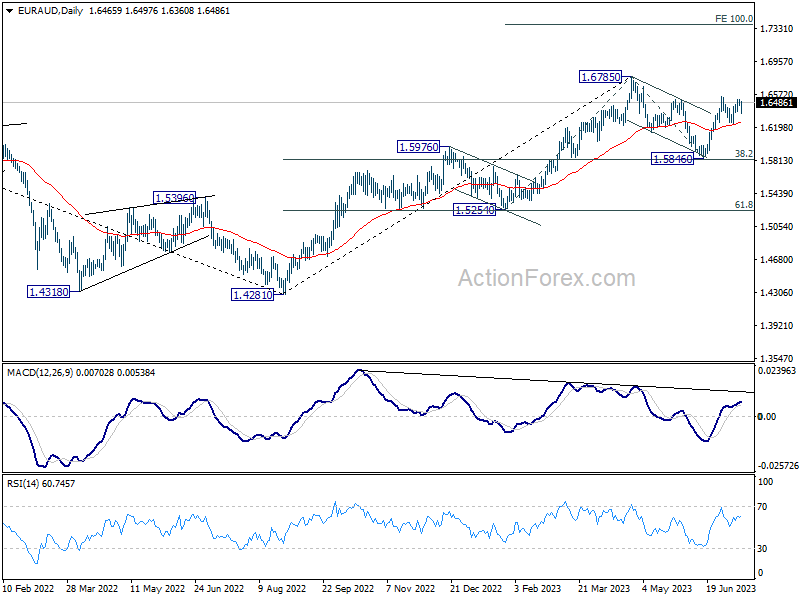
Intraday bias in EUR/AUD remains neutral at this point. With 1.6247 support intact, further rally is expected. As noted before, correction from 1.6785 should have completed with three waves down to 1.5846. Above 1.6552 will target a retest on 1.6785 high next. Nevertheless, on the downside, firm break of 1.6247 will dampen this view and turn bias to the downside for 1.5846 support.
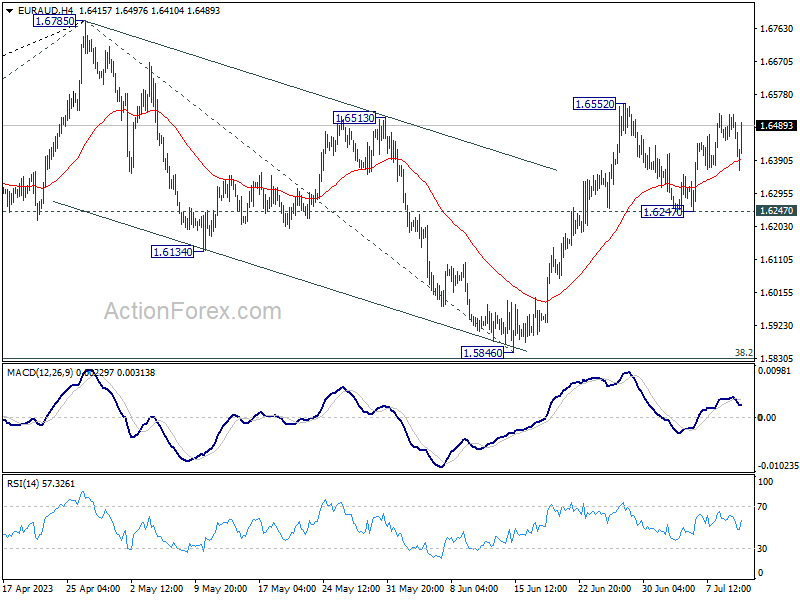
In the bigger picture, with 38.2% retracement of 1.4281 to 1.6785 at 1.5828 intact, rally from 1.4281 is still in progress. Firm break of 1.6785 will confirm rise resumption. Next target is 100% projection of 1.5254 to 1.6785 from 1.5846 at 1.7377. On the other hand, rejection by 1.6785 will extend the corrective pattern with another fall leg. But outlook will stay bullish as long as 1.5828 holds.