Sample Category Title
EUR/CHF Daily Outlook
Daily Pivots: (S1) 0.9651; (P) 0.9708; (R1) 0.9740; More...
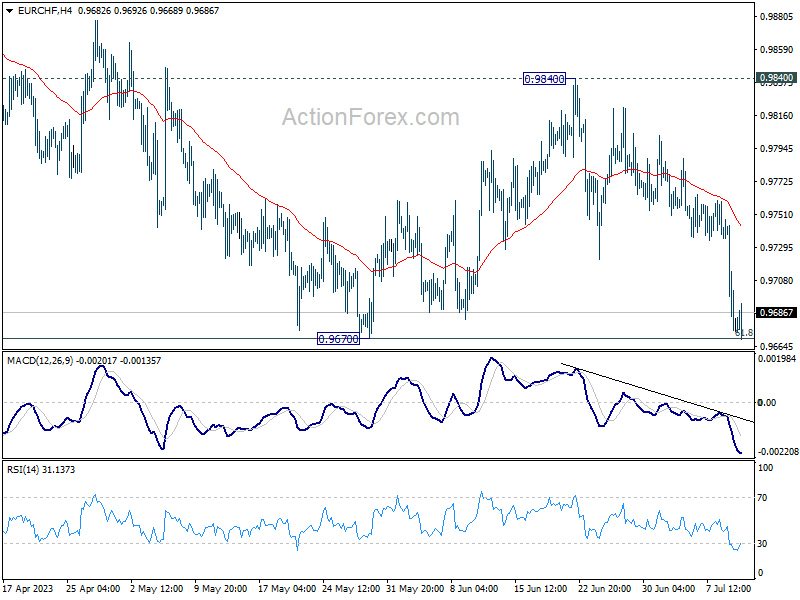
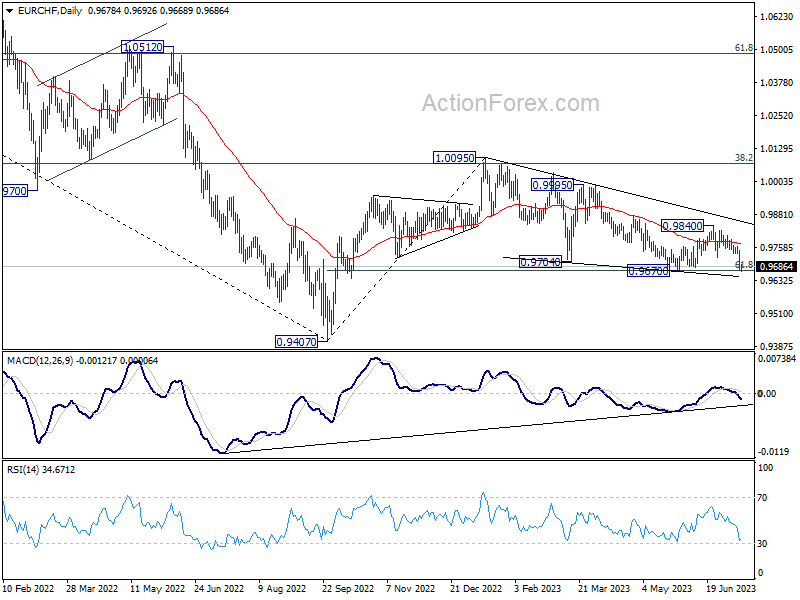
Intraday bias in EUR/CHF stays neutral this point. Firm break of 0.9670 support will resume the whole decline from 1.0095. Deep fall would be seen towards 0.9407 low. Nevertheless, on the upside, break of 0.9840 will argue that choppy decline from 1.0095 has completed, and bring stronger rally.
In the bigger picture, medium term outlook is staying bearish as the pair is capped below falling 55 W EMA (now at 0.9913). Down trend form 1.2004 (2018 high) is in favor to extend through 0.9407 at a later stage. Nevertheless, decisive break of 38.2% retracement of 1.1149 to 0.9407 will raise the chance of bullish trend reversal.
EUR/USD Smashes Resistance While USD/JPY Nosedives
EUR/USD started a fresh increase above the 1.0975 resistance. USD/JPY is declining and showing bearish signs below the 141.20 level.
Important Takeaways for EUR/USD and USD/JPY Analysis Today
- The Euro is rising and trading well above the 1.1020 resistance zone.
- There is a key bullish trend line forming with support near 1.1020 on the hourly chart of EUR/USD at FXOpen.
- USD/JPY is trading in a bearish zone below the 141.20 and 140.20 levels.
- There is a major bearish trend line forming with resistance near 140.20 on the hourly chart at FXOpen.
EUR/USD Technical Analysis
On the hourly chart of EUR/USD at FXOpen, the pair started a fresh increase from the 1.0835 zone. The Euro climbed above the 1.0900 resistance zone against the US Dollar.
The pair even settled above the 1.0975 resistance and the 50-hour simple moving average. There was an upside break above the 76.4% Fib retracement level of the downside correction from the 1.1026 swing high to the 1.0977 low.
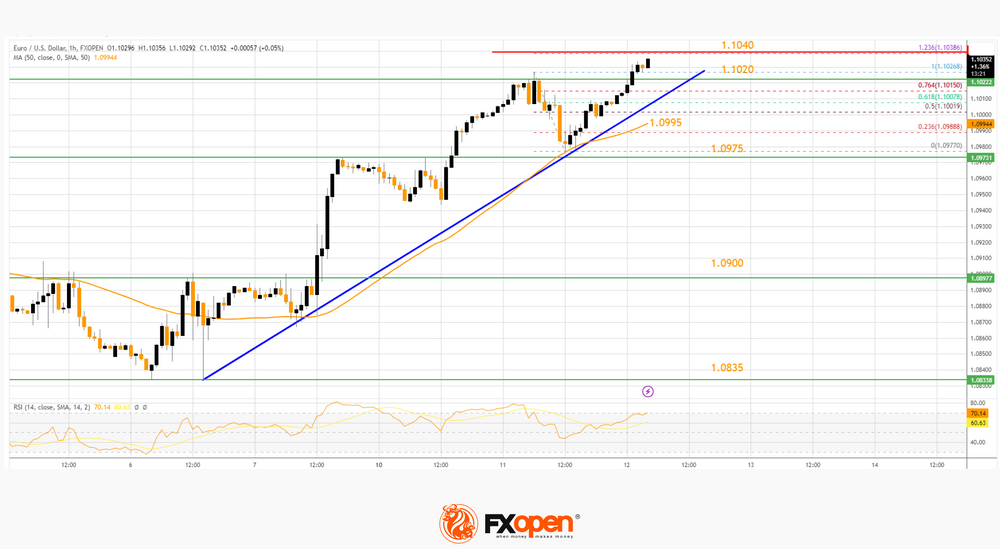
The pair is now consolidating gains below the 1.1040 resistance. The first major support is near a key bullish trend line at 1.1020.
The next key support is near the 50-hour simple moving average at 1.0995. If there is a downside break below 1.0995, the pair could drop toward the 1.0975 support. The main support on the EUR/USD chart is near 1.0900, below which the pair could start a major decline.
On the upside, the pair is now facing resistance near the 1.236 Fib extension level of the downside correction from the 1.1026 swing high to the 1.0977 low at 1.1040.
The next major resistance is near the 1.1065 level. An upside break above 1.1065 could set the pace for another increase. In the stated case, the pair might rise toward 1.1120.
USD/JPY Technical Analysis
On the hourly chart of USD/JPY at FXOpen, the pair started a strong decline well above the 143.50 zone. The US Dollar gained bearish momentum below the 142.15 support against the Japanese Yen.
The pair even settled below the 141.20 level and the 50-hour simple moving average. Finally, it broke the 140.00 pivot level. A low is formed near 139.38 and the pair is now showing a lot of bearish signs. Immediate resistance on the USD/JPY chart is near a bearish trend line at 140.20.
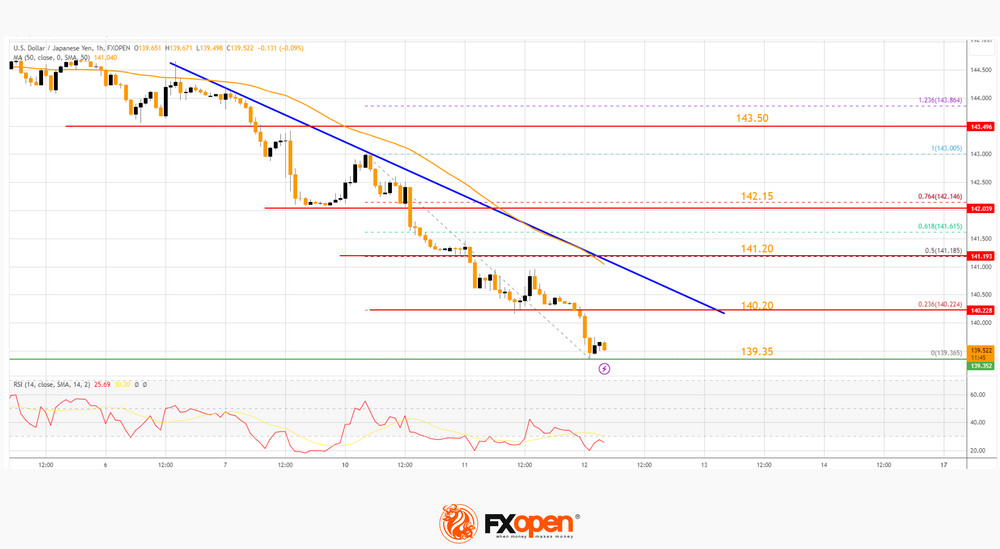
The 23.6% Fib retracement level of the downward move from the 143.00 swing high to the 139.38 low is also near 140.20. The first major resistance is near the 50-hour simple moving average at 141.20.
If there is a close above the 141.20 level and RSI moves above 50, the pair could rise toward the 76.4% Fib retracement level of the downward move from the 143.00 swing high to the 139.38 low at 142.15. The next major resistance is near 143.50, above which the pair could test 144.00 in the coming days.
On the downside, the first major support is near 139.35. The next major support is near the 139.00 level. If there is a close below 139.00, the pair could decline steadily. In the stated case, the pair might drop toward the 137.50 support.
Standard Chartered Predicts Bitcoin at $120k
The value of the largest cryptocurrency could reach USD 50,000 this year and USD 120,000 by the end of 2024, according to analysts at Standard Chartered, Reuters reports.
Note that earlier, bank analysts predicted that the cost of BTC at the end of 2024 would be USD 100,000, but now they have increased their forecast for the price of bitcoin by 20%, based on the assumption of a change in the behavior of miners that can limit the supply of bitcoins as its price rises.
Time will tell how true the bitcoin price forecast for 2024 from Standard Chartered will be, but on the BTC/USD chart today there is an argument in favor of the fact that the forecast can be realized. This is the nature of price action around the USD 30k psychological level.
Compare 2 periods when the price of bitcoin exceeded USD 30k.
In April, the price met strong resistance only USD 500 higher, and a week after the breakdown of USD 30k, it rushed down.
And now is the second period, which began on June 21 and continues to last. The level of immediate resistance above the psychological level is already higher — at around 31k, and the price of bitcoin has not fallen (except for short-term punctures) below USD 30k for almost 3 weeks.
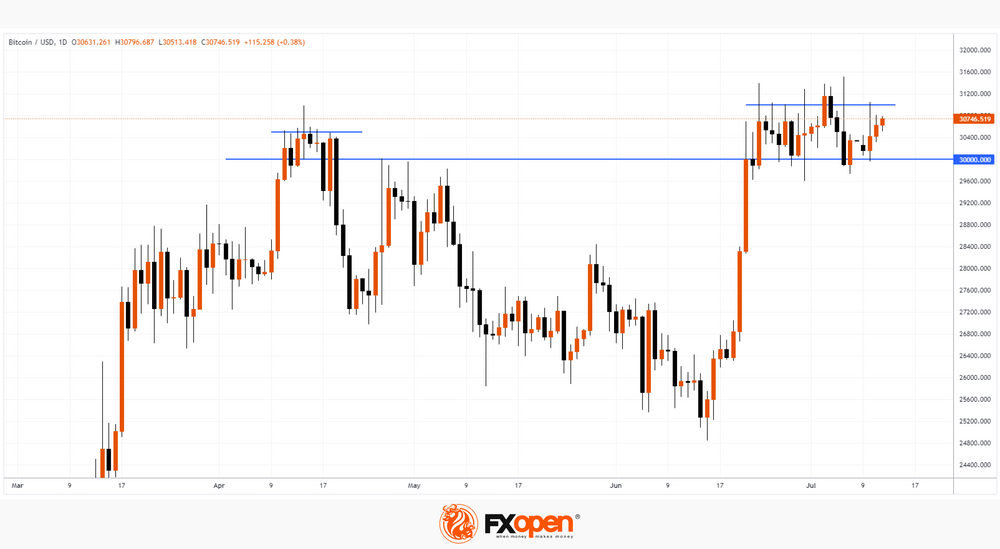
The comparison shows that the bulls are getting more of an edge at the USD 30k level, in other words, the market is shifting in favor of demand forces. And this is optimistic for Standard Chartered's USD 120k bitcoin price prediction.
Caution Ahead of US Inflation Release, RBNZ May Be Done With Hikes
Stock markets are tentatively higher on Wednesday as traders adopt a cautious position ahead of the US inflation report.
Any hopes of another pause from the Fed this month have dwindled in recent weeks as the data simply hasn't delivered what it needed to in order to convince the FOMC to do so for a second consecutive meeting. A second pause would be taken as a sign that the tightening cycle is over so it's not a decision that would be taken lightly.
The jobs report on Friday was nowhere near good enough to convince the Fed that it has achieved its objectives. There will no doubt have been relief that the NFP number didn't replicate that of the ADP but together with the wage component, it still pointed to a labour market that is very tight.
It would take something remarkable from the inflation report today to convince policymakers that they can afford to pause again. The headline CPI falling to 3.1% doesn't fall into that category when the core number is expected to remain high at 5%. It would take a real shock on the core side to really stimulate the debate in two weeks.
RBNZ may be done with its tightening cycle
The RBNZ opted to pause its tightening cycle earlier today after a very aggressive tightening cycle over the last couple of years. After increasing the cash rate to 5.5%, there are signs that the economy is slowing which will bring inflation down. While inflation has only fallen to 6.7% so far, data next week is expected to show it falling further and the central bank is confident it will return to its 1-3% target range next year.
New Zealand faced many challenges in the aftermath of the pandemic which contributed to surging inflation but much higher rates and levels of immigration appear to be easing those pressures.
Could US CPI trigger a major breakout in Gold?
Gold is edging higher again today but there is clearly an element of caution in the move. Perhaps traders are hopeful of a favourable CPI figure from the US but they're clearly not that confident with the price remaining below $1,940 where it has repeatedly run into resistance.
A break above here today could be a bullish signal, although there remain many more obstacles ahead including $1,960, $1,980 and $2,000 before traders will feel confident that the yellow metal is back. A stronger inflation report could push it back towards $1,900 which has held as support until now, mostly. A break of this could be a very bearish development.
GBP/USD Technical Analysis
On the hourly chart of GBP/USD at FXOpen, the pair started a decent increase above the 1.2850 resistance. The British Pound even cleared the 1.2900 barrier against the US Dollar.
The pair is now trading above the 1.2930 level and the 50-hour simple moving average. On the upside, the first major resistance is near 1.2965. If there is a clear upside break above the 1.2965 resistance, the pair could rise toward the 1.3000 level in the near term.
The next key resistance sits near the 1.3040 level, above which the GBP/USD pair might gain bullish momentum and revisit the 1.3200 zone.
On the downside, the first major support is near a connecting bullish trend line at 1.2930. The main support is forming near the 1.2850 level, below which the pair might move lower toward the 1.2760 support.
USD/CAD Daily Outlook
Daily Pivots: (S1) 1.3209; (P) 1.3253; (R1) 1.3274; More....
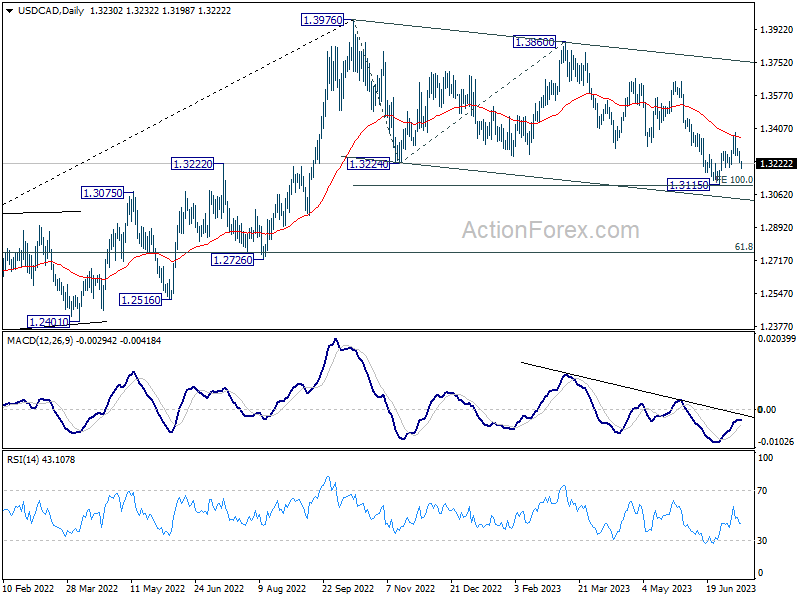
Intraday bias in USD/CAD stays neutral at this point as it's recovering after hitting 1.3202 support. On the upside, break of 1.3386 and sustained trading above 55 D EMA (now at 1.3358) will argue that whole corrective pattern from 1.3976 has completed with three waves down to 1.3115. Further rally should then be seen to 1.3653 resistance next. Nevertheless, firm break of 1.3202 support will bring retest of 1.3115 low instead.
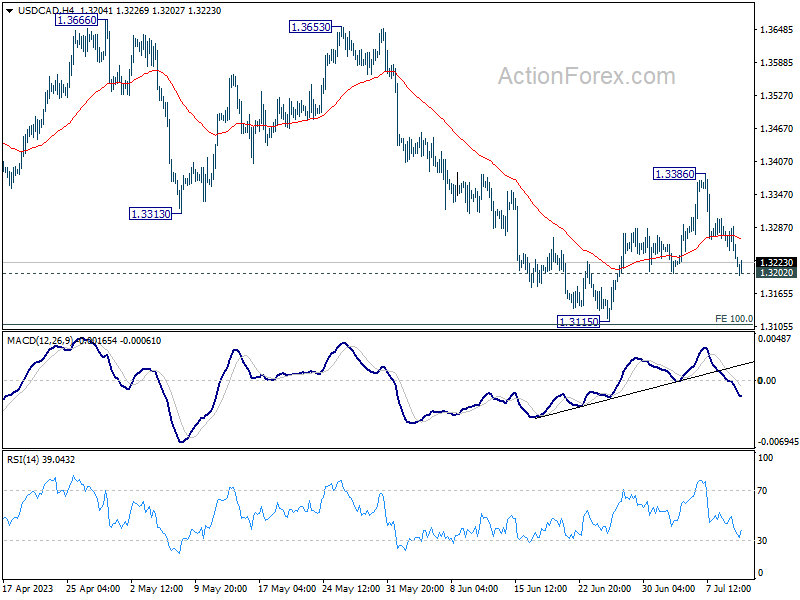
In the bigger picture, price actions from 1.3976 are viewed as a correction to up trend from 1.2005 (2021 low) only. Hence, the up trend is in favor to resume through 1.3976 at a later stage. Nevertheless, another fall below 1.3115 will extending the decline from 1.3976 to 61.8% retracement of 1.2005 to 1.3976 at 1.2758, and raise the chance of bearish trend reversal.
AUD/USD Daily Report
Daily Pivots: (S1) 0.6660; (P) 0.6677; (R1) 0.6704; More...
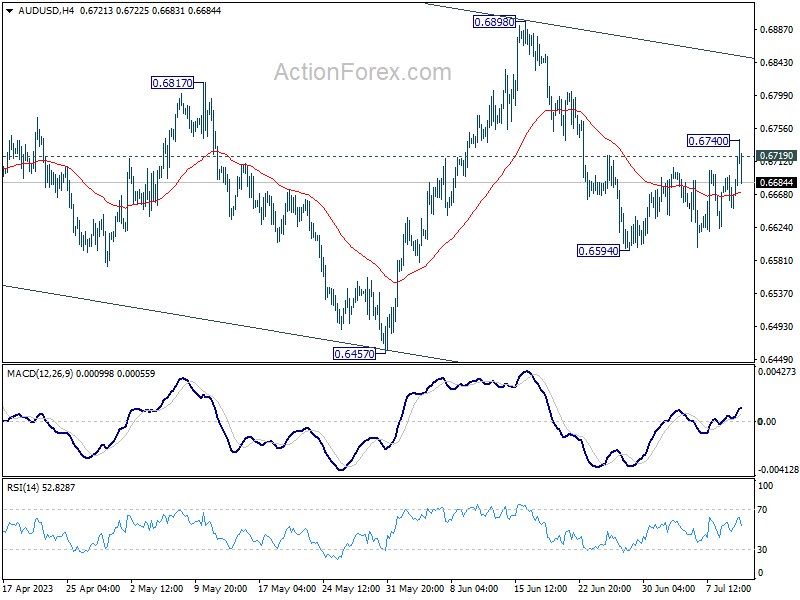
AUD/USD edged higher to 0.6740 but quickly retreated. Intraday bias remains neutral first. On the downside, break of 0.6594 will resume the decline from 0.6898 to 0.6457 support next. Nevertheless, firm break of 0.6740 resistance will turn bias back to the upside for stronger rebound.
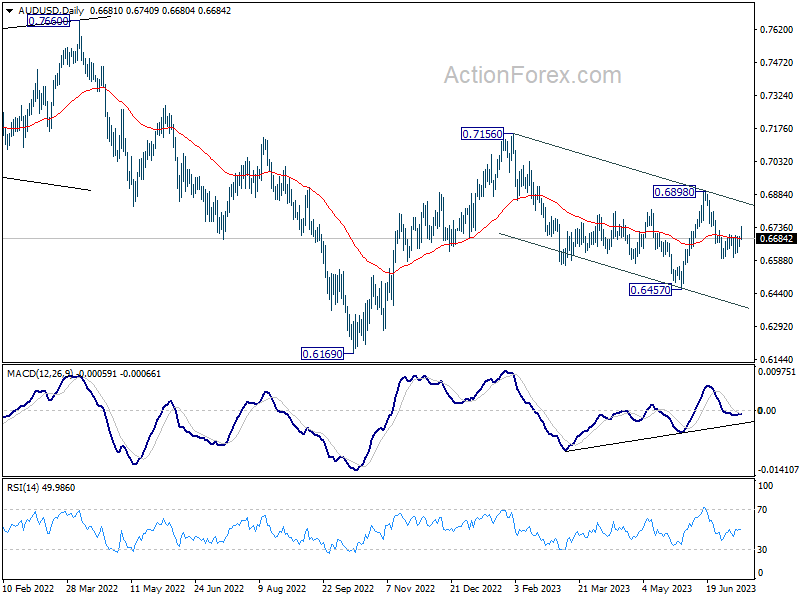
In the bigger picture, price actions from 0.7156 are seen as a correction to the rebound from 0.6169 only, rather than part of larger down trend from 0.8006 (2021 high). Break of 0.6457 could cannot be ruled out but downside should be contained above 0.6169. Meanwhile, nevertheless, break of 0.6898 resistance will argue that rise from 0.6169 is ready to resume through 0.7156.
USD/JPY Daily Outlook
Daily Pivots: (S1) 139.86; (P) 140.66; (R1) 141.16; More...
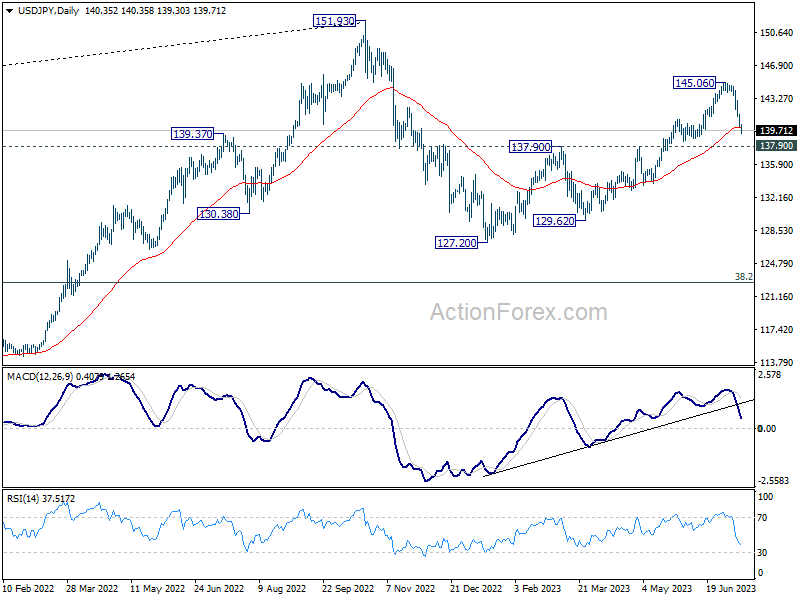
USD/JPY's fall from 145.06 is in progress today and intraday bias stays on the downside for 137.90 resistance turned support. Decisive break there will confirm the larger bearish case. On the upside, above 142.06 minor resistance will turn intraday bias neutral and bring consolidations first, before staging another fall.
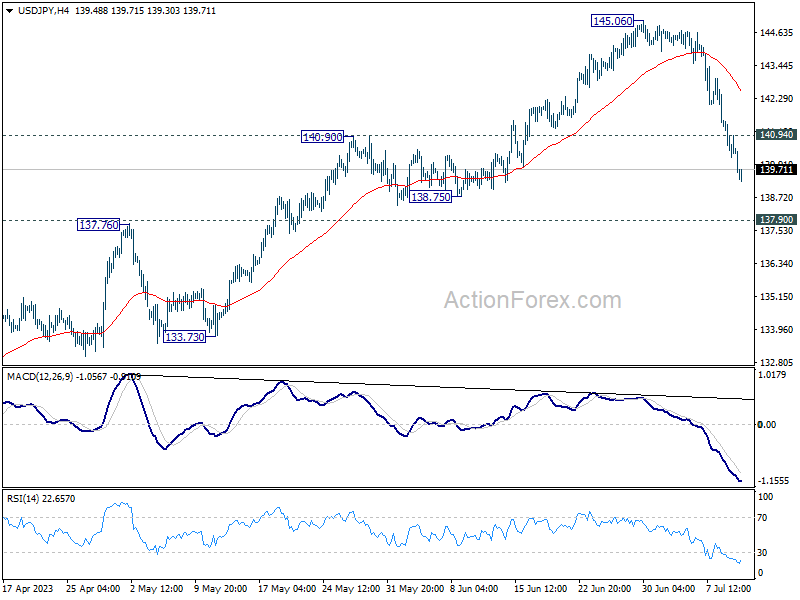
In the bigger picture, current downside acceleration, as seen in daily MACD, argues that fall from 145.06 is already the third leg of the corrective pattern from 151.93 (2022 high). Sustained break of 137.90 resistance turned support should confirm this case and target 127.20 (2023 low) and below. For now, this will remain the favored case as long as 145.06 resistance holds.
USD/CHF Daily Outlook
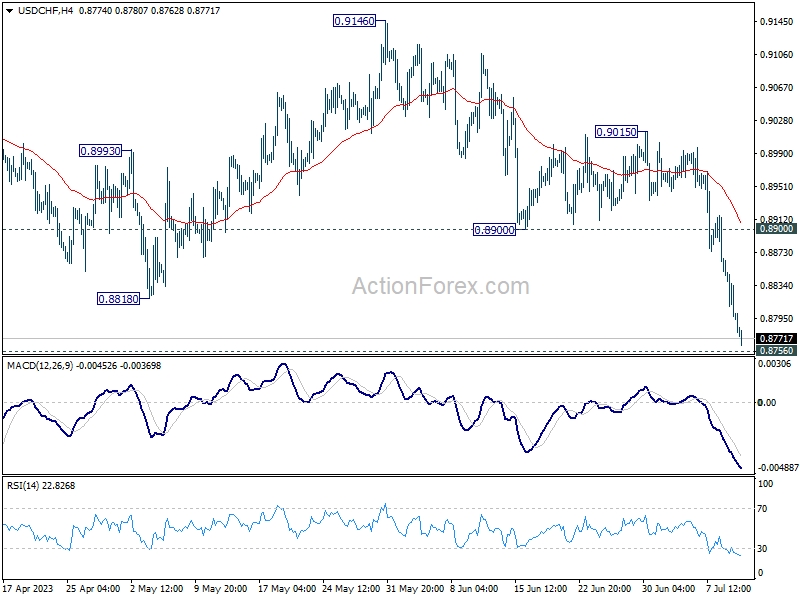
Daily Pivots: (S1) 0.8766; (P) 0.8822; (R1) 0.8851; More...
While further decline could be seen in USD/CHF, strong support is expected from 0.8756 to contain downside. On the upside, break of 0.8900 support turned resistance will turn intraday bias back to the upside for rebound. However, decisive break of 0.8756 will carry larger bearish implication.
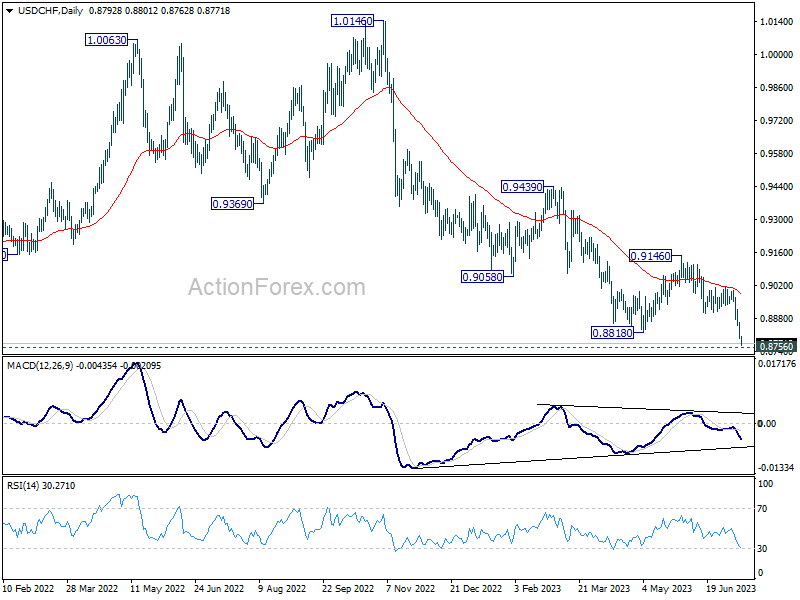
In the bigger picture, fall from 1.1046 (2022 high) is seen as a leg in the long term range pattern from 1.0342 (2016 high). While further decline cannot be ruled out, strong support is expected from 0.8756 long term support to bring reversal. Firm break of 0.9146 resistance should confirm medium term bottoming.
EUR/USD Daily Outlook
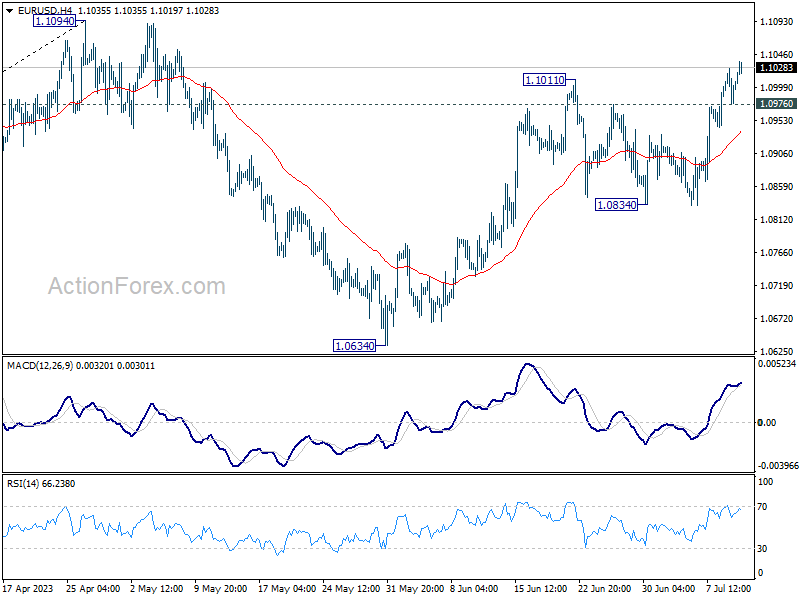
Daily Pivots: (S1) 1.0981; (P) 1.1004; (R1) 1.1031; More...
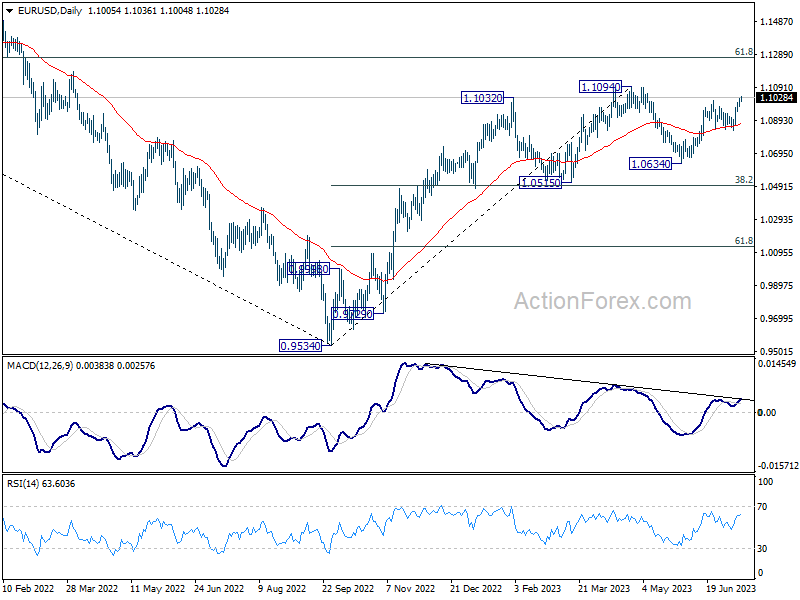
EUR/USD's rally continues today and intraday bias stays on the upside. Current rally from 1.0634 is on track to retest 1.1094 high. Decisive break there will resume larger up trend from 0.9534 to 1.1273 fibonacci level. On the downside, below 1.0976 minor support will turn intraday bias neutral first. But further rally will remain in favor as long as 1.0834 support holds.
In the bigger picture, as long as 1.0515 support holds, rise from 0.9534 (2022 low) would still extend higher. Sustained break of 61.8% retracement of 1.2348 (2021 high) to 0.9534 at 1.1273 will solidify the case of bullish trend reversal and target 1.2348 resistance next (2021 high).