

Sample Category Title
Core Inflation Over Time Will Justify Higher for Longer Paradigm
Markets
The up-move in US yields took a breather this week. Friday’s slightly softer than expected payrolls probably don’t change the Fed’s assessment on further tightening. However, with key resistance ahead (5.10% area 2-y; 4.09% area 10-y yield) it was time for bond shorters to reduce positions. On Monday, the NY Fed Survey on consumer expectations indicated that short term inflation expectations continued to fall 3.8% in June (from 4.1%). This might have accelerated the correction in yields going into today’s US June CPI release. US yields yesterday again ceded between 0.6 bps (5-y) and 2.5 bps (30-y). At the same time, European yields didn’t follow the setback in the US. German yields added between 0.9 bps (10-y) and 2.7 bps (2-y). At 3.32%, the German 2-y yield is closing in on the March top (3.38%). The 10-y yield is holding in the 2.65% area. The softening in US yields this time again supported a return higher in US and European equities. The S&P 500 and the Eurostoxx 50 gained about 0.7%. Brent oil ($79.5 p/b) cleared the $78 resistance, but for now this apparently isn’t a huge source of concern for (global) markets. On FX markets, the dollar continued to fight an uphill battle. This loss of momentum partially can be explained from softer US yields and a better risk sentiment post-payrolls . However, the US currency last week also failed to profit from a set of strong US eco data. EUR/USD closed at 1.101, nearing the June 22 top, the last hurdle for a retest of the 1.1095 YTD top. DXY yesterday closed at 101.73 to be compared with a ST top at 103.57 touched last week. The yen is also building an impressive comeback (USD/JPYU close 140.36, EUR/JPY 154.18). Sterling yesterday profited from a solid UK labour market report. The unemployment rate rose from 3.8% tot 4.0% and the June payrolls growth slightly disappointed. However, the 3M job growth to May (102 k) and especially higher than expected wage growth (7.3% Y/Y ex-bonus) is keeping pressure on the BoE to act decisively. The UK 2-y yield (5.42%, +5.6 bps) is holding near the cycle peak. Sterling fully profited with EUR/GBP (close 0.8512) at risk of sustainably breaking the 0.8518 YTD low.
This morning, Asian equities are trading mixed. The dollar stays in the defensive (DXY 101.42, EUR/USD 1.103). The yen continues its outperformance (USD/JPY 139.5). Later today, the Bank of Canada policy decision (25 bps hike to 5.0% expected) and the Fed Beige Book are interesting, but the market focus is on the US June CPI. Headline inflation is expected to decline from 4.0% to 3.1%. Core might ease to 5.0% from 5.3%. Despite the Fed recently indicating a likely further tightening, the ST market dynamics apparently hopes that a softer figure might reopen the debate on the amount of Fed tightening. We hold to the view that core inflation over time with justify the higher for longer paradigm. However, a softer than expected June figure still might extended the post-payrolls dynamics (‘technical correction’) in US yields in the dollar. The EUR/USD 1.1095 top might come on the horizon.
News and views
The Reserve Bank of New Zealand as expected kept the policy rate steady at 5.5%. Spending and inflation pressure are being constrained by the level of interest rates, but policy will need to be restrictive for the foreseeable future to ensure inflation returns to the 1-3% target range. Price pressures retreated from a 22-year high of 7.3% in 2022Q2 to a still much too high 6.7% in 2023Q1. Employment remains above its maximum sustainable level but the RBNZ is seeing signs of labour market pressures dissipating. Businesses meanwhile are reporting slower demand, including from abroad, and weak investment intentions. Domestic spending has eased but the ongoing recovery in tourism spending is supporting aggregate demand. The central bank left no clues for any potential further tightening. Instead it hinted at reaching the peak as projected by the May forecasts, provided inflation eases as expected. New Zealand money markets now see a stable rate through 2024Q2. The kiwi dollar quickly recovered from a kneejerk downleg to trade higher against a generally weak USD. NZD/USD trades comfortably above 0.62(2).
Hungary’s central bank deputy governor Virag in an interview with Inforadio yesterday said the MNB plans to stick to its 100 bps/month cut of the emergency rate, which currently stands at 16%. The cautious approach is needed to preserve forint stability, which is also critical in the fight against inflation. Virag expects price pressures to slow “on a very steep path until the end of the year” with single digits possible already in the autumn. The Hungarian currency since July had a bad run with EUR/HUF nearing the 390 barrier Friday last week. Since then, a US payrolls induced turnaround kicked in, with the pair currently trading around 378 again.
Soft US CPI is Not Enough
The US dollar extended losses after breaking a long-term ascending channel base yesterday. The British pound rallied on yet another stronger than expected wages growth data released yesterday morning. Average weekly earnings excluding bonuses increased 7.3% in the three months to May. And although the unemployment rate ticked up to 4%, it was because more Brits started looking for jobs, and not because people lost the jobs they had.
But don’t be jealous of Brits that get such a good jump in their pay because UK inflation is still too hot. The average mortgage rate rose to 6.6%, the highest since 2008, inflation in Britain is sitting at 8.7%, and according to truflation, prices grow at a speed that’s faster than 11%. The thing is, the robust wages growth partly explains why the Bank of England (BoE) is having so much pain fighting inflation, and that’s why yesterday’s data fueled the expectation of another 50bp hike from the BoE at its next meeting. The BoE’s policy rate is seen peaking at the 6.5/7% range by the Q1 of next year as predicted by many analysts. Cable hit 1.2970 level, the highest since last April, but whether this really could continue will depend on 1. where the US dollar will be headed after today’s CPI data in the short run, and 2. where the UK economy is headed if the BoE hikes rates to 6.5/7% range in the long run. Because the BoE hikes will continue pressuring the British housing market, and growth, and that could limit Cable’s topside potential following a kneejerk positive reaction.
Lower US CPI won’t be enough to soften the Fed hawks’ hand
The consumer price index in the US is expected to have fallen to 3.1% from 4% printed a month earlier. But unfortunately, it won’t be enough to prevent the Fed from further rate hikes, because the further fall in headline inflation to 3% is due to a favourable base effect on energy prices, while core inflation is expected to remain sticky at around the 5% mark - still more than twice the Federal Reserve’s (Fed) 2% policy target.
Plus, the rebound in oil prices hints that the risk of an uptick in headline inflation is building stronger for the coming months. The barrel of American crude rallied past the 100-DMA yesterday and is flirting with the $75pb level this morning. Trend and momentum indicators remain positive, and we are not in overbought territory just yet, meaning that this rally could further develop. The next natural target for the oil bulls stands at the 200-DMA, at $77pb level. In percentage terms, we are talking about a 12% rally since the start of the month, and the rebound is a response to the further production restriction from Riyadh and Moscow that are determined to push oil prices to at least $80pb level, and also Beijing’s stepping up efforts to boost the Chinese economy by fresh monetary and fiscal stimulus.
But despite the lower OPEC supply and news of fresh monetary and fiscal stimulus from China, US crude should see a solid resistance into $77/80 range as, yes, in one hand, OPEC+ is cutting supply to boost prices, and their supply cuts will dampen the global oil glut in H2 - even more so if China finally achieves a healthier recovery. But on the other hand, the Chinese recovery is not a won game just yet, while increased oil output outside the cartel helps keeping price pressure contained. American crude production is on track for a record year this year, and half of the new crude is coming from the US where companies like Devon Energy that deliver strong output thanks to improved efficiencies.
RBNZ stays pat, BoC to deliver a final 25bp hike
The Reserve Bank of New Zealand (RBNZ) kept its policy rate unchanged at 5.5%. Later today, the Bank of Canada (BoC) is expected to announce a final 25bp hike in this tightening cycle. The Fed however is seen hiking two more times as the strength of the US jobs data, combined with solid economic data, and little pain on US housing market thanks to life-long mortgages.
Therefore, it's interesting that the US dollar depreciates while there is nothing that hints at softening in the Fed’s hawkish policy stance. That, and the fact that we will soon be flirting with oversold market conditions in the US dollar hint at a rebound in the greenback, if backed with robust core inflation and strong economic data.
RBNZ Monetary Policy Review: Play it again Sam!
- As expected, the OCR remains at 5.5 %.
- The RBNZ displayed confidence and comfort with the level of the OCR.
- The RBNZ sees the balance of risks around its inflation forecasts as balanced.
- There was little in the RBNZ commentary for the hawks or the doves.
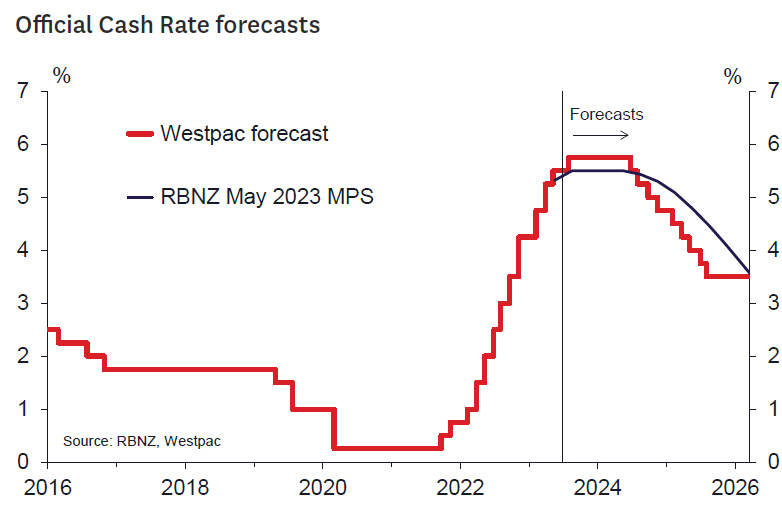
- Westpac still sees a 5.75 % OCR in August
The Reserve Bank left the Official Cash Rate unchanged at 5.5 % as universally expected by market analysts and as largely priced by financial markets.
The tone of the accompanying statement and MPC minutes displayed confidence and comfort with the level of the OCR. There were no indications of a change in view from that presented in the May Monetary Policy Statement where the RBNZ indicated that the OCR would remain on hold until the second half of 2024.
The RBNZ appears more confident in its forecasts, noting that "monetary conditions are constraining domestic spending as expected" and that the risks around the inflation outlook were evenly balanced. There appears to be some upgrade in the RBNZ's view on house prices which are now seen as "more balanced" compared to their previous forecasts of some further small fall in prices. On the other hand, the RBNZ acknowledges the growth outlook in China has weakened and that March quarter GDP was a bit weaker than forecast. It seems that the net of these factors has left their view unchanged and hence the stance of policy is seen as appropriate. Migration trends are assessed to have evolved as expected and are supporting the housing market, although interest rates are seen to be managing risks of a significant increase in prices.
There is little here for either the hawks or the doves. The kiwis are comfortably resting in the nest. The commentary was short, indicating a less controversial discussion at the MPC, and indeed there was a consensus for unchanged rates this time around. Keeping the commentary short probably also reflected a desire to not say anything that might disturb expectations, as we had indicated would be likely in our MPR preview.
Westpac remains of the view that the OCR will be increased by 25 basis points to 5.75 % at the August Monetary Policy Statement. As we noted in our MPR preview, there wasn't enough data since the May Statement to significantly shift the RBNZ's strong view for a protracted period of unchanged rates. However, the month ahead will see some key information in the form of the June quarter Consumers Price Index and Labour market report that should tell us more on the persistence of core inflation pressures and the strength of the labour market, and hence prospects for falling GDP through the second half of this year. Partial indicators suggest the labour market has not cracked yet. This raises the potential that the RBNZ will need to upgrade their growth forecasts for this year closer to those of our own, which will add some upside risks to the inflation outlook and would lengthen the already protracted period over which inflation will take to return to the target range. The kiwi may need to get a waddle on yet although the hurdle to get it moving is pretty high!
Nikkei 225 Technical: Potential Bullish Reversal
- 4-week of decline has almost reached 31,530 key medium-term support
- Oversold condition with the formation of hourly bullish “Hammer” Japanese candlestick
- Key intermediate resistances will be at 32,730 and 33,200
This is a follow-up analysis of our prior report, “Nikkei 225 Technical: Minor corrective decline in progress” published on 6 July 2023.
The price actions of the Japan 225 Index (a proxy of the Nikkei 225 futures) have extended its minor corrective decline within its medium-term uptrend phase and almost met the 31,530 support as per defined in our earlier report. It printed a current intraday low of 31,769 in today, 12 July Asian session at this time of the writing.
Interestingly, several positive elements have emerged that advocate for a potential bullish reversal in price actions at least in the short-term horizon.
The drop in price actions has reached the medium-term ascending channel support
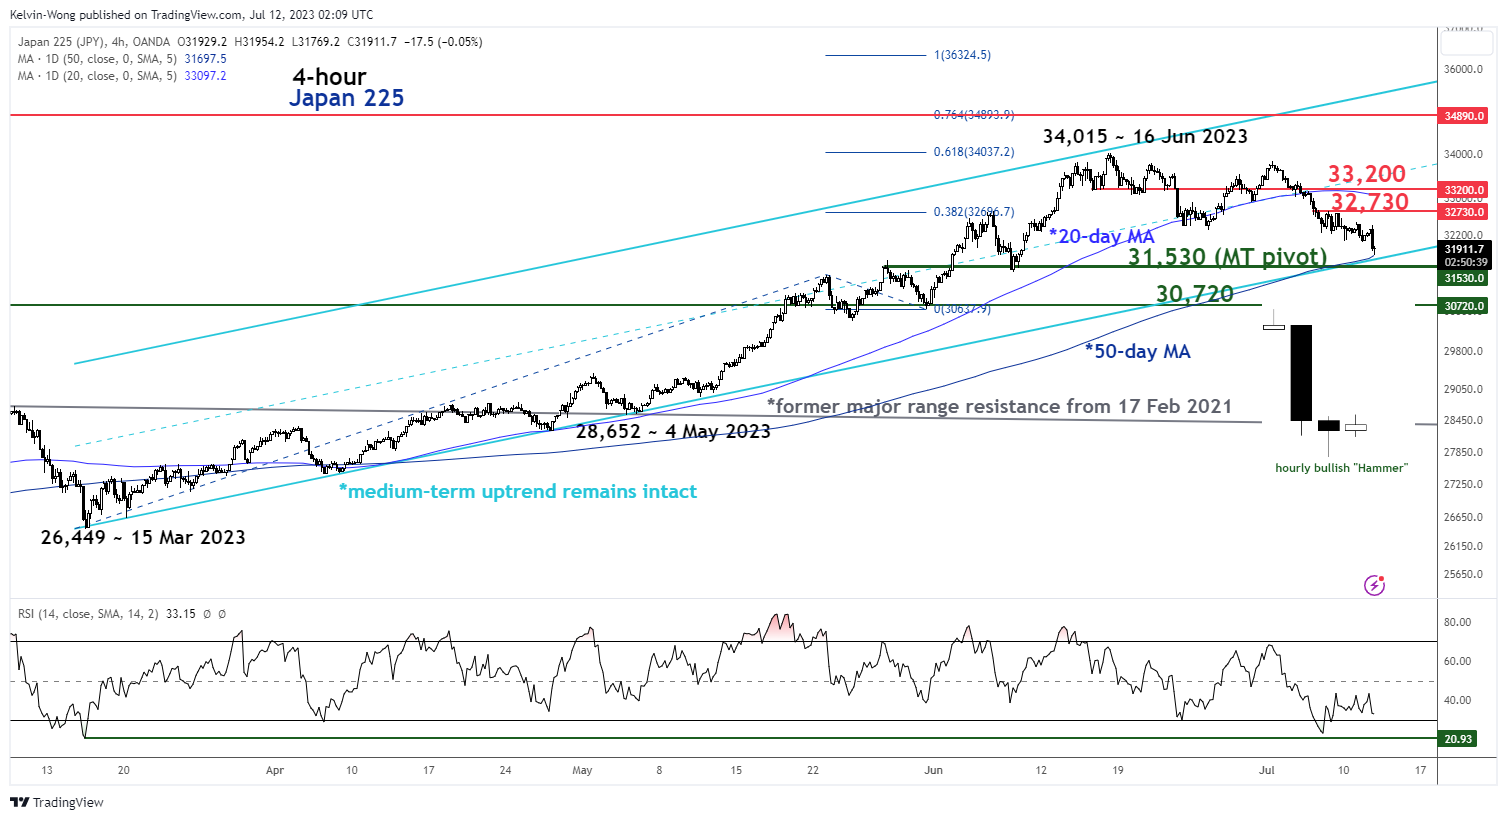
Fig 1: Japan 225 short-term & medium-term trends as of 12 Jul 2023 (Source: TradingView, click to enlarge chart)
The four weeks decline of -6.6% from its 16 June 2023 high of 34,015 has almost reached the lower boundary of the medium-term ascending channel in place since the 15 March 2023 low of 26,449 that is now acting as a support at 31,530.
The aforementioned 31,530 support also confluences closely with the 23.6% Fibonacci retracement of the medium-term uptrend from the 15 March 2023 low to the 16 June 2023 high and the 1.236 Fibonacci extension of the minor decline from the 16 June 2023 high to the 27 June 2023 low projected from 3 July 2023 high.
Oversold condition with bullish Japanese candlestick
The four weeks decline in the price actions has led the 4-hour RSI oscillator into an extremely oversold level of 23.3 level on 6 July 2023 which was the lowest oversold reading since the 15 March 2023 level of 20.9 that coincided with the start of the current medium-term uptrend phase of the Index.
Secondly, the current intraday price actions have also formed an hourly bullish “Hammer” Japanese candlestick pattern which suggests a potential change in sentiment from negative to positive on the short-term horizon.
These two elements (oversold reading in the 4-hour RSI coupled with hourly bullish “Hammer” Japanese candlestick) have taken shape right above the medium-term ascending channel support of 31,530 and the upward-sloping 50-day moving average.
Watch the 31,530 key medium-term pivotal support to maintain a potential bullish reversal with the next resistances coming in at 32,730 and 33,200 (also the 20-day moving average).
However, a break below 31,530 invalidates the bullish tone to expose the next support at 30,720.
Silver (XAGUSD) Rallies in Elliott Wave Diagonal
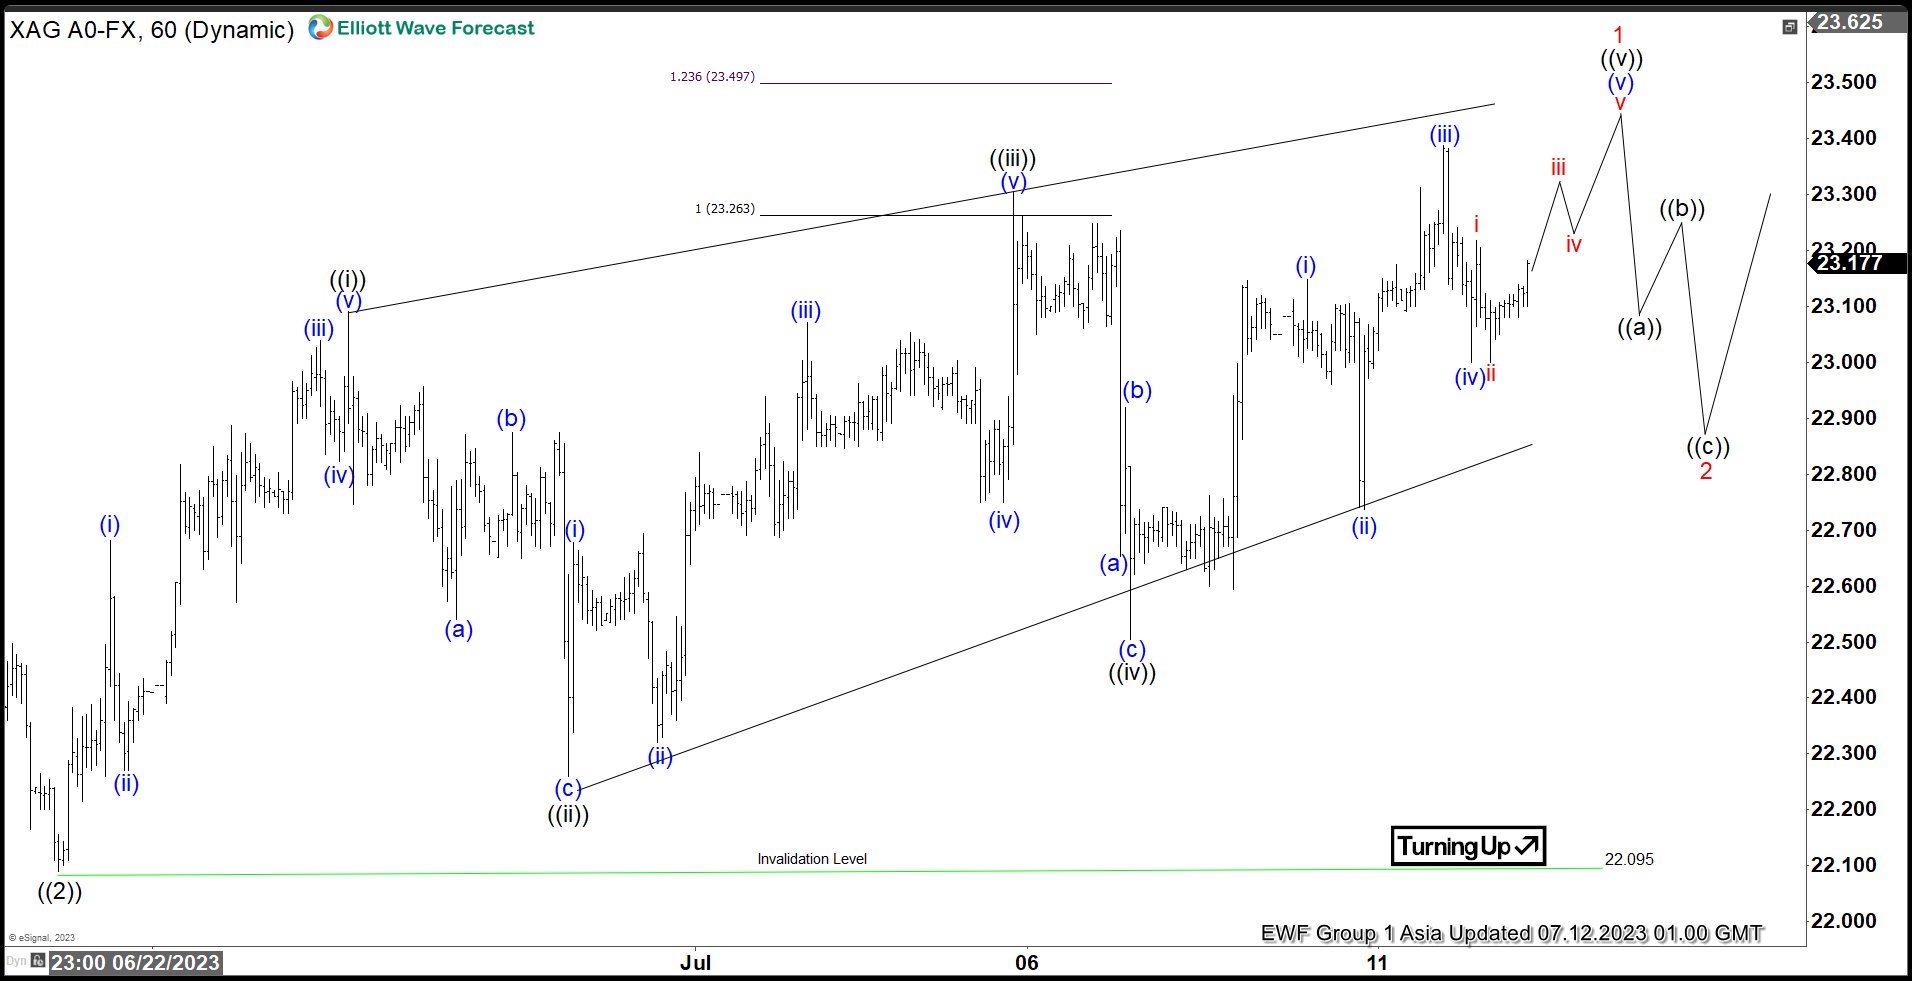
Short term Elliott Wave view in Silver (XAGUSD) suggests that the metal ended wave ((2)) at 22.09. Up from there, the metal rallies as a 5 waves diagonal Elliott Wave structure. Up from wave ((2)), wave (i) ended at 22.68 and dips in wave (ii) ended at 22.27. The metal extends higher in wave (iii) towards 23.04 and pullback in wave (iv) ended at 22.82. Final leg wave (v) ended at 23.09 which completed wave ((i)).
Pullback in wave ((ii)) ended at 22.26 with internal subdivision as a zigzag. The metal then extends higher again in wave ((iii)) towards 23.3. Pullback in wave ((iv)) completed at 22.50. Up from there, wave (i) ended at 23.14 and dips in wave (ii) ended at 22.73. Wave (iii) ended at 23.38, and pullback in wave (iv) ended at 23. Expect the metal to make 1 more push higher to end wave (v) and this should complete wave ((v)) of 1 in higher degree. Afterwards, it should pullback in wave 2 to correct cycle from 6.23.2023 low before the rally resumes again. Near term, as far as pivot at 22.09 low stays intact, expect pullback to find support in 3, 7, or 11 swing for further upside.
Silver (XAGUSD) 60 Minutes Elliott Wave Chart
XAGUSD Elliott Wave Video
https://www.youtube.com/watch?v=ZUQOhNhGhHs
Technical Outlook and Review
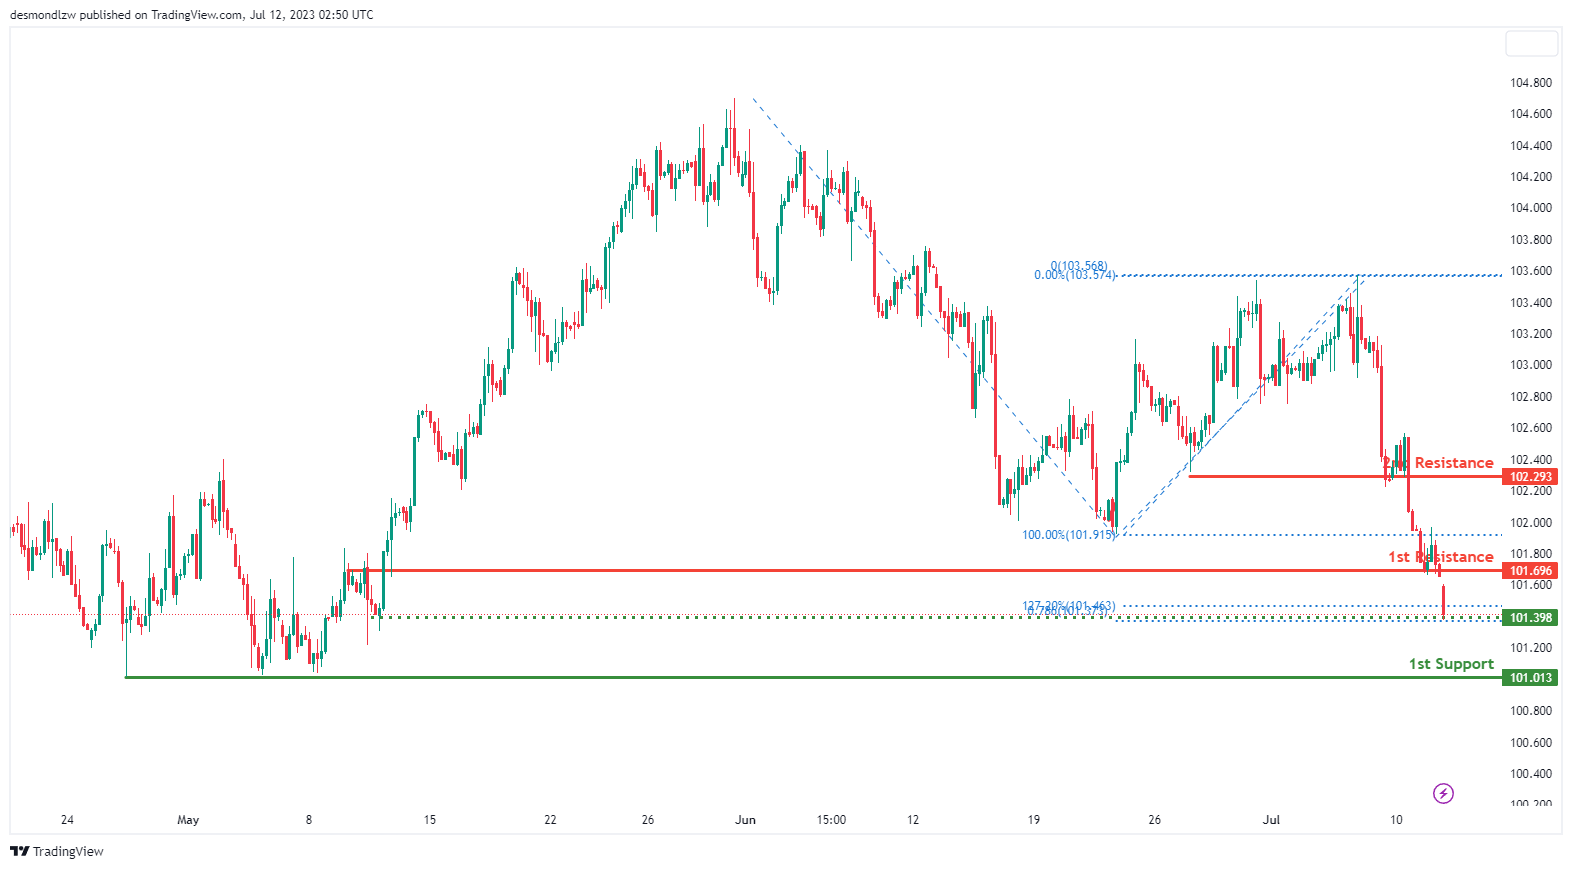
DXY:
The DXY index is currently demonstrating a bearish momentum, indicating a possible continued downward movement towards the 1st support level.
The intermediate support level is found at 101.39 and is characterized as a pullback support. This level also aligns with a 127.20% Fibonacci extension and a 78.60% Fibonacci projection levels, enhancing its significance as a potential stabilization point in the event of a price decline.
Should the price continue to drop, the 1st support situated at 101.01, an overlap support, could offer another layer of stability.
In contrast, if the price reverses its course, it could encounter the 1st resistance at 101.69, characterized as an overlap resistance. This level could serve as a potential barrier to upward price movements.
If the price manages to surpass the 1st resistance, it could aim for the 2nd resistance level positioned at 102.29. This level also serves as an overlap resistance, marking another potential point of resistance.
EUR/USD:
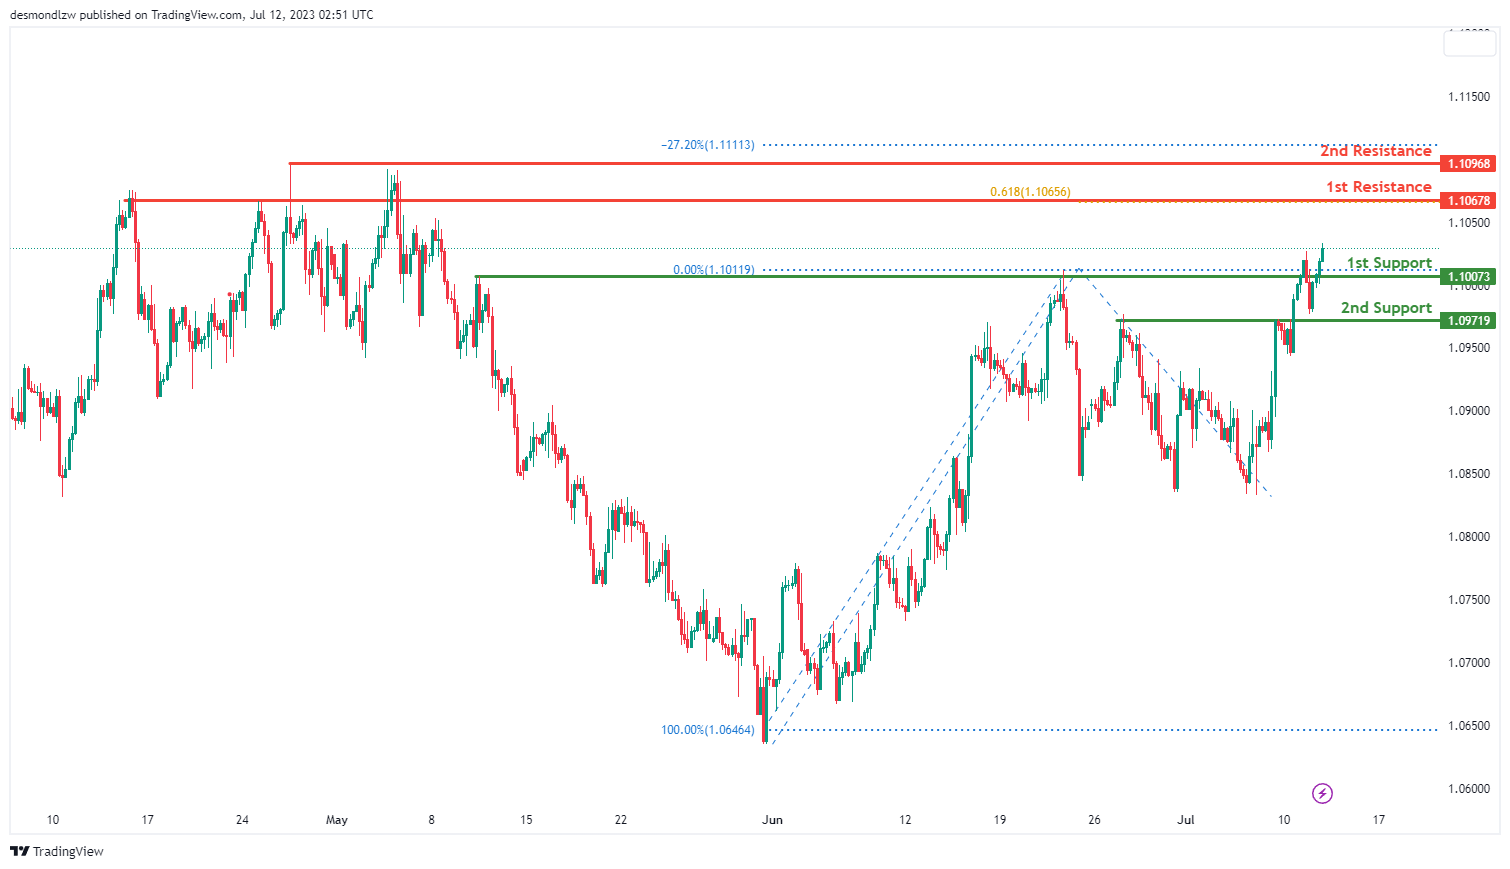
The EUR/USD pair is currently displaying a bullish trend, indicating a potential for a bullish continuation towards the 1st resistance level.
On the downside, the price may find substantial support at the 1st level of 1.1007, identified as an overlap support, which can provide significant stability for the price. A further descent could be cushioned by the 2nd support level at 1.0972, another overlap support.
On the upside, the price may continue its bullish trend towards the 1st resistance level at 1.1068. This overlap resistance coincides with a 61.80% Fibonacci projection level, bolstering its significance.
If the price manages to surpass this resistance, it might aim for the 2nd resistance level at 1.1097. This overlap resistance aligns with a -27% Fibonacci expansion level, adding further weight to its role as a potential barrier to further price increases.
EUR/JPY:
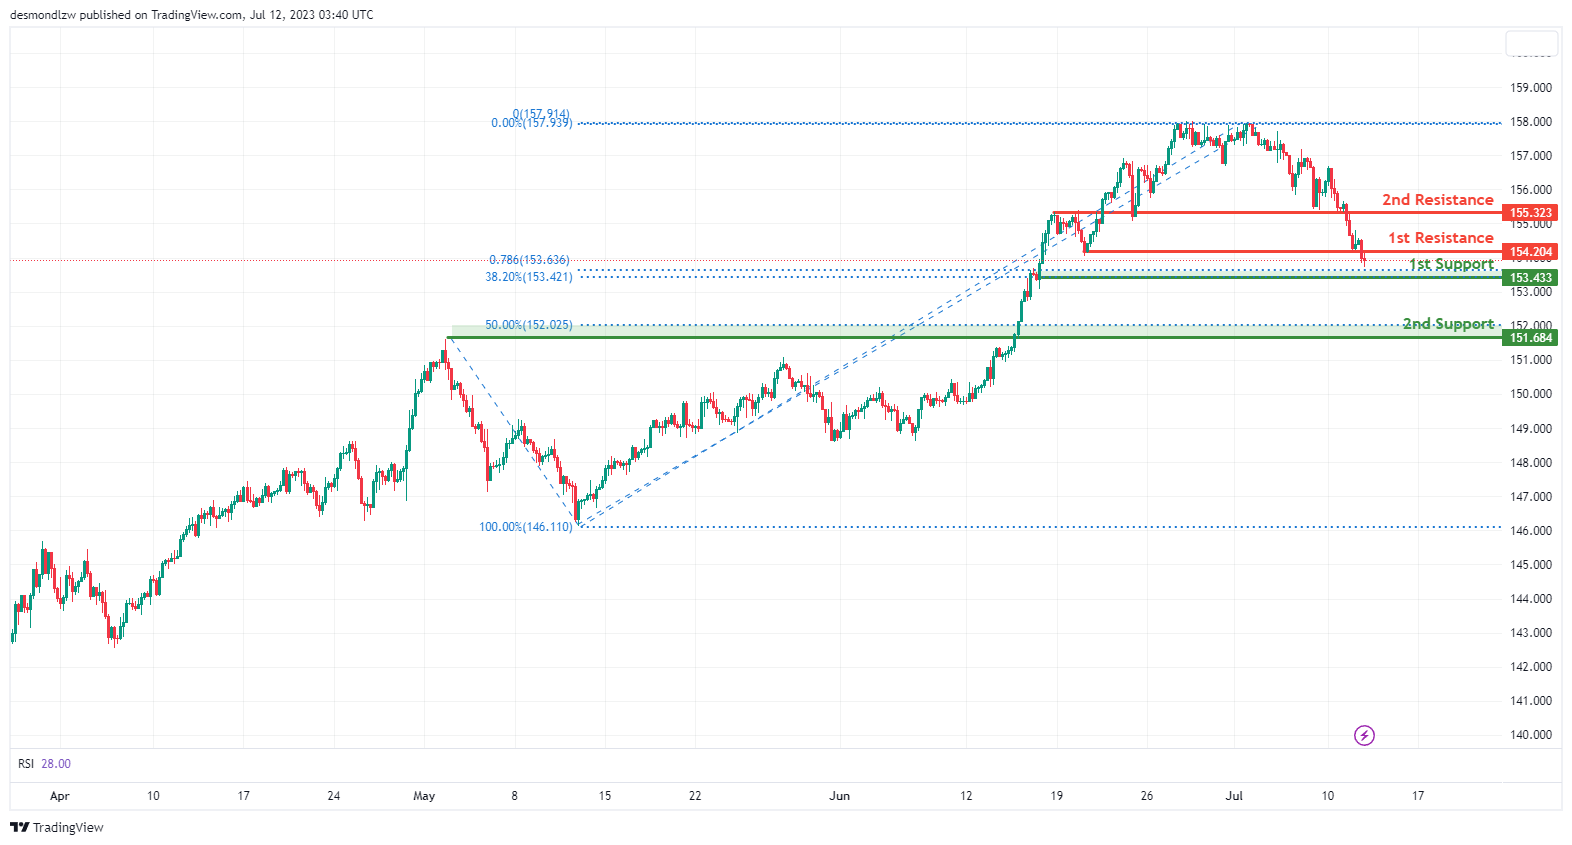
The EUR/JPY instrument currently demonstrates a bearish momentum. It is anticipated that the price may continue its downward movement towards the 1st support.
The 1st support level is located at 153.43 and is considered significant due to its role as an overlap support, as well as its alignment with the 78.60% Fibonacci projection and the 38.20% Fibonacci retracement, indicating a Fibonacci confluence.
The 2nd support level is positioned at 151.68 and is recognized as a strong support level, representing an overlap support and aligning with the 50% Fibonacci retracement.
Moving on to the resistance levels, the 1st resistance is found at 154.20 and is deemed significant due to its status as an overlap resistance. The 2nd resistance level is situated at 155.32 and is considered noteworthy as it represents an overlap resistance.
EUR/GBP:
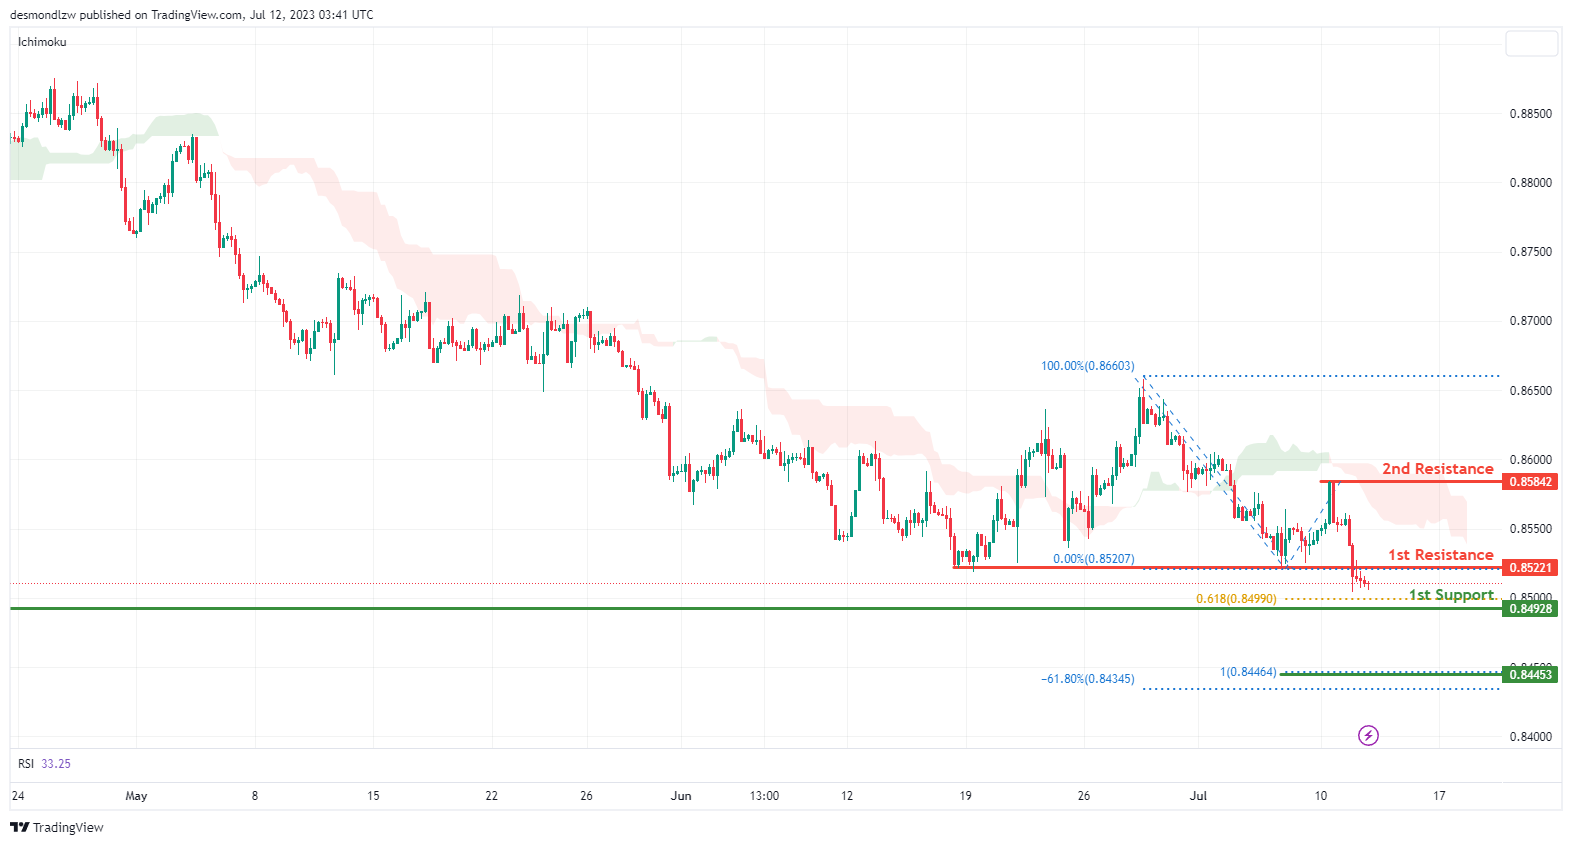
The EUR/GBP pair currently demonstrates a bearish momentum. This is supported by the fact that the price is below the bearish Ichimoku cloud, which contributes to the overall downward trend.
Given this bearish momentum, there is potential for the price to continue its downward movement towards the 1st support level. The 1st support level is located at 0.8492 and is considered significant as it represents an overlap support and aligns with the 61.80% Fibonacci projection.
The 2nd support level is positioned at 151.6800 and is recognized as a strong support level. It represents a swing low support, and it aligns with the -61.8% Fibonacci expansion and the 100% Fibonacci projection, indicating a Fibonacci confluence.
On the other hand, the 1st resistance is found at 154.2000 and is significant due to its overlap resistance. The 2nd resistance level is situated at 155.3200 and is considered noteworthy as it represents an overlap resistance.
GBP/USD:
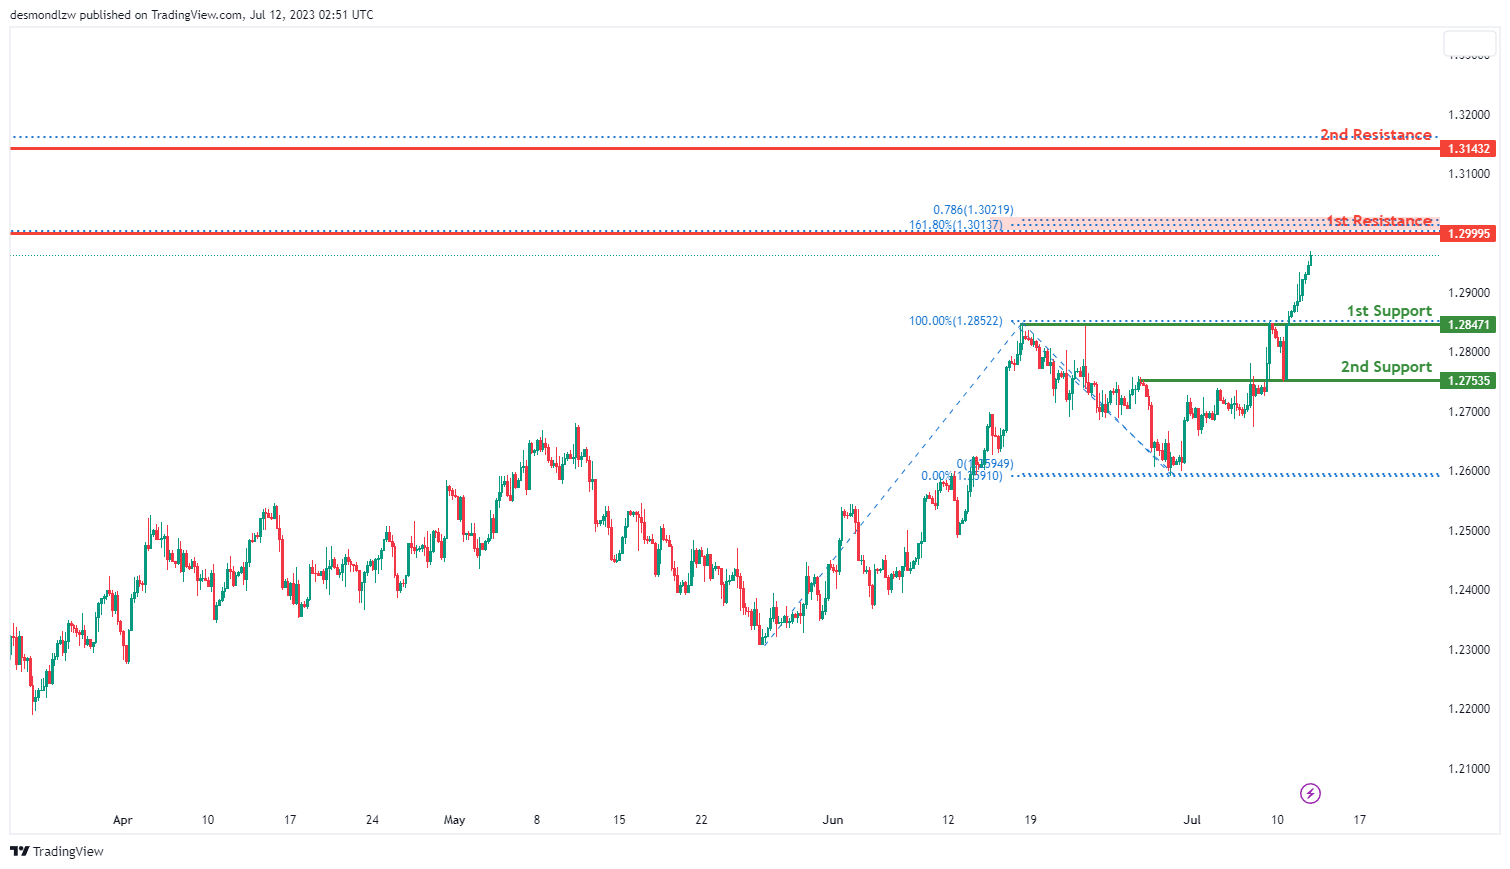
The GBP/USD pair is presently exhibiting a bullish momentum, signifying a potential bullish continuation towards the 1st resistance level.
The 1st support is found at 1.2847 and is recognized as an overlap support, offering a critical level of price stability. Further, the 2nd support level is located at 1.2754, another overlap support, offering additional assurance in case of a downward price move.
On the upward side, the price may continue its bullish movement towards the 1st resistance level at 1.2999. This overlap resistance aligns with a 78.60% Fibonacci retracement and a 78.60% Fibonacci projection levels in addition to the 161.80% Fibonacci expansion level, , indicating a Fibonacci confluence.
Should the price breach this level, the next target could be the 2nd resistance level at 1.3143. This overlap resistance coincides with a 100% Fibonacci projection level, providing another potential hurdle for further price ascension.
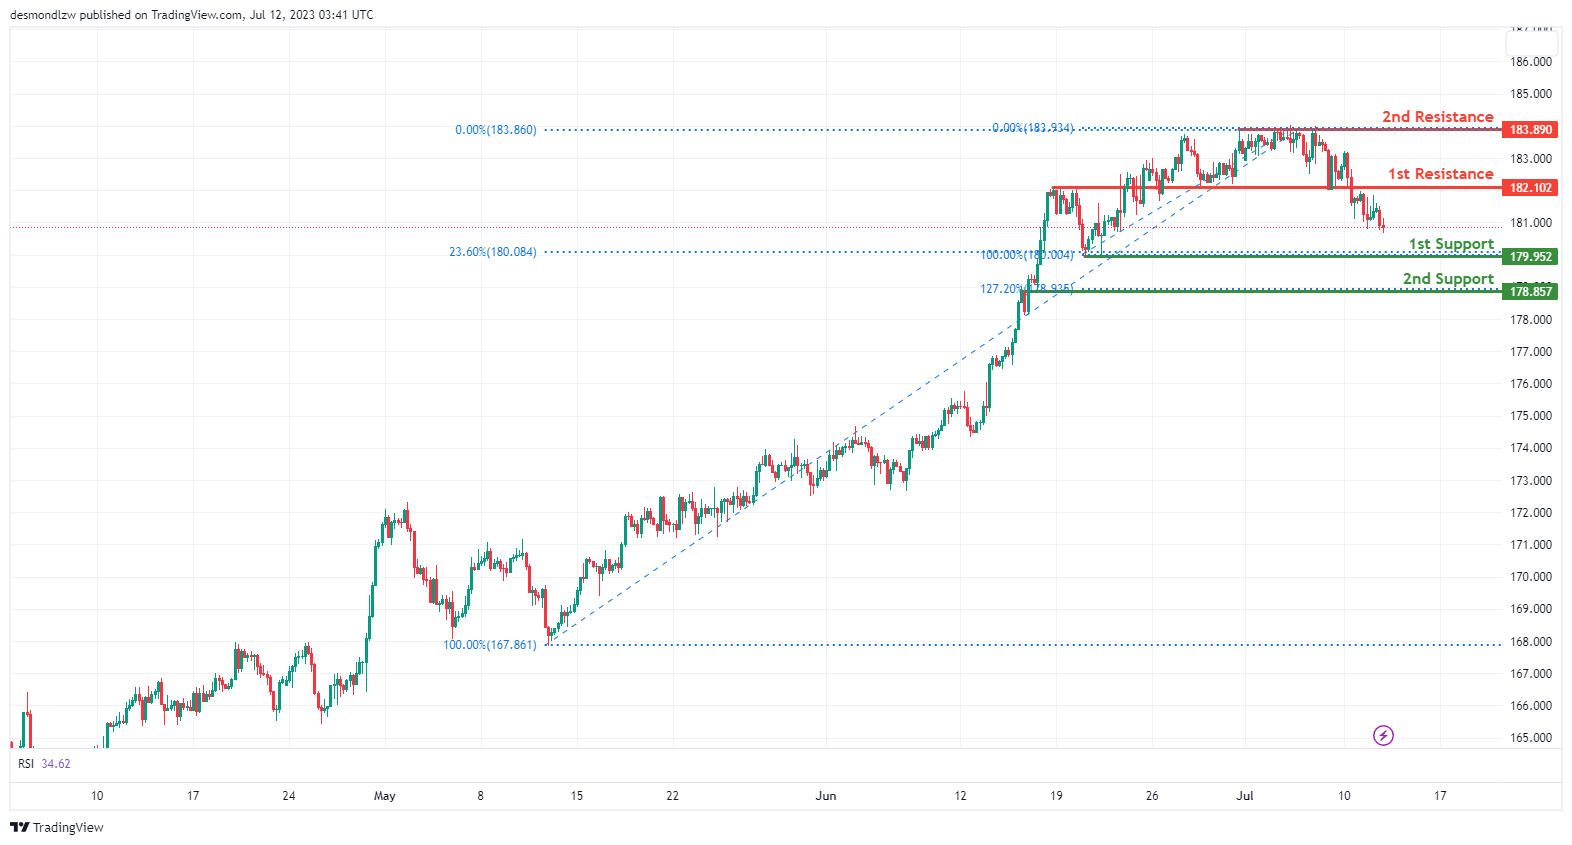
GBP/JPY:
The GBP/JPY instrument currently exhibits a bearish momentum. It is anticipated that the price may continue its downward movement towards the 1st support level.
1st supportt level is located at 179.95 and is considered significant as it represents a swing low support and aligns with the 23.60% Fibonacci retracement level. 2nd level is positioned at 178.85 and is recognized as a strong support level. It represents an overlap support and aligns with the 127.20% Fibonacci extension.
Moving on to the resistance levels, 1st resistance is found at 182.10 and is considered significant due to its status as an overlap resistance. 2nd resistance level is situated at 183.89 and is notable as it represents a multi-swing high resistance.
USD/CHF:
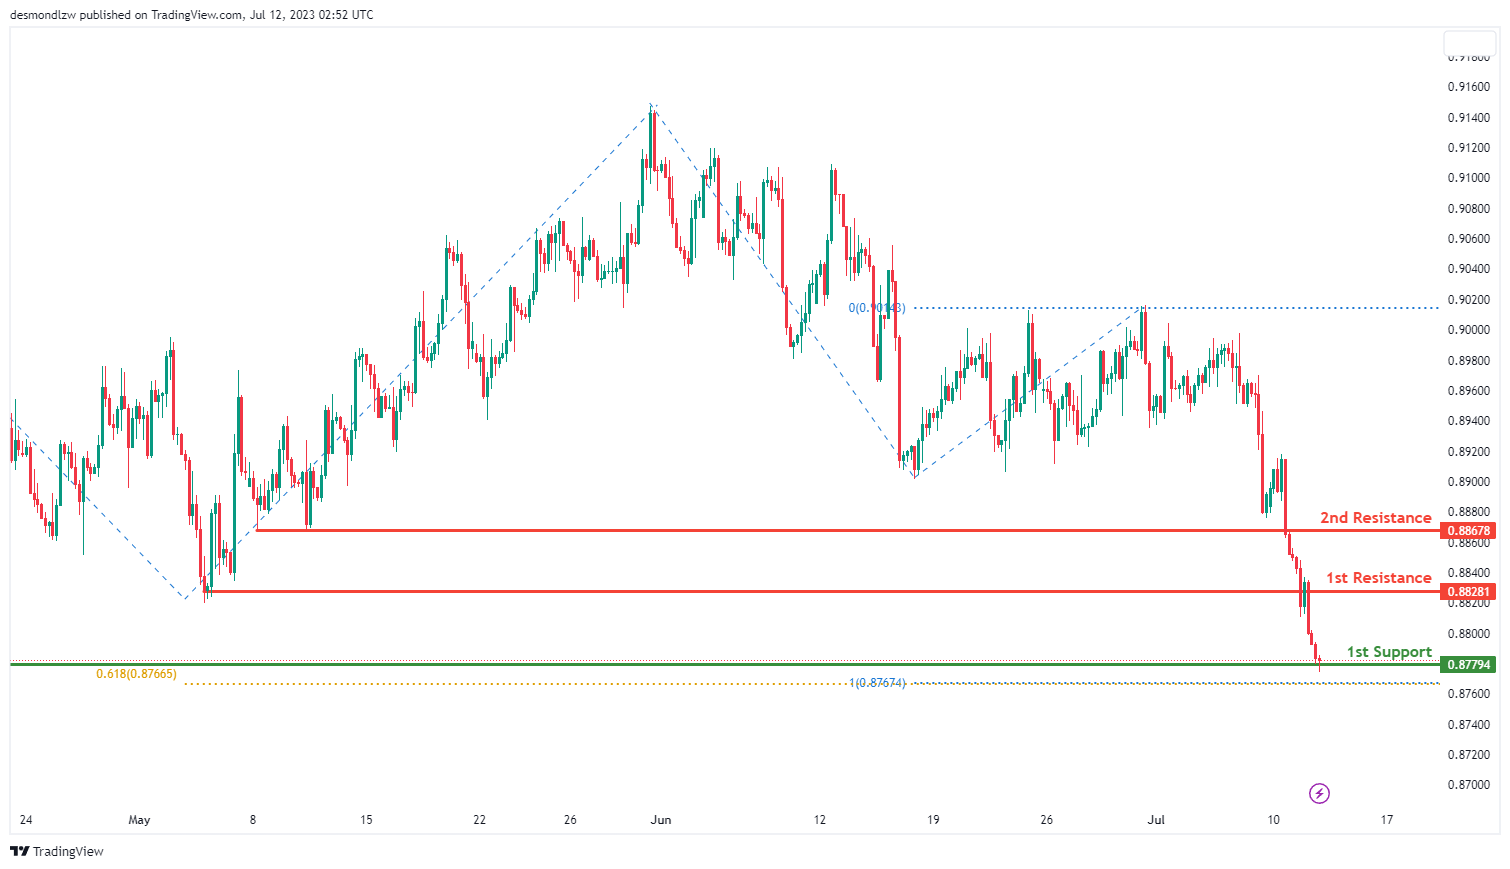
The USD/CHF pair is currently showcasing a bearish momentum, implying a potential bearish continuation towards the 1st support level.
The 1st support is located at 0.8779, which serves as an overlap support. Additionally, this support level is aligned with both a 61.80% and a 100% Fibonacci projection levels, thereby bolstering its significance in providing price stability.
In terms of resistance, the 1st resistance level is spotted at 0.8828 and is classified as an overlap resistance. This could potentially act as an obstacle to any upward price movement. Further, should the price breach this level, it could face the 2nd resistance located at 0.8868, another overlap resistance, potentially stalling further ascension.
USD/JPY:
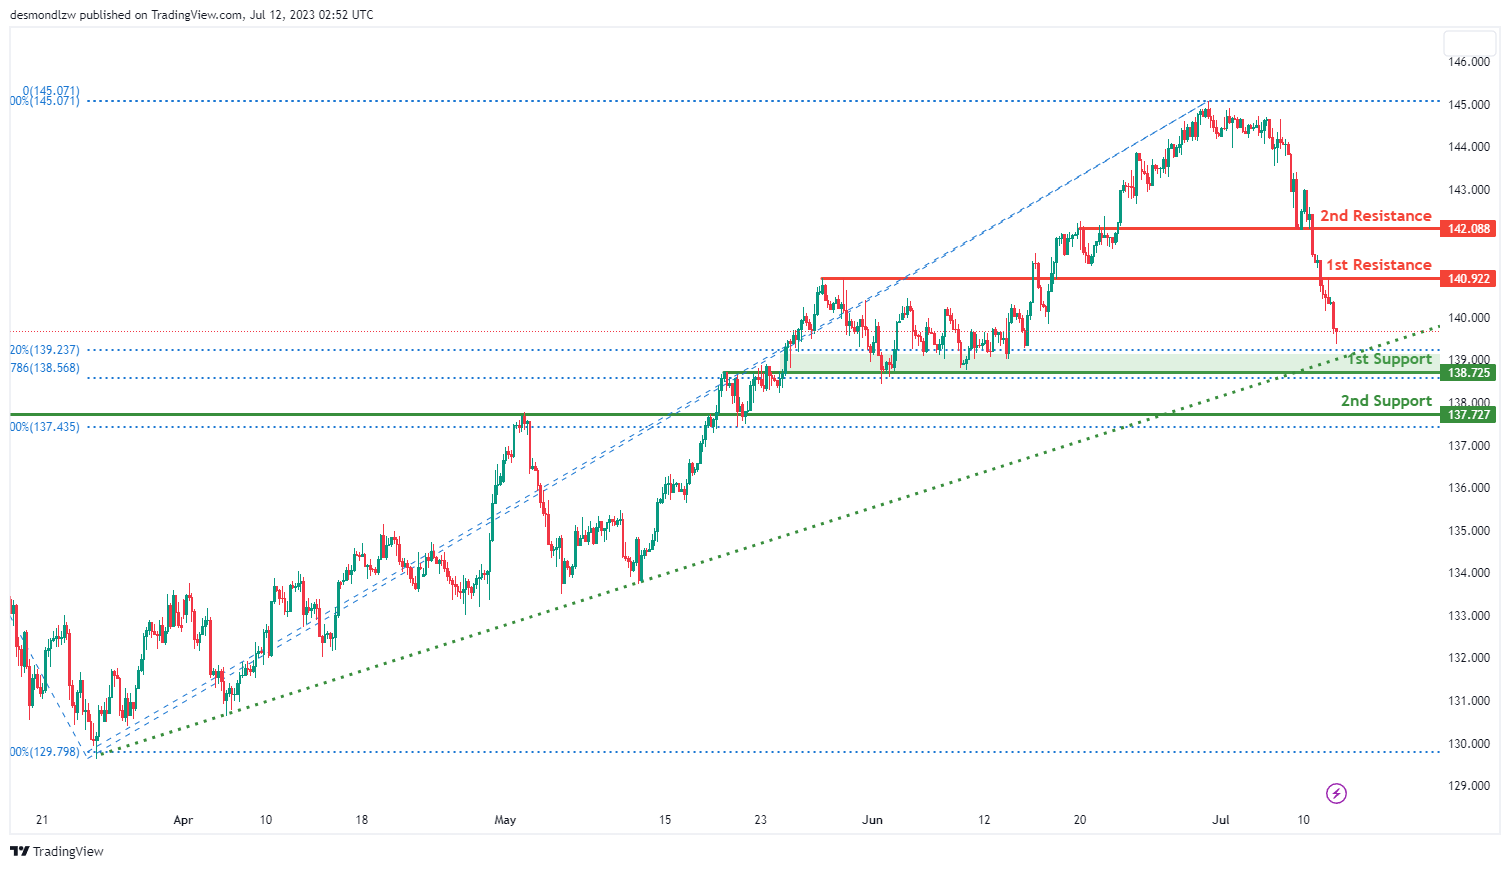
The USD/JPY chart is currently demonstrating a bearish momentum, indicating the potential for a bearish continuation towards the 1st support level.
The 1st support is situated at 138.73, functioning as an overlap support. This level also aligns with a 38.20% Fibonacci retracement and a 78.60% Fibonacci projection levels, thereby emphasizing its importance.
Furthermore, the 2nd support level at 137.73 acts as another overlap support and coincides with a 50% Fibonacci retracement level, bolstering its significance as a potential barrier to the bearish trajectory.
On the flip side, if the price starts to reverse its course, the 1st resistance at 140.92, classified as an overlap resistance, might provide a significant challenge to the bullish movement. Additionally, the 2nd resistance level at 142.09, another overlap resistance, could pose further resistance to upward price movements.
USD/CAD:
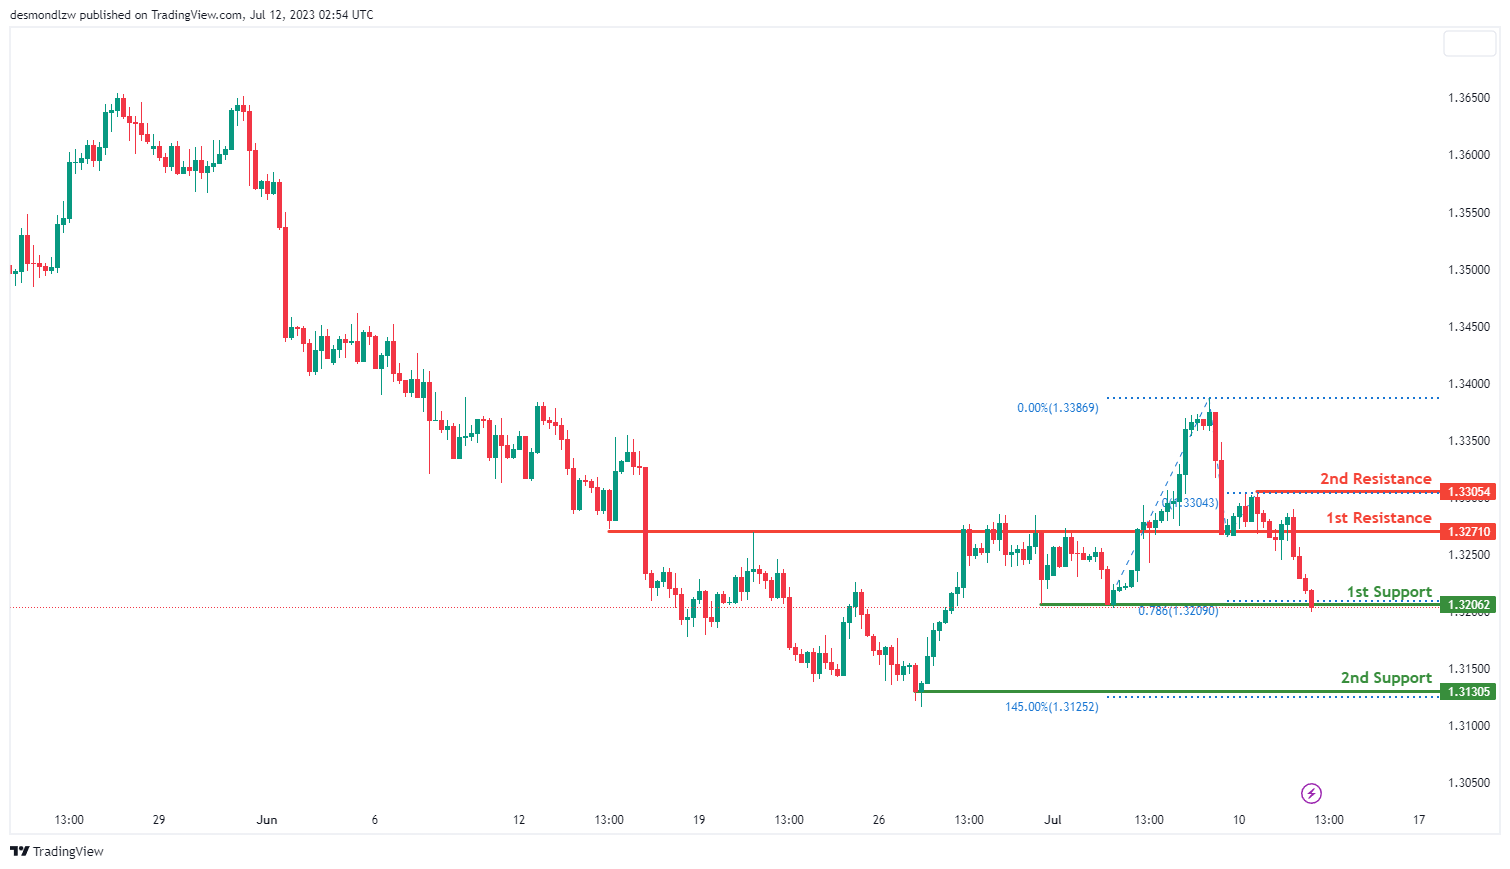
The USD/CAD currency pair is currently demonstrating a bearish momentum, suggesting a possible continuation of the downward trend in the near term. This is indicated by the potential for a bearish break off the 1st support level.
The 1st support level is placed at 1.3206, a point that has shown significant overlap support in the past. Its significance is further emphasized as it aligns with a 78.60% Fibonacci projection level. Should the bearish momentum persist, we might see the price breaking through this support and potentially heading towards the 2nd support level.
The 2nd support level is located at 1.3131, another critical price point identified by its characteristic as an overlap support. Furthermore, this level is also in line with a 145.00% Fibonacci extension level, further solidifying its position as a potential target in a continued bearish trend.
On the contrary, if the bearish momentum is halted and the price shifts in the opposite direction, we would expect the pair to encounter resistance levels. The 1st resistance level lies at 1.3271, a point that has provided overlap resistance in the past, potentially hindering an upward price movement.
Beyond that, the 2nd resistance level, identified at 1.3305, is classified as a pullback resistance. This indicates that should the price reach this point, there could be an increased likelihood of a slowdown in the bullish trend.
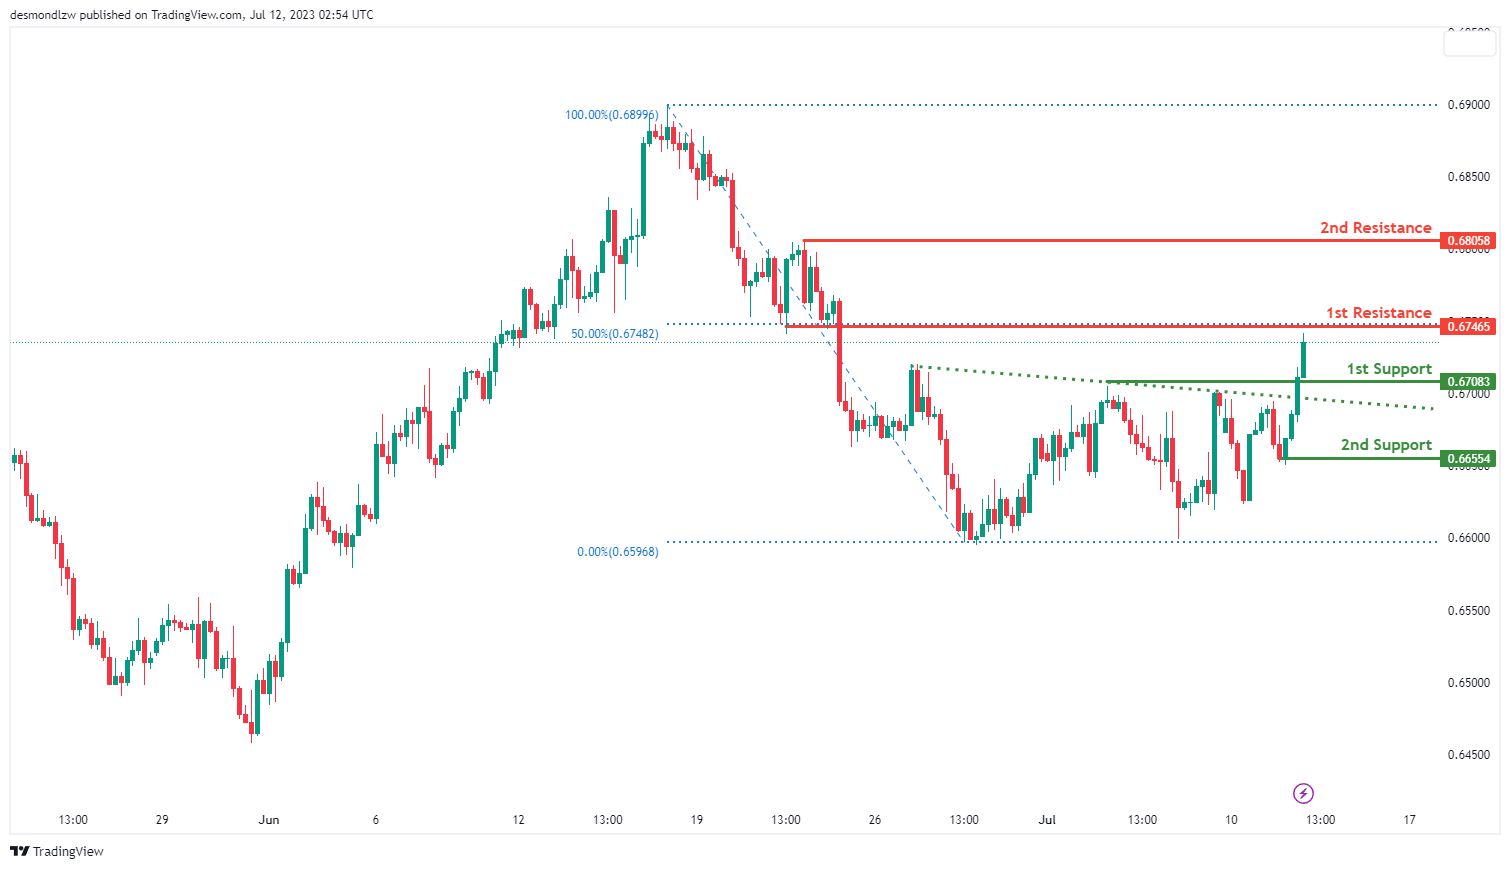
AUD/USD:
The AUD/USD currency pair is currently showcasing a bullish trend. This positive momentum is primarily attributed to the price breaking above a descending resistance line, which is potentially triggering a bullish move in the short term. The price could possibly continue its bullish trajectory towards the 1st resistance level.
The 1st support level is noted at 0.6708 and has been identified as an overlap support. Should the bullish momentum wane and the price experiences a decline, this level could serve as a reliable foundation.
The 2nd support is found at 0.6655, serving as a pullback support. This level could play a crucial role if a more substantial price correction were to occur, helping to potentially reverse the downward trend.
On the flip side, should the bullish momentum persist, the 1st resistance is expected at 0.6747. It’s marked as an overlap resistance and aligns with a 50% Fibonacci retracement, which may further solidify this resistance level.
Beyond the 1st resistance, if the price continues to climb, the 2nd resistance is located at 0.6806. This level is noted as a pullback resistance and could potentially pose a substantial barrier to continued upward price movements.
NZD/USD
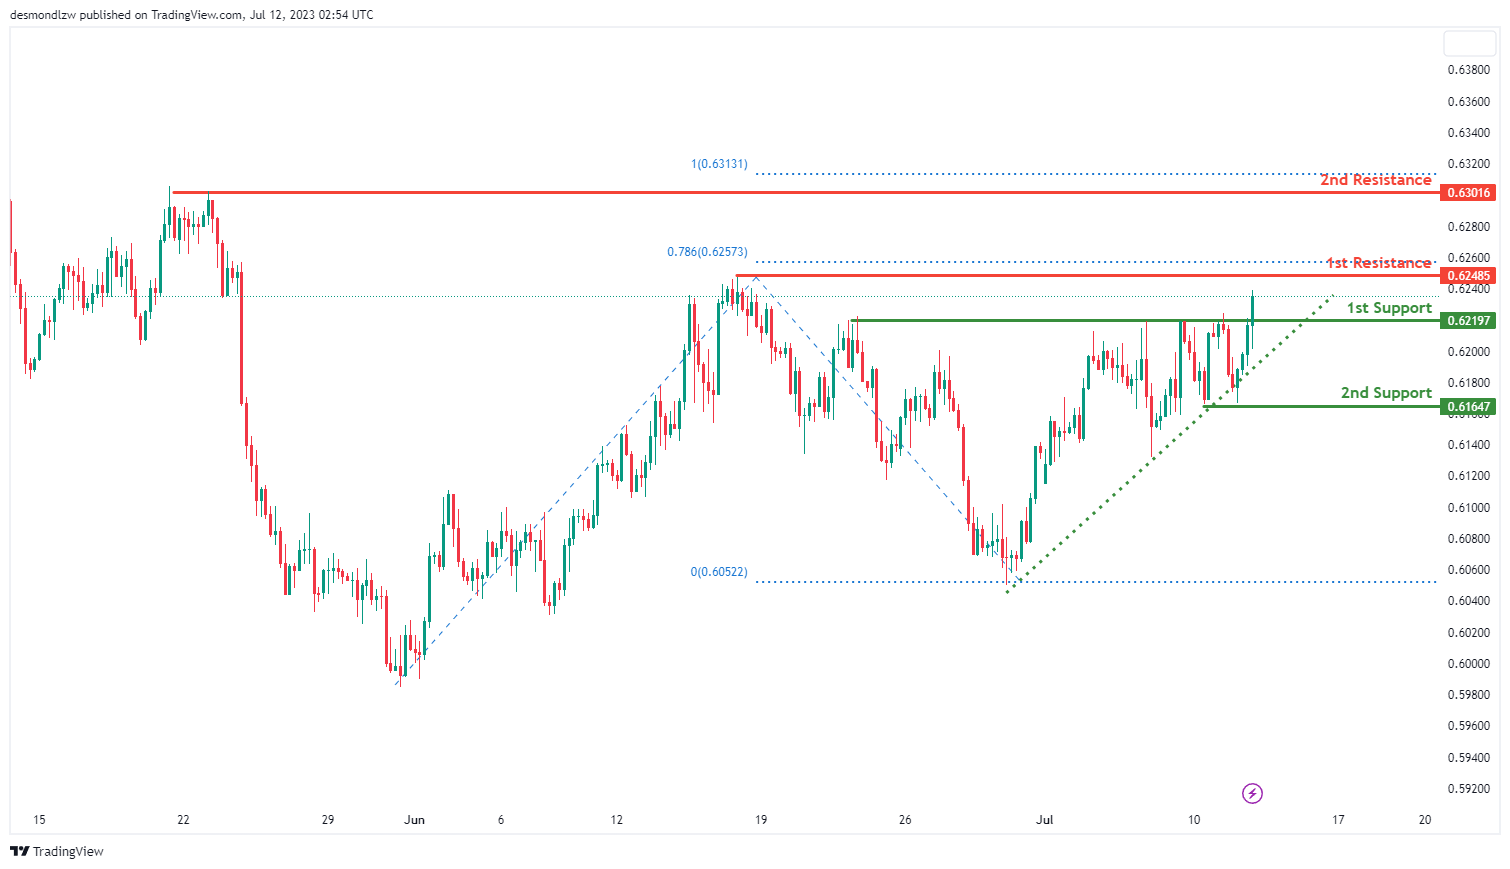
The NZD/USD pair currently exhibits a bullish trend, supported by the fact that the price is situated above a significant ascending trend line. The price could potentially continue its bullish direction towards the 1st resistance level.
The 1st support is identified at 0.6219 and is considered as an overlap support, a level that provides a robust foundation for the price. If the price were to retrace from its current position, this level could act as a strong buffer.
Further beneath the 1st support, the 2nd support is located at 0.6165, and it also serves as an overlap support. This level could provide additional backing for the price in the event of a more significant downward correction.
On the contrary, if the bullish momentum is sustained, the price could meet the 1st resistance at 0.6249. This level is characterized as a swing high resistance and aligns with a 78.6% Fibonacci projection level.
If the price manages to breach the 1st resistance, it could then encounter the 2nd resistance placed at 0.6302. This level is noted as a multi-swing high resistance and corresponds to a 100% Fibonacci projection level.
DJ30:
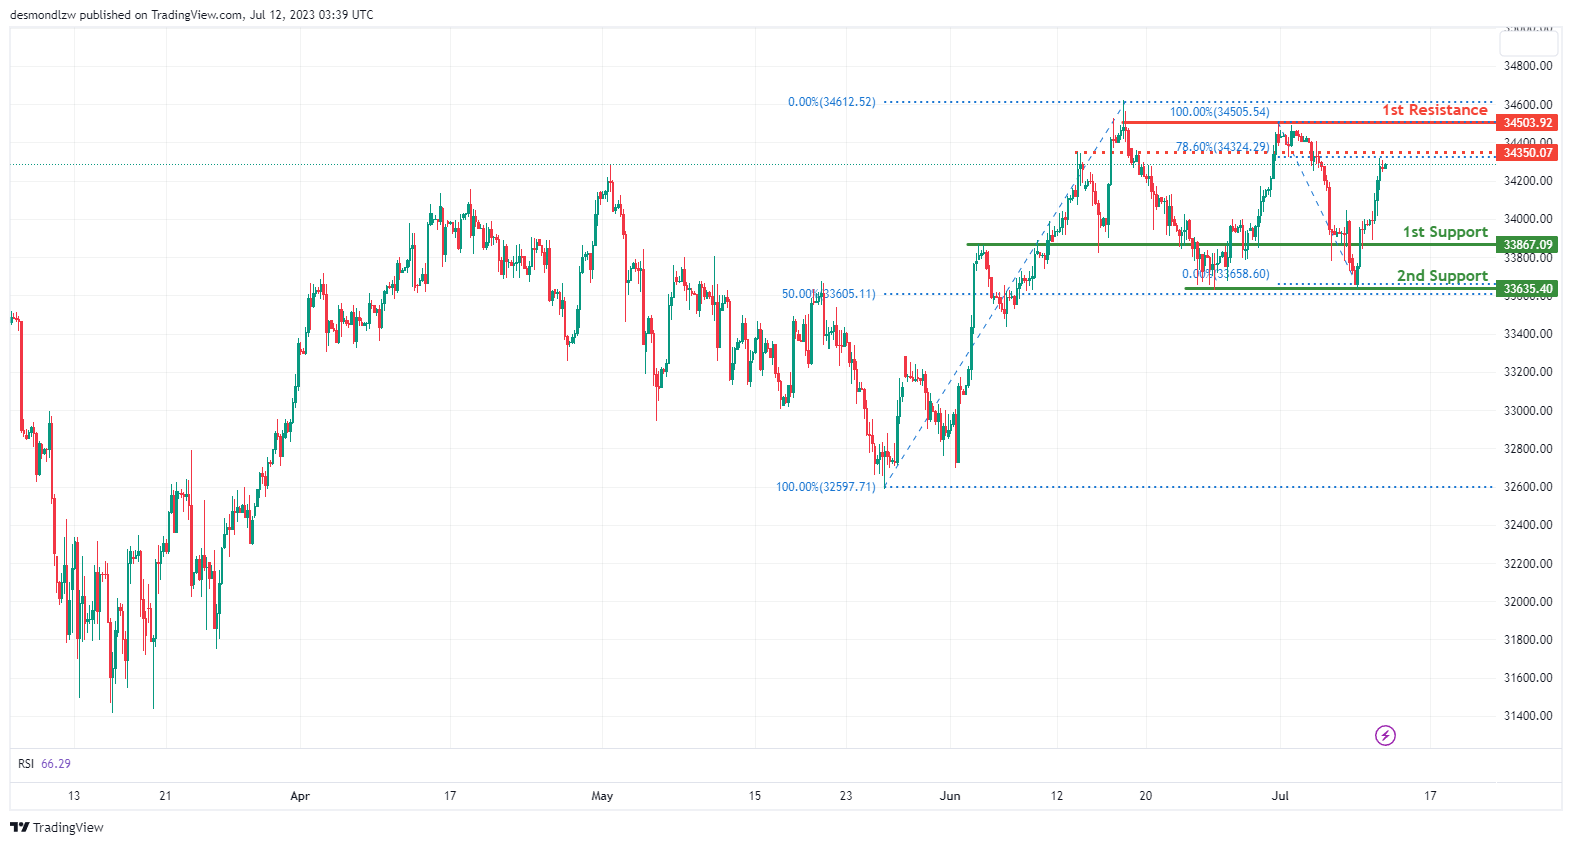
The DJ30 (Dow Jones Industrial Average) chart is currently exhibiting a bullish momentum. There is potential for the price to continue its upward movement towards the 1st resistance.
The 1st support level is at 33867.09 and is considered significant due to its overlap support. The 2nd support level is positioned at 33635.40 and is recognized as a strong support level as it represents a multi-swing low support and aligns with the 50% Fibonacci retracement level.
Moving on to the resistance levels, the 1st resistance is found at 34503.92 and is significant because it represents a multi-swing high resistance. Additionally, there is an intermediate resistance level at 34350.07. This level is considered notable due to its overlap resistance and correlation with the 78.60% Fibonacci retracement level.
GER30:
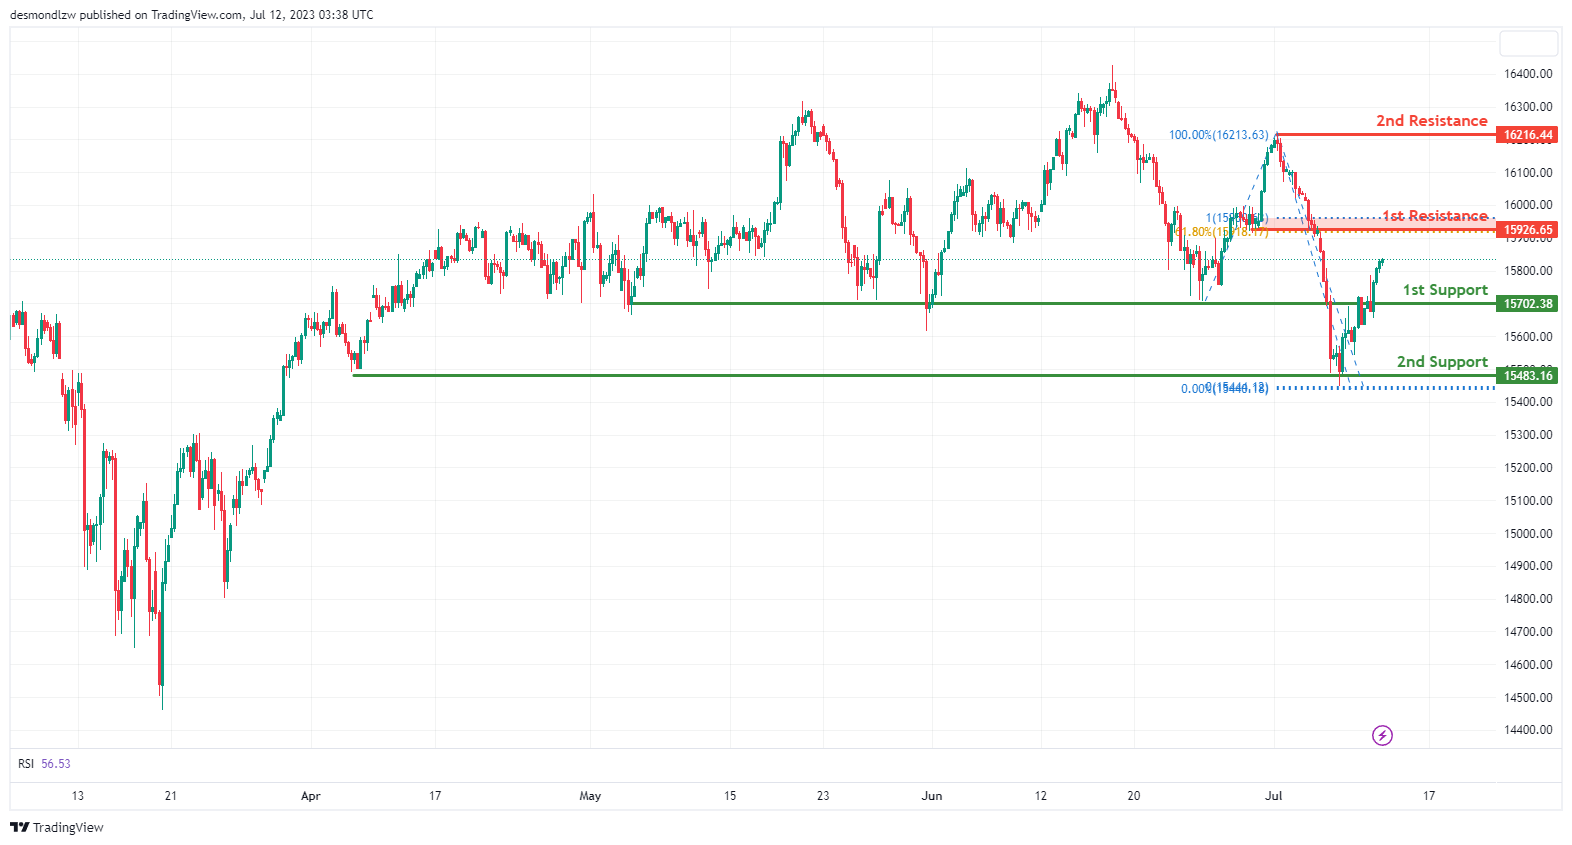
The GER30 (DAX) chart currently shows a bullish momentum. There is potential for the price to continue its upward movement towards the 1st resistance.
The 1st support level is located at 15702.38 and is considered significant due to its overlap support. The 2nd support level is positioned at 15483.16 and is recognized as a strong support level, representing a multi-swing low support.
Moving on to the resistance levels, the 1st resistance is found at 15926.65. This resistance level is significant as it represents an overlap resistance, a 61.80% Fibonacci retracement, and a 100% Fibonacci projection, indicating a Fibonacci confluence.
Additionally, the 2nd resistance level is situated at 16216.44 and is considered noteworthy due to its status as a swing high resistance.
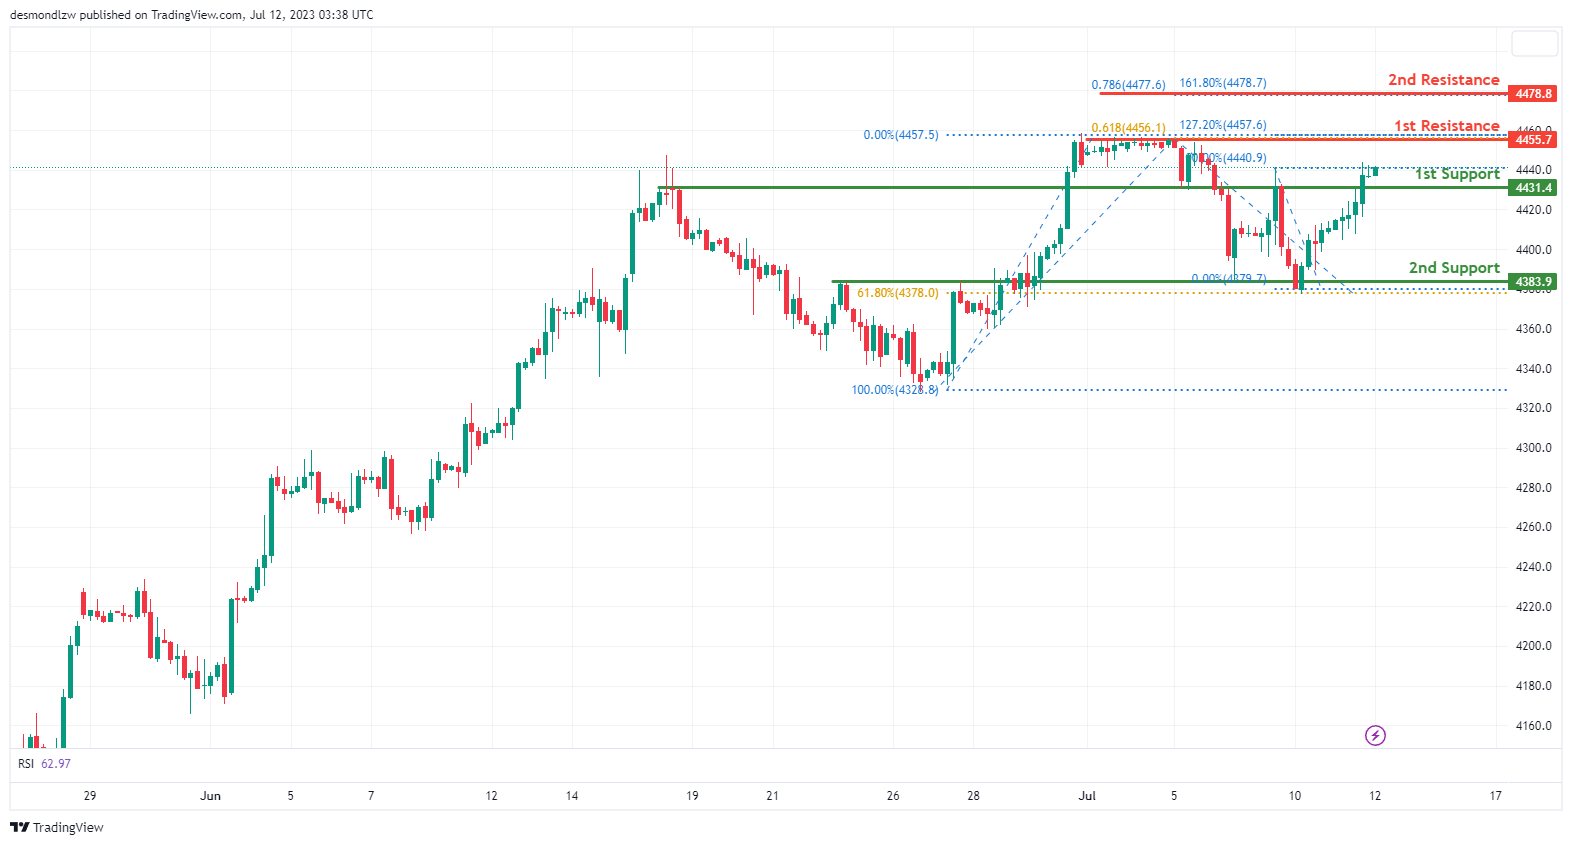
US500
The US500 (S&P 500) chart currently exhibits a bullish momentum. There is potential for the price to continue its upward movement towards the 1st resistance.
The 1st support level is located at 4431.4 and is considered significant as it represents an overlap support. The 2nd support level is positioned at 4383.9 and is recognized as a strong support level, representing a multi-swing low support and aligning with the 61.80% Fibonacci retracement level.
Moving on to the resistance levels, the 1st resistance is found at 4455.7. This resistance level is significant as it represents a multi-swing high resistance, a 61.80% Fibonacci projection, and a 127.20% Fibonacci extension, indicating a Fibonacci confluence.
Additionally, the 2nd resistance level is situated at 4478.8 and is considered noteworthy as it represents a swing high resistance, along with a 78.60% Fibonacci projection and a 161.80% Fibonacci extension, indicating another Fibonacci confluence.
BTC/USD:
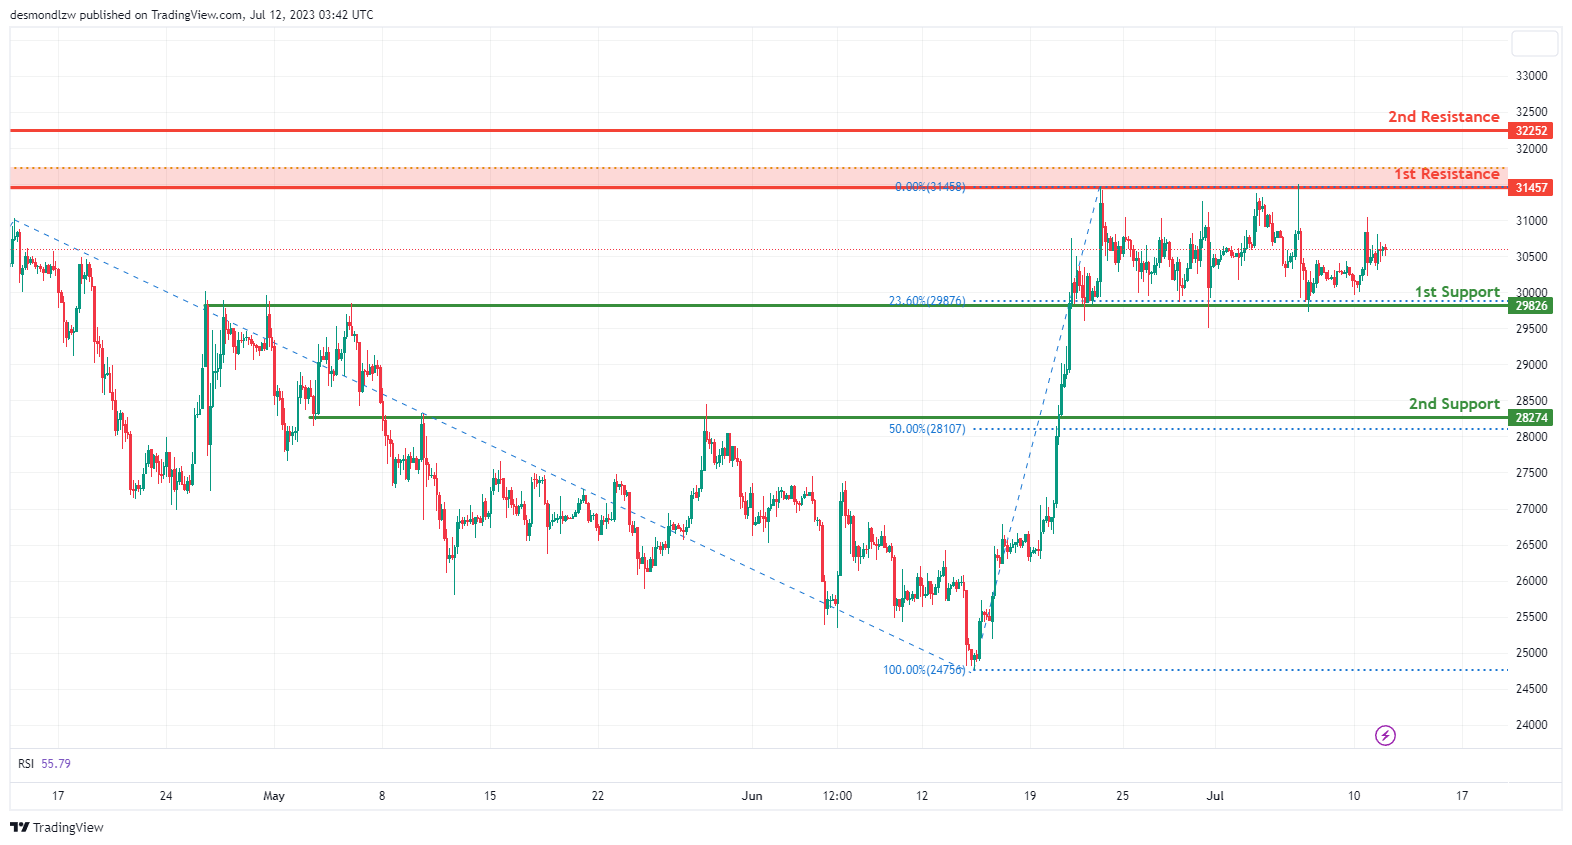
The BTC/USD instrument is currently showing a neutral overall momentum. It’s conceivable that the price might fluctuate between the 1st support and 1st resistance levels. The 1st support is positioned at 29826 and is viewed as strong due to its overlap support and a 23.60% Fibonacci Retracement.
The 2nd support, found at 28274, is also considered robust due to its overlap support and a 50% Fibonacci Retracement.
On the other hand, the 1st resistance is located at 31457 and is deemed significant owing to its multi-swing high resistance and a 61.80% Fibonacci Retracement. The 2nd resistance, at 32252, is notable for its swing high resistance nature, which could potentially pose a significant obstacle for any upward movement in price.
ETH/USD:
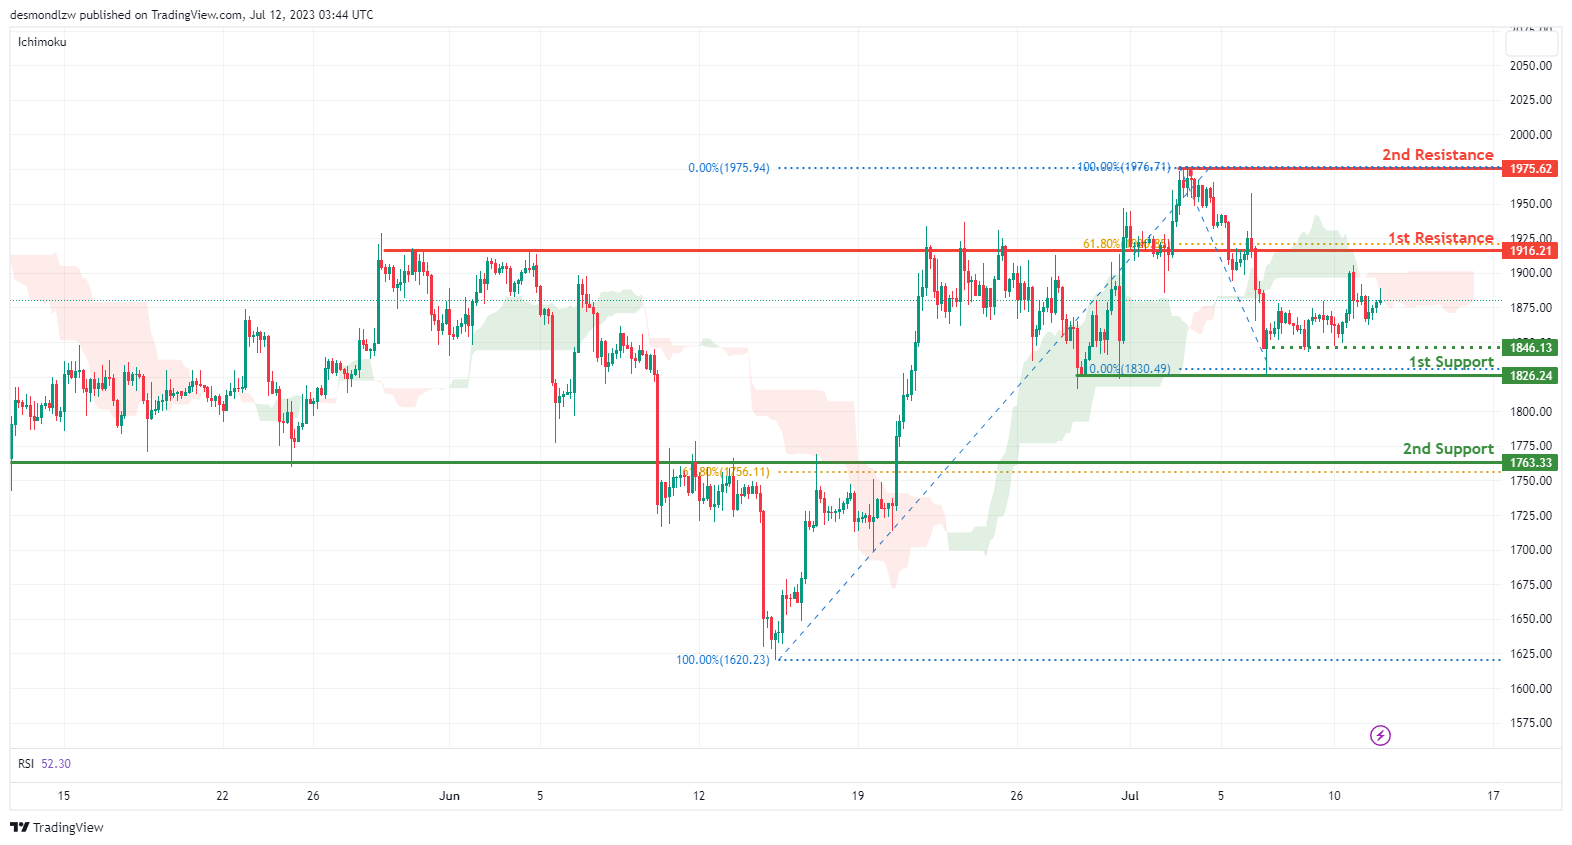
The ETH/USD instrument is currently on a bearish trend, largely attributed to the price trading below the bearish Ichimoku cloud.
As the trend proceeds, it’s probable that the price might continue on this bearish direction towards the 1st support, positioned at 1826.24. This support level is regarded as strong due to its character as a multi-swing low support.
Further on, the 2nd support stands at 1763.33 and is considered strong due to its overlap support and a 50% Fibonacci Retracement.
On the other hand, the 1st resistance is positioned at 1916.21 and is recognized as significant due to its overlap resistance and a 61.80% Fibonacci Retracement. The 2nd resistance, found at 1975.62, is also notable as it represents swing high resistance, and could potentially pose an obstacle to any upward price movements.
An intermediate support level is also noticeable at 1846.13, recognized as durable due to its status as a multi-swing low support.
WTI/USD:
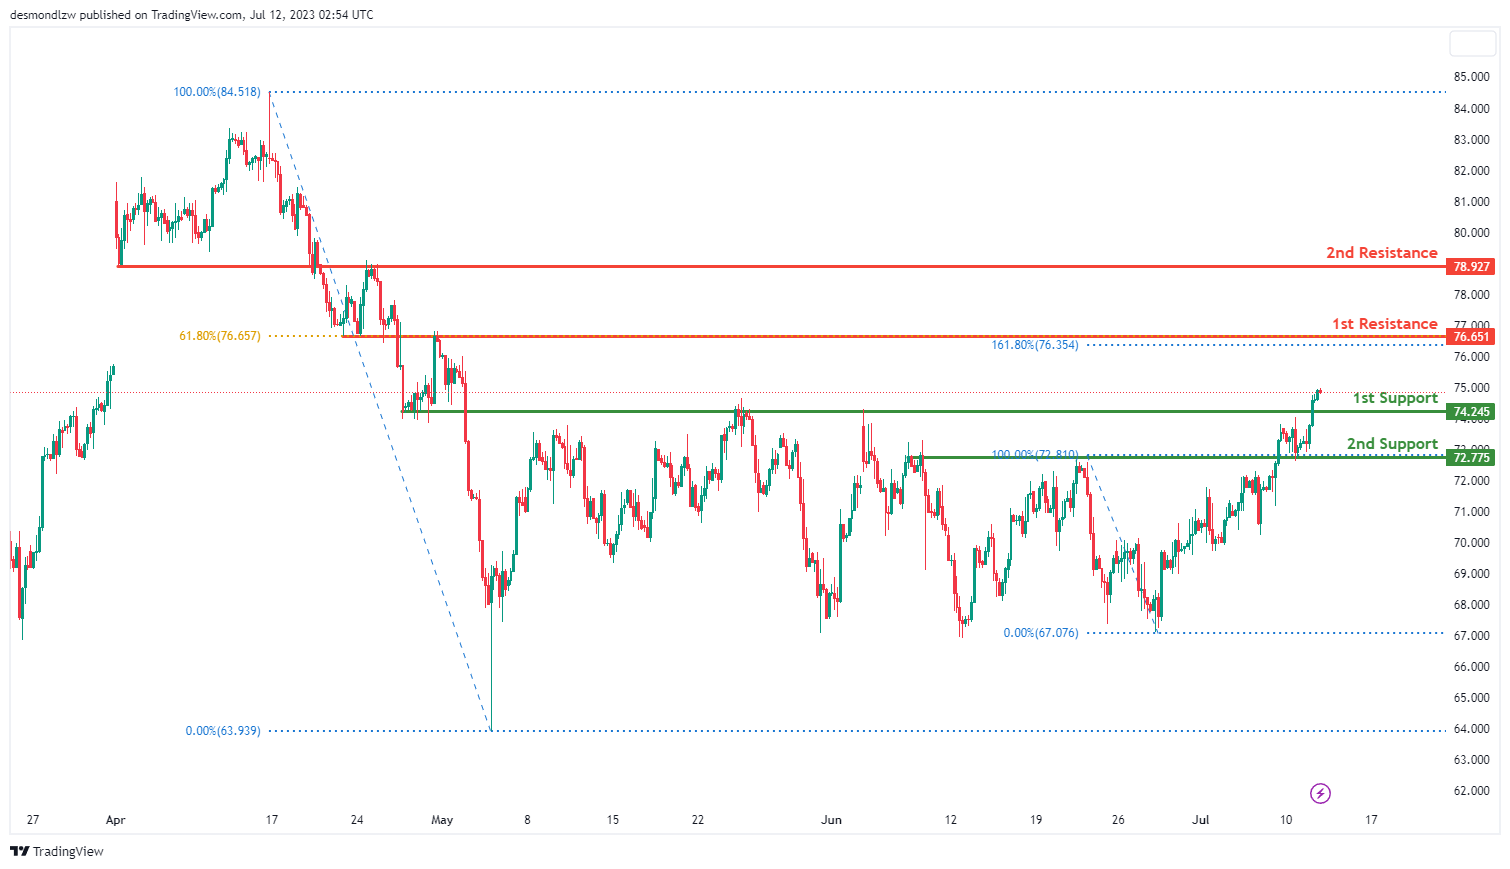
The WTI/USD pair is currently showing a bullish momentum, suggesting the possibility of a continued upward movement towards the 1st resistance level.
The 1st support level is found at 74.25 and is characterized as an overlap support. If the price were to drop, this level could act as a strong buffer.
Should the price fall below the 1st support, the 2nd support located at 72.78 stands as another overlap support, offering an additional layer of support.
Conversely, if the bullish momentum continues, the price may encounter the 1st resistance at 76.65. This level acts as an overlap resistance and aligns with a 61.8% Fibonacci retracement level and a 161.8% Fibonacci extension level, indicating a potential barrier for upward price movements.
If the price manages to break through the 1st resistance, it could aim for the 2nd resistance at 78.93. This level also presents as an overlap resistance, marking another significant point of potential resistance.
XAU/USD (GOLD):
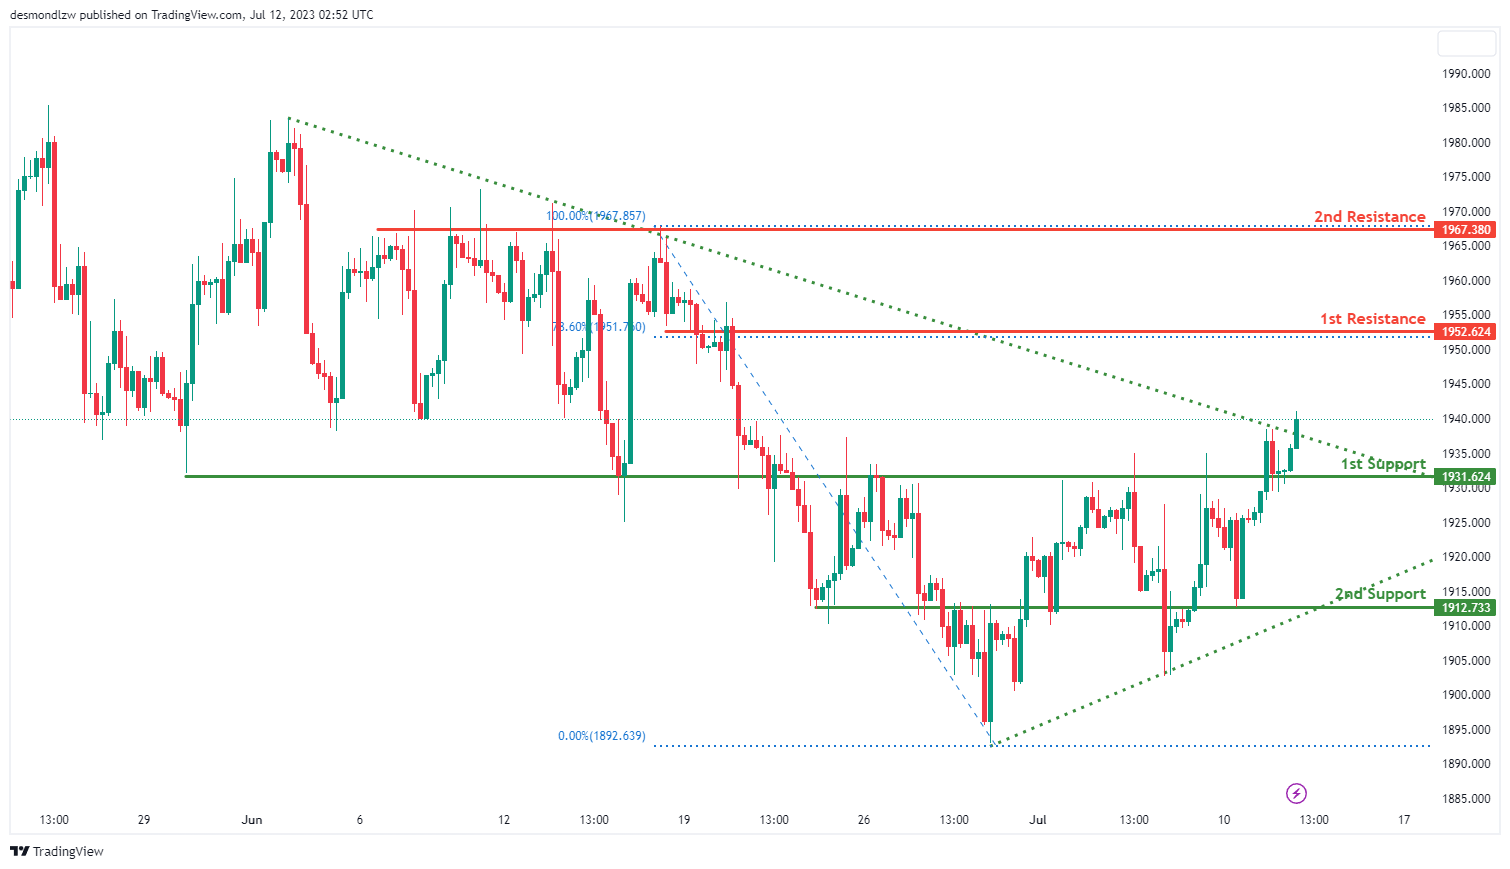
The XAU/USD pair currently exhibits a bullish momentum, a development triggered by a break above a descending resistance line which suggests a possible bullish continuation.
On the downside, if the price retreats, it could find substantial support at the 1st level of 1931.62, which is characterized as an overlap support. Further down, a 2nd support level is found at 1912.73, also serving as an overlap support.
On the upside, the price could potentially continue its bullish movement towards the 1st resistance level at 1952.62. This resistance level, characterized as an overlap resistance, aligns with a 78.60% Fibonacci retracement, further strengthening its significance.
Should the price breach this level, it might aim for the 2nd resistance level at 1967.38, which is another overlap resistance and could serve as a significant barrier to further price ascents.
GBP/USD Daily Outlook
Daily Pivots: (S1) 1.2880; (P) 1.2907; (R1) 1.2960; More...
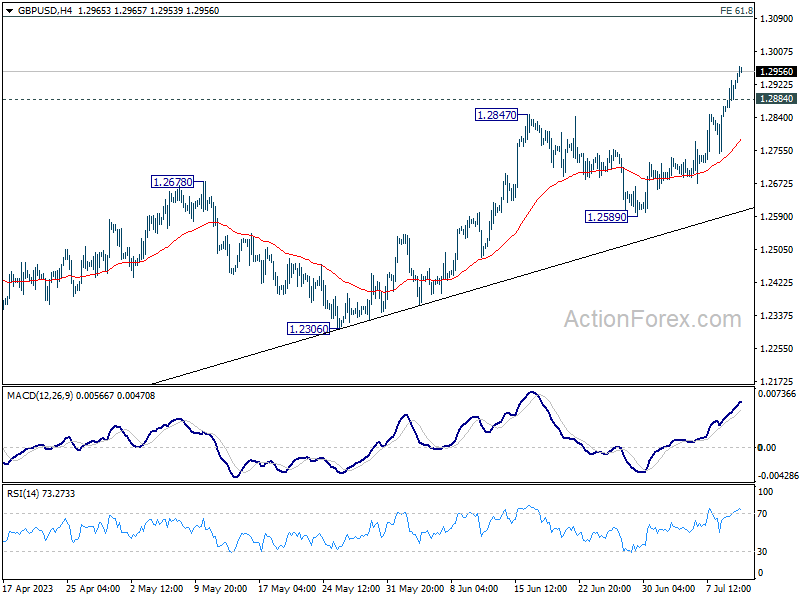
GBP/USD's rally continues today and hit as high as 1.2968 so far. Intraday bias remains on the upside for 61.8% projection of 1.0351 to 1.2445 from 1.1801 at 1.3095. On the downside, below 1.2884 minor support will turn intraday bias neutral and bring consolidations first, before staging another rally.
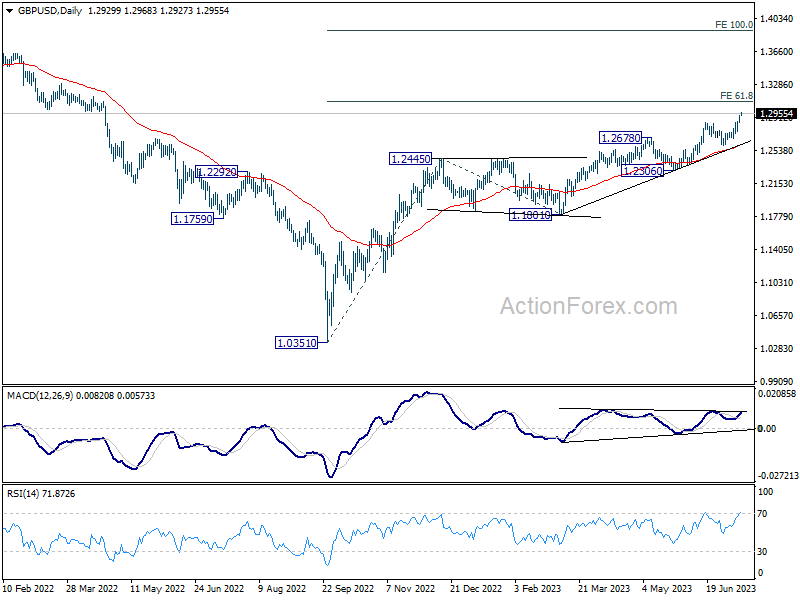
In the bigger picture, the strong support from 55 W EMA (now at 1.2341) is a medium term bullish sign. Outlook will stay bullish as long as 1.2306 support holds. Rise from 1.0351 medium term bottom (2022 low) is expected to extend further to retest 1.4248 key resistance (2021 high).
Dollar Slide Accelerates ahead of US CPI; BoC to Hike, RBNZ Stood Pat
Dollar is facing an intensified selloff in today's Asian trading session, with the currency's decline appearing to accelerate. The return of risk-on sentiment, signaled by overnight gains in major US stock indexes, has added additional weight on the greenback. Market watchers are eagerly anticipating the release of US CPI data today, as they seek further evidence to back their prediction that Fed's anticipated rate hike later this month could be the last in the current cycle.
Elsewhere in the currency markets, New Zealand Dollar is posting marginal gains after RBNZ held its rates steady, while Australian Dollar is also up slightly. But these gains are largely overshadowed by the impressive rally of Yen, which is building further momentum in a bullish reversal. On the other hand, Canadian Dollar is showing weakness ahead of BoC's anticipated rate hike today, despite it surpassing a near-term resistance against the US Dollar. Swiss Franc is exhibiting weakness for the time being too, whereas Euro and British Pound are experiencing a mixed trading session.
In Asia, at the time of writing, Nikkei is down -0.64%. Hong Kong HSI is up 1.08%. China Shanghai SSE is down -0.15%. Singapore Strait Times is up 0.52%. Japan 10-year JGB yield is up 0.018 at 0.474. Overnight, DOW rose 0.93%. S&P 500 rose 0.67%. NASDAQ rose 0.55%. 10-year yield dropped -0.026 to 3.980.
RBNZ holds OCR steady at 5.5%, expresses confidence in returning inflation to target range
In line with broad expectations, RBNZ keeps OCR unchanged at 5.5%, as tightening cycle has finally entered in to a pause phase.
RBNZ expressed its confidence in the current restrictive interest rate level, stating, "consumer price inflation will return to within its target range of 1 to 3% per annum, while supporting maximum sustainable employment."
When discussing their Remit objectives, the Committee noted that it still expects inflation to fall within the target band by the second half of 2024. Risks surrounding the inflation projection as being "broadly balanced". While employment remains above its maximum sustainable level, recent indicators suggest that "labour market conditions are easing."
RBNZ also acknowledged the slight contraction in economic activity in Q1. It added that "growth is likely to remain weak in the near term."
NZD/USD edges higher on Dollar weakness after RBNZ
NZD/USD inches higher today, following RBNZ decision to hold its interest rate steady at 5.50%. However, this uptick seems more driven by prevailing slight risk-on sentiment, and a weaker Dollar rather than the central bank's decision itself.
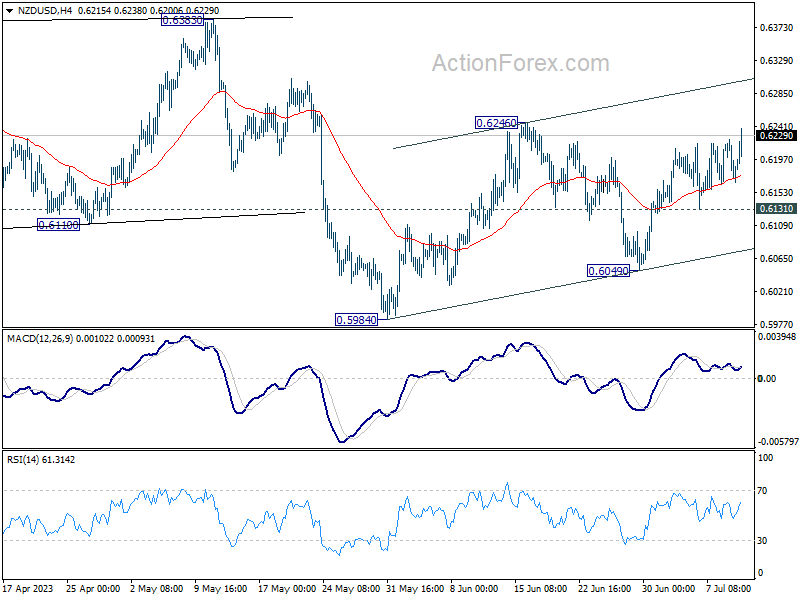
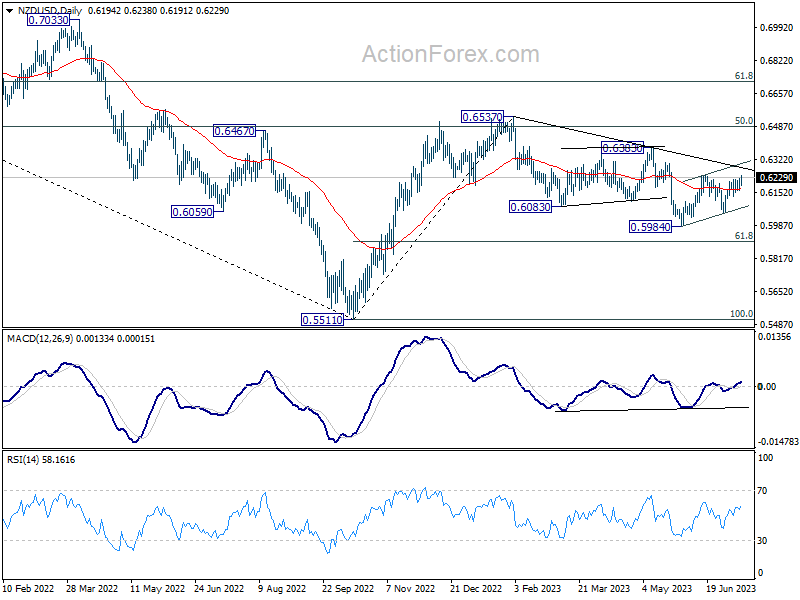
From a technical perspective, while further short-term rally in NZD/USD seems probable, there isn't yet a clear signal for bullish trend reversal. The pair remains capped below declining trend line, initiated from February's high of 0.6537. Moreover, price action from 0.5894 do not exhibit a clear impulsive structure, suggesting it could be merely a corrective pattern within the broader decline from 0.6537.
On the downside, break of 0.6131 support will argue that the fall from 0.6537 is ready to resume through 0.5984 low.
RBA Lowe: Further tightening possible, look into new forecasts in Aug
RBA Governor Philip Lowe noted the current economic outlook is a "complex picture" with significant uncertainties". He said in a speech today, "the Board decided that, having already increased rates substantially, it was appropriate to hold interest rates steady this month and re-examine the situation next month."
Looking ahead, Lowe noted, "It is possible that some further tightening will be required to return inflation to target within a reasonable timeframe," adding that requirement for further action will largely depend on evolution of the economy and inflation.
He highlighted that the Board will be provided with an updated set of economic forecasts, a revised risk assessment, and fresh data on inflation, the global economy, labour market, and household spending at the next meeting in August to inform its decision-making process.
He pointed to recent forecasts in May which saw inflation returning to top of target band in "mid-2025:. But he acknowledge, Data received since then had suggested that the inflation risks had shifted somewhat to the upside."
DOW staying bullish with overnight bounce, US CPI on radar
US major stock indexes rallied overnight, breaking a three-session losing streak as investors eagerly await June US consumer inflation report, expected later today. Economists forecast a moderation in headline CPI from 4.0% to 3.1%, with core CPI also expected to decelerate from 5.3% to 5.0%.
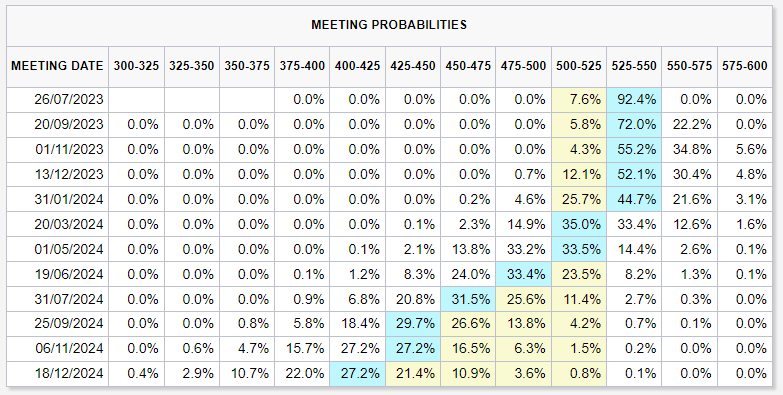
Market participants have already factored in a quarter-point hike at Fed's July 25-26 meeting, with an over 90% likelihood priced in. As it stands, the probability of an additional rate hike for the remaining part of the year is below 50%. These odds could shift depending on whether today's core CPI data undershoots, and by what margin.
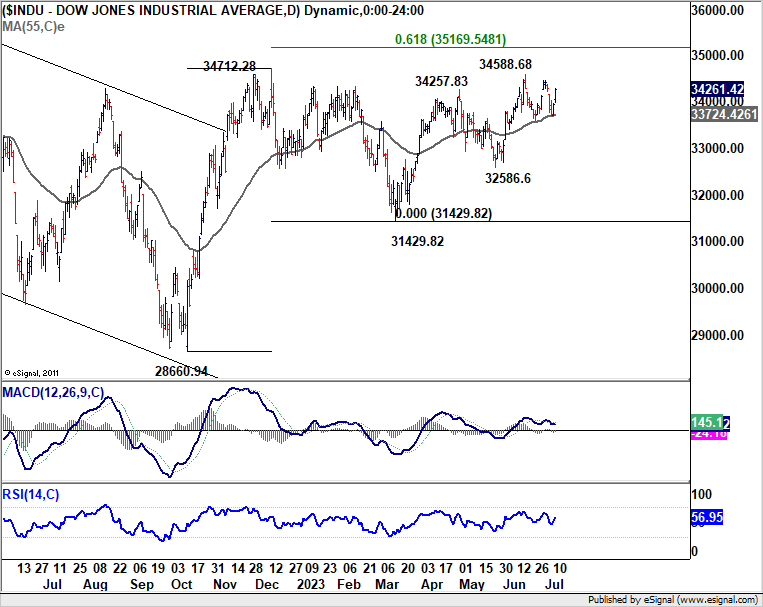
As for DOW, the strong support from 55 D EMA (now at 33724.42) is clearly a near term bullish sign. Break of 34588.68 resistance will confirm resumption of recent rally. But the real test would lie in 61.8% projection of 28660.94 to 34712.28 from 31429.82 at 35169.54. Clear break of this projection level is needed to set the stage for further rally in the rest of H2. Meanwhile, a dip today or in the near term wouldn't be disastrous as long as 32586.66 support stays intact.
BoC to hike but what next? CAD/JPY extending near term fall
As BoC is widely expected to raise interest rates by another 25 bps to 5.00% today, the financial market awaits the answer on whether this move marks the end of the current tightening cycle. The hike today is expected after the bank restarted tightening last month, with many speculating that terminal rate could be reached with this adjustment.
However, the future pathway is fraught with uncertainties, and the key focus will be on how BoC chooses to communicate its stance. There are anticipations that Governor Tiff Macklem may maintain a hawkish tone, keeping options open and underscoring the bank's determination to combat inflation that continues to overshoot target. Alternatively, the bank may more explicitly signal another "conditional pause", like it did in January. Regardless of the approach, the new economic forecasts to be released today will be crucial in underpinning their message.
Some previews on BoC:
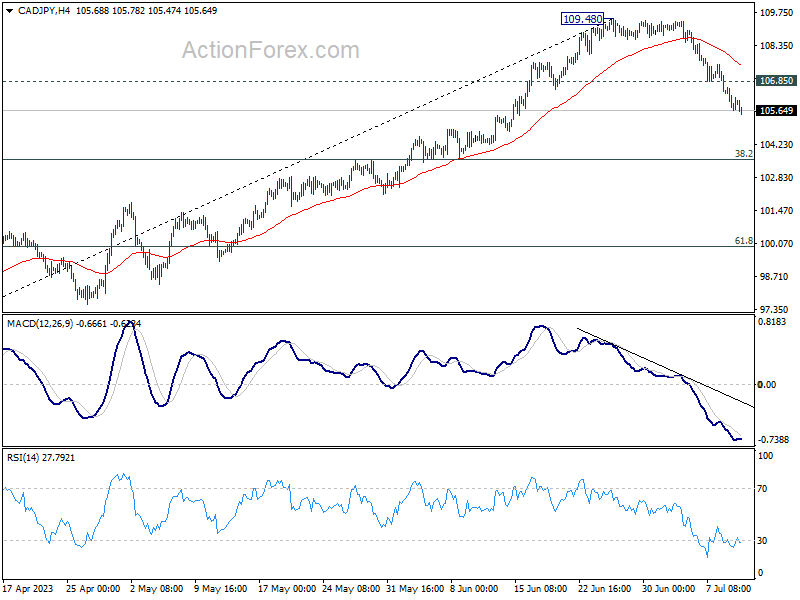
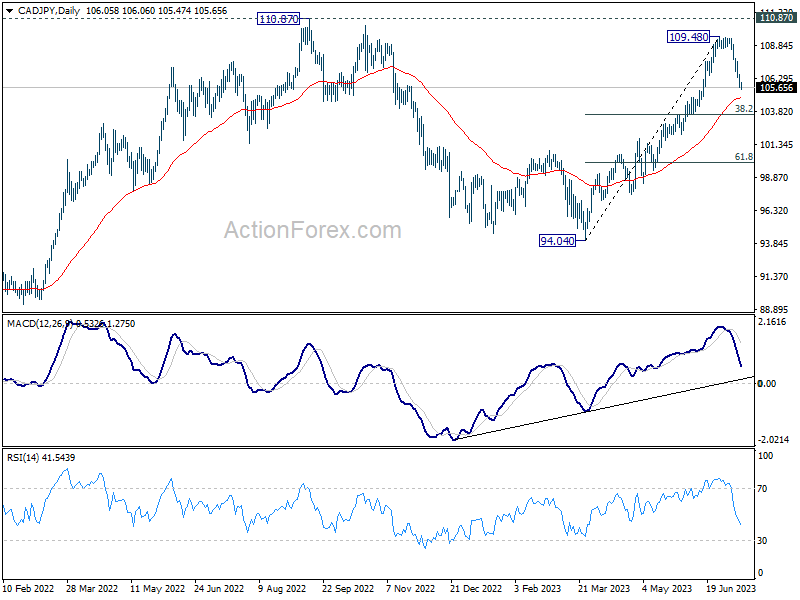
CAD/JPY is continuing the fall from 109.48 short term top today. The favored case is that this decline from 109.48 is the third leg of the pattern from 110.87 high. Sustained break of 55 D EMA (now at 104.86) would solidify this bearish case and target 38.2% retracement of 94.04 to 109.48 at 103.58 next. Break of 106.85 minor resistance will mix up the outlook and bring recovery first. But even in this case, risk will stay mildly on the downside as long as 109.48 resistance holds.
GBP/USD Daily Outlook
Daily Pivots: (S1) 1.2880; (P) 1.2907; (R1) 1.2960; More...
GBP/USD's rally continues today and hit as high as 1.2968 so far. Intraday bias remains on the upside for 61.8% projection of 1.0351 to 1.2445 from 1.1801 at 1.3095. On the downside, below 1.2884 minor support will turn intraday bias neutral and bring consolidations first, before staging another rally.
In the bigger picture, the strong support from 55 W EMA (now at 1.2341) is a medium term bullish sign. Outlook will stay bullish as long as 1.2306 support holds. Rise from 1.0351 medium term bottom (2022 low) is expected to extend further to retest 1.4248 key resistance (2021 high).
Economic Indicators Update
| GMT | Ccy | Events | Actual | Forecast | Previous | Revised |
|---|---|---|---|---|---|---|
| 23:50 | JPY | PPI Y/Y Jun | 4.10% | 4.50% | 5.10% | 5.20% |
| 23:50 | JPY | Machinery Orders M/M May | -7.60% | 1.20% | 5.50% | |
| 02:00 | NZD | RBNZ Interest Rate Decision | 5.50% | 5.50% | 5.50% | |
| 12:30 | USD | CPI M/M Jun | 0.30% | 0.10% | ||
| 12:30 | USD | CPI Y/Y Jun | 3.10% | 4.00% | ||
| 12:30 | USD | CPI Core M/M Jun | 0.30% | 0.40% | ||
| 12:30 | USD | CPI Core Y/Y Jun | 5.00% | 5.30% | ||
| 14:00 | CAD | BoC Interest Rate Decision | 5.00% | 4.75% | ||
| 14:30 | USD | Crude Oil Inventories | -1.1M | -1.5M | ||
| 15:00 | CAD | BoC Press Conference | ||||
| 18:00 | USD | Fed's Beige Book |
DOW staying bullish with overnight bounce, US CPI on radar
US major stock indexes rallied overnight, breaking a three-session losing streak as investors eagerly await June US consumer inflation report, expected later today. Economists forecast a moderation in headline CPI from 4.0% to 3.1%, with core CPI also expected to decelerate from 5.3% to 5.0%.
Market participants have already factored in a quarter-point hike at Fed's July 25-26 meeting, with an over 90% likelihood priced in. As it stands, the probability of an additional rate hike for the remaining part of the year is below 50%. These odds could shift depending on whether today's core CPI data undershoots, and by what margin.
As for DOW, the strong support from 55 D EMA (now at 33724.42) is clearly a near term bullish sign. Break of 34588.68 resistance will confirm resumption of recent rally. But the real test would lie in 61.8% projection of 28660.94 to 34712.28 from 31429.82 at 35169.54. Clear break of this projection level is needed to set the stage for further rally in the rest of H2. Meanwhile, a dip today or in the near term wouldn't be disastrous as long as 32586.66 support stays intact.
BoC to hike but what next? CAD/JPY extending near term fall
As BoC is widely expected to raise interest rates by another 25 bps to 5.00% today, the financial market awaits the answer on whether this move marks the end of the current tightening cycle. The hike today is expected after the bank restarted tightening last month, with many speculating that terminal rate could be reached with this adjustment.
However, the future pathway is fraught with uncertainties, and the key focus will be on how BoC chooses to communicate its stance. There are anticipations that Governor Tiff Macklem may maintain a hawkish tone, keeping options open and underscoring the bank's determination to combat inflation that continues to overshoot target. Alternatively, the bank may more explicitly signal another "conditional pause", like it did in January. Regardless of the approach, the new economic forecasts to be released today will be crucial in underpinning their message.
Some previews on BoC:
CAD/JPY is continuing the fall from 109.48 short term top today. The favored case is that this decline from 109.48 is the third leg of the pattern from 110.87 high. Sustained break of 55 D EMA (now at 104.86) would solidify this bearish case and target 38.2% retracement of 94.04 to 109.48 at 103.58 next. Break of 106.85 minor resistance will mix up the outlook and bring recovery first. But even in this case, risk will stay mildly on the downside as long as 109.48 resistance holds.