Sample Category Title
USD/JPY Mid-Day Outlook
Daily Pivots: (S1) 140.74; (P) 141.87; (R1) 142.47; More...
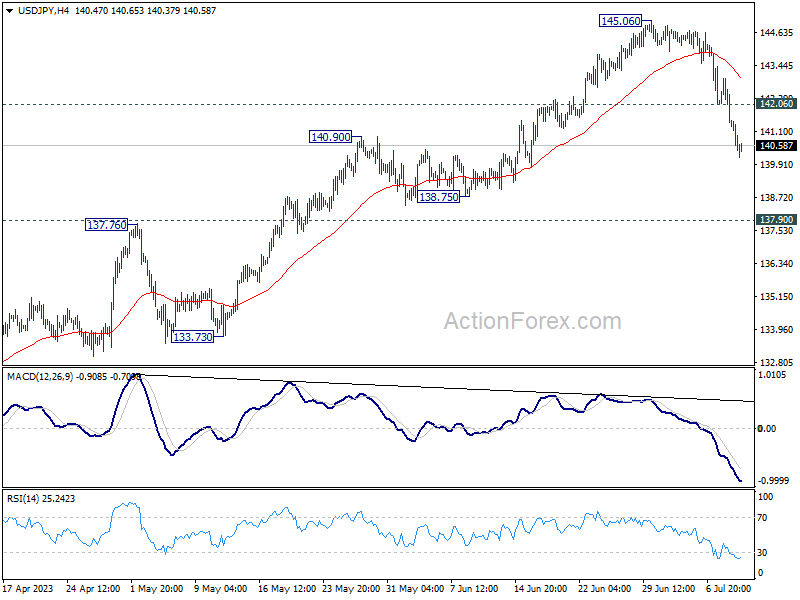
Intraday bias in USD/JPY remains on the downside as fall from 145.06 is in progress for 137.90 resistance turned support. Decisive break there will confirm the larger bearish case. On the upside, above 142.06 minor resistance will turn intraday bias neutral and bring consolidations first, before staging another fall.
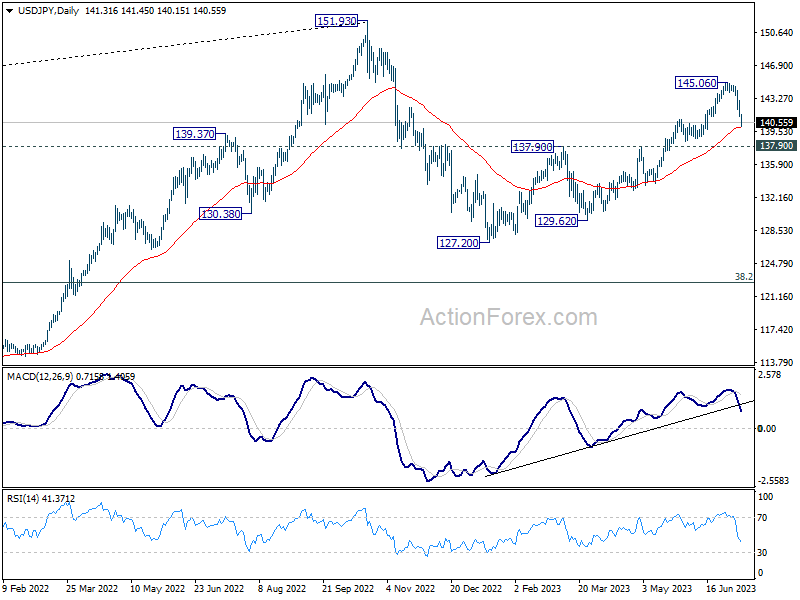
In the bigger picture, current downside acceleration, as seen in daily MACD, argues that fall from 145.06 is already the third leg of the corrective pattern from 151.93 (2022 high). Sustained break of 137.90 resistance turned support should confirm this case and target 127.20 (2023 low) and below. For now, this will remain the favored case as long as 145.06 resistance holds.
EUR/GBP Mid-Day Outlook
Daily Pivots: (S1) 0.8535; (P) 0.8559; (R1) 0.8579; More...
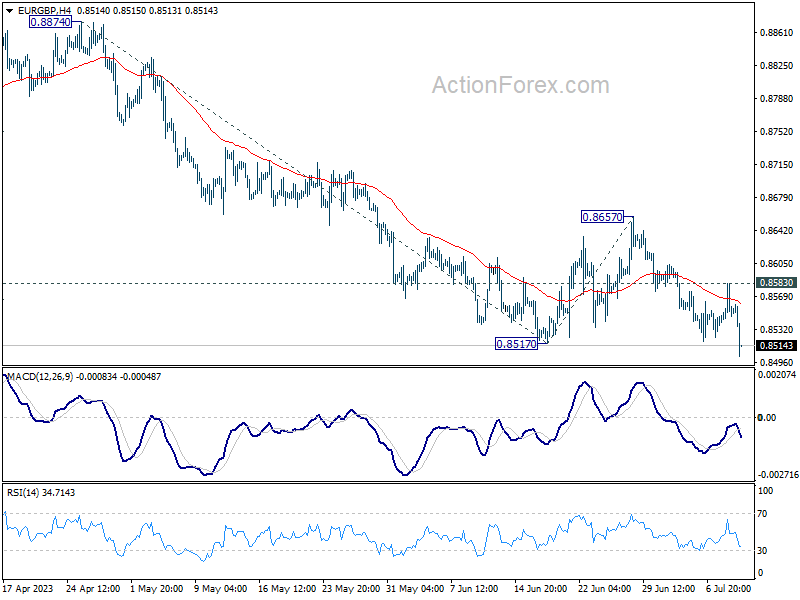
Break of 0.8517 in EUR/GBP indicates resumption of recent down trend. Intraday bias is back on the downside for 61.8% projection of 0.8874 to 0.8517 from 0.8650 at 0.8436. On the upside, above 0.8583 minor resistance will turn intraday bias neutral first. But near term outlook will remain bearish as long as 0.8657 resistance holds, in case of recovery.
In the bigger picture, the down trend from 0.9267 (2022 high) is still in progress. It's seen as part of the long term range pattern from 0.9499 (2020 high). Deeper fall could be seen towards 0.8201 (2022 low). But strong support should be seen from there to bring reversal. This will now remain the favored case as long as 0.8657 resistance holds.
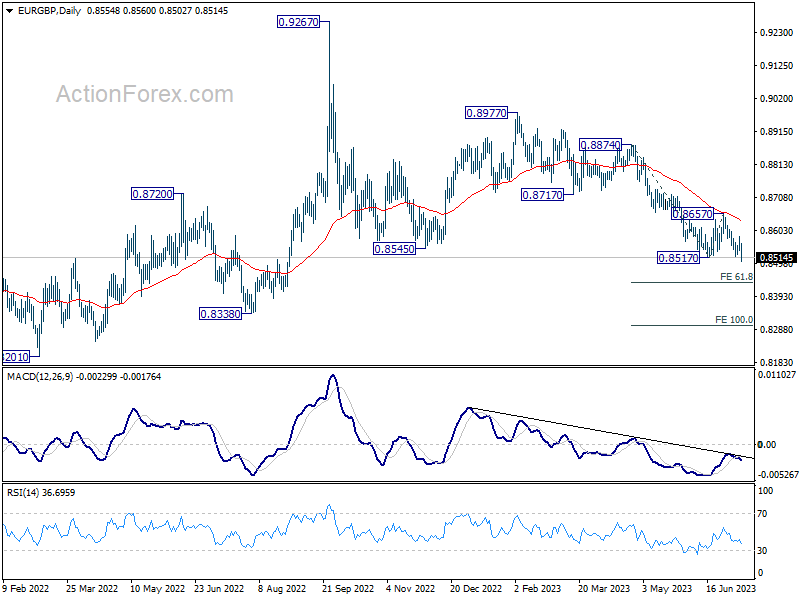
EUR/GBP Downside Breakout on Robust UK Wage Growth, Poor Eurozone Economic Sentiment
British Pound sees a broad rally today, fueled by robust wage growth, indicating that secondary inflationary pressure remains persistent, which will likely force BoE to continue tightening. In contrast, Euro fell sharply due to plunging economic sentiment, leading to a downside breakout in EUR/GBP, resuming its recent downward trend.
As it stands, Yen remains the top performer, slightly edging out the Pound. Swiss Franc is not far behind, benefitting from an influx of buyers from Euro. Australian and New Zealand Dollar are underperforming, even falling behind the weakened Euro. Dollar presents a mixed picture, with a recovery against Euro, range trading against commodity currencies, but weak against Sterling, Swiss Franc, and Yen.
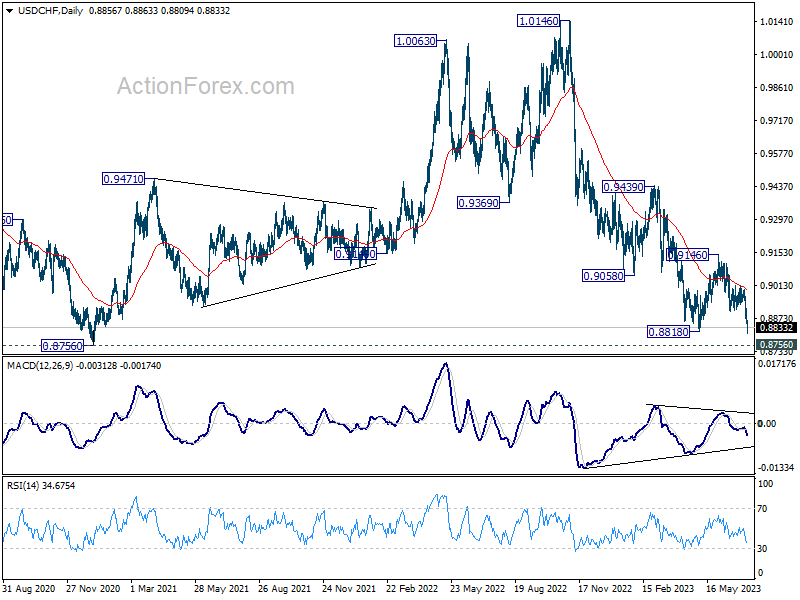
Technically, with breach of 0.8818 support, USD/CHF is now having 0.8756 (2021 low). Ideally, strong support should be seen from 0.8756 to bring bullish trend reversal, to extend the long term sideway pattern. However, decisive break of 0.8756 will be a strong sign persistent long term bullishness in the France. If realized, that would likely be accompanied by extended fall in EUR/CHF too.
In Europe, at the time of writing, FTSE is down -0.10%. DAX is up 0.75%. CAC is up 1.27%. Germany 10-year yield is down -0.015 at 2.627. Earlier in Asia, Nikkei rose 0.04%. Hong Kong HSI is up 0.97%. China Shanghai SSE rose 0.55%. Singapore Strait Times rose 0.46%. Japan 10-year JGB yield dropped -0.0168 to 0.456.
Germany ZEW plunged on higher interest and weak export markets
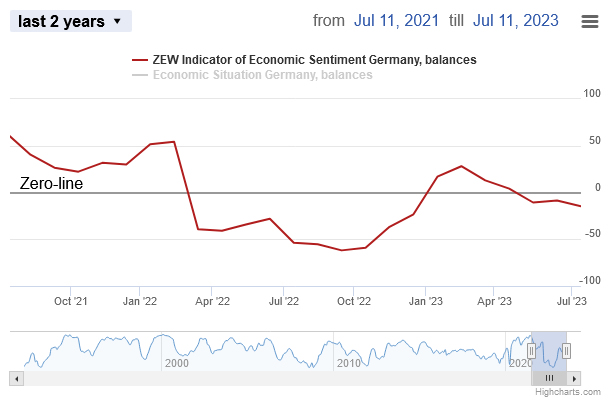
Germany's ZEW Economic Sentiment for July plunged significantly, from -8.5 to -14.7, far underperforming the expected -9.5. Additionally, Current Situation Index dropped from -56.5 to -59.5, a decline which was marginally better than anticipated -60.0.
Similarly, Eurozone's ZEW Economic Sentiment also fell from -10 to -12.2 in July, coming in under the anticipated -10.2. Current Situation Index also took a dip, decreasing by -2.5 points to -44.4.
ZEW President Achim Wambach expressed concern over the economic outlook, stating: "The ZEW Indicator of Economic Sentiment is shifting even more noticeably into negative territory. Financial market experts predict a further deterioration in the economic situation by year-end."
According to Wambach, key drivers for this economic pessimism include the anticipated rise in short-term interest rates in Eurozone and US, as well as a perceived weakness in important export markets like China.
He noted: "The industrial sectors are likely to bear the brunt of the anticipated economic downturn, with profit expectations for these export-oriented industries experiencing a substantial decline once again."
UK payrolled employment down -9k in Jun, median pay accelerated to 9.7% yoy
In June, UK payrolled employment decreased by -9k, comparing with May. But payrolled employment was still up 439k comparing with the same month last year. Median monthly pay was up 9.7% yoy, accelerated from May's 8.4% yoy. Claimant count rose 25.7k, above expectation of 20.5k.
In the three months to May, unemployment rate rose 0.2% to 4.0% compared with the previous three month period. Employment rate rose 0.2% to 76.0%. Economic inactivity rate was down -0.4% to 20.8%. Total weekly hours rose 4.5%. Average earnings including bonus rose 6.9, up from April's 6.7%. Average earnings excluding bonus rose 7.3%, same as the prior period.
Australia's Westpac consumer sentiment up 2.7% mom, but pessimism still prevails
Westpac-MI Consumer Sentiment Index in Australia witnessed a modest 2.7% mom increase in July, rising to 81.3. However, the index remains entrenched the deeply pessimistic territory, a condition that has prevailed for over a year now.
According to Westpac, the main driving force behind this month's uplift is easing in monthly inflation, which dipped from 6.8% in April to 5.6% in May.
RBA decision to pause in July, however, failed to instill confidence. In fact, the sentiment was considerably more buoyant before the decision, with an index reading of 88, marking an 11.2% rise from June. Post-RBA responses, on the other hand, presented a combined index reading of 77.9, a dip of -11.6% from the pre-RBA sample and a -1.6% fall from June's reading.
Westpac's key message is clear: "Sentiment is probably not going to stage a sustained lift from current deeply pessimistic levels until inflation is much lower and interest rates are firmly on hold."
Looking ahead to the RBA's next meeting on August 1, Westpac expects that if annual underlying inflation prints around 6.1% for the June quarter, and if the unemployment rate continues to hold well below full employment, the case for higher rates will be clear.
As such, Westpac anticipates that RBA Board will raise cash rate by 0.25% at both August and September Board meetings, followed by a prolonged pause. The first rate cut in the subsequent easing cycle is expected next May.
EUR/GBP Mid-Day Outlook
Daily Pivots: (S1) 0.8535; (P) 0.8559; (R1) 0.8579; More...
Break of 0.8517 in EUR/GBP indicates resumption of recent down trend. Intraday bias is back on the downside for 61.8% projection of 0.8874 to 0.8517 from 0.8650 at 0.8436. On the upside, above 0.8583 minor resistance will turn intraday bias neutral first. But near term outlook will remain bearish as long as 0.8657 resistance holds, in case of recovery.
In the bigger picture, the down trend from 0.9267 (2022 high) is still in progress. It's seen as part of the long term range pattern from 0.9499 (2020 high). Deeper fall could be seen towards 0.8201 (2022 low). But strong support should be seen from there to bring reversal. This will now remain the favored case as long as 0.8657 resistance holds.
Economic Indicators Update
| GMT | Ccy | Events | Actual | Forecast | Previous | Revised |
|---|---|---|---|---|---|---|
| 23:01 | GBP | BRC Like-For-Like Retail Sales Y/Y Jun | 4.20% | 3.70% | ||
| 23:50 | JPY | Money Supply M2+CD Y/Y Jun | 2.60% | 2.70% | 2.70% | |
| 00:30 | AUD | Westpac Consumer Confidence Jul | 2.70% | 0.20% | ||
| 01:30 | AUD | NAB Business Conditions Jun | 9 | 8 | ||
| 01:30 | AUD | NAB Business Confidence Jun | 0 | -4 | ||
| 06:00 | GBP | Claimant Count Change Jun | 25.7K | 20.5K | -13.6K | -22.5K |
| 06:00 | GBP | ILO Unemployment Rate (3M) May | 4.00% | 3.80% | 3.80% | |
| 06:00 | GBP | Average Earnings Including Bonus 3M/Y May | 6.90% | 6.80% | 6.50% | 6.70% |
| 06:00 | GBP | Average Earnings Excluding Bonus 3M/Y May | 7.30% | 7.10% | 7.20% | 7.30% |
| 06:00 | EUR | Germany CPI M/M Jun F | 0.30% | 0.30% | 0.30% | |
| 06:00 | EUR | Germany CPI Y/Y Jun F | 6.40% | 6.40% | 6.40% | |
| 08:00 | EUR | Italy Industrial Output M/M May | 1.60% | 0.90% | -1.90% | -2.00% |
| 09:00 | EUR | Germany ZEW Economic Sentiment Jul | -14.7 | -9.5 | -8.5 | |
| 09:00 | EUR | Germany ZEW Current Situation Jul | -59.5 | -60 | -56.5 | |
| 09:00 | EUR | Eurozone ZEW Economic Sentiment Jul | -12.2 | -10.2 | -10 | |
| 10:00 | USD | NFIB Business Optimism Index Jun | 91 | 89.9 | 89.4 |
Germany ZEW plunged on higher interest and weak export markets
Germany's ZEW Economic Sentiment for July plunged significantly, from -8.5 to -14.7, far underperforming the expected -9.5. Additionally, Current Situation Index dropped from -56.5 to -59.5, a decline which was marginally better than anticipated -60.0.
Similarly, Eurozone's ZEW Economic Sentiment also fell from -10 to -12.2 in July, coming in under the anticipated -10.2. Current Situation Index also took a dip, decreasing by -2.5 points to -44.4.
ZEW President Achim Wambach expressed concern over the economic outlook, stating: "The ZEW Indicator of Economic Sentiment is shifting even more noticeably into negative territory. Financial market experts predict a further deterioration in the economic situation by year-end."
According to Wambach, key drivers for this economic pessimism include the anticipated rise in short-term interest rates in Eurozone and US, as well as a perceived weakness in important export markets like China.
He noted: "The industrial sectors are likely to bear the brunt of the anticipated economic downturn, with profit expectations for these export-oriented industries experiencing a substantial decline once again."
UK 100 Cash Index Sell-off Halts Near March 2023 Lows
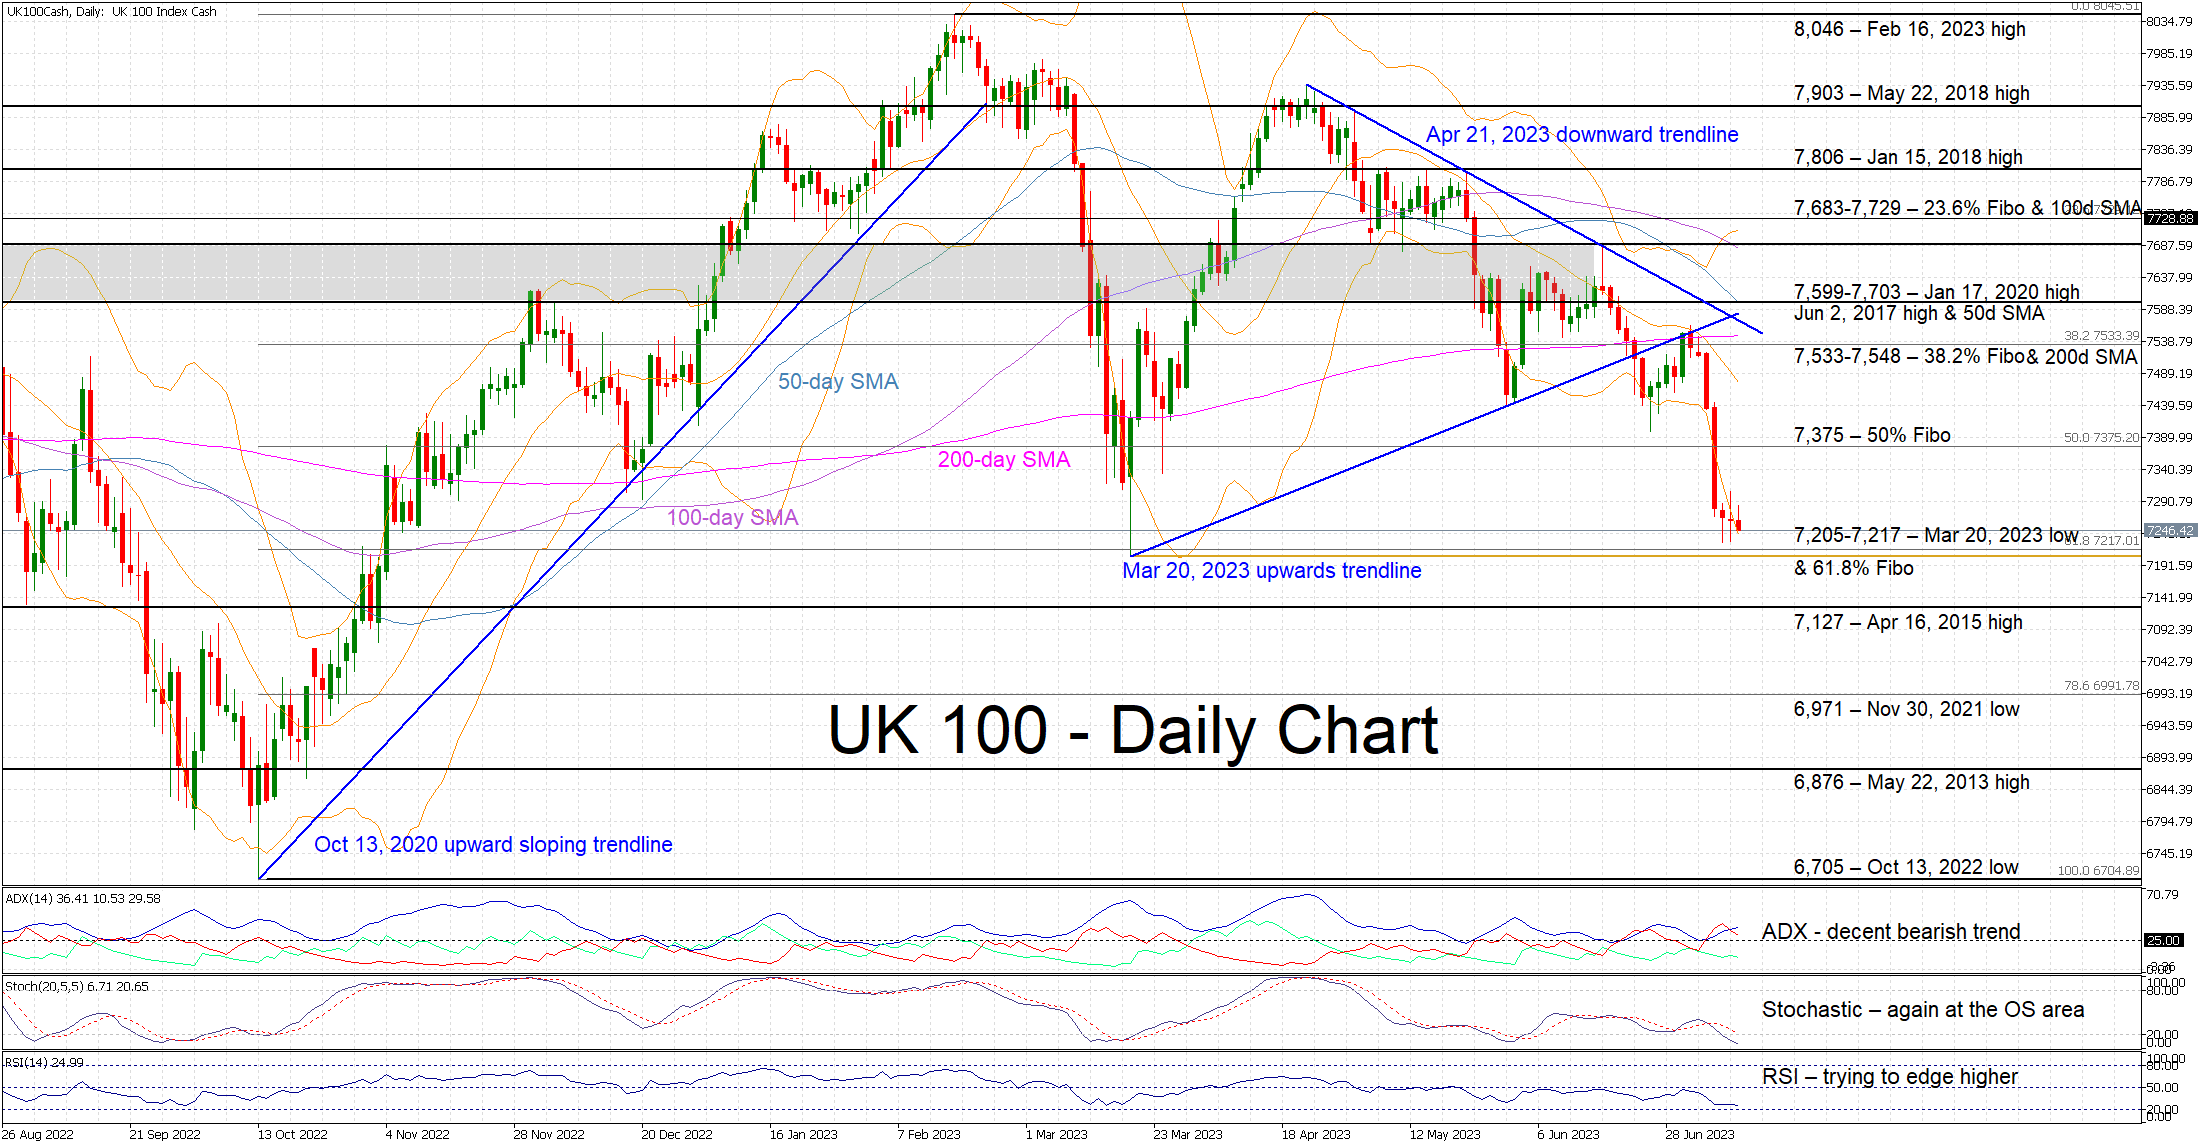
The UK 100 cash index is trading sideways today following an aggressive sell-off since the July 3 local peak. The index has actually been experiencing a series of lower highs and lower lows since April 21, 2023, religiously obeying a downward sloping trendline. It is now hovering a tad above the March 20, 2023 low, potentially the first major stock index to revisit these lows.
The current downleg enjoys the support of most momentum indicators. More specifically, the Average Directional Movement Index (ADX) is moving higher and thus pointing to a decent bearish trend in the market. However, a few cracks have been appearing. The RSI traded at its lowest level since March 16 and it is now trying to edge higher. In addition, the stochastic oscillator has moved back inside its oversold area. While it can stay there for a while, this move is usually seen as an early sell-off exhaustion signal.
Should the bears decide to continue their push lower, they would come up against the 7,205-7,217 range that is defined by the March 20, 2023 low and the 61.8% Fibonacci retracement level of the October 13, 2022 – February 16, 2023 uptrend respectively. If successful, they could then have the chance to test the support set by the April 16, 2015 high at 7,127.
On the flip side, the bulls are desperate for a small recovery move towards the 50% Fibonacci retracement at 7,375. They could then set their eyes higher at the 7,533-7,548 area populated by the 200-day simple moving average (SMA) and the 38.2% Fibonacci retracement. However, a break of the busier 7,599-7,703 range is probably needed to change the current bearish market sentiment.
To sum up, the UK 100 cash index remains under bearish pressure as the bulls are trying to draw a line in the sand. A break of the March 2023 lows could lead to another significant downleg.
BoE Has Cause for Optimism in UK Jobs Report
UK jobs data this morning is a mixed bag on the face of it but a deeper dive into the numbers may give the BoE more cause for optimism than pessimism.
The earnings component of the report, while continuing to partly shield households from soaring inflation, is the part the MPC will be most concerned about. Getting inflation back to 2% on a sustainable basis simply won't happen unless that wage growth falls dramatically and instead, it's still rising, reaching 6.9% including bonuses and 7.3% without. The revisions to the April figures will not be welcome by the BoE either.
That said, there is plenty within this report to suggest the trend in wages will soon reverse which will give the MPC cause for optimism. Unemployment in the three months to May jumped to 4%, 0.5% from its low nine months ago and steadily rising. There are other signs too that labour market tightness is easing, like falling vacancies to unemployment and lower inactivity as people are drawn back into the labour force due to high inflation.
While this isn't hampering wage growth yet, it almost certainly will as bargaining power shifts and inflation falls. Lower energy and food prices, alone, should drive inflation down considerably over the coming months and that will filter into wage numbers over time which will give the BoE some confidence that pressures will ease.
The pound has been quite volatile in the aftermath of the data which probably reflects the mixed nature of it. It is trading a little higher on the day still, even as yields are marginally lower. Markets still expect the BoE to hike rates by another 1.25% over the next few quarters, including a significant chance of another 50 basis point move next month. Of course, those expectations could be pared back if we do finally start to see progress on the inflation front.
Oil steadies after hitting one-month high
Oil prices are a little flat today after paring earlier gains. Brent hit a one-month high on Monday after breaking above the 21 June peak, bringing an end to a series of lower highs that had contributed to the consolidation we've seen in recent months.
While it is still trading around the range highs since early May, the break of the recent high could be viewed as a bullish step that could give it the momentum to break back above $80. It has now run into resistance again around the late-May and early-June highs near $79 but the rally still has momentum at this stage.
Gold edging higher ahead of US inflation report
Gold appears to have found some support again in recent days after rebounding twice around $1,900. The US jobs report was one possible risk event that could have triggered a big move in gold, one way or another, and the other is due tomorrow in the shape of the US inflation report.
It seems gold bulls are feeling a little more confident, although $1,940 still poses a test having been a notable area of support in late May and the first half of June. We could just be seeing a corrective move after such a strong pullback from the highs in May, although a strong inflation number again tomorrow could send it lower once more.
NZD/USD Dips ahead of RBNZ Rate Decision
- New Zealand central bank expected to pause after 12 consecutive hikes
- New Zealand Manufacturing PMI expected to show manufacturing is stalled
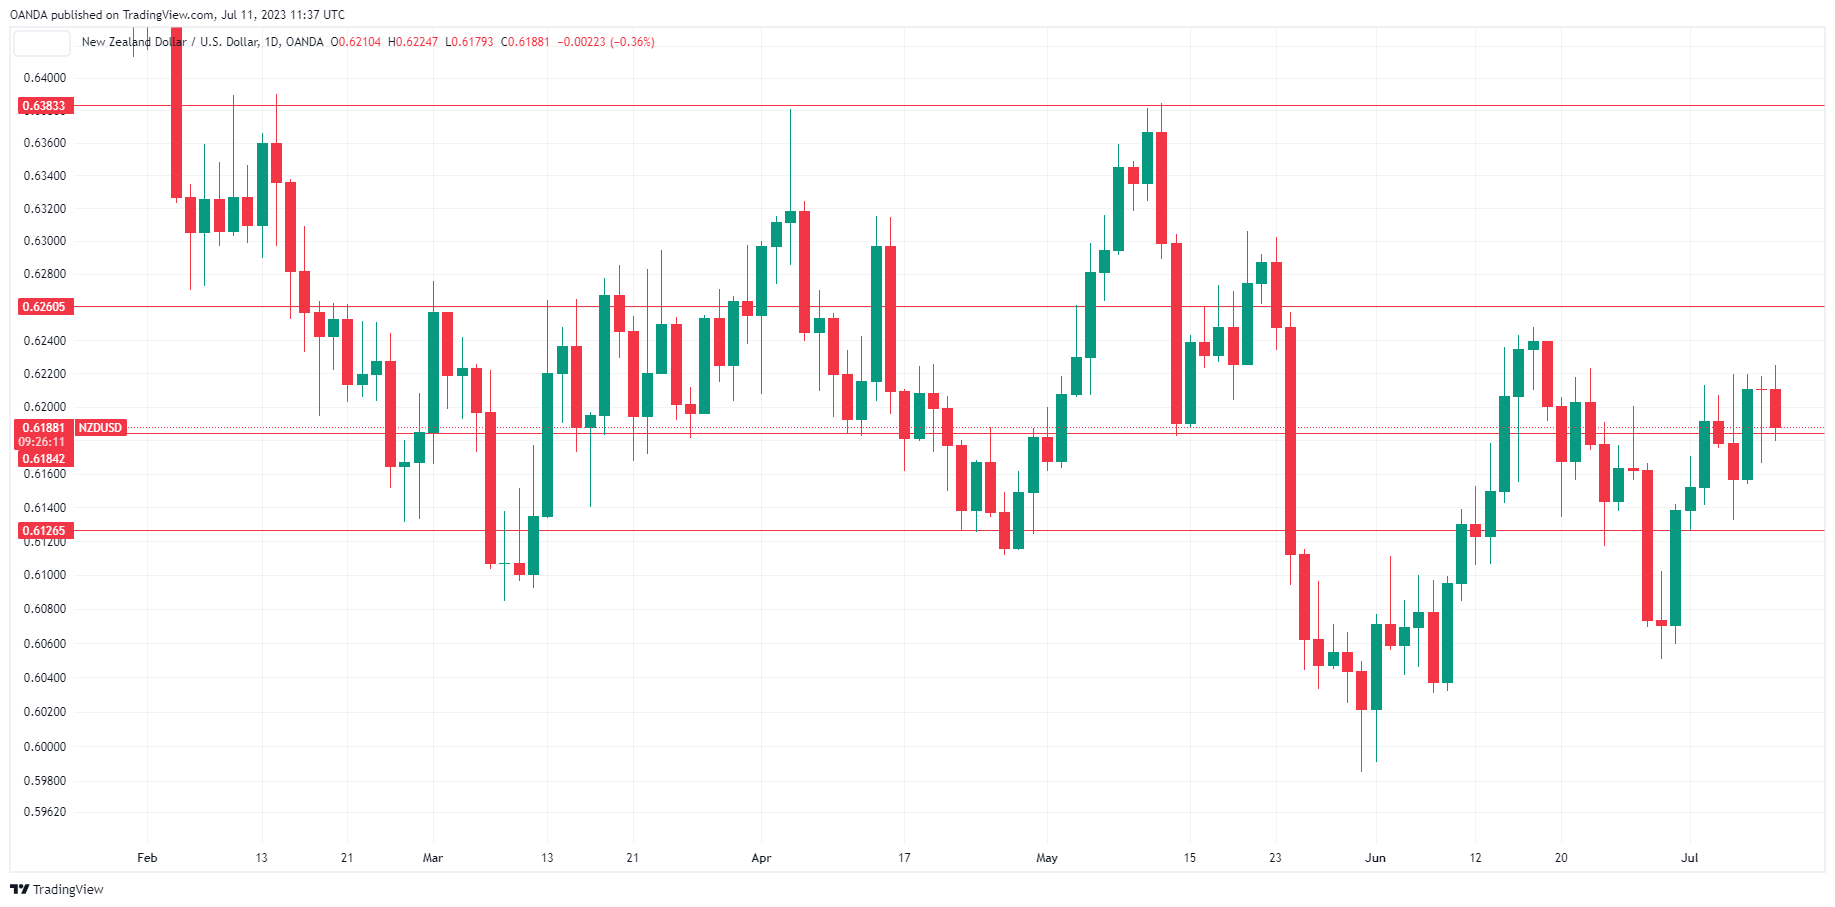
The New Zealand dollar is lower on Tuesday. In the European session, NZD/USD is trading at 0.6189, down 0.35%.
RBNZ expected to take a pause
The Reserve Bank of New Zealand will be in the spotlight on Wednesday. The central bank holds its policy meeting and is expected to leave the official cash rate unchanged at 5.5%. The RBNZ has raised rates 12 consecutive times since August 2021 but has signalled that it’s time for a breather. Shortly after the May hike, Deputy Governor Hawkesby said that there would be a “high bar” for the RBNZ to continue raising rates. The RBNZ won’t be issuing a rate statement and there may not be much for the markets to digest other than the expected pause.
The decision to pause is certainly not a no-brainer, given current economic conditions. Inflation is running at 6.7%, more than triple the Bank’s target of 2% and the labour market remains tight. At the same time, demand has slowed and economic activity has cooled as the RBNZ’s relentless rate hikes filter through the New Zealand economy. RBNZ policymakers are confident that the economy has cooled and inflation, although high, is on the right path. If inflation continues to fall, there is a good chance that the pause could be extended – the central bank would clearly like to wrap up the current rate-tightening cycle, and unlike what we saw when the Fed took a pause, there are no signals to the markets that this pause will be a one-time occurrence.
New Zealand releases Manufacturing PMI for June on Wednesday after the rate decision. The manufacturing sector has contracted for three straight months, with readings below the 50.0 line, which separates contraction from expansion. The PMI is expected to rise from 48.9 to 49.8, which would point to almost no change.
NZD/USD Technical
- NZD/USD tested support at 0.6184 earlier. Below, there is support at 0.6126
- 0.6260 and 0.6383 are the next resistance lines
Ethereum Defends Bullish Trend
Market picture
The crypto market cap rose 1.75% over the past 24 hours to $1.19 trillion, outperforming Bitcoin and Ethereum’s 1.5% growth over the same period. Among the top altcoins, Solana (+5.7%), BNB (+6%) and Polygon (+9.4%) are outperforming the market. Tron (-0.2%) and Dogecoin (+1.2%) underperform the market.
According to CoinShares, investments in crypto funds rose by $136 million last week, marking the third consecutive week of inflows totalling $470 million, with bitcoin investments up $133 million and Ethereum up $3 million.
However, trading volumes slowed to $1 billion for the week, compared to an average of $2.5 billion in the previous two weeks, CoinShares noted.
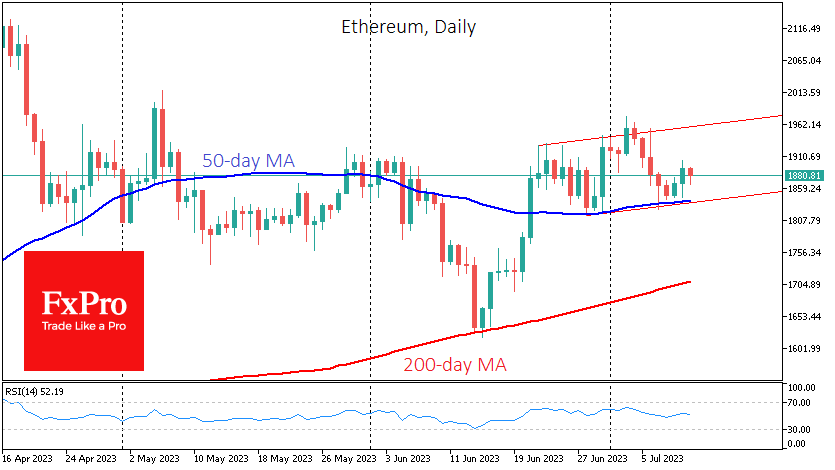
Ethereum reversed to the upside at the end of last week, pulling back from its 50-day moving average. This is the second such reversal in the past two weeks, suggesting that the market is looking to reassert the dominance of the uptrend. If this proves to be the case, Ethereum is headed for a renewal of local highs near $1960 from the current $1880.
News background
According to Standard Chartered Bank, Bitcoin could reach $50K this year and $120K by the end of 2024. “The increased profitability of miners per BTC mined means they can sell less while maintaining cash inflows, reducing the net supply of the asset and driving up its price,” said analyst Geoff Kendrick.
SEC lawyers accused Coinbase of intentionally violating securities laws. The court will consider the parties’ arguments and decide whether to hear the case in the coming days. Coinbase’s shares rose more than 50% following the SEC’s lawsuit in early June.
According to a venture capital firm Electric Capital report, the number of cryptocurrency developers has nearly doubled in three years.
Bitcoin trades at a discount of more than $2K on the Binance.US exchange. Binance.US users lost the ability to deposit dollars the day before, prompting selling by those looking to withdraw funds in fiat.
GBPUSD Renews Bullish Outlook
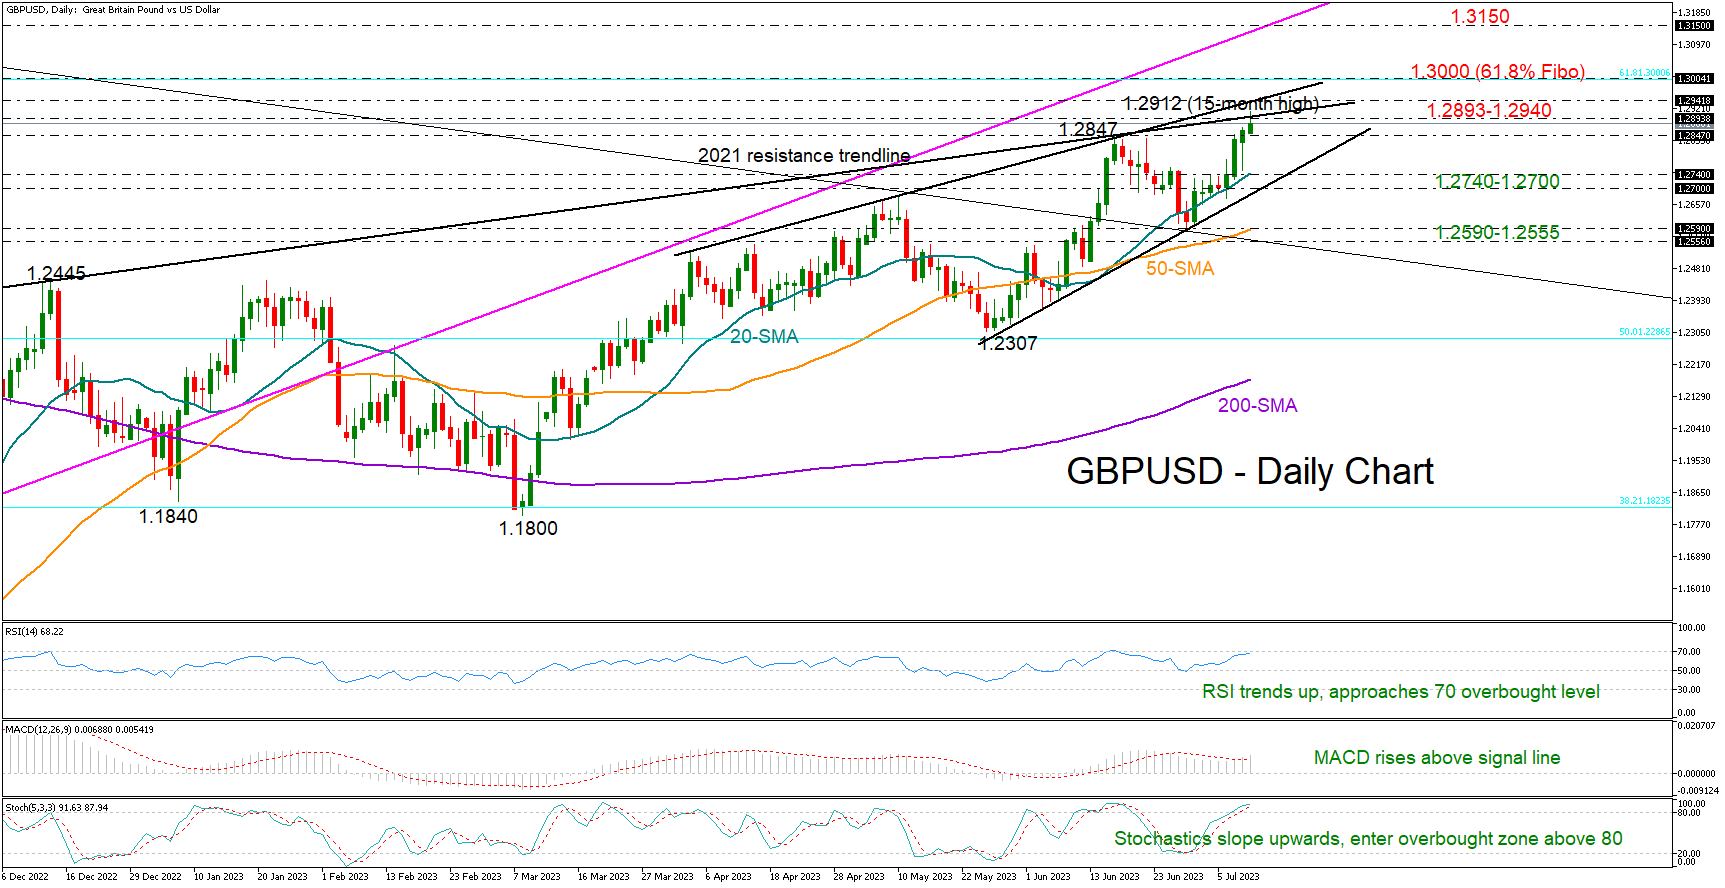
GBPUSD opened the week with mild gains, expanding its NFP rally above June’s peak and to a fresh 15-month high of 1.2912 early on Tuesday.
There is room for further development, as the technical indicators maintain a clear positive trajectory. Yet, with the RSI and the stochastic oscillator prodding their overbought levels, the bullish wave could soon take a breather.
The pair is currently testing the tentative ascending line from last December at 1.2893, while the resistance trendline from April is marginally higher at 1.2940. Notably, the 50- and 200-period simple moving averages (SMAs) in the weekly and monthly timeframes are limiting bullish activity within the same boundaries. Hence, if the bulls knock down this wall, the 61.8% Fibonacci retracement of the 2021-2022 downtrend could immediately attempt to halt the uptrend around 1.3000. If not, the uptrend could continue towards the long-term constraining zone of 1.3150, last seen in April 2022. The 1.3270-1.3300 zone could be the next target.
In the event the price falls below 1.2847, it could initially seek support near 1.2700. If selling forces dominate there, the pair could sink towards the 1.2590-1.2550 region, where the 50-day SMA and the broken 2021 descending trendline are positioned. Note that the price rotated northwards within the same neighborhood in June.
All in all, GBPUSD has upgraded its short and long-term outlook, raising hopes for a bullish continuation higher. Still, some profit taking is possible as the pair is currently hovering near key resistance lines.
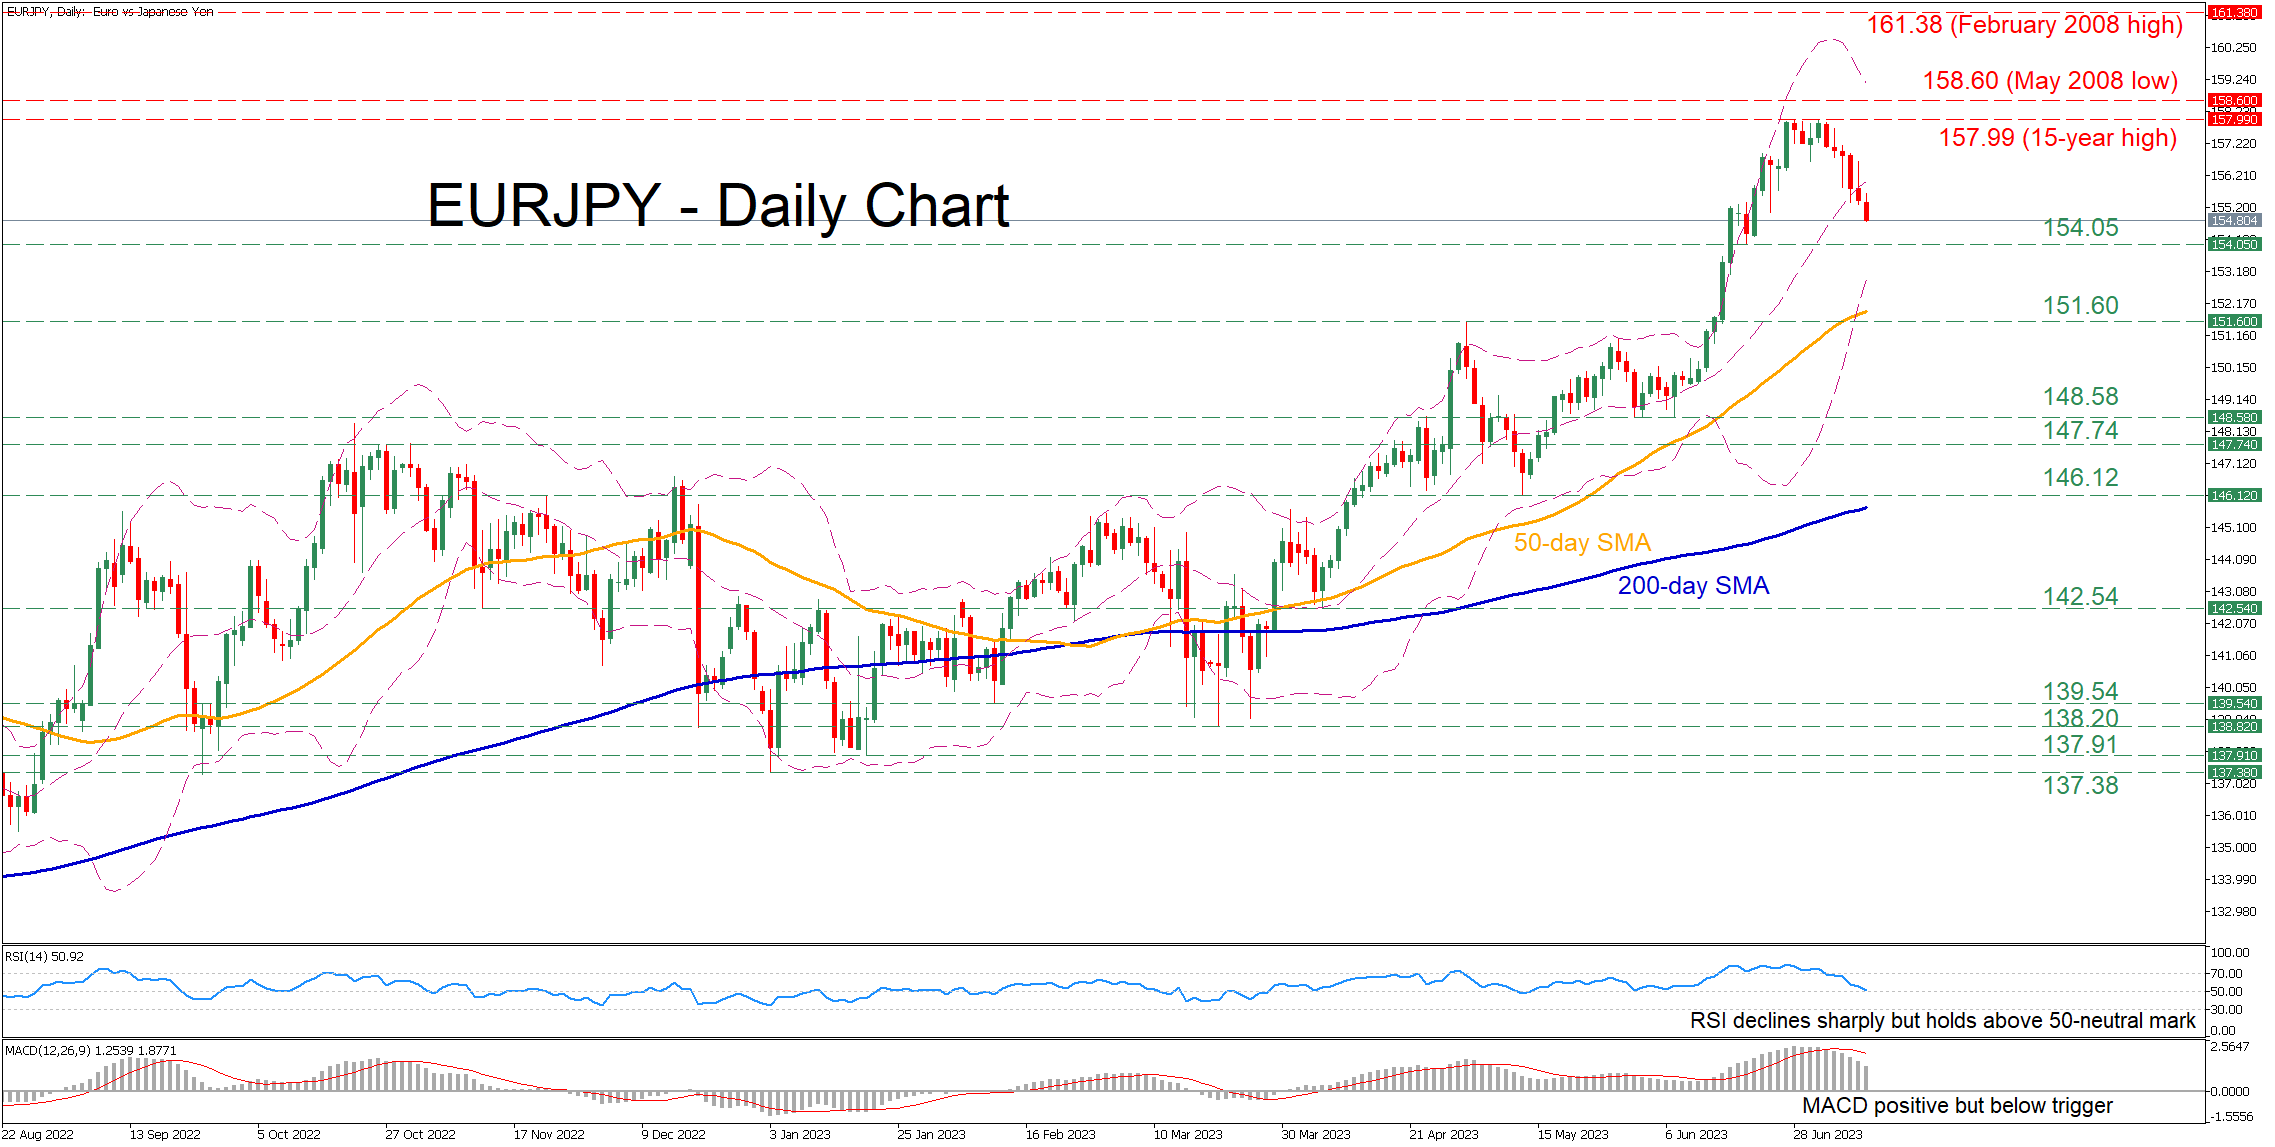
EURJPY Pulls Back Strongly from 15-Year High
EURJPY has been in a strong uptrend since the beginning of the year, posting a fresh 15-year high of 157.99 in late June. However, this rally appears to be fizzling out, with the pair experiencing a downside correction in the short term.
The momentum indicators currently suggest that bearish forces are strengthening but have not taken control yet. Specifically, the RSI retreated massively but still holds above its 50-neutral mark, while the MACD declined below its red signal line in the positive territory.
Should the pullback extend further, the pair could initially face the recent support of 154.05. If that barricade fails, the spotlight could turn to the May resistance of 151.60, which might serve as support in the future. Failing to halt there, the price could descend towards the June low of 148.58.
Alternatively, if the price reverses back higher, the recent 15-year peak of 157.99 could prove to be the first barrier for buyers to conquer. Slicing through that wall, the pair may advance towards fresh multi-year highs, where the May 2008 low of 158.60 could curb any upside attempts. Even higher, the bulls might attack the February 2008 peak of 161.38.
In brief, it seems that EURJPY’s rally has faltered after reaching extremely overbought conditions and the price is experiencing a strong pullback. Nevertheless, a break below the 50-day simple moving average (SMA) is needed to increase bears’ hopes for a sustained downtrend.