Sample Category Title
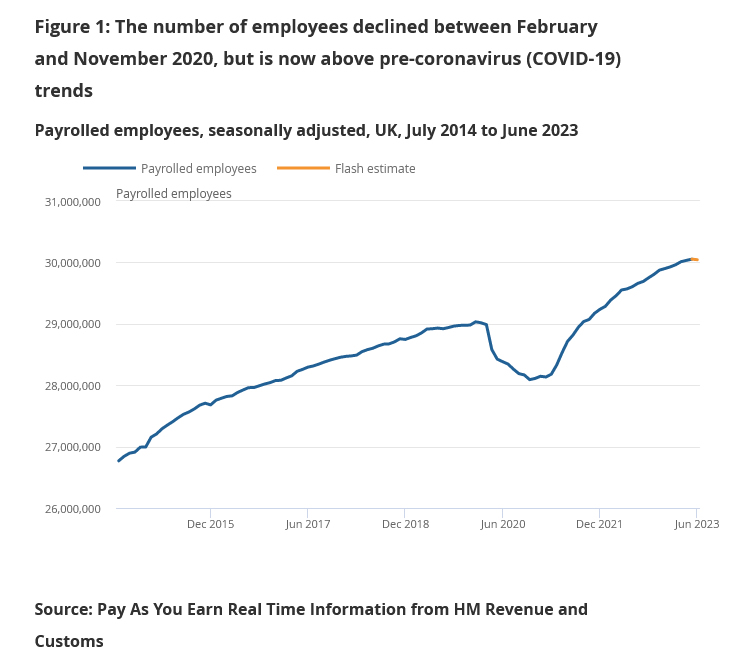
UK payrolled employment down -9k in Jun, median pay accelerated to 9.7% yoy
In June, UK payrolled employment decreased by -9k, comparing with May. But payrolled employment was still up 439k comparing with the same month last year. Median monthly pay was up 9.7% yoy, accelerated from May's 8.4% yoy. Claimant count rose 25.7k, above expectation of 20.5k.
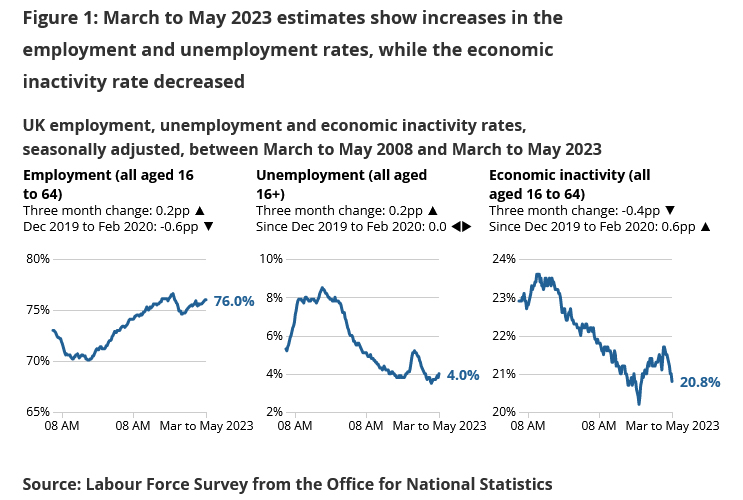
In the three months to May, unemployment rate rose 0.2% to 4.0% compared with the previous three month period. Employment rate rose 0.2% to 76.0%. Economic inactivity rate was down -0.4% to 20.8%. Total weekly hours rose 4.5%. Average earnings including bonus rose 6.9, up from April's 6.7%. Average earnings excluding bonus rose 7.3%, same as the prior period.
EUR/USD Daily Outlook
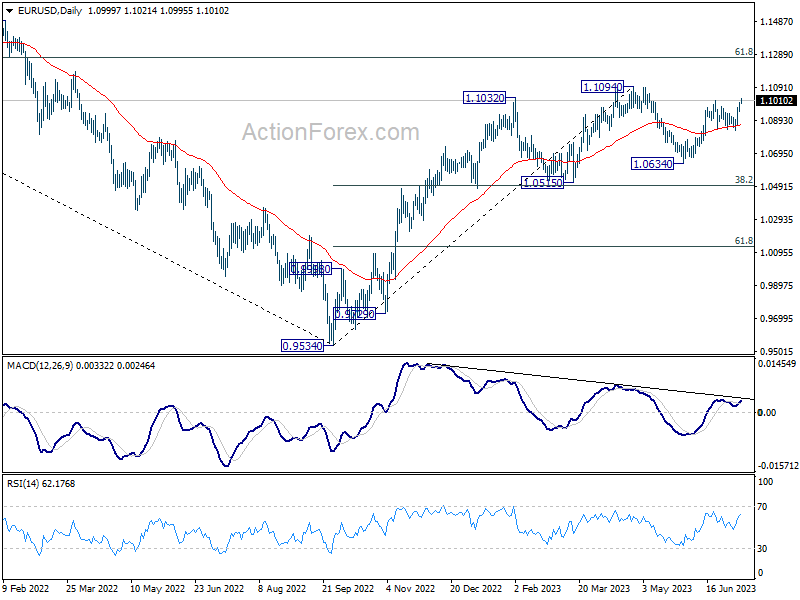
Daily Pivots: (S1) 1.0963; (P) 1.0982; (R1) 1.1021; More...
Break of 1.1011 resistance indicates that rise from 1.0634 is resuming. Intraday bias in EUR/USD is back on the upside for retesting 1.1094 high. Decisive break there will resume larger up trend from 0.9534 to 1.1273 fibonacci level. On the downside, below 1.0942 minor support will turn intraday bias neutral first. but further rally will remain in favor as long as 1.0834 support holds.
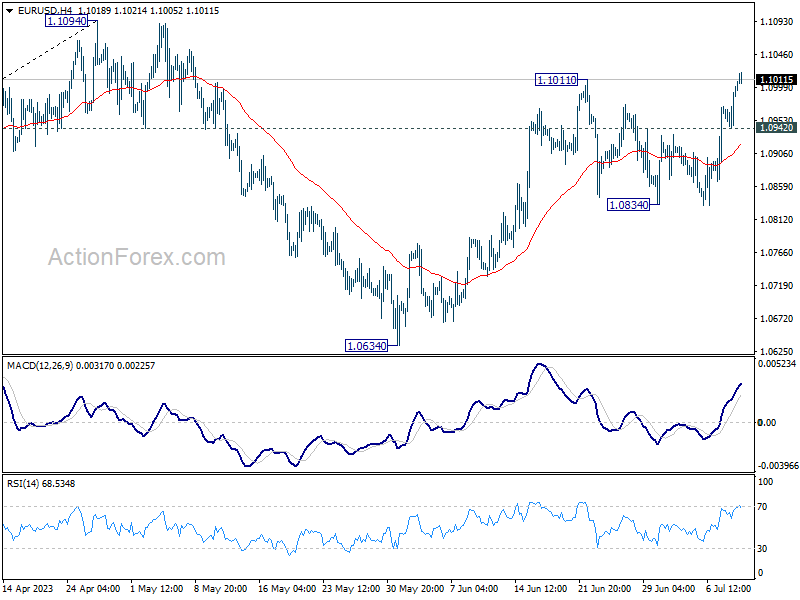
In the bigger picture, as long as 1.0515 support holds, rise from 0.9534 (2022 low) would still extend higher. Sustained break of 61.8% retracement of 1.2348 (2021 high) to 0.9534 at 1.1273 will solidify the case of bullish trend reversal and target 1.2348 resistance next (2021 high).
GBP/USD Daily Outlook
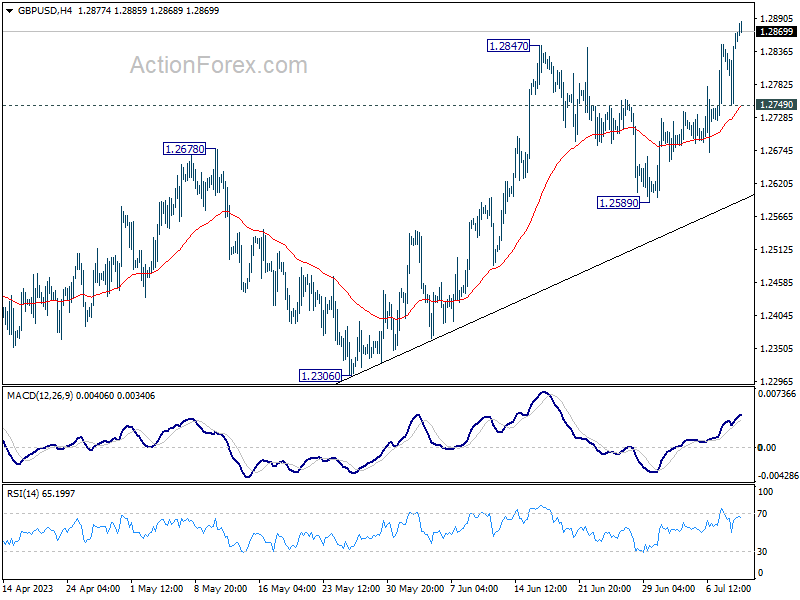
Daily Pivots: (S1) 1.2785; (P) 1.2826; (R1) 1.2903; More...
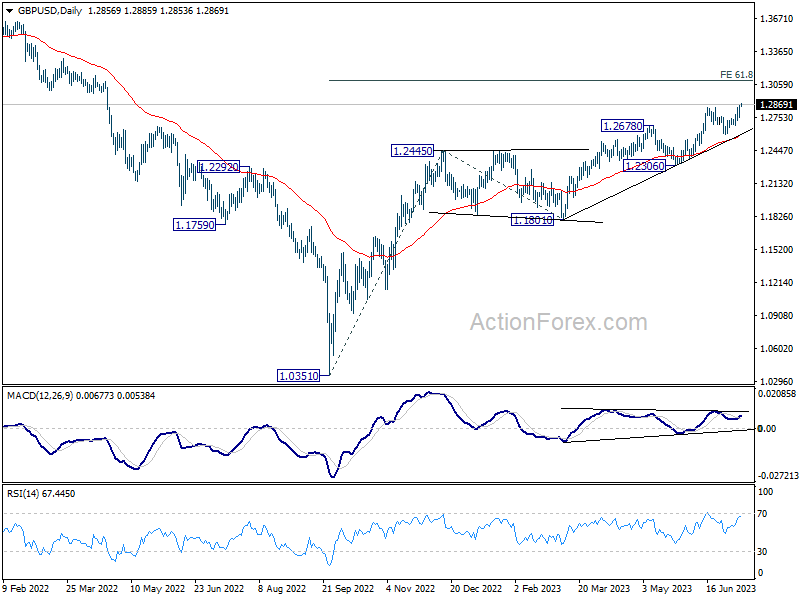
GBP/USD's break of 1.2847 resistance should confirm resumption of rally from 1.0351. Intraday bias is back on the upside. Next target is 61.8% projection of 1.0351 to 1.2445 from 1.1801 at 1.3095. On the downside, break of 1.2749 minor support will turn intraday bias neutral again. But outlook will stay bullish as long as 1.2589 support holds, in case of retreat.
In the bigger picture, the strong support from 55 W EMA (now at 1.2341) is a medium term bullish sign. Outlook will stay bullish as long as 1.2306 support holds. Rise from 1.0351 medium term bottom (2022 low) is expected to extend further to retest 1.4248 key resistance (2021 high).
USD/CHF Daily Outlook
Daily Pivots: (S1) 0.8830; (P) 0.8874; (R1) 0.8897; More...
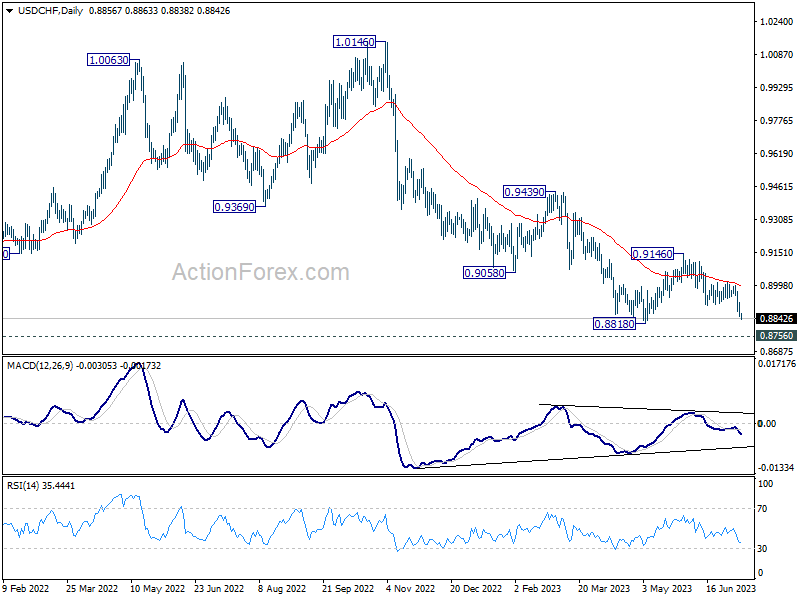
Intraday bias in USD/CHF remains on the downside as fall from 0.9146 continues. Deeper decline should be seen to 0.8818 and below, to resume whole down trend from 1.0146. Strong support is expected from 0.8756 to contain downside and bring rebound. On the upside, above 0.8916 minor resistance will turn intraday bias neutral first. However, decisive break of 0.8756 will carry larger bearish implication.
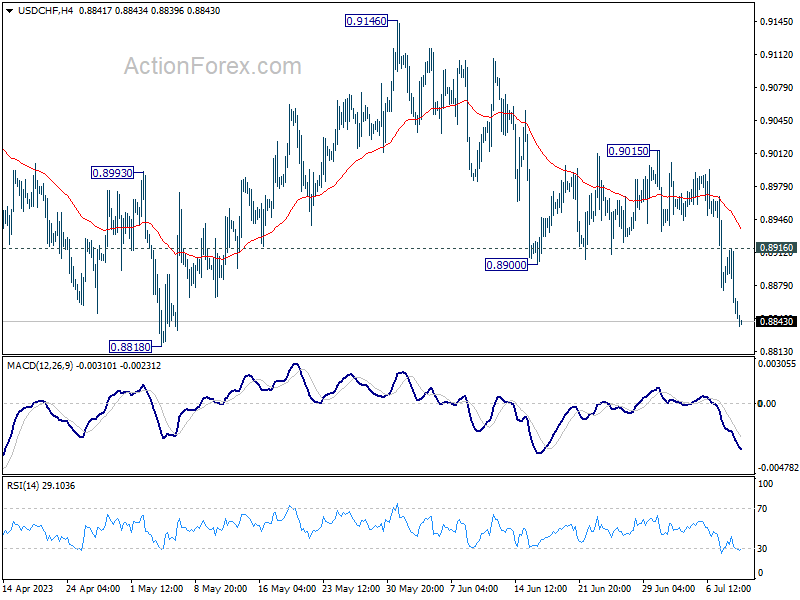
In the bigger picture, fall from 1.1046 (2022 high) is seen as a leg in the long term range pattern from 1.0342 (2016 high). While further decline cannot be ruled out, strong support is expected from 0.8756 long term support to bring reversal. Firm break of 0.9146 resistance should confirm medium term bottoming.
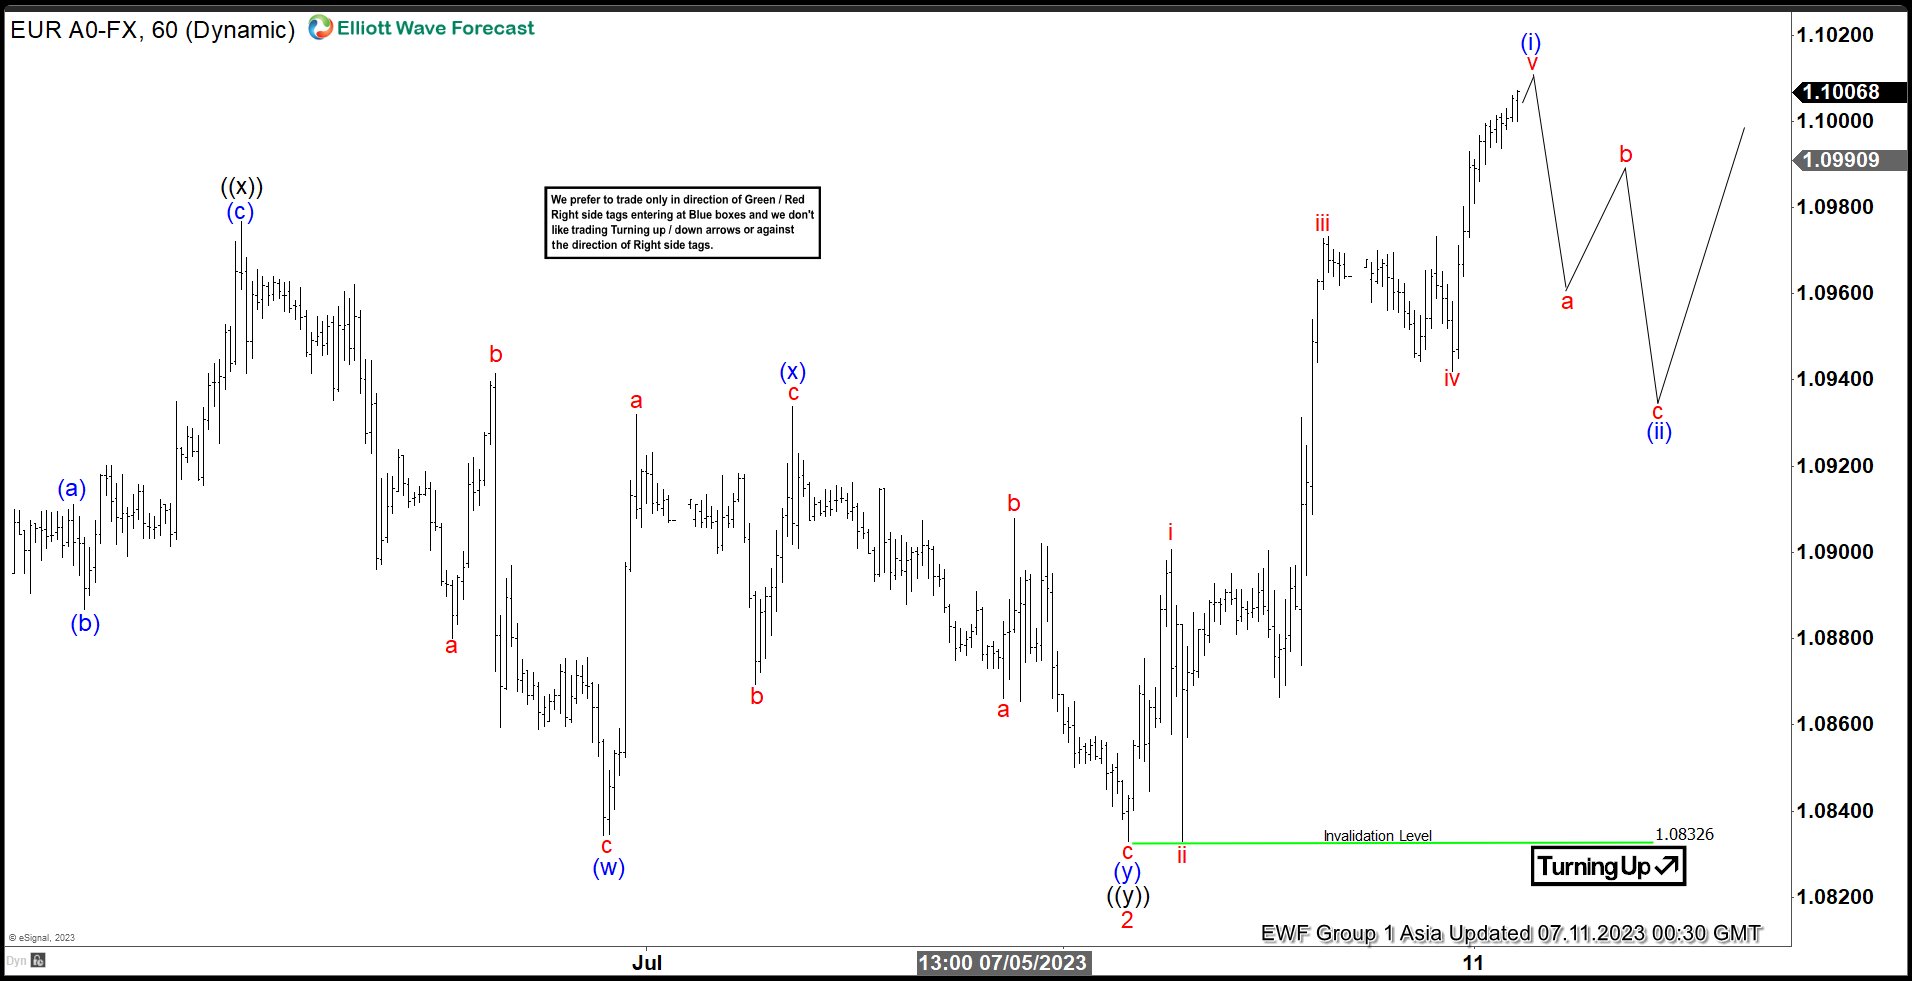
EURUSD Starts New Bullish Cycle
Short term Elliott Wave view in EURUSD shows a bullish sequence from 6.1.2023 low. Rally from there is in progress as a 5 waves impulsive structure. Up from 6.1.2023 low, wave 1 ended at 1.1012 and dips in wave 2 ended at 1.0833. Internal subdivision of wave 2 unfolded as a double three Elliott Wave structure. Down from wave 1, wave ((w)) ended at 1.0843 and rally in wave ((x)) ended at 1.0976. Wave ((y)) lower ended at 1.0832 which also completed wave 2. Pair has since turned higher in wave 3.
Up from wave 2, wave i ended at 1.09 and pullback in wave ii ended at 1.0833. Pair resumes higher in wave iii towards 1.0973 and dips in wave iv ended at 1.094. Pair resumes higher again in wave v and expected to complete wave (i) soon. Once wave (i) is complete, pair should pullback in wave (ii) to correct cycle from 7.6.2023 low in 3, 7, or 11 swing before the rally resumes again. As far as pivot at 1.083 low stays intact, expect dips to find support in 3, 7, or 11 swing for further upside.
EURUSD 60 Minutes Elliott Wave Chart
EURUSD Elliott Wave Video
https://www.youtube.com/watch?v=cfDbd7aKXXs
US Dollar Slides Below Critical Support
The week started on a cautious note as European and US stocks eked out small gains, but appetite was limited appetite on news that the new capital requirements for the US banks would be tougher.
And mega caps didn’t give much support. Tesla lost up to 2% during the session, while Amazon closed the session more than 2% lower before its Prime Day – which now became an industrywide shopping day and will give us a hint on how much US consumers are ready to up their spending online. Meta, on the other hand, advanced 1.23%, as Threads already amassed 100 mio users since its launch last week, while internet traffic data from Cloudflare showed that Twitter use ‘tanked’.
Tougher rules
Michael Barr said yesterday that he will recommend tougher capital rules for banks with $100 billion or more in assets, as opposed to those that have $700bn and more so far concerned with the tough rules.
More importantly, unrealized losses (and gains) on security portfolios will be considered when calculating regulatory proposal, a thing that could’ve helped avoiding Silicon Valley Bank’s (SVB) collapse, but that will also put a bigger pressure on banks that bought tons of US treasuries and that are now sitting on significantly discounted portfolios.
The good news is that big banks like JP Morgan and Citi didn’t react aggressively to the news, and even more reassuring news is that the smaller, regional bank stocks tempered the news quite well as well. Pacwest for example lost only around 1% and Invesco’s KBW index even closed the session slightly higher.
What’s less reassuring, however, is the fact that the Federal Reserve (Fed) will continue pushing the interest rates higher, and that will put an extra pressure on lenders, and the regional lenders are the most vulnerable to rate changes.
Other than that, it was a day of digesting and scaling back the recent rise in hawkish Fed expectations as used-car prices, which has been a good indication for inflation in this inflation cycle, fell 4.2% in June, the largest drop since the beginning of the pandemic. The prices came down by more than 10% in a year. Plus, according to the New York Fed’s latest survey, inflation expectations for the next 12-month fell to 3.8% in June, from 4.1% printed a month earlier, although the 3-year expectations ticked higher to 3%. The same survey also showed that consumers were more pessimistic about the job market outlook, and median expected spending growth over the next year declined to the lowest levels since September 2021.
Capital flew into treasuries yesterday, the US 2-year yield for example declined about 10bp, while the US dollar plunged below a long-term ascending channel base despite the hawkish Fed expectations. The dollar bears are now targeting the 100 level as their next destination.
The dollar-yen plunged below the 141 level and is preparing to test the 50-DMA, which stands near the 140 level, to the downside. The EURUSD rallied past 1.10 mark despite a sentiment index that showed a faster deterioration for July in Eurozone. Today the German CPI will likely confirm a latest rebound in inflation – as the low-price train tickets that government had distributed last year are creating a positive base effect for inflation in Germany, and the ZEW index is expected to warn of worsening mood. Higher German inflation is positive for the euro, but I am not sure that Christine Lagarde or her colleagues at the European Central Bank (ECB) care much about sentiment indicators. The softening US dollar despite the hawkish Fed expectations, and hawkish ECB expectations could support a further rise in the EURUSD toward the 1.12 mark.
Technical Outlook and Review
DXY:
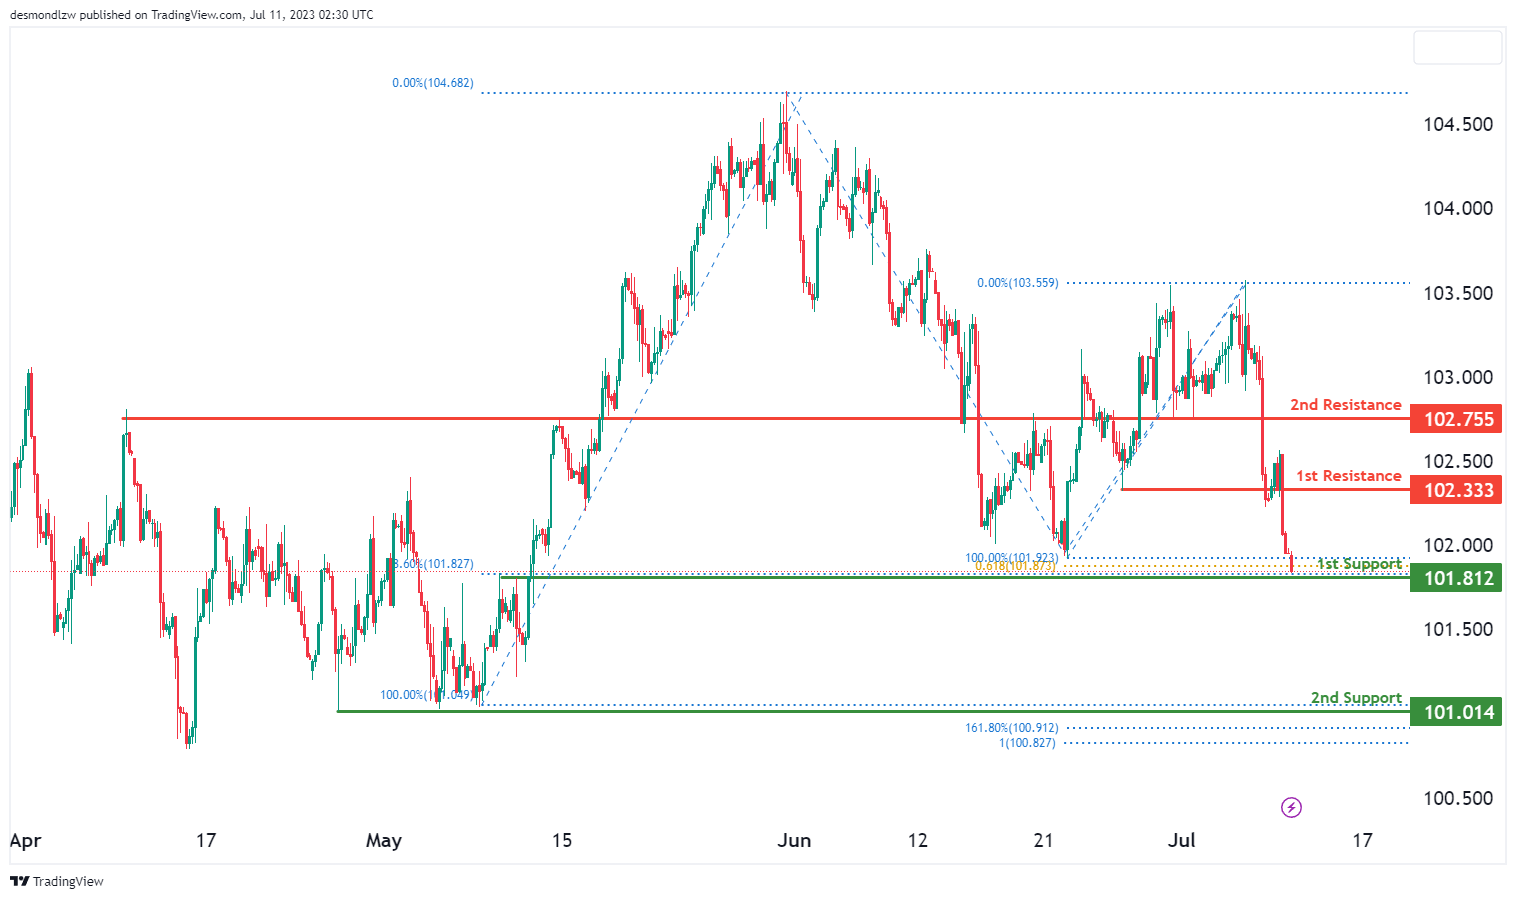
Given the overall bullish momentum of the DXY, we might see a bullish bounce off the 1st support, with price heading towards the 1st resistance.
The 1st support stands at 101.81, which is an overlap support. This support level’s strength is reinforced by both a 78.6% Fibonacci retracement and a 61.8% Fibonacci projection. Should the price bounce off this support, we could observe a rise towards our 1st resistance at 102.33, characterized as a significant pullback resistance.
However, if the price breaks the 1st support, it could descend towards the 2nd support at 101.01. This level serves as a multi-swing low support and coincides with a 161.8% Fibonacci extension and a 100% Fibonacci projection, adding further credibility as a significant support zone.
On the flip side, if the price breaches the 1st resistance, it could potentially ascend towards our 2nd resistance at 102.75, another pullback resistance of note. This resistance level aligns with a 78.6% Fibonacci retracement, suggesting it as a potential reversal or slowdown area.
EUR/USD:
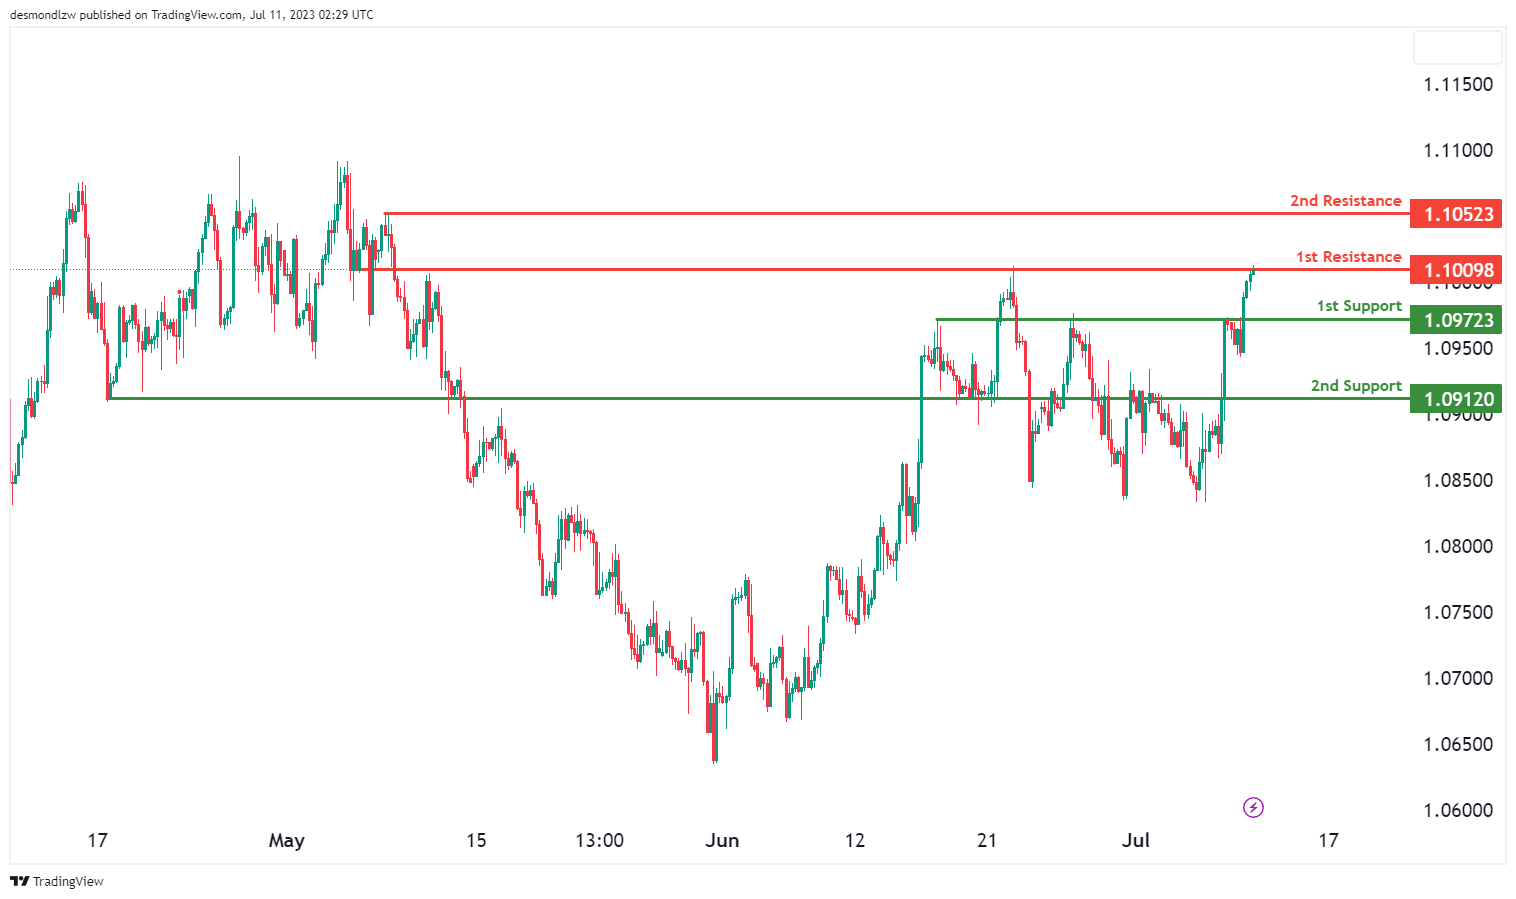
EUR/USD’s momentum is currently bearish. As a consequence, we might observe a bearish reaction off the 1st resistance, causing a price drop towards the 1st support.
At present, the 1st resistance is located at 1.1010, acting as a substantial swing high resistance. If price reacts off this resistance, we could expect a decline to our 1st support, identified at 1.0972 and known as a pullback support.
However, if price breaches the 1st resistance, it has the potential to climb towards our 2nd resistance, positioned at 1.1079, which is a notable multi-swing high resistance.
On the contrary, should the price break through the 1st support, it may continue its descent towards the 2nd support at 1.0912, another noteworthy pullback support.
EUR/JPY:
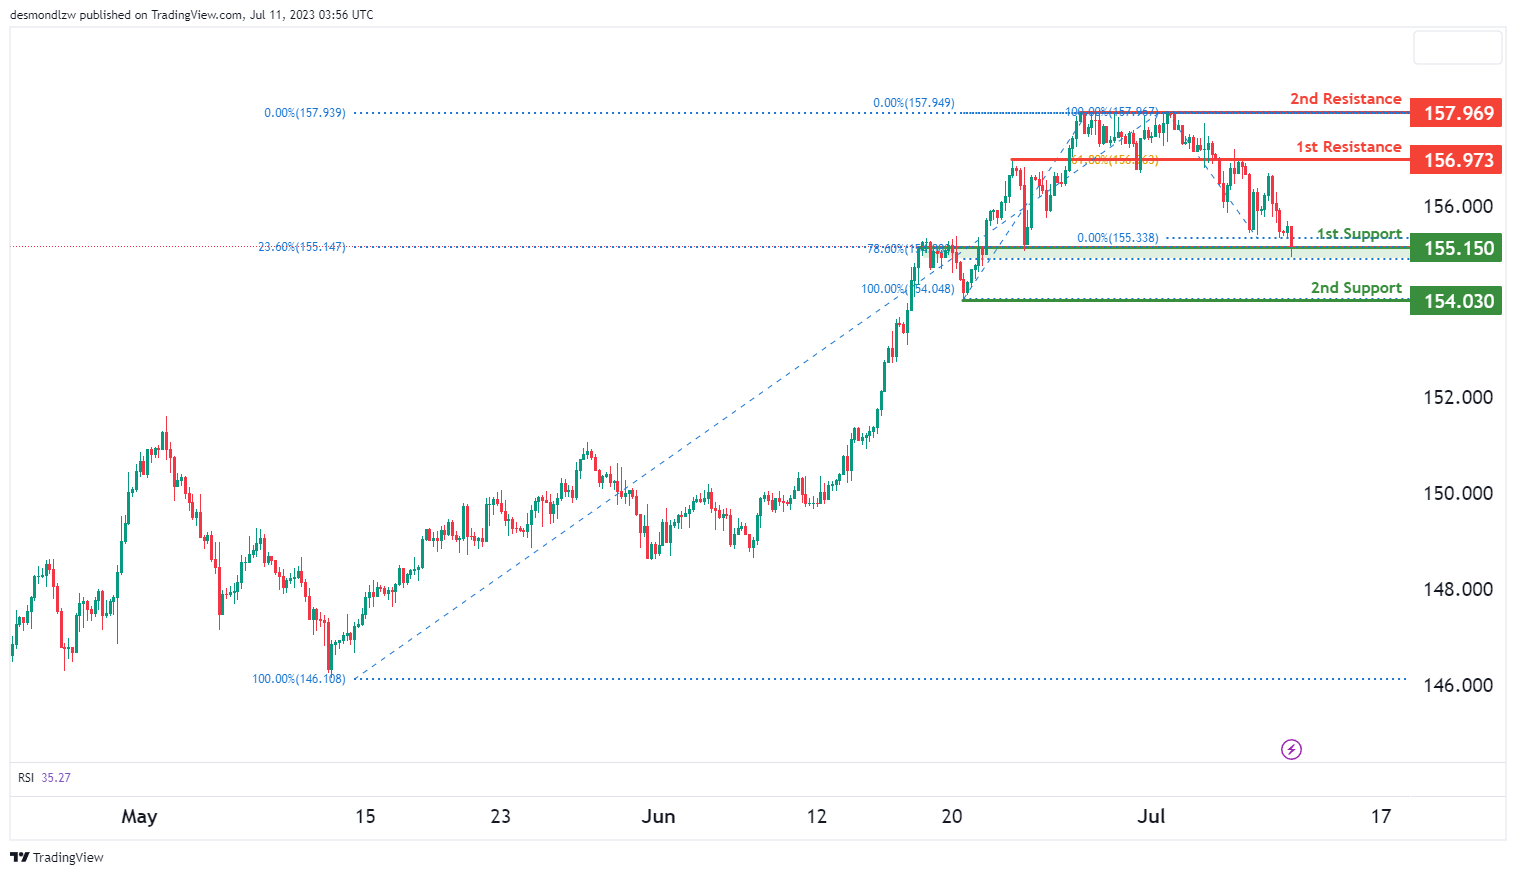
The EUR/JPY instrument is currently showcasing a bullish trend. The price is expected to bounce off the first support and continue its bullish momentum towards the first resistance.
The first support level is at 155.15 and is deemed strong due to being an overlap support and aligning with the 78.60% Fibonacci retracement level. The second support, situated at 154.03, is seen as a strong support level due to its status as a swing low support.
On the other hand, the first resistance is located at 156.97. It’s significant because it acts as an overlap resistance and aligns with the 61.80% Fibonacci retracement level. The second resistance level at 157.96 is considered noteworthy due to its status as a multi-swing high resistance, which could potentially pose a challenge to the price’s upward movement.
EUR/GBP:
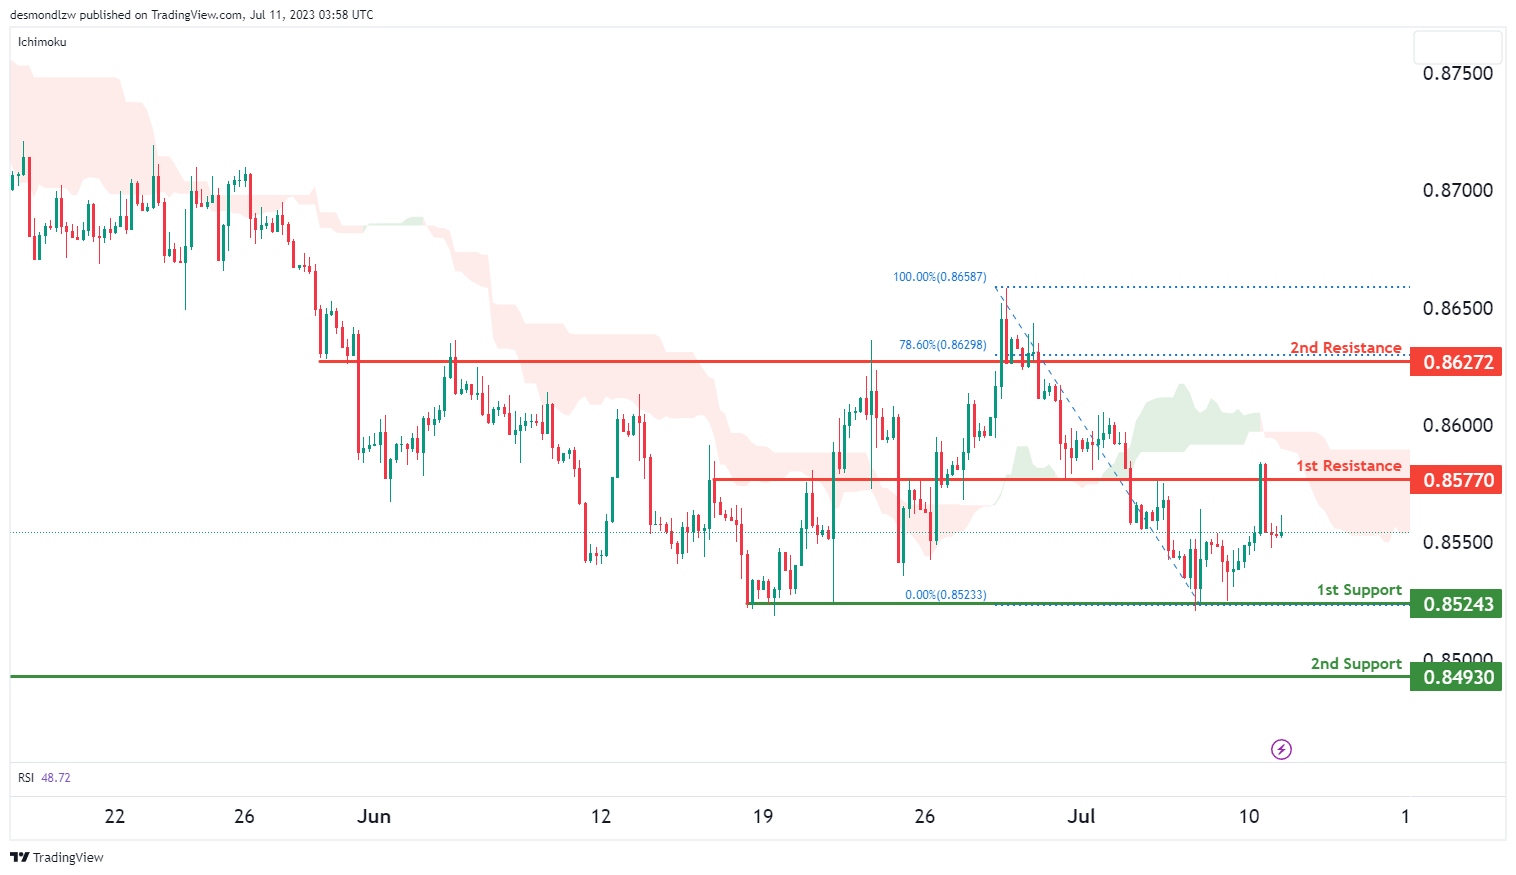
The EUR/GBP pair currently exhibits a bearish momentum, a trend that is largely attributable to the price being positioned below the bearish Ichimoku cloud.
Given this bearish predisposition, there is potential for the price to continue its descent towards the first support level, located at 0.8524. This support is deemed strong, largely due to its status as a multi-swing low support. The second support is at 0.8493 and is considered robust due to it being an overlap support.
In contrast, the first resistance can be found at 0.8577. Its significance is derived from its overlap resistance characteristics. The second resistance, positioned at 0.8627, is noteworthy because of its overlap resistance nature and its correlation with the 78.60% Fibonacci retracement level, which could pose challenges to an upward price movement.
GBP/USD:
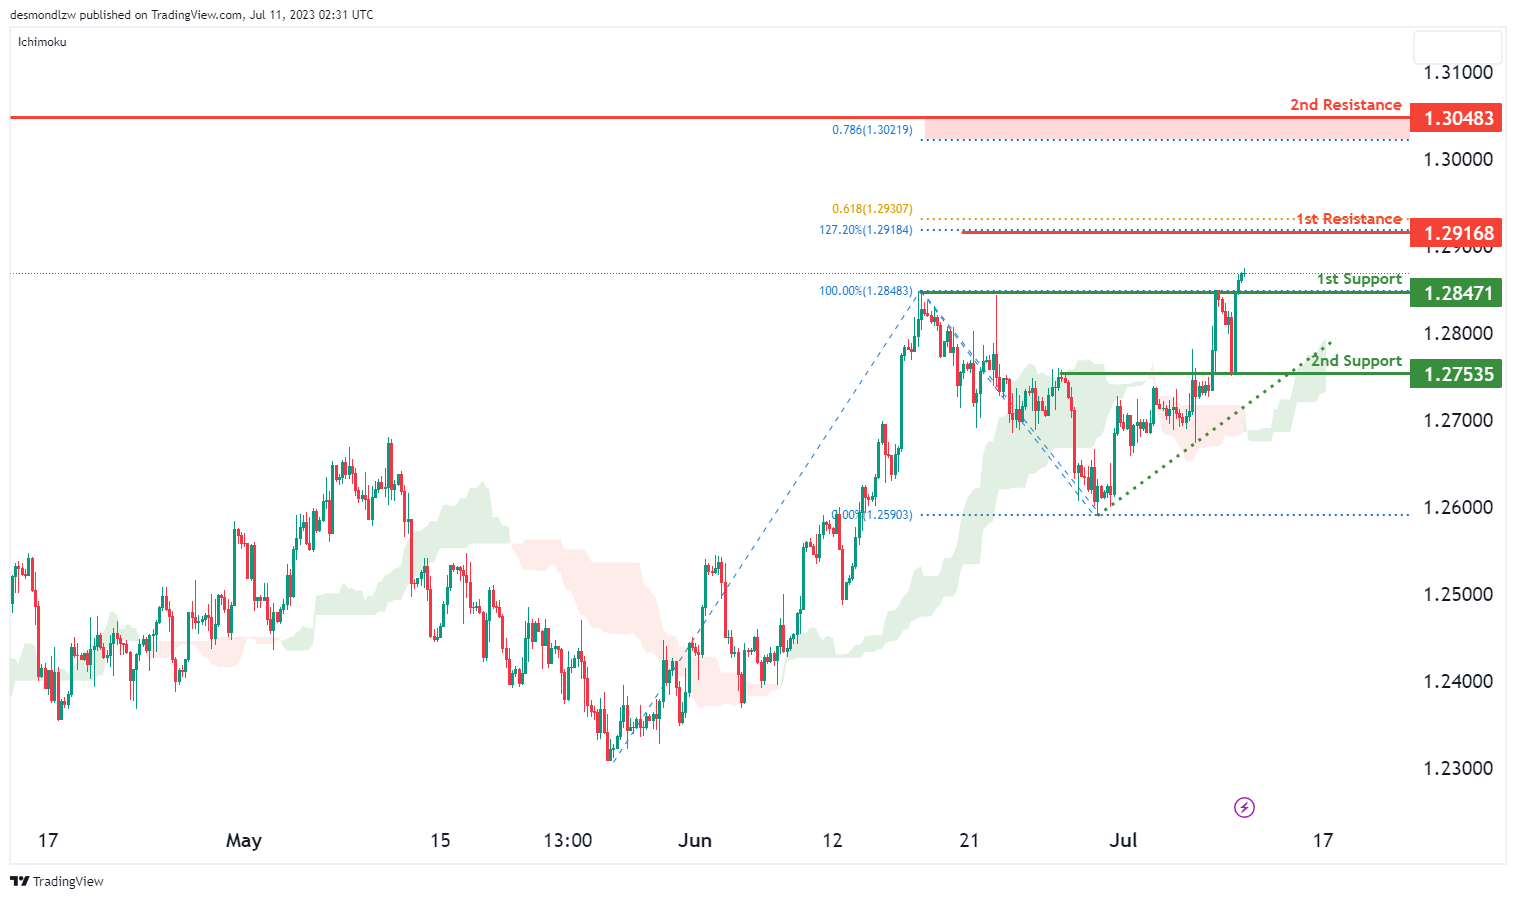
GBP/USD’s momentum is presently bullish, propelled by its position above the bullish Ichimoku cloud and above a major ascending trend line, suggesting further bullish momentum may be anticipated.
Given these factors, we could potentially see a bullish continuation towards the 1st resistance. The 1st support is found at 1.2847, operating as a pullback support. If price were to bounce off this support, we could anticipate a rise to our 1st resistance, which stands at 1.2916. This resistance aligns with a 61.8% Fibonacci projection and a 127.2% Fibonacci extension, adding credence to its role as a significant resistance level.
Should the price break the 1st resistance, it could potentially ascend towards the 2nd resistance at 1.3048, another pullback resistance. This resistance aligns with a 78.6% Fibonacci projection, marking it as a potential reversal zone.
Conversely, if price breaches the 1st support, it might continue to decline towards the 2nd support at 1.2753, which is a solid overlap support.
GBP/JPY:
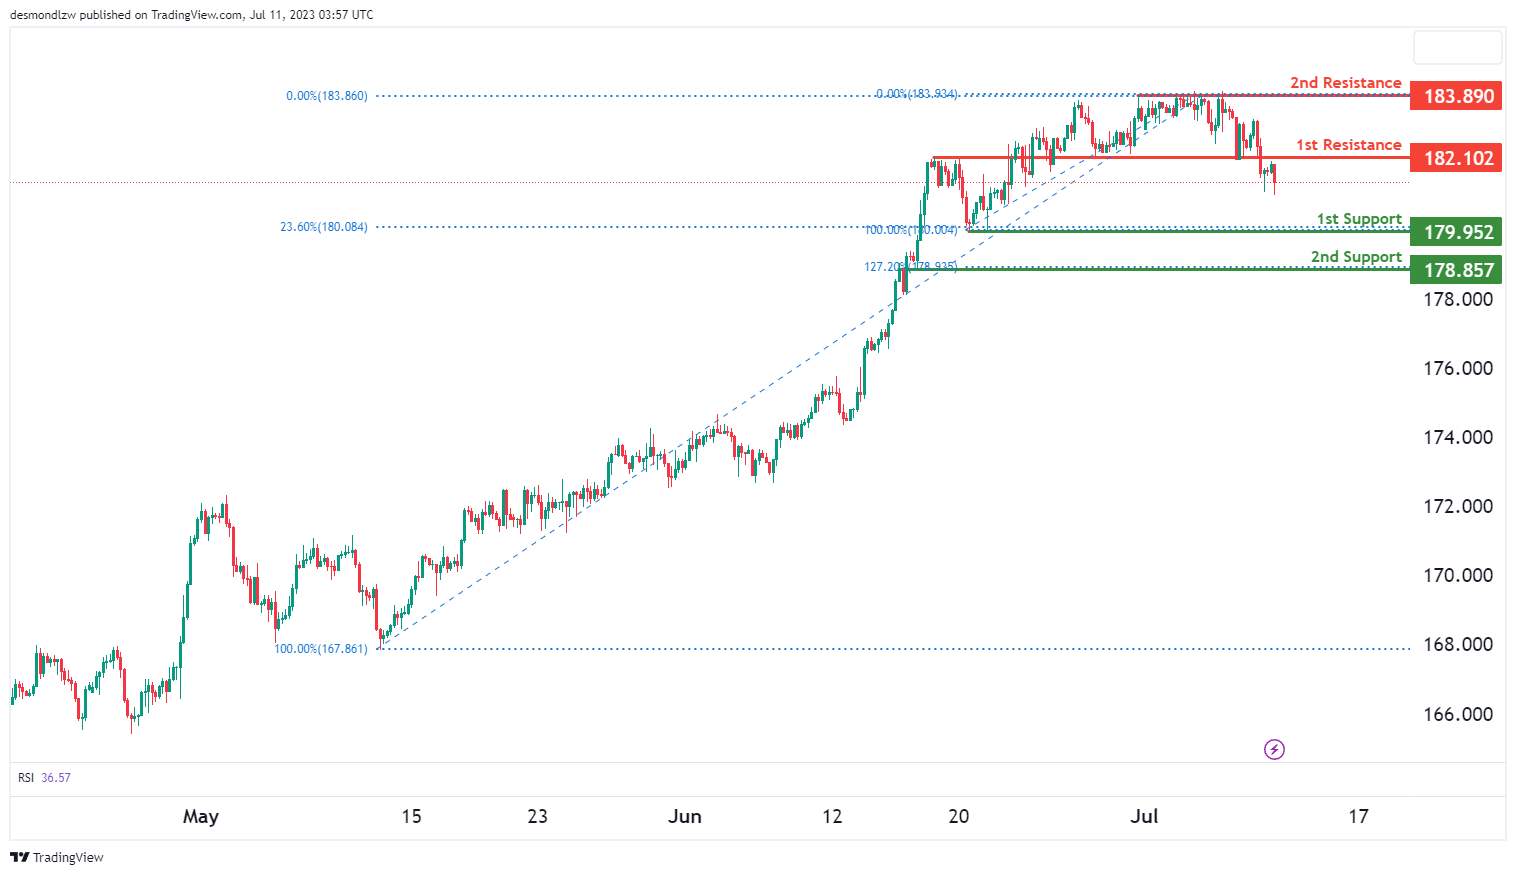
The GBP/JPY instrument is currently demonstrating a bearish momentum. It’s anticipated that the price could potentially continue its bearish movement towards the first support level.
The first support is situated at 179.95 and is deemed significant as it represents a swing low support and aligns with the 23.60% Fibonacci retracement level. Additionally, the second support is located at 178.85 and is considered robust due to its overlap support and a 127.20% Fibonacci extension.
On the other hand, the first resistance is found at 182.10, marked by its overlap resistance. The second resistance, positioned at 183.89, is notable as it represents a multi-swing high resistance and is correlated with the 78.60% Fibonacci retracement level. This could potentially pose a significant barrier to any upward price movements.
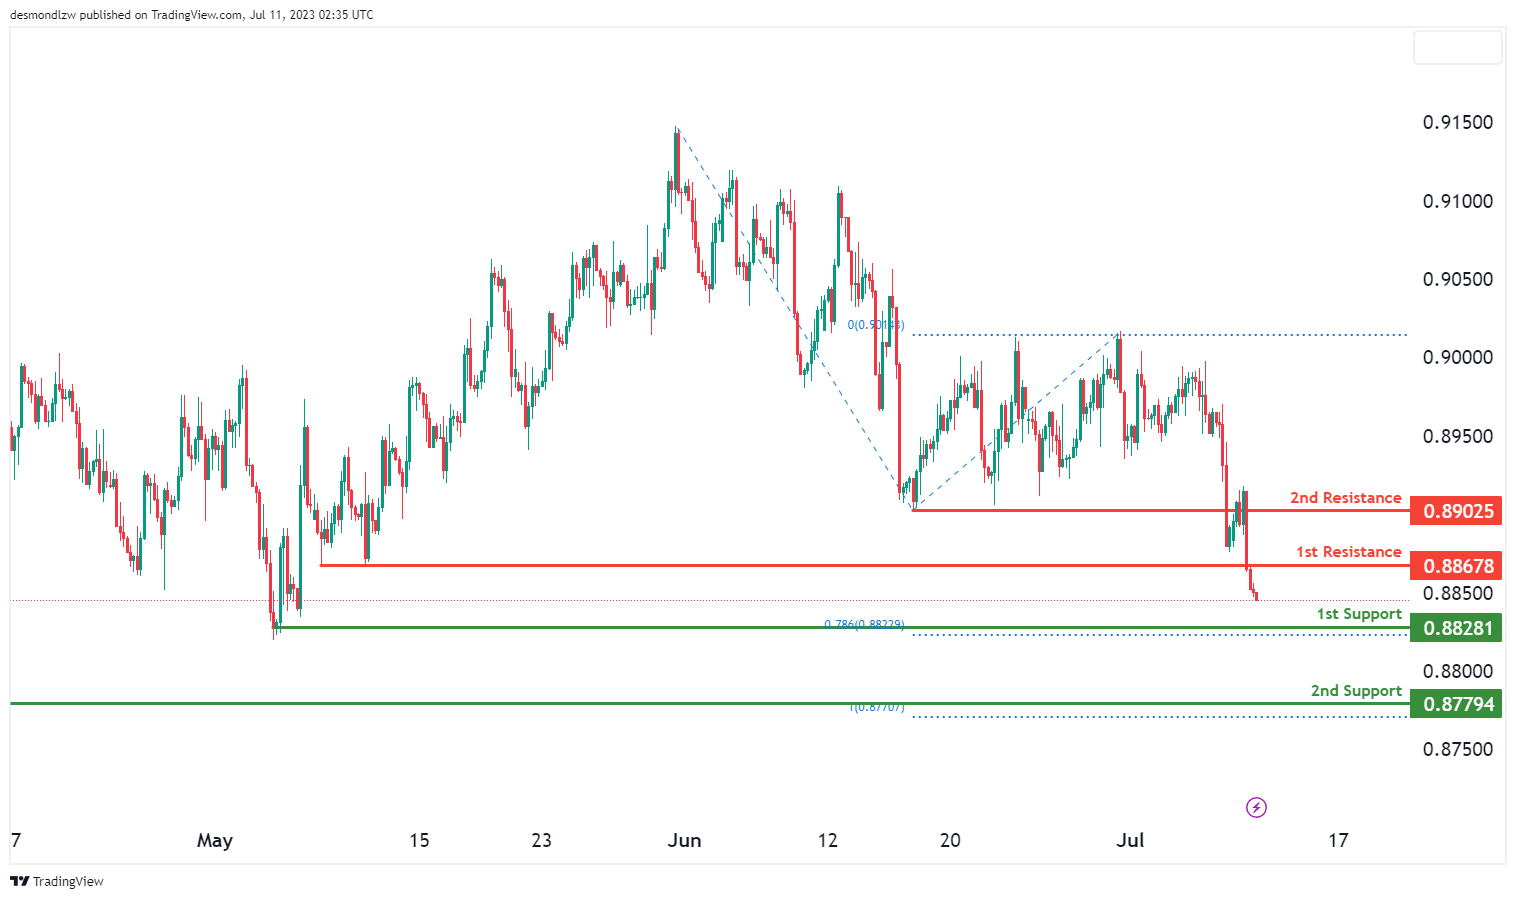
USD/CHF:
The overall momentum of USD/CHF is currently bearish, implying the possibility of a bearish continuation towards the 1st support.
The 1st support is identified at 0.8828, and it is considered to be a solid swing low support, aligning with the 78.6% Fibonacci projection. If the price reacts off this support, we might expect a decline to the 1st resistance, located at 0.8867, which serves as a pullback resistance.
On the flip side, if the price breaches our 1st resistance, it could potentially ascend towards the 2nd resistance at 0.8909, which is an overlap resistance.
However, if the price breaks the 1st support, it could potentially drop to the 2nd support at 0.8779, which is a significant swing low support and coincides with a 100% Fibonacci projection.
USD/JPY:
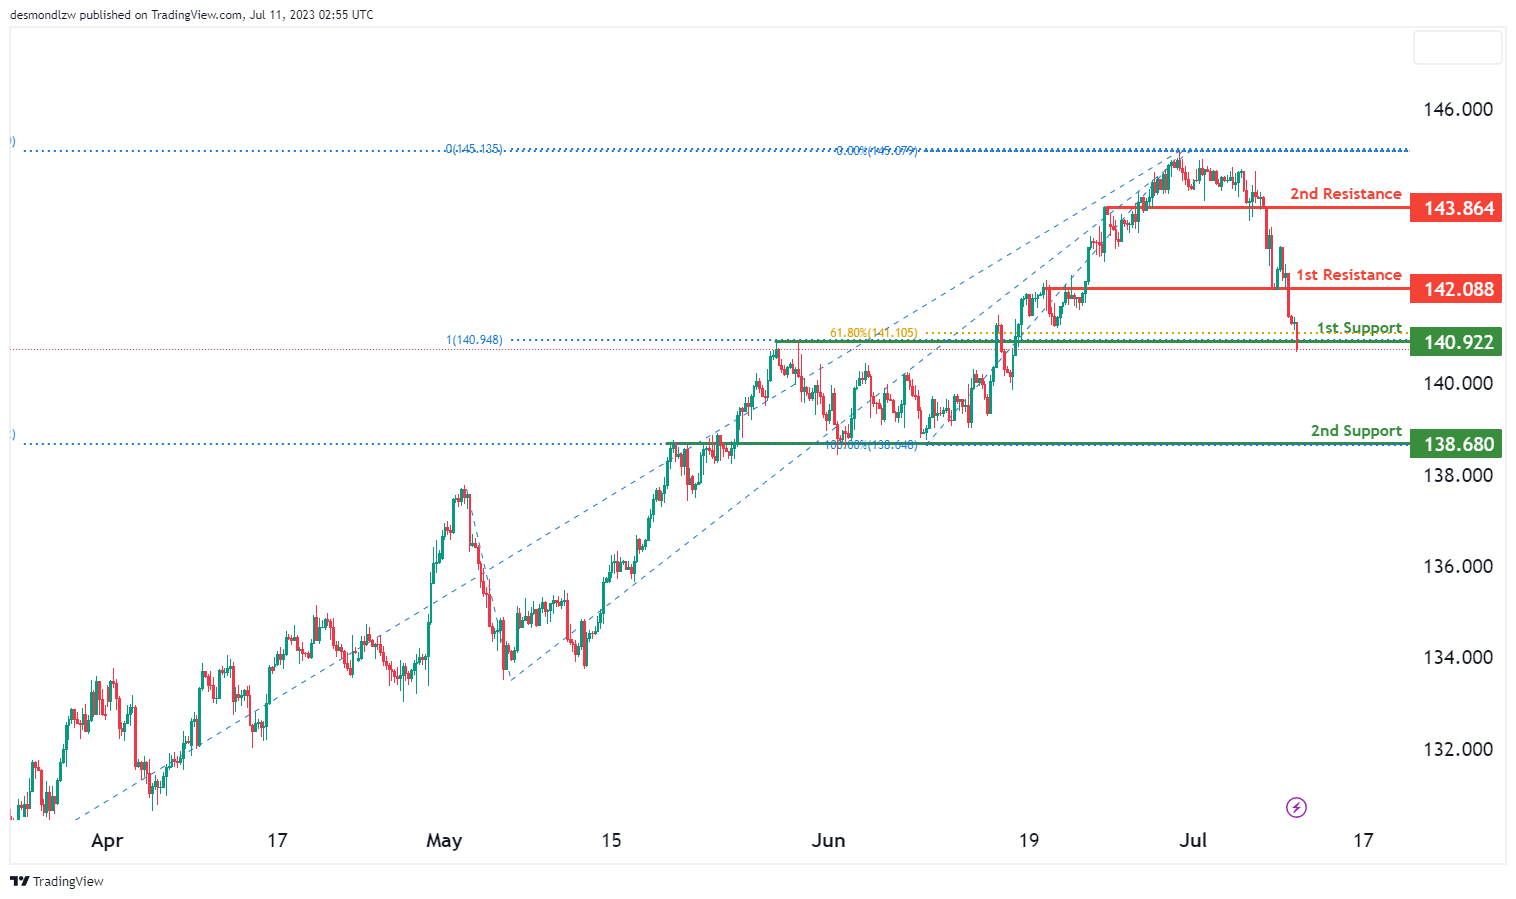
USD/JPY’s momentum is currently bullish, suggesting the possibility of a bullish bounce off the 1st support, propelling it towards the 1st resistance.
The 1st support level is found at 140.92. This level is a strong pullback support, coinciding with a 100% Fibonacci projection and a 61.8% Fibonacci retracement. If the price were to react positively to this level, it might propel itself towards the 1st resistance at 142.08, another significant pullback resistance.
If price manages to break past the 1st resistance, it could potentially rise towards the 2nd resistance at 143.86, which acts as another crucial pullback resistance.
Conversely, if price breaches the 1st support, it could potentially descend towards the 2nd support down at 138.68. This level serves as a robust overlap support.
USD/CAD:
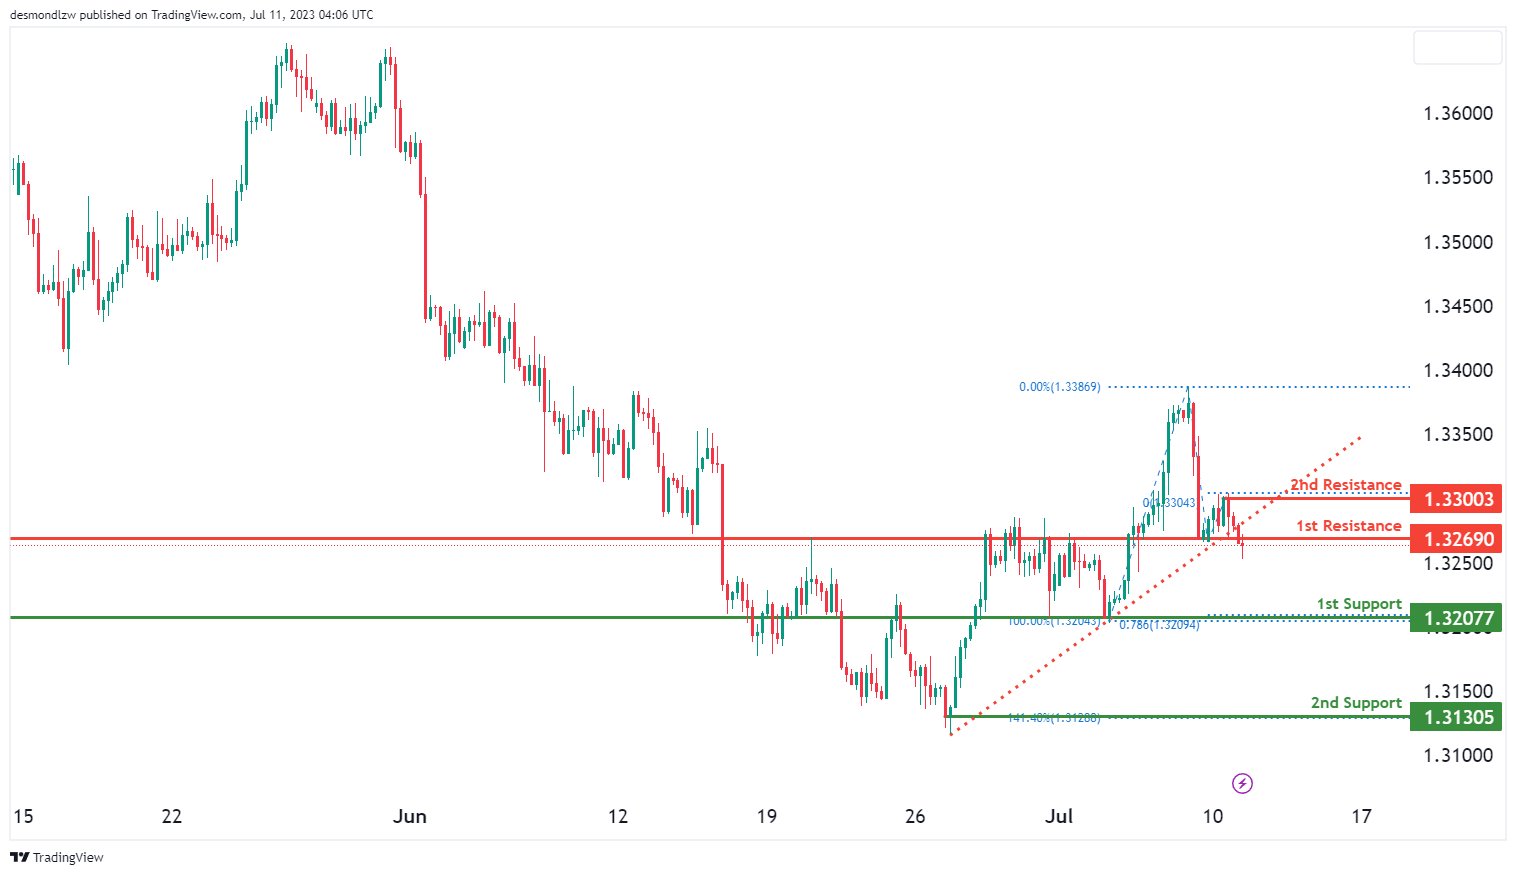
The USD/CAD chart currently demonstrates a weak bearish momentum, indicating the potential for a bearish continuation towards the 1st support level.
The 1st support is located at 1.3208 and is characterized as an overlap support, providing a significant level of price stability. Furthermore, this support level aligns with a 78.60% Fibonacci projection level, adding further significance to its role.
In addition, the 2nd support at 1.3131 acts as another overlap support and coincides with a 141.40% Fibonacci extension level, strengthening its importance as a potential level of support.
On the resistance side, the 1st resistance is positioned at 1.3269 and represents an overlap resistance. This level serves as a potential barrier to upward price movement.
Moreover, the 2nd resistance at 1.3300 is classified as a pullback resistance, suggesting a level where the price might face selling pressure.
AUD/USD:
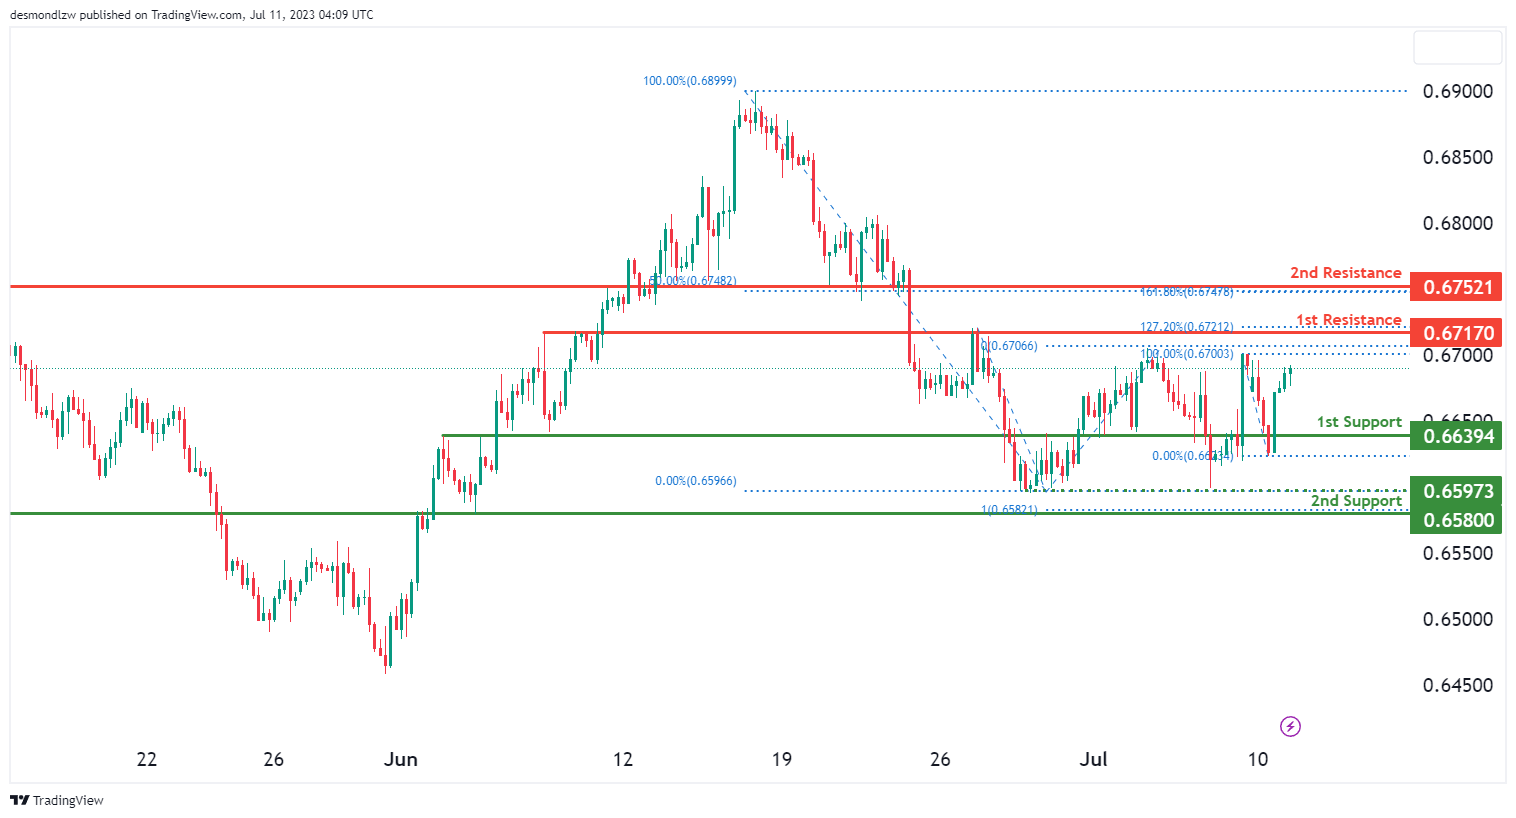
The AUD/USD chart currently exhibits a bullish momentum, indicating the potential for a bullish continuation towards the 1st resistance.
The 1st support level is located at 0.6639 and serves as an overlap support, providing a solid foundation for potential price stability. Additionally, the 2nd support at 0.6580 acts as an overlap support and coincides with a 100% Fibonacci projection level, adding further significance to this level.
On the upside, the 1st resistance is positioned at 0.6717, representing an overlap resistance. It is accompanied by a 127.20% Fibonacci extension level, emphasizing its importance as a significant barrier to further bullish movement. Should the price manage to surpass this resistance, it may target the 2nd resistance level at 0.6752. This level is characterized by an overlap resistance, a 50% Fibonacci retracement level, and a 161.80% Fibonacci extension level.
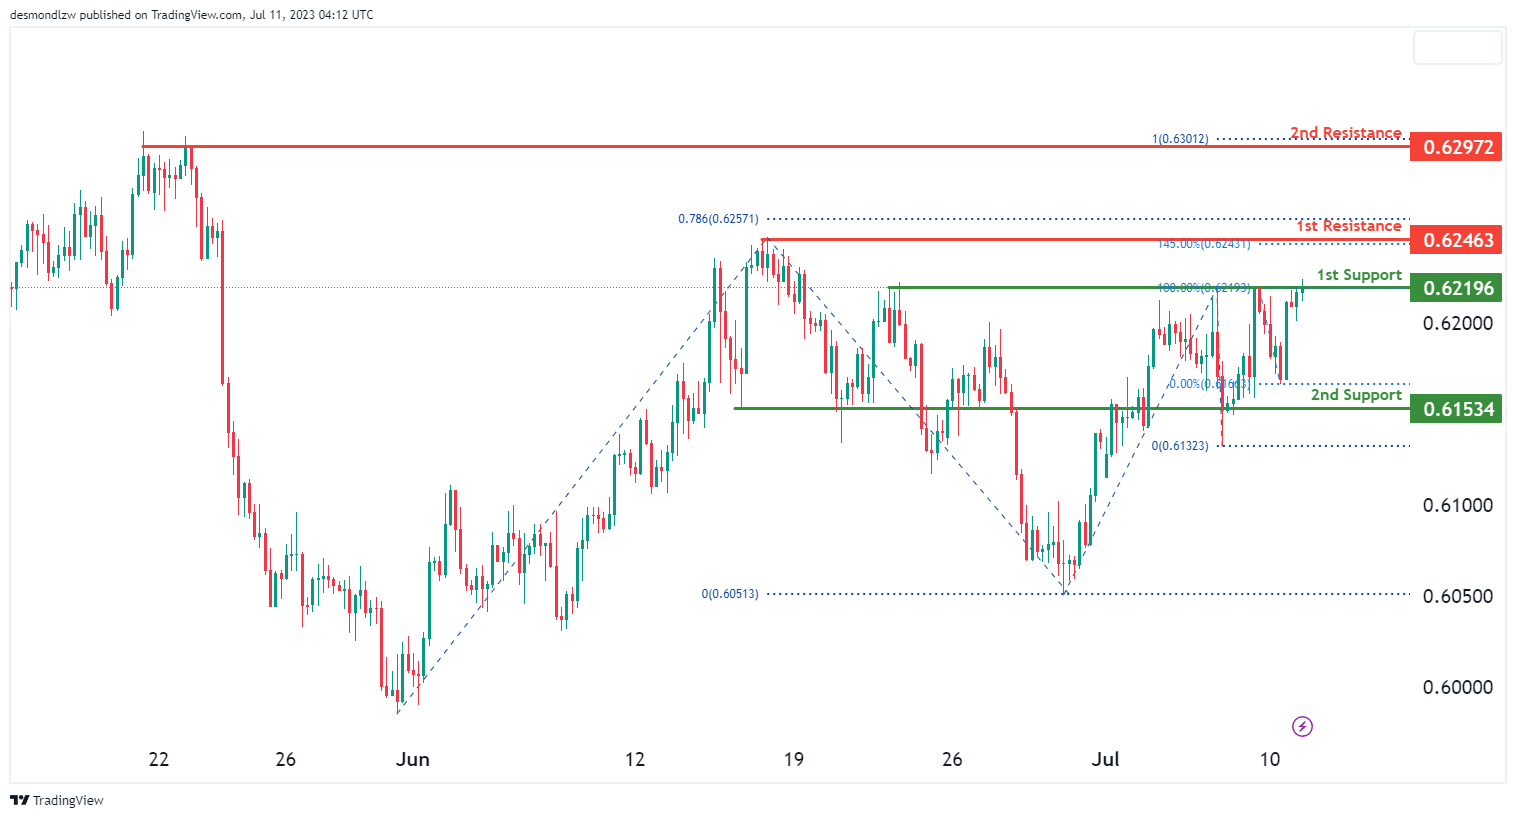
NZD/USD
The NZD/USD chart currently exhibits a weak bullish momentum with low confidence, suggesting the potential for a bullish continuation towards the 1st resistance.
The 1st support level is identified at 0.6220, representing an overlap support that provides a foundation for potential price stability. Additionally, the 2nd support at 0.6153 also acts as an overlap support, adding further significance to its role.
On the upside, the 1st resistance is positioned at 0.6246, characterized as a swing high resistance. It is accompanied by a 145.00% Fibonacci extension level and a 78.60% Fibonacci projection level, highlighting its importance as a significant barrier for further bullish movement. If the price manages to surpass this resistance, it may target the 2nd resistance level at 0.6297. This level is characterized by multi-swing high resistance and aligns with a 100% Fibonacci projection level.
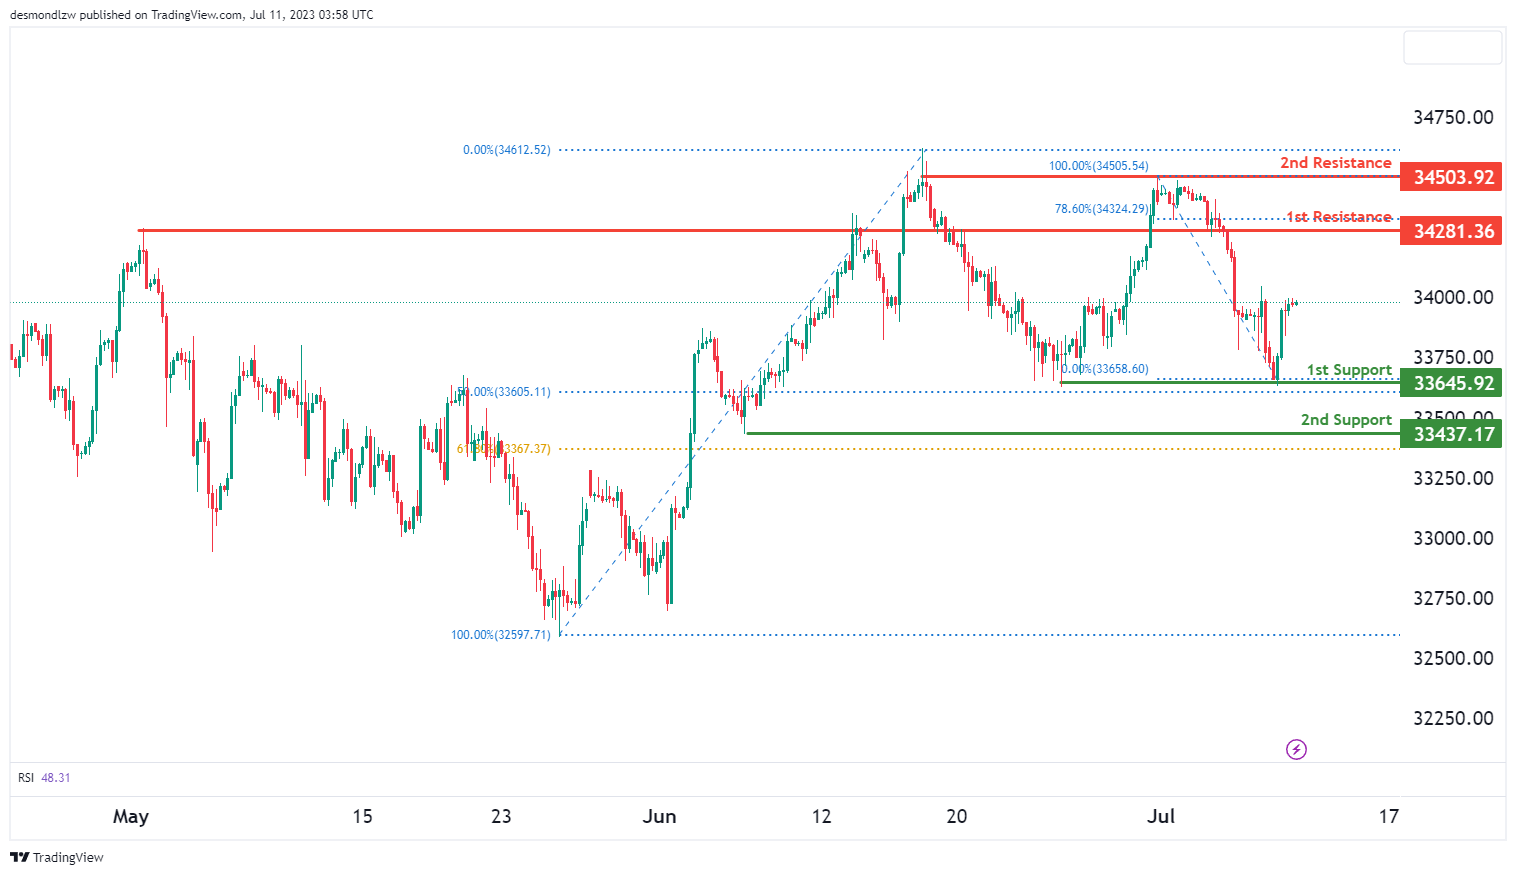
DJ30:
The DJ30 (Dow Jones Industrial Average) chart currently experiencing a bullish trend. Given this, it’s anticipated that the price might continue this bullish movement towards the first resistance.
The first support is located at 33645.92, which is considered a strong support level due to its multi-swing low support status and a 50% Fibonacci Retracement. There is a second support at 33437.17, which is deemed robust given that it’s a swing low support and at the 61.80% Fibonacci Retracement.
On the other hand, the first resistance is found at 34281.36. This resistance level is notable due to its overlap resistance and is located at the 78.60% Fibonacci Retracement. The second resistance is located at 34503.92 and is of importance due to it being a multi-swing high resistance. It could potentially hinder upward price movements.
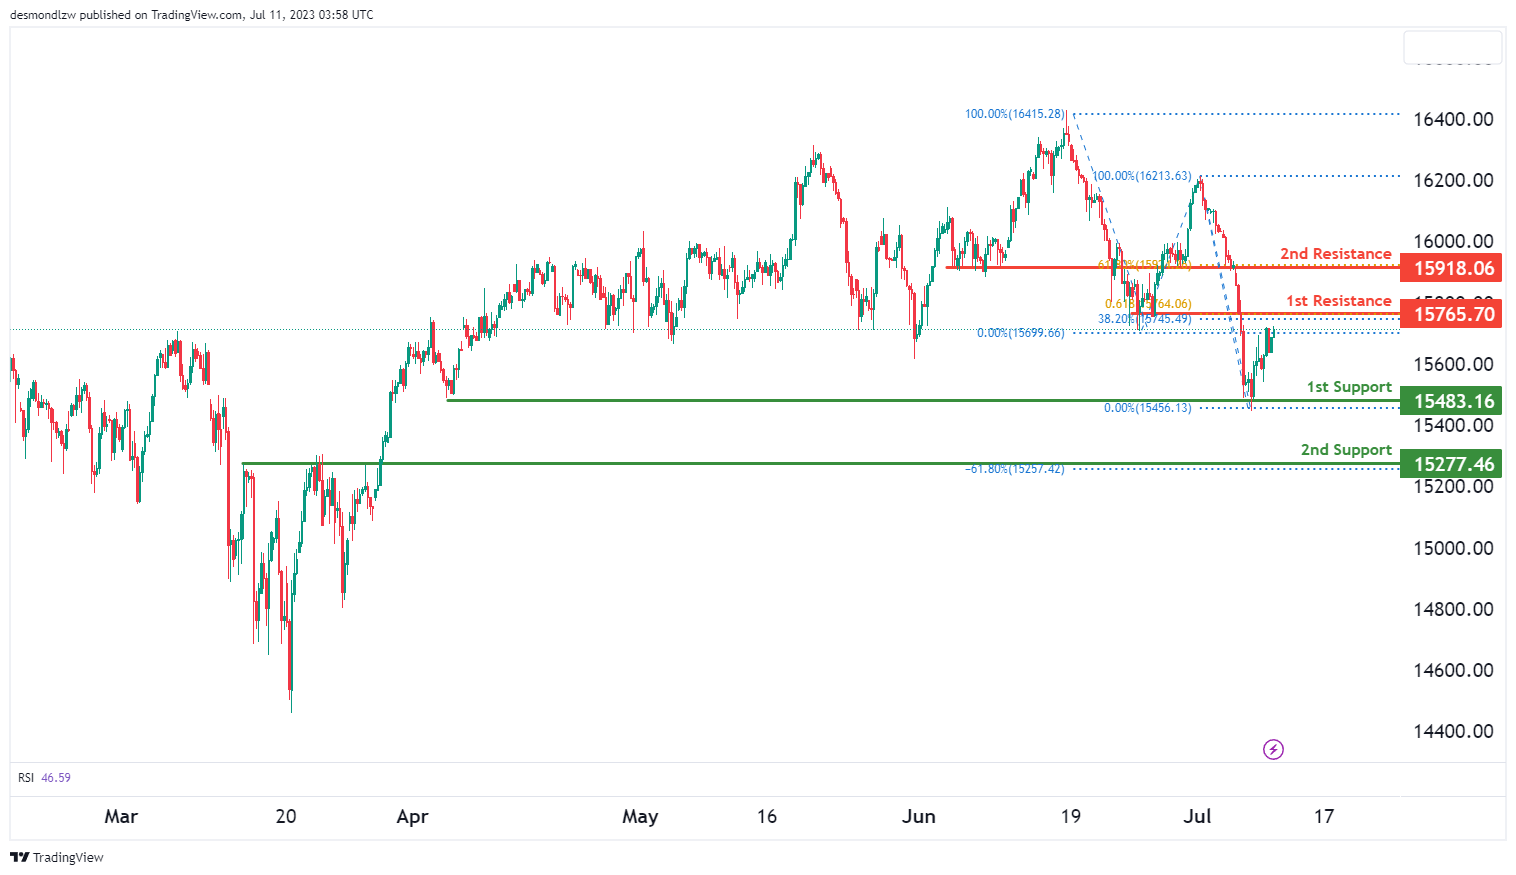
GER30:
The GER30 (DAX) chartcurrently shows a bullish momentum. It’s likely that the price may continue to rise towards the first resistance.
The first support, found at 15483.16, is deemed strong due to its role as a multi-swing low support. The second support is at 15277.46 and is recognized as solid given that it serves as an overlap support and is located at the -61.8% Fibonacci Expansion.
In contrast, the first resistance is at 15765.70, marked as significant due to its status as an overlap resistance. Additionally, it aligns with the 61.80% Fibonacci Projection and the 38.20% Fibonacci Retracement, indicating a Fibonacci confluence.
The second resistance is located at 15918.06 and is substantial due to its role as an overlap resistance and its position at the 61.80% Fibonacci Retracement. This could pose a potential barrier to upward price movements.
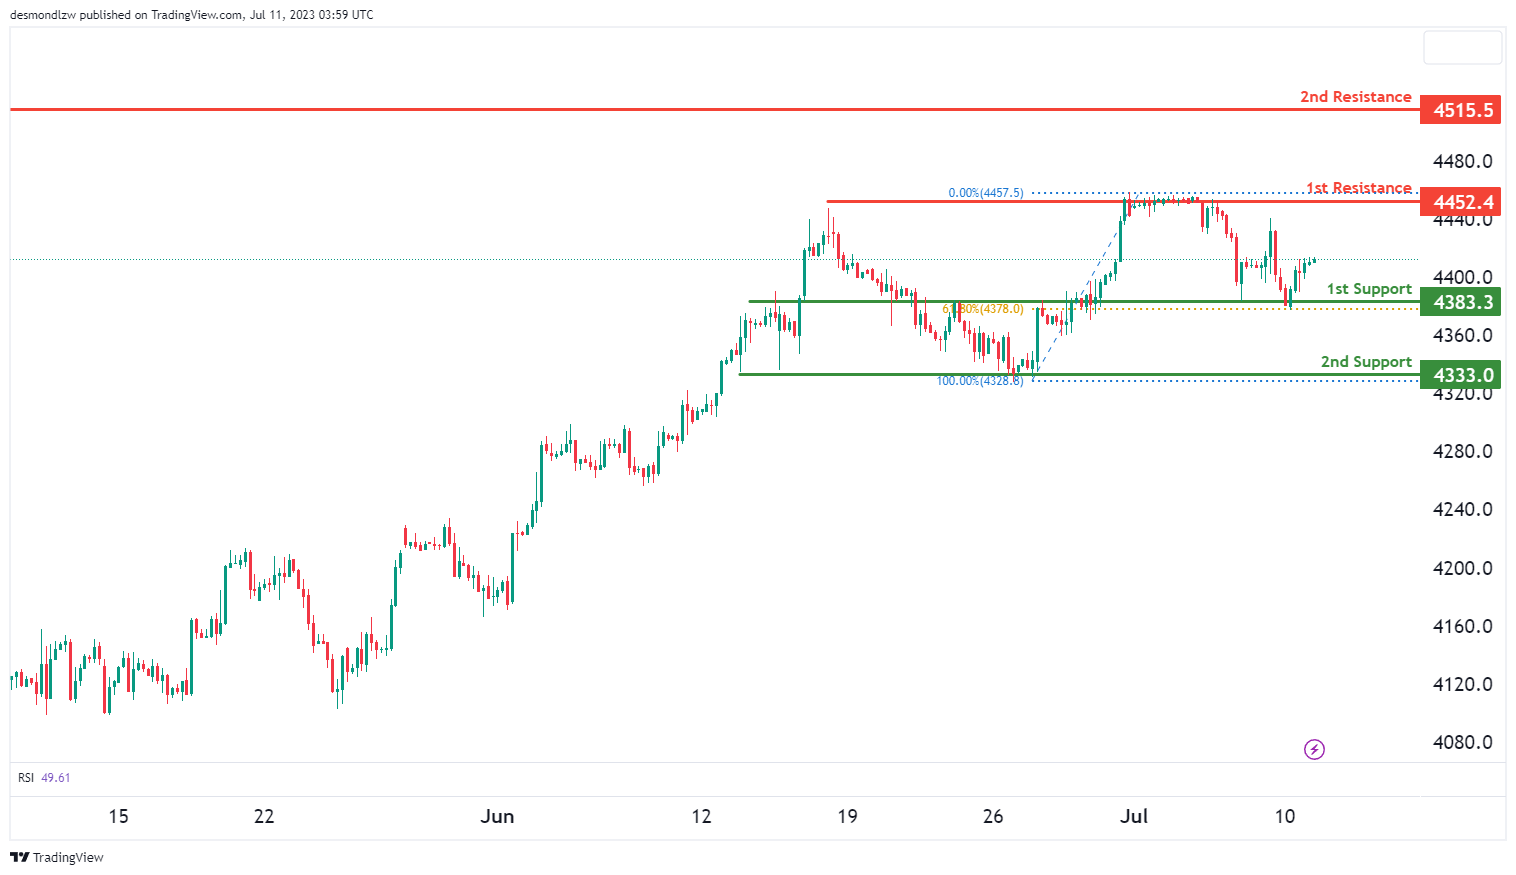
US500
The US500 (S&P 500) chart currently indicates a bullish trend. The price is anticipated to sustain its upward trajectory, moving towards the first resistance.
The first support level is at 4383.3 and is considered strong due to its position as an overlap support and its alignment with the 61.80% Fibonacci retracement level.Meanwhile, the second support is found at 4333.0, lending further strength due to its status as a multi-swing low support.
On the other hand, the first resistance is positioned at 4452.4. This level is noteworthy due to its role as a multi-swing high resistance, potentially posing a significant challenge to upward price movements.
The second resistance is situated at 4515.5 and holds significance as it’s marked as a swing high resistance, which could create an obstacle for price movements on the rise.
BTC/USD:
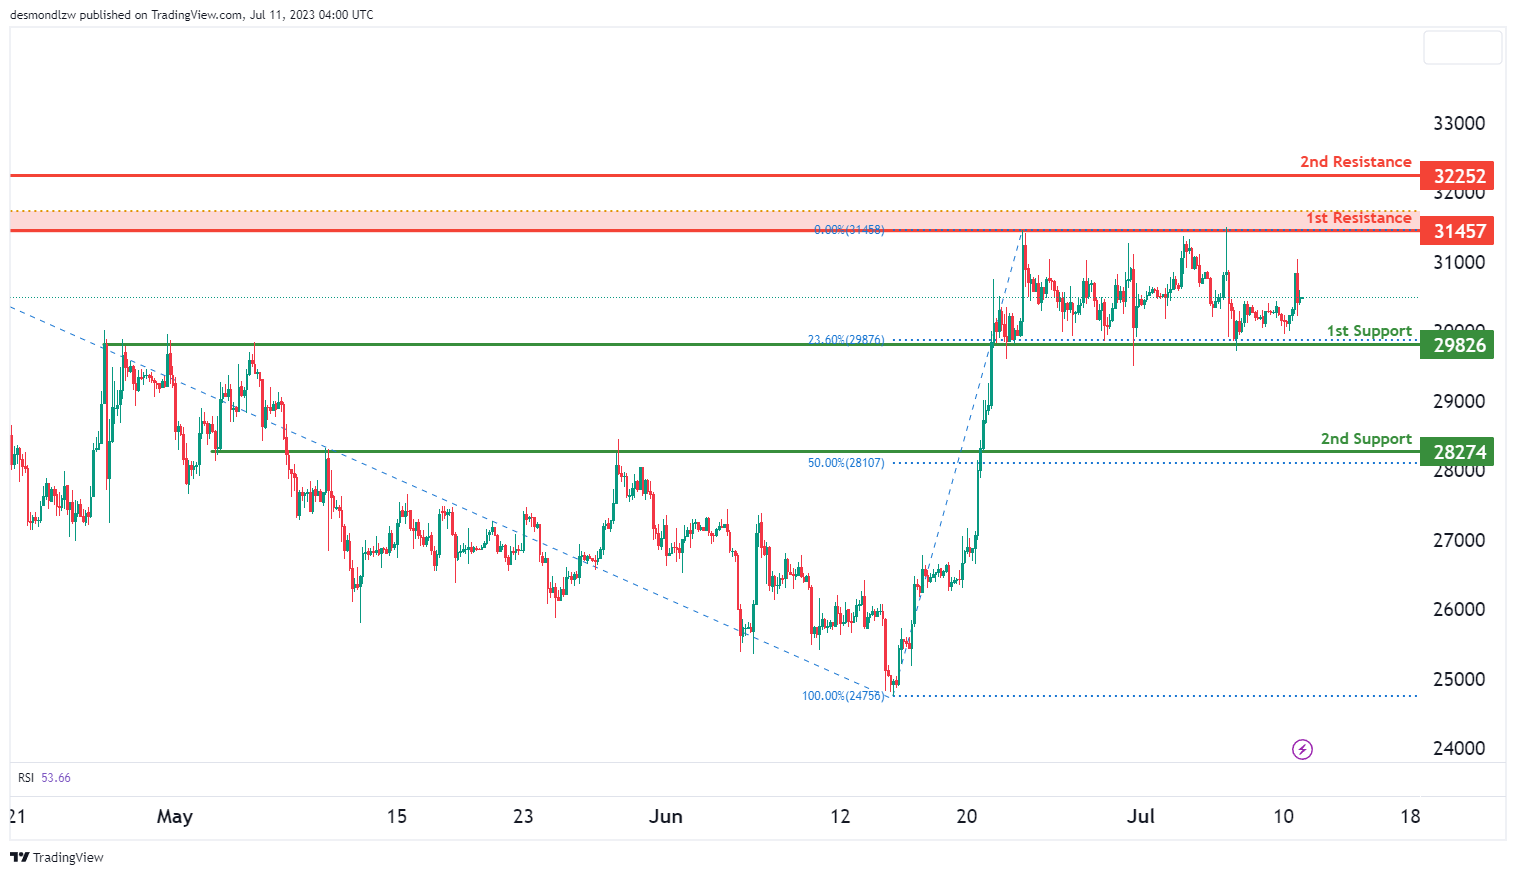
The BTC/USD instrument is currently showing a neutral overall momentum. It’s conceivable that the price might fluctuate between the 1st support and 1st resistance levels. The 1st support is positioned at 29826 and is viewed as strong due to its overlap support and a 23.60% Fibonacci Retracement.
The 2nd support, found at 28274, is also considered robust due to its overlap support and a 50% Fibonacci Retracement.
On the other hand, the 1st resistance is located at 31457 and is deemed significant owing to its multi-swing high resistance and a 61.80% Fibonacci Retracement. The 2nd resistance, at 32252, is notable for its swing high resistance nature, which could potentially pose a significant obstacle for any upward movement in price.
ETH/USD:
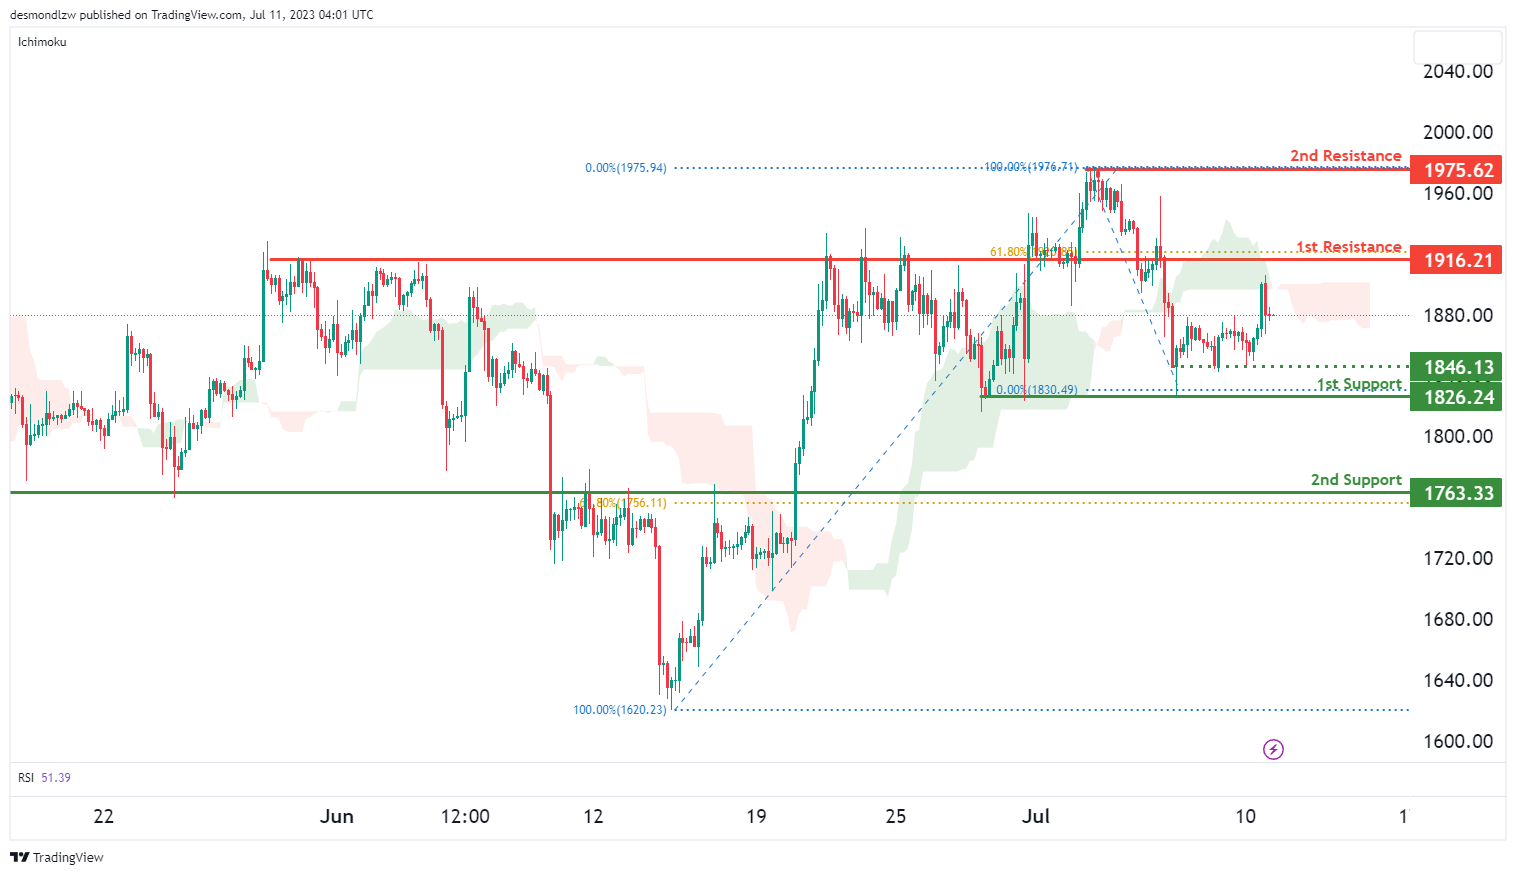
The ETH/USD instrument is currently on a bearish trend, largely attributed to the price trading below the bearish Ichimoku cloud.
As the trend proceeds, it’s probable that the price might continue on this bearish direction towards the 1st support, positioned at 1826.24. This support level is regarded as strong due to its character as a multi-swing low support.
Further on, the 2nd support stands at 1763.33 and is considered strong due to its overlap support and a 50% Fibonacci Retracement.
On the other hand, the 1st resistance is positioned at 1916.21 and is recognized as significant due to its overlap resistance and a 61.80% Fibonacci Retracement. The 2nd resistance, found at 1975.62, is also notable as it represents swing high resistance, and could potentially pose an obstacle to any upward price movements.
An intermediate support level is also noticeable at 1846.13, recognized as durable due to its status as a multi-swing low support.
WTI/USD:
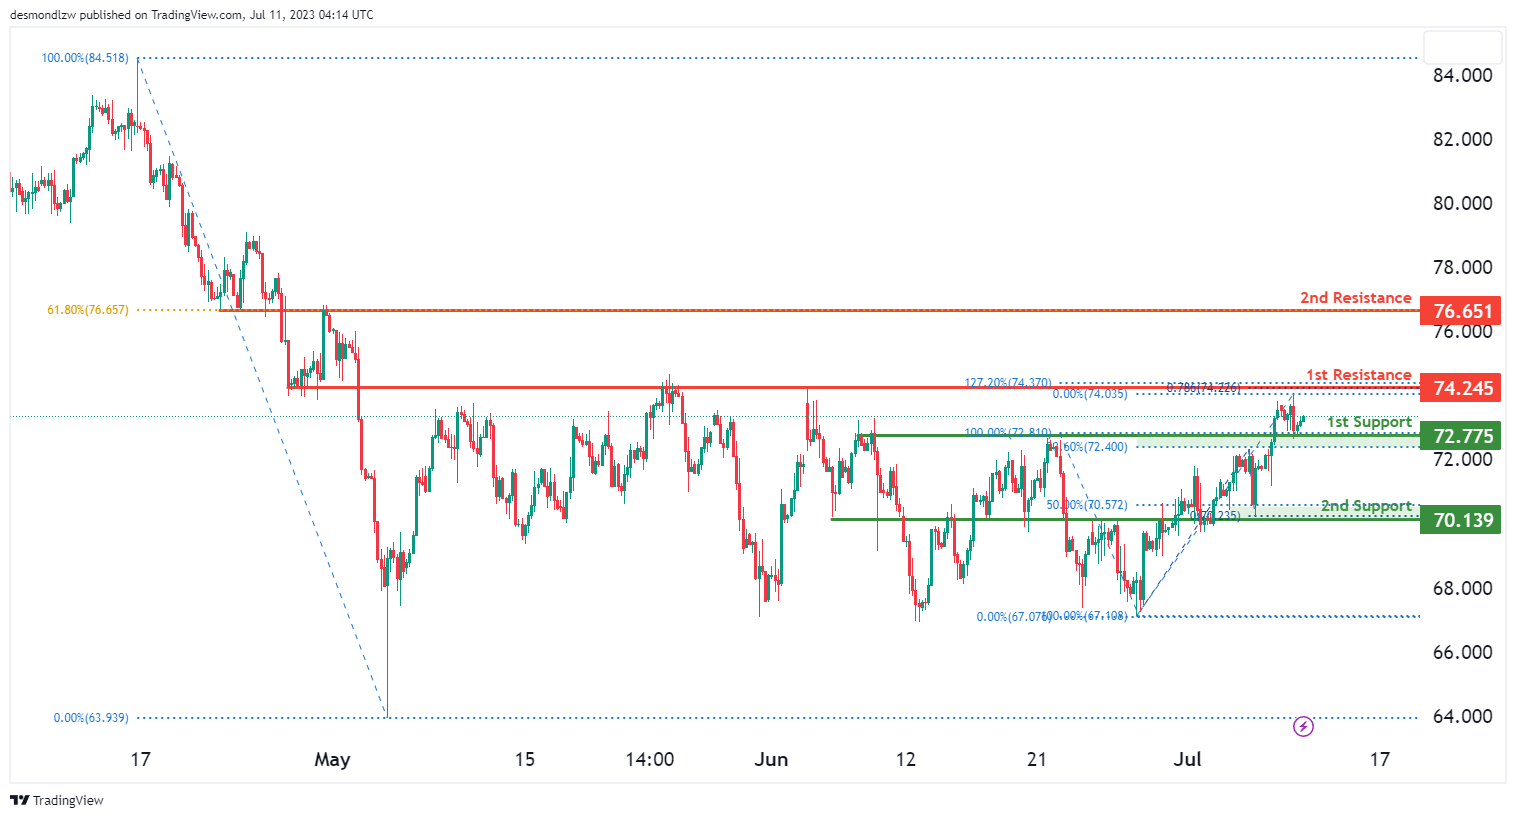
The WTI/USD chart currently shows a bullish momentum, indicating the potential for a bullish continuation towards the 1st resistance.
The 1st support level is located at 72.78 and is considered a significant overlap support, further reinforced by a 23.60% Fibonacci retracement level. This level provides a solid foundation for potential price stability. Additionally, the 2nd support at 70.14 also acts as an overlap support and aligns with a 50% Fibonacci retracement level, adding further significance.
On the upside, the 1st resistance is situated at 74.25. This level represents an overlap resistance and is accompanied by a 127.20% Fibonacci extension and a 78.60% Fibonacci projection, marking it as a key hurdle for the bullish continuation. If the price manages to breach this resistance, it may target the 2nd resistance at 76.65. This level is characterized as an overlap resistance and coincides with a 61.80% Fibonacci retracement level.
XAU/USD (GOLD):
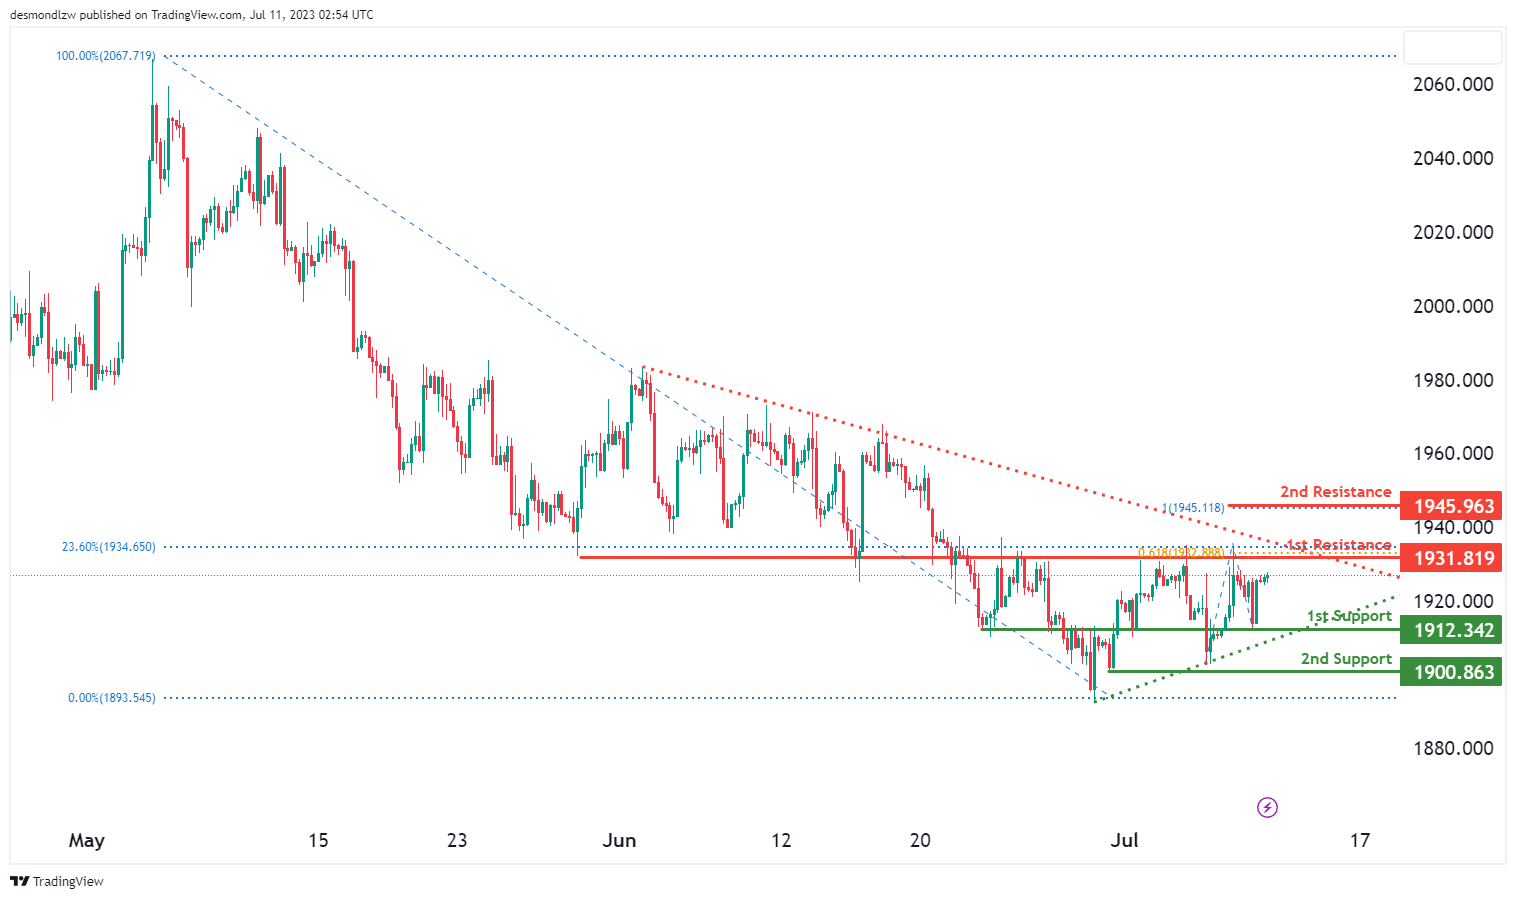
The XAU/USD pair is demonstrating a neutral trend, indicating possible price fluctuations between the 1st resistance and 1st support levels.
The 1st support level is positioned at 1912.34 and is classified as an overlap support, offering considerable stability for the price. Should the price descend below this level, it may encounter another protective layer at the 2nd support, identified at 1900.86, a noteworthy swing low support.
On the contrary, if the price advances, it could confront the 1st resistance at 1931.81. This overlap resistance is consistent with a 23.6% Fibonacci retracement and a 61.8% Fibonacci projection, representing a Fibonacci confluence, which further strengthens this resistance level.
Should the price succeed in surpassing the 1st resistance, it could set its trajectory towards the 2nd resistance located at 1945.96. This level coincides with a 100% Fibonacci projection, marking another key resistance point.
In addition, the present chart exhibits a symmetrical triangle pattern, symbolizing a period of price consolidation before the price is forced to either break out or break down. A move above the upper trendline of this pattern could signify a bullish breakout, while a plunge below the lower trendline could denote a bearish breakdown.
USD/JPY Daily Outlook
Daily Pivots: (S1) 140.74; (P) 141.87; (R1) 142.47; More...
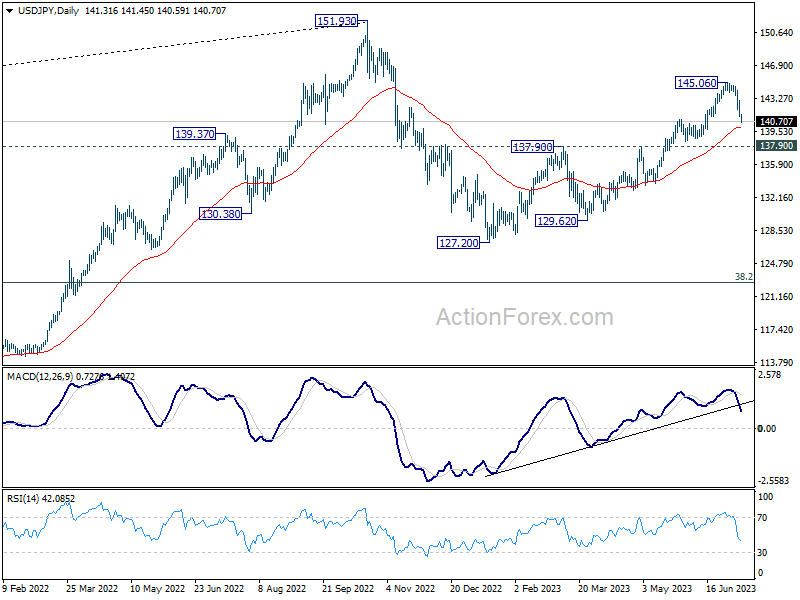
USD/JPY's fall from 145.06 continues today and and breaches 140.90 resistance turned support. There is no clear sign of bottoming yet, and intraday bias stays on the downside for 137.90 next. On the upside, above 142.06 minor resistance will turn intraday bias neutral and bring consolidations first, before staging another fall.
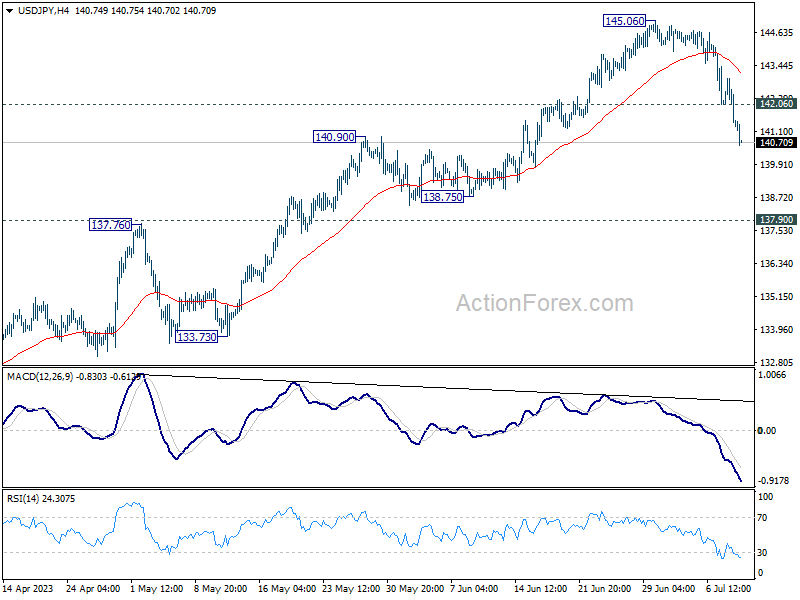
In the bigger picture, current downside acceleration, as seen in daily MACD, argues that fall from 145.06 is already the third leg of the corrective pattern from 151.93 (2022 high). Sustained break of 137.90 resistance turned support should confirm this case and target 127.20 (2023 low) and below. For now, this will remain the favored case as long as 145.06 resistance holds.
Dollar Decline Intensifies, Yen Holding Pole Position
Dollar's selloff gained momentum in today's Asian trading session, breaking through near-term support levels against Euro and Sterling. The market remains skeptical about the possibility of Fed implementing two or more rate hikes this year. With US CPI release scheduled for tomorrow, traders appear to be positioning themselves for potential downside surprises. Meanwhile, major US stock indexes closed slightly higher overnight, and benchmark 10-year yield slipped below 4% mark during Asian session.
At present, Japanese Yen is holding its position as the strongest currency of the week, as it continues to reverse its downtrend from earlier this year. Swiss Franc stands as the second strongest, followed by Euro, and then Sterling. The relative positions of these European majors could change based on the movements of their crosses, which are currently trading within established ranges. Commodity currencies are distinctly trailing in the race against the greenback.
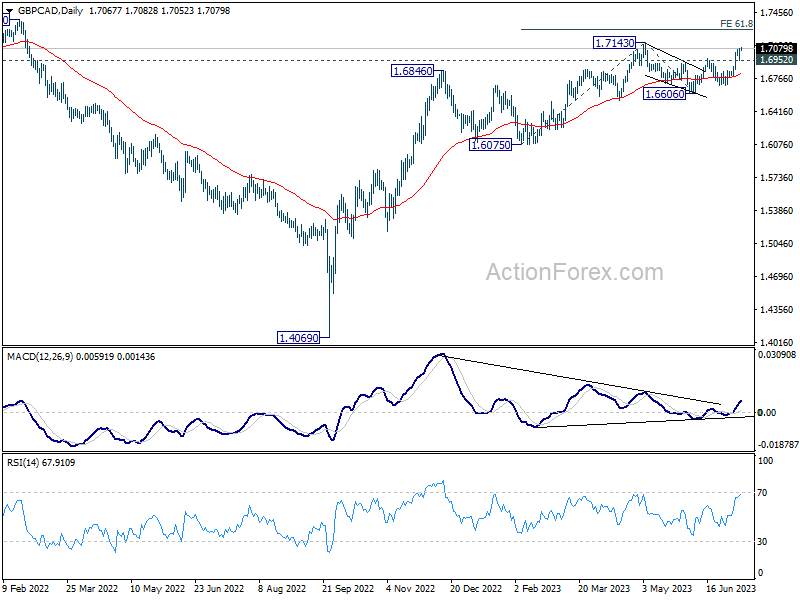
In the context of significant economic events, GBP/CAD deserves attention. Today's spotlight is on UK employment data, while tomorrow brings UK GDP report and BoC rate decision. Technically speaking, as long as 1.6952 support level holds, rebound from 1.6606 is expected to extend past 1.7143 high. If this happens, it would signify resumption of the overall uptrend from 1.4069 (2022 low), targeting 61.8% projection of 1.6075 to 1.7143 from 1.6606 at 1.7266 in the near term. Nevertheless, break of 1.6952 could extend the corrective pattern from 1.7143 with another falling leg before uptrend resumes.
In Asia, at the time of writing, Nikkei is up 0.04%. Hong Kong HSI is up 1.53%. China Shanghai SSE is up 0.48%. Singapore Strait Times is up 0.12%. Japan 10-year JGB yield is down -0.0135 at 0.459. Overnight, DOW rose 0.62%. S&P 500 rose 0.24%. NASDAQ rose 0.18%. 10-year yield dropped -0.044 to 4.006.
Fed Bostic advocates patience as restrictiveness is working
Atlanta Fed President Raphael Bostic projected a sense of confidence in the current monetary policies during his speech on Monday, suggesting the potential for patience as restrictive strategy seems to be yielding desired outcomes.
Bostic noted, "I have the view that we can be patient — our policy right now is clearly in the restrictive territory," adding that the economy's signs of slowing down indicate that the policy is achieving its intended effect.
The Atlanta Fed President pointed out that underlying data for prices "is actually telling a very positive story." Bostic believes that momentum is building in the disinflationary trend, stating, "We have got that momentum going. You could see inflation getting back to 2% without having to do more."
Despite his overall optimistic outlook, Bostic did note that he would be concerned if expectations for consumer-price increases became "unanchored." This situation would necessitate further action from policymakers. However, he expressed confidence that "inflation is still moving steadily back to target" and that inflation expectations are centered around 2%.
Bostic summed up his stance by stating, "I am comfortable being patient."
Fed Daly: We need to raise rates to bridle the economy more
San Francisco Fed President Mary Daly acknowledged yesterday that while inflation appears to be slowing, it remains far too elevated. In an interview held at the Brookings Institution in Washington, D.C., Daly indicated the need for further measures to counteract inflationary pressures.
She affirmed, "I think it's a very reasonable projection to say a couple of more rate hikes will be necessary."
Daly reflected on the resilience of the U.S. economy, which has shown surprising strength despite ongoing economic challenges. The robust data, according to Daly, signal a clear need for intervention: "We need to raise rates to bridle that economy more."
"With labor market still strong, inflation high, risks of doing too little are outweighing risks of doing too much," she added.
Nevertheless, "It's appropriate to slow the pace of rate hikes."
Australia's Westpac consumer sentiment up 2.7% mom, but pessimism still prevails
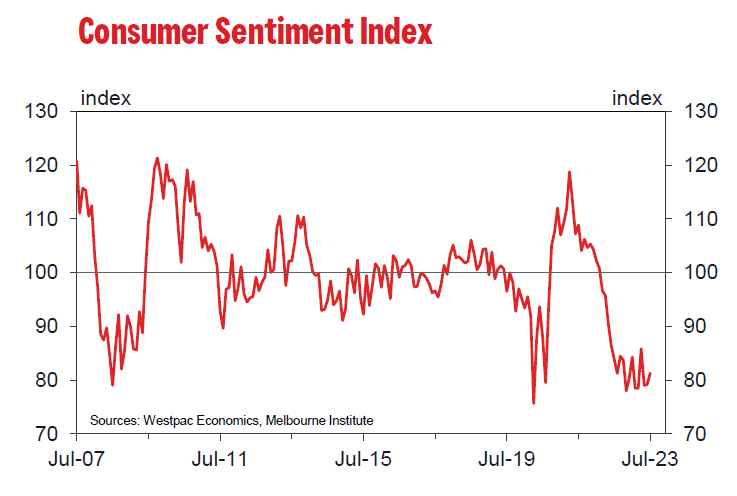
Westpac-MI Consumer Sentiment Index in Australia witnessed a modest 2.7% mom increase in July, rising to 81.3. However, the index remains entrenched the deeply pessimistic territory, a condition that has prevailed for over a year now.
According to Westpac, the main driving force behind this month's uplift is easing in monthly inflation, which dipped from 6.8% in April to 5.6% in May.
RBA decision to pause in July, however, failed to instill confidence. In fact, the sentiment was considerably more buoyant before the decision, with an index reading of 88, marking an 11.2% rise from June. Post-RBA responses, on the other hand, presented a combined index reading of 77.9, a dip of -11.6% from the pre-RBA sample and a -1.6% fall from June's reading.
Westpac's key message is clear: "Sentiment is probably not going to stage a sustained lift from current deeply pessimistic levels until inflation is much lower and interest rates are firmly on hold."
Looking ahead to the RBA's next meeting on August 1, Westpac expects that if annual underlying inflation prints around 6.1% for the June quarter, and if the unemployment rate continues to hold well below full employment, the case for higher rates will be clear.
As such, Westpac anticipates that RBA Board will raise cash rate by 0.25% at both August and September Board meetings, followed by a prolonged pause. The first rate cut in the subsequent easing cycle is expected next May.
Looking ahead
UK employment, and Germany ZEW economic sentiment are the main features in European session. Germany will also publish CPI final while Italy will release industrial production. Later in the day, US will release NFIB small business index.
USD/JPY Daily Outlook
Daily Pivots: (S1) 140.74; (P) 141.87; (R1) 142.47; More...
USD/JPY's fall from 145.06 continues today and and breaches 140.90 resistance turned support. There is no clear sign of bottoming yet, and intraday bias stays on the downside for 137.90 next. On the upside, above 142.06 minor resistance will turn intraday bias neutral and bring consolidations first, before staging another fall.
In the bigger picture, current downside acceleration, as seen in daily MACD, argues that fall from 145.06 is already the third leg of the corrective pattern from 151.93 (2022 high). Sustained break of 137.90 resistance turned support should confirm this case and target 127.20 (2023 low) and below. For now, this will remain the favored case as long as 145.06 resistance holds.
Economic Indicators Update
| GMT | Ccy | Events | Actual | Forecast | Previous | Revised |
|---|---|---|---|---|---|---|
| 23:01 | GBP | BRC Like-For-Like Retail Sales Y/Y Jun | 4.20% | 3.70% | ||
| 23:50 | JPY | Money Supply M2+CD Y/Y Jun | 2.60% | 2.70% | 2.70% | |
| 00:30 | AUD | Westpac Consumer Confidence Jul | 2.70% | 0.20% | ||
| 01:30 | AUD | NAB Business Conditions Jun | 9 | 8 | ||
| 01:30 | AUD | NAB Business Confidence Jun | 0 | -4 | ||
| 06:00 | GBP | Claimant Count Change Jun | -13.6K | |||
| 06:00 | GBP | ILO Unemployment Rate (3M) May | 3.80% | 3.80% | ||
| 06:00 | GBP | Average Earnings Including Bonus 3M/Y May | 6.80% | 6.50% | ||
| 06:00 | GBP | Average Earnings Excluding Bonus 3M/Y May | 7.20% | |||
| 06:00 | EUR | Germany CPI M/M Jun F | 0.30% | 0.30% | ||
| 06:00 | EUR | Germany CPI Y/Y Jun F | 6.40% | 6.40% | ||
| 08:00 | EUR | Italy Industrial Output M/M May | 0.90% | -1.90% | ||
| 09:00 | EUR | Germany ZEW Economic Sentiment Jul | -9.5 | -8.5 | ||
| 09:00 | EUR | Germany ZEW Current Situation Jul | -60 | -56.5 | ||
| 09:00 | EUR | Eurozone ZEW Economic Sentiment Jul | -10.2 | -10 | ||
| 10:00 | USD | NFIB Business Optimism Index Jun | 89.9 | 89.4 |
Australia’s Westpac consumer sentiment up 2.7% mom, but pessimism still prevails
Westpac-MI Consumer Sentiment Index in Australia witnessed a modest 2.7% mom increase in July, rising to 81.3. However, the index remains entrenched the deeply pessimistic territory, a condition that has prevailed for over a year now.
According to Westpac, the main driving force behind this month's uplift is easing in monthly inflation, which dipped from 6.8% in April to 5.6% in May.
RBA decision to pause in July, however, failed to instill confidence. In fact, the sentiment was considerably more buoyant before the decision, with an index reading of 88, marking an 11.2% rise from June. Post-RBA responses, on the other hand, presented a combined index reading of 77.9, a dip of -11.6% from the pre-RBA sample and a -1.6% fall from June's reading.
Westpac's key message is clear: "Sentiment is probably not going to stage a sustained lift from current deeply pessimistic levels until inflation is much lower and interest rates are firmly on hold."
Looking ahead to the RBA's next meeting on August 1, Westpac expects that if annual underlying inflation prints around 6.1% for the June quarter, and if the unemployment rate continues to hold well below full employment, the case for higher rates will be clear.
As such, Westpac anticipates that RBA Board will raise cash rate by 0.25% at both August and September Board meetings, followed by a prolonged pause. The first rate cut in the subsequent easing cycle is expected next May.