Sample Category Title
GBPUSD Wave Analysis
- GBPUSD reversed from resistance level 1.2510
- Likely to fall to support level 1.2340
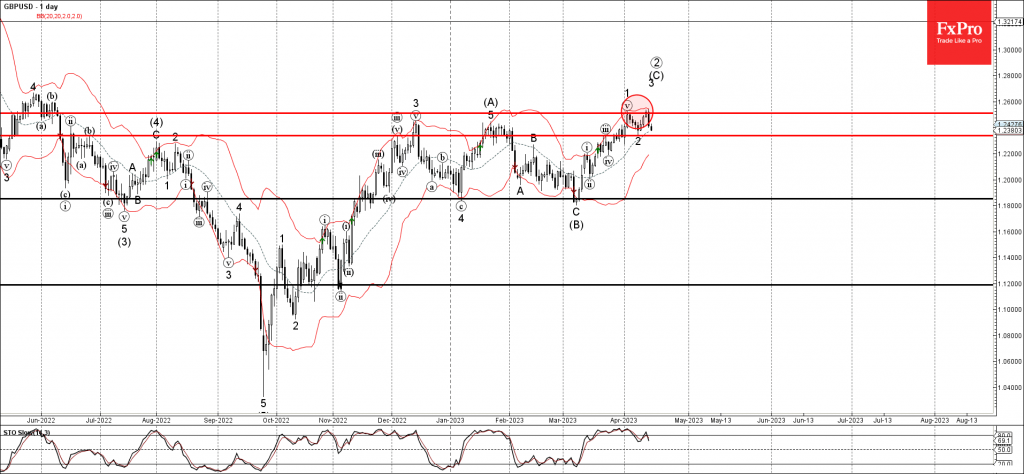
GBPUSD continues to fall after the price reversed down from the key resistance level 1.2510 (which stopped the previous minor impulse wave 1 at the start of April).
The downward reversal from the resistance level 1.2510 created the daily Japanese candlesticks reversal pattern Evening Star.
Given the bearish divergence on the daily Stochastic, GBPUSD can then be expected to fall further toward the next support level 1.2340 (low of the previous minor correction 2).
Japanese Yen Extends Losses
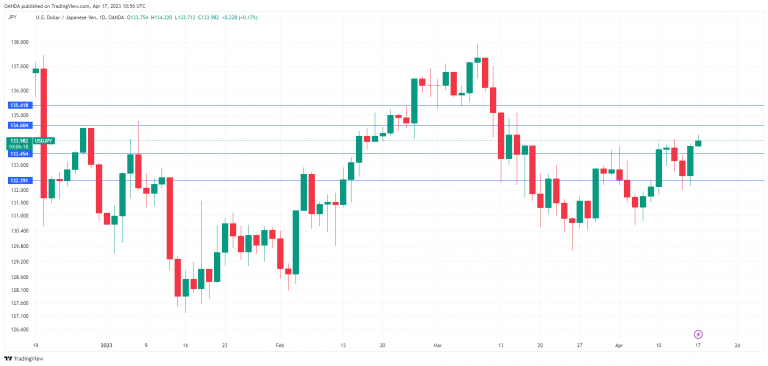
The Japanese yen took it on the chin on Friday, as USD/JPY jumped 0.90%. The yen has edged lower on Monday and fell as low as 134.22, its lowest level since March 15th. With expectations rising that the Fed will raise rates in May, the yen could remain under pressure and fall closer to the symbolic 135 line.
It was a light data calendar in Japan last week, giving investors plenty of time to focus on comments from new BoJ Governor Ueda. At the G-20 meeting in Washington, Ueda stuck to his script of “more of the same”, saying the Bank would continue its ultra-loose monetary policy. There has been pressure on Ueda to tighten policy, given that inflation hit 3.1% in February, higher than the 2% target.
The Bank of Japan has become an outlier as other central banks have raised rates in order to contain inflation. In fairness, inflation in Japan compares to the levels we are seeing in most developed economies. Former Governor Kuroda insisted that inflation has been driven by higher import costs rather than stronger domestic demand and said real wages would have to rise before the BoJ would consider raising rates. The problem is that real wages continue to fall – the decline of 2.6% in February, marked an 11th straight decline.
Until wage growth recovers, there is little chance that the BoJ will tighten policy. That doesn’t mean the BoJ won’t make any moves in the near future, especially if the yen continues to depreciate. In December, the BoJ blindsided the markets by widening the target band on 10-year government bonds, which sent the yen sharply higher.
Fed’s Waller, Bostic says more hikes needed
The US dollar powered higher on Friday despite a soft retail sales report, as a rise in inflation expectations and hawkish Fedspeak raised the odds of a rate hike in May.
UoM inflation expectations for the next 12 months jumped 4.6% in April, up sharply from 3.6% in March. Consumer confidence has been on the low side as inflation remains high, and the decline in retail sales was another sign that the US economy is losing steam.
Fed member Waller stated on Friday that the Fed would need to continue raising rates because inflation is “far above target” and the labor market remains “quite tight”. Waller warned that the Fed would have to keep rates at a high level for an extended period and for longer than the markets expected. Fed member Bostic urged one or two more 25-bp hikes before wrapping up the current rate-tightening cycle. The likelihood of a 25-bp increase in May jumped to 80% on Friday, up from 68% a day earlier, which propelled the US dollar to strong gains at the end of the week.
USD/JPY Technical
- There is resistance at 134.60 and 135.42
- 133.45 and 132.39 are providing support.
Gold Retreats from Recent Highs; Bulls Try to Keep It Above 2,000
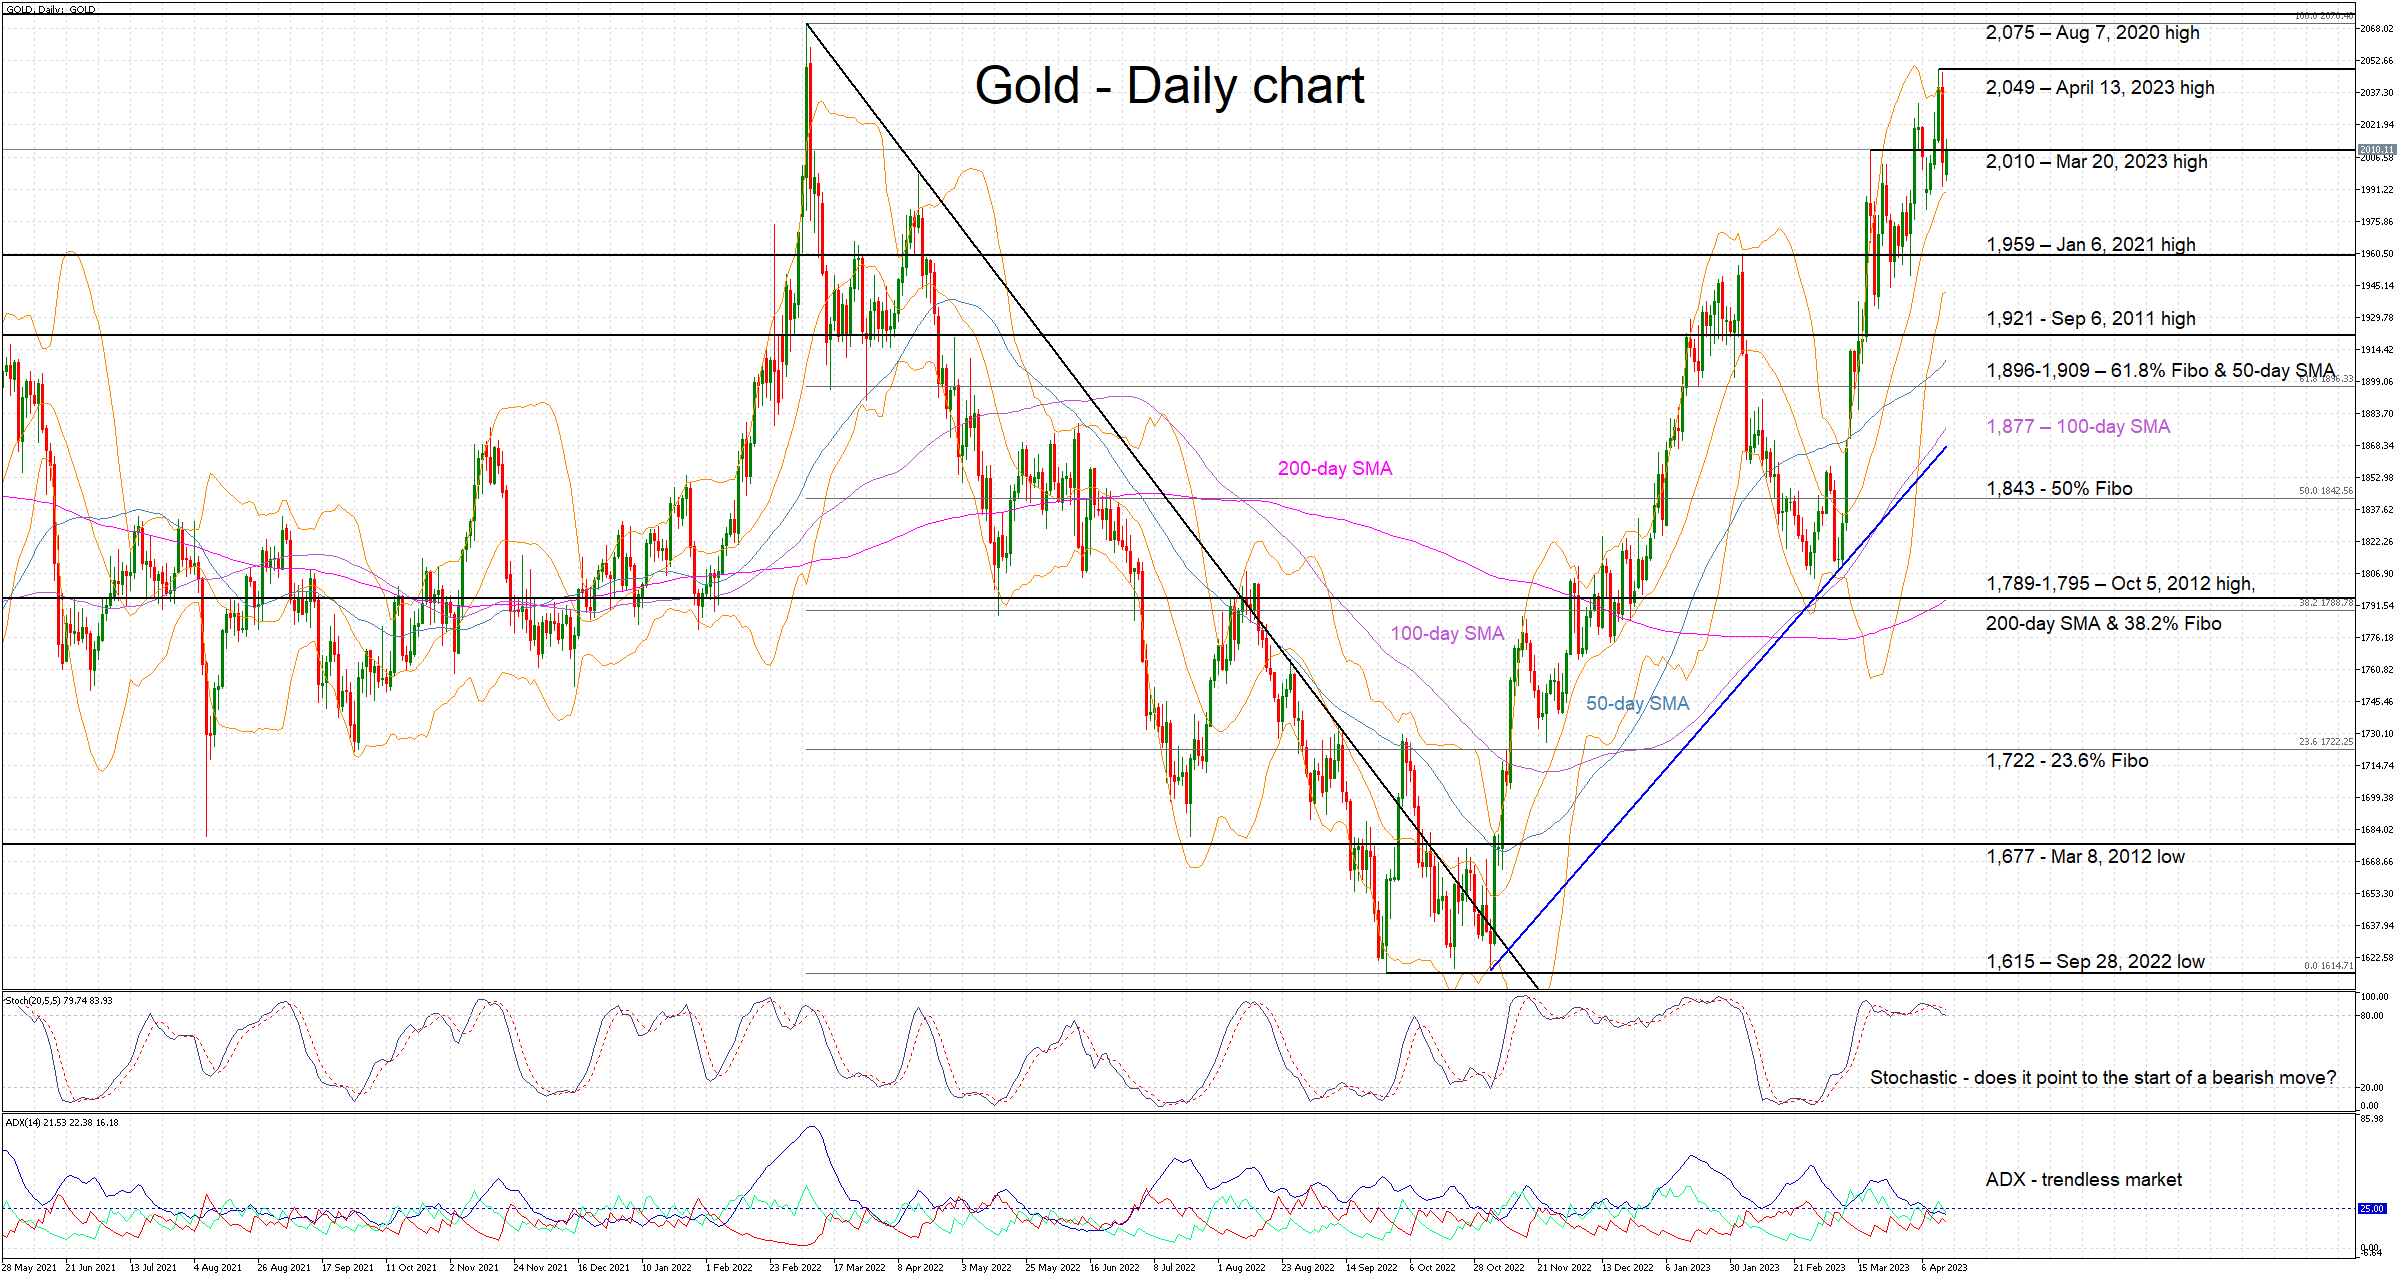
Gold is hovering around the March 20, 2023 high of 2,010, having retreated from the recent one-year higher high. Keeping gold price above the 2,000 threshold appears to be their primary target for the bulls, following the rather explosive move from the early March 2023 dip at the 1,800 area.
On the other hand, gold bears are trying to stage a comeback. They appeared massively unprepared at the recent rally as multiple resistance points were broken until the April 13, 2023 high of 2,049. Favouring the bears, the momentum indicators seem to suggest that the bullish move has run its course. In particular, the Average Directional Movement Index (ADX) is clearly pointing to a trendless market at this juncture.
Interestingly, the stochastic oscillator is sending a “double” message. This indicator has been hovering at its overbought (OB) territory for the past month, clearly showing signs of exhaustion. In addition, the recent higher high in gold has not been confirmed by a similar print in the stochastic, setting the scene for a bearish divergence.
Should the bears muster the courage and take advantage of the bearish signals, they would aim for a break of the 2,000 level. Lower, the January 6, 2021 high of 1,959 seems to be a strong support area, just ahead of the September 6, 2021 high of 1,921.
On the other hand, the bulls would love another retest of the recent high of 2,049. If successful, the August 7, 2020 high of 2,075 would then be the next target.
To sum up, the recent rally appears to have run out of gas. Gold bears are trying to push the price below the 2,000 mark on the back of some initial bearish signs from the momentum indicators.
EUR/USD: Short-Term Weakness Can Resume to 1.0925
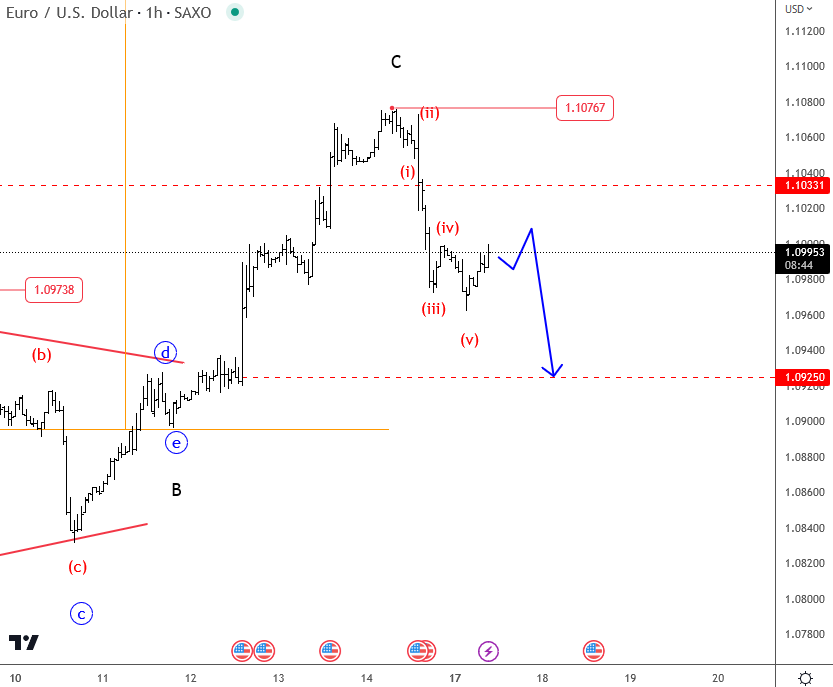
As you know the US CPI came out better than expected last week at 5.0%, so we have seen some USD weakness at the start of the week, but then some of the losses got erased on Friday after FED officials said that there is for another interest rate hike. In fact, the EURUSD pair is coming down in five waves after bulls failed at Feb 2023 highs, so it appears there can be more weakness early this week, possibly even back to the Apirl 12 level; the moment of the US CPI release.
Gold Formed an Important Bearish Pattern
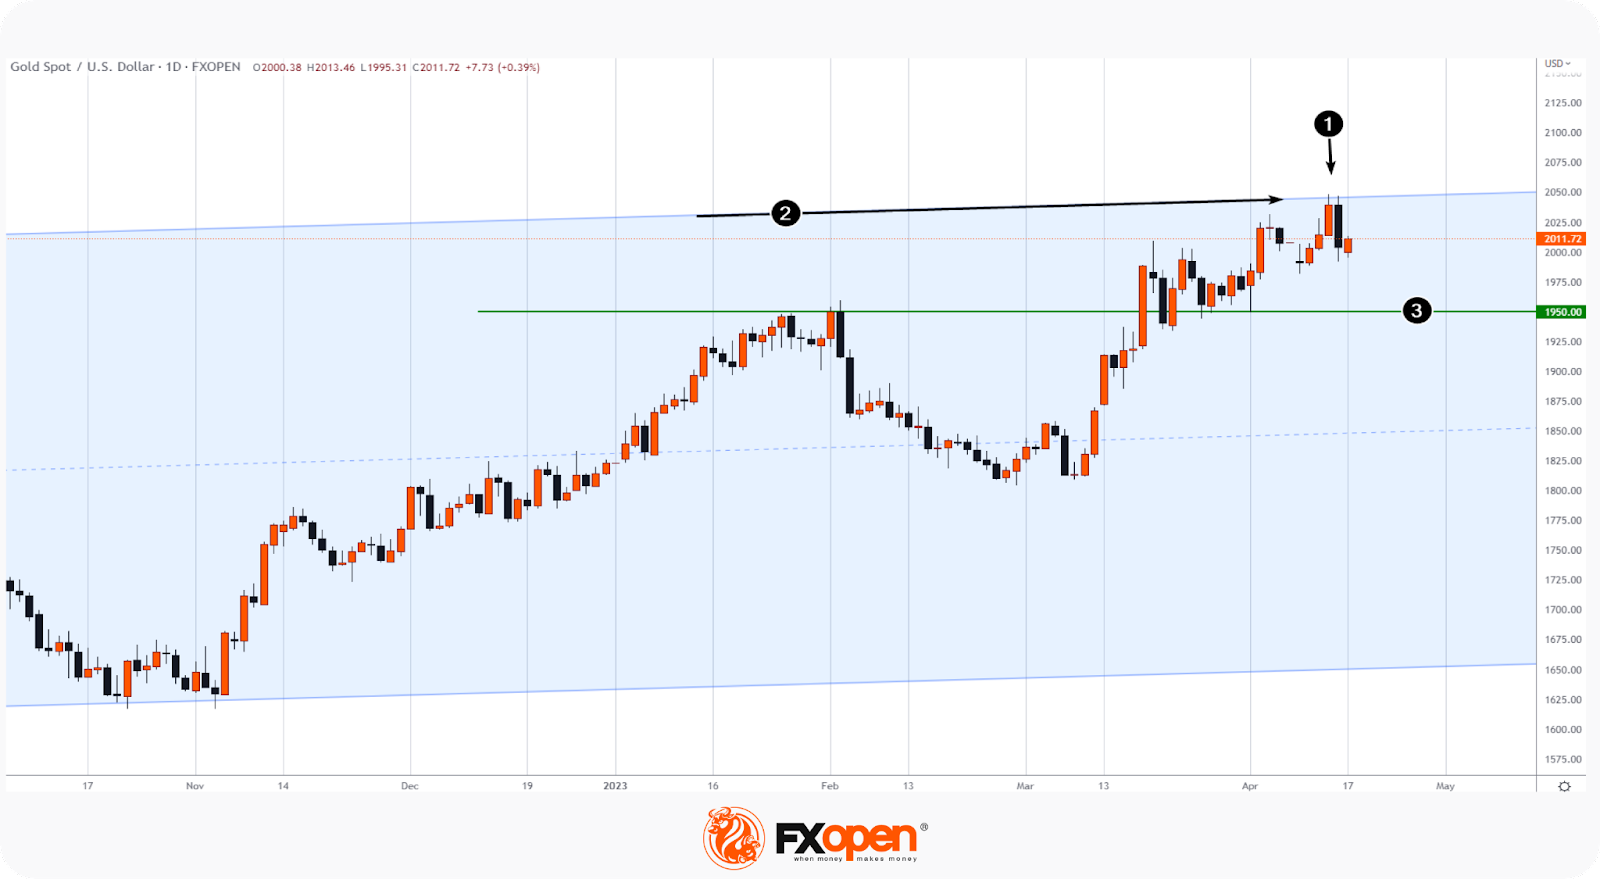
A bearish engulfing pattern (1) has formed on the gold price chart. Two facts make it important:
- The pattern has formed at the line (2) of the resistance of the trend channel, originating at the end of 2019;
- The pattern was formed against the background of the discussed news about the US economy, which affected the value of the US dollar.
On Thursday, the price of gold rose (and the US dollar index fell to the lows of the year) after the publication of the Producer Price Index, and on Friday, gold fell sharply in price (and the US dollar index recovered accordingly) after the publication of data on retail sales which turned out to be below expectations (forecast: - 0.2%; actual: -1.0%).
The mixed movements can be interpreted as market participants trying to determine when the Fed can pause the tightening of monetary policy in order to curb high inflation. So far, it is expected that on May 3 the rate will be increased by 0.25%, after which a pause may follow.
From the lows of March, gold has risen in price by almost 13%. Having defined this movement as an impulse, we can assume that the bearish pattern is a sign of an incipient correction. In this case, the price of gold may drop to the $1,927-1,950 zone, formed by the support line (3) and the level of 50% of the impulse.
GBP/USD Corrects Gains While USD/CAD Eyes Recovery
GBP/USD faced resistance near 1.2540 and started a downside correction. USD/CAD is recovering and might gain pace if it clears the 1.3370 resistance.
Important Takeaways for GBP/USD and USD/CAD
- The British Pound started a downside correction below the 1.2500 zone.
- There was a break below a key bullish trend line with support at 1.2455 on the hourly chart of GBP/USD at FXOpen.
- USD/CAD declined below the 1.3450 and 1.3400 support levels.
- A major bearish trend line is forming with resistance near 1.3370 on the hourly chart at FXOpen.
GBP/USD Technical Analysis
On the hourly chart of GBP/USD at FXOpen, the pair was able to climb above the 1.2455 resistance zone. However, the bears were active near the 1.2540 zone.
As a result, the pair started a downside correction below a key bullish trend line with support at 1.2455. Finally, it spiked below the 1.2400 support. A low is formed near 1.2383 and the pair is now consolidating losses.
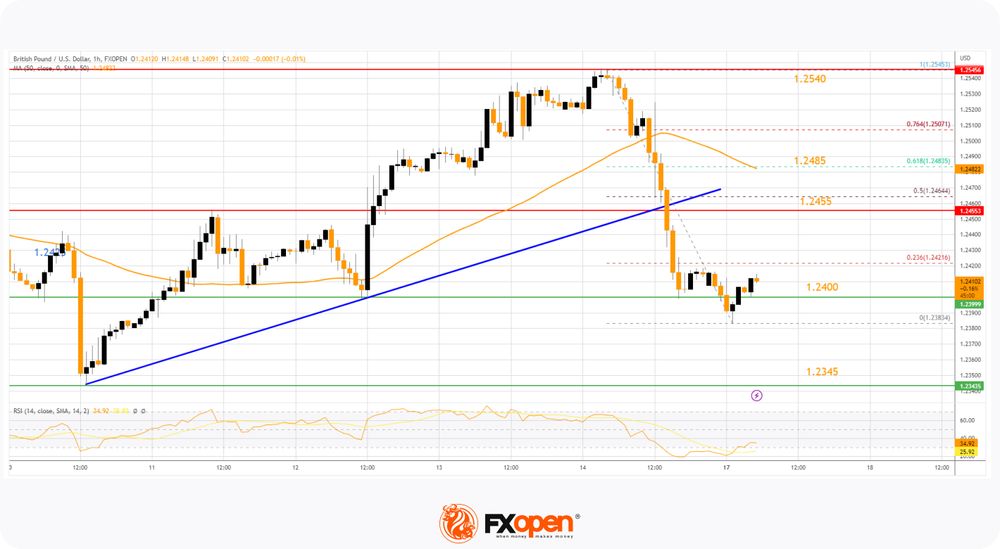
Immediate resistance is forming near the 23.6% Fib retracement level of the downward move from the 1.2545 swing high to the 1.2383 low at 1.2425.
The next resistance is near 1.2455 (the recent breakdown zone). With an upside break above the 1.2455 zone, the pair could rise toward the 50-hour simple moving average at 1.2485. It coincides with the 61.8% Fib retracement level of the downward move from the 1.2545 swing high to the 1.2383 low.
An upside break above the 1.2485 resistance might send the pair toward 1.2540. Any more gains might open the doors for a test of 1.2600.
On the downside, initial support is near the 1.2400 area. The next major support is near the 1.2345 level. If there is a break below 1.2345, the pair could extend its decline. The next key support is near the 1.2300 level. Any more losses might call for a test of the 1.2250 support.
USD/CAD Technical Analysis
On the hourly chart of USD/CAD at FXOpen, the pair started a fresh decline from the 1.3550 resistance zone. The US Dollar gained bearish momentum below the 1.3425 support against the Canadian Dollar.
Finally, it spiked below the 1.3315 support and traded as low as 1.3300. Recently, there was a recovery wave above the 1.3315 level. The pair climbed above the 23.6% Fib retracement level of the downward move from the 1.3553 swing high to the 1.3300 low.
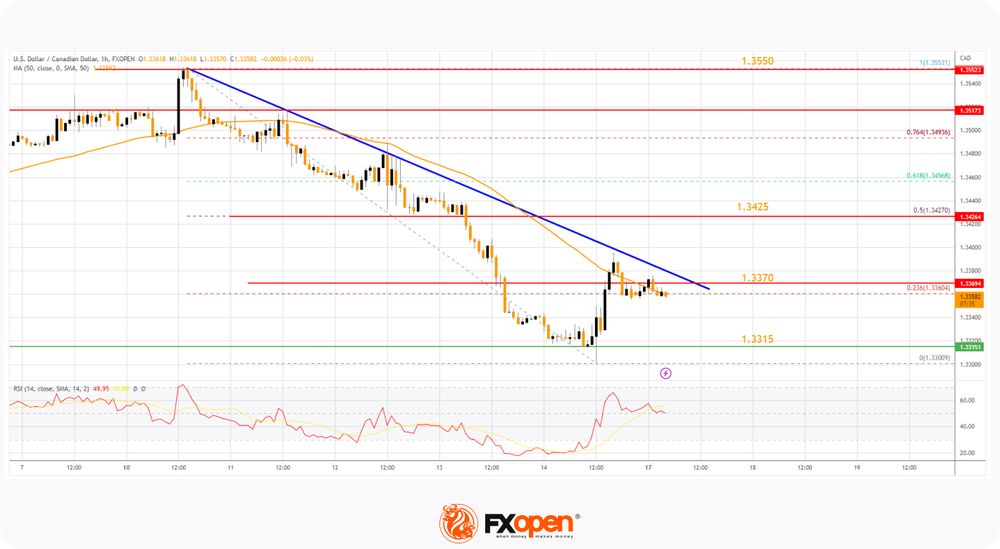
It is now facing resistance near a major bearish trend line and the 50-hour simple moving average at 1.3370. If there is an upside break above the trend line, the pair could rise toward the 50% Fib retracement level of the downward move from the 1.3553 swing high to the 1.3300 low at 1.3425.
A clear break above the 1.3425 level could open the doors for more gains. The next major resistance is near the 1.3550 level, above which USD/CAD could rise steadily toward the 1.3600 resistance zone.
Immediate support is near the 1.3315 level. A close below the 1.3315 level might trigger a strong decline. In the stated case, USD/CAD might test 1.3200. Any more losses may possibly open the doors for a drop toward the 1.3120 support.
Dollar Index: Recovery to Likely Stall Under Key Barriers
The dollar index keeps traction in early Monday’s trading, following 0.6% bounce on Friday, sparked by better than expected major bank earnings in the first quarter, while negative impact from much stronger than expected fall in US retail sales was partially offset by still resilient core retail sales (excluding fuel, food services, autos and building materials) that kept optimism and expectations for Fed’s rate hike in May.
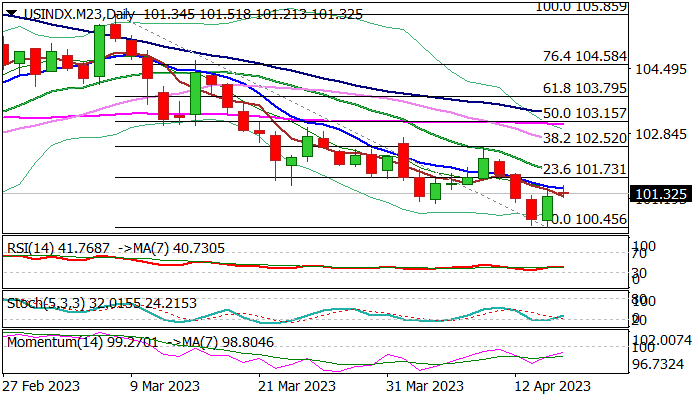
Friday’s bounce, after the action repeatedly failed to register close below pivotal support at 100.66 (2023 low), generated initial positive signal on formation of bullish engulfing pattern on daily chart, although studies on daily chart are still predominantly bearish and weigh on fresh recovery attempts.
Renewed bulls faced headwinds from initial barrier at 101.45 (falling 10DMA), with break here and above first Fibo resistance at 101.73 (23.6% retracement of 105.85/100.45) needed to reduce downside risk and open way for further recovery.
Still, more work at the upside will be required to generate initial reversal signal (sustained break above Fibo 38.2% barrier at 102.52).
This looks quite unlikely for now, despite improved fundamentals, as the dollar index remains in downtrend and has so far registered 7 straight weekly losses, with pause above key supports at 100.66/00, rather to mark consolidation/limited correction, ahead of fresh push lower than to point to reversal.
Res: 101.45; 101.73; 101.86; 102.46.
Sup: 101.00; 100.66; 100.45; 100.00.
Crypto Market Pauses after the Rise
Market picture
The crypto market has gained around 7.2% in the last seven days to $1.268 trillion. The crypto market is recovering, like climbing the stairs, and is now consolidating at the same level it consolidated in May-June last year. To get to the next floor, with a market cap of $1.7 trillion, would require a jump of 34% – quite a climb, requiring a shift in market sentiment.
Bitcoin is trading 6% higher than a week ago, stuck at $30K. Ethereum has jumped 13% to $2100. Other leading altcoins in the top 10 are up 2.3% (XRP) to 26% (Solana).
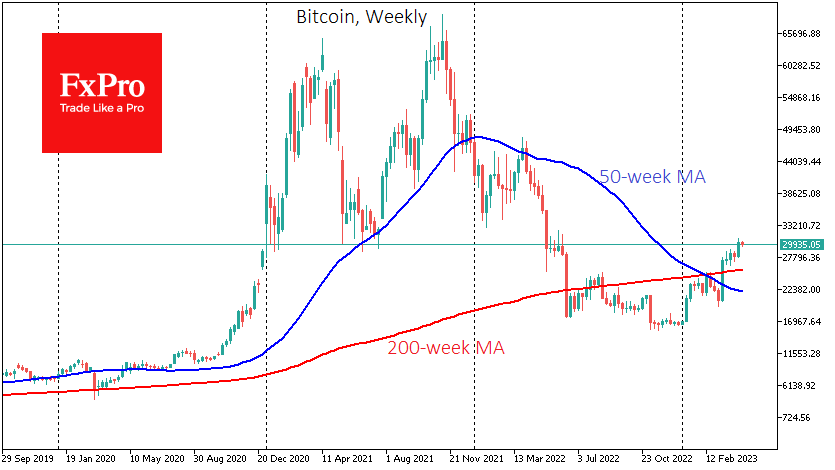
Traders should be prepared that the $30K mark for the first cryptocurrency could act as solid resistance after it was rigid support in 2021. That said, technically, bitcoin has already proven the end of the bear market by securing above key moving averages and steadily retreating from the bottom.
With Ethereum rising above $2100, the stack’s pending withdrawals exceeded 1 million ETH. Excluding rewards, 17.39 million ETH or 15.4% of the total asset issuance, is blocked in the deposit contract.
News background
SkyBridge Capital CEO Anthony Scaramucci said he doesn’t want to call himself a bitcoin maximalist, but he is now “more bullish on BTC than ever been in the entire life”. In his view, bitcoin is a commodity and should have no contact with the SEC, which regulates stocks.
The US House of Representatives Financial Services Committee released a draft bill that regulates stable coin issuers. The bill proposes that the Fed will oversee the activities of issuers and issue licences for related activities.
According to PitchBook, cryptocurrency-related venture capital funding fell to its lowest level in ten quarters ($2.4 billion) in the first quarter.
Bloomberg Intelligence senior strategist Mike McGlone expressed concern about the risks of investing in meme-based cryptocurrencies DOGE and SHIB. He said, “We need to get rid of these dogged tokens as soon as possible”.
The SEC has subpoenaed Tron Foundation founder Justin Sun following allegations of an unregistered offering of securities in the form of Tron (TRX) and BitTorrent (BTT) tokens last month.
AUD/USD – Australian Dollar Takes Traders for a Wild Ride
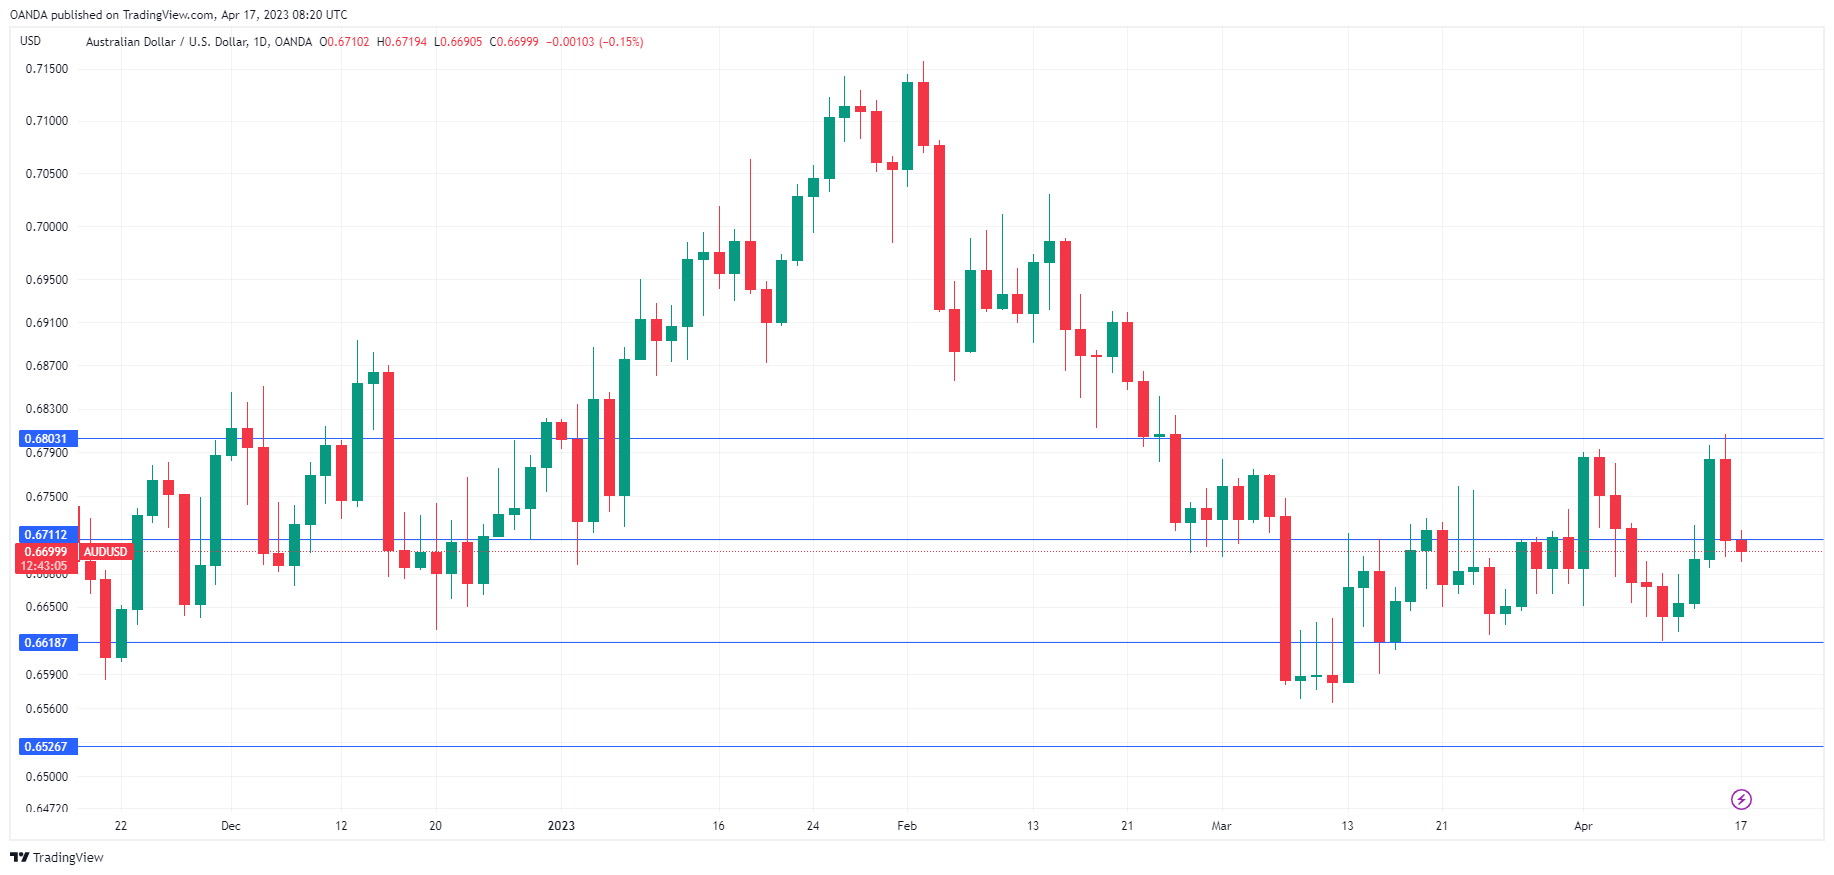
The Australian dollar has steadied on Monday, trading just above the 0.67 level. We could see further movement from the Aussie early on Tuesday, as China releases GDP.
Aussie sinks after strong US earnings, Fed speak
The markets received another clear sign on Friday that the US economy is slowing, after a disappointing March retail sales report. Headline retail sales fell by 1% and the core rate by 0.8%, worse than expected and marking a second straight decline for both.
A soft US retail sales report is usually a recipe for US dollar weakness, but that wasn’t the case on Friday, as AUD/USD fell by 1%. The US dollar received a boost from strong earnings results, higher inflation expectations and some hawkish Fed speak.
Bank earnings impressed on Friday, with strong results from JP Morgan, Citigroup and Wells Fargo. This indicates that the bank crisis has been contained for now, although further contagion cannot be ruled out.
On the inflation front, UoM inflation expectations for 12 months jumped 4.6% in April, up sharply from 3.6% in March. Consumer confidence has been on the low side as inflation remains high, and the weak retail sales report was clear proof that consumers are spending less due to high inflation and rising rates.
Fed member Waller had a hawkish message on Friday, saying that the Fed would need to continue raising rates because inflation is “far above target” and the labor market remains “quite tight”. Waller warned that the Fed would have to keep rates at a high level for an extended period and for longer than the markets expected. Fed member Bostic said he supported one or two more 25-bp hikes to end the current tightening cycle. The likelihood of a 25-bp increase in May has jumped to 80%, up from 68% prior to the retail sales release.
AUD/USD Technical
- There is resistance at 0.6897 and 0.6791
- AUD/USD tested support below 0.6700 earlier today. The next support level is 0.6608
AUD/USD Technical Analysis
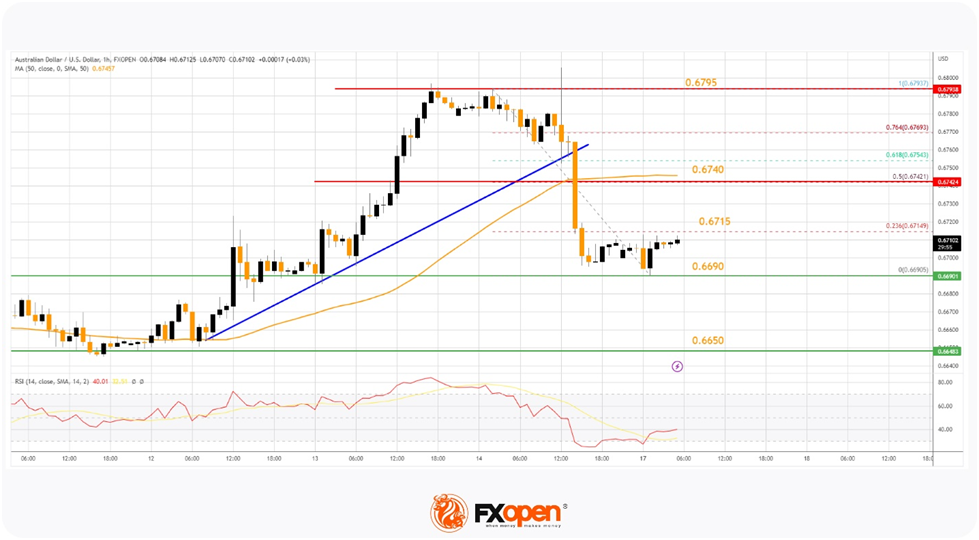
On the hourly chart of AUD/USD at FXOpen, the pair declined from the 0.6795 resistance. The Aussie Dollar dropped below the 0.6740 support to move into a short-term bearish zone.
It tested the 0.6690 support and is currently consolidating losses well below the 50-hour simple moving average. Immediate resistance is near the 0.6715 level.
The next major resistance is near the 50-hour simple moving average and the 50% Fib retracement level of the downward move from the 0.6793 swing high to the 0.6690 low at 0.6740. If there is an upside break above the 0.6740 zone, the pair could rise steadily toward the 0.6795 level in the near term.
Immediate support is near the 0.6690 level. The next key support is near the 0.6650 level. A downside break below the 0.6650 support could lead the pair toward the 0.6600 support.