Sample Category Title
Market Themes Abound, But No Clear Dominant Driver Emerges Today
Multiple themes are unfolding in the markets today without any one taking center stage. Dollar is gaining strength, particularly against Yen, supported by an extended rebound in Treasury yields. Euro, on the other hand, is losing ground to the Pound after failing to break through a key near-term resistance level, which also weighs on the common currency against the greenback. Meanwhile, Aussie continues to rally against Kiwi, but no significant movement is observed elsewhere.
From a technical standpoint, it is premature to confirm a reversal of Dollar's near-term downtrend despite today's recovery. Crucial levels to monitor include 1.0830 support in EUR/USD, 1.2343 support in GBP/USD, and 0.9070 resistance in USD/CHF. As long as these levels hold, Dollar's weakness could resume at any moment.
In Europe, at the time of writing, FTSE is up 0.13%. DAX is down -0.19%. CAC is down -0.17%. Germany 10-year yield is up 0.0329 at 2.473. Earlier in Asia, Nikkei rose 0.07%. Hong Kong HSI rose 1.68%. China Shanghai SSE rose 1.42%. Singapore Strait Times rose 0.50%. Japan 10-year JGB yield rose 0.0206 to 0.482.
AUD/NZD rebound gains traction ahead of RBA minutes
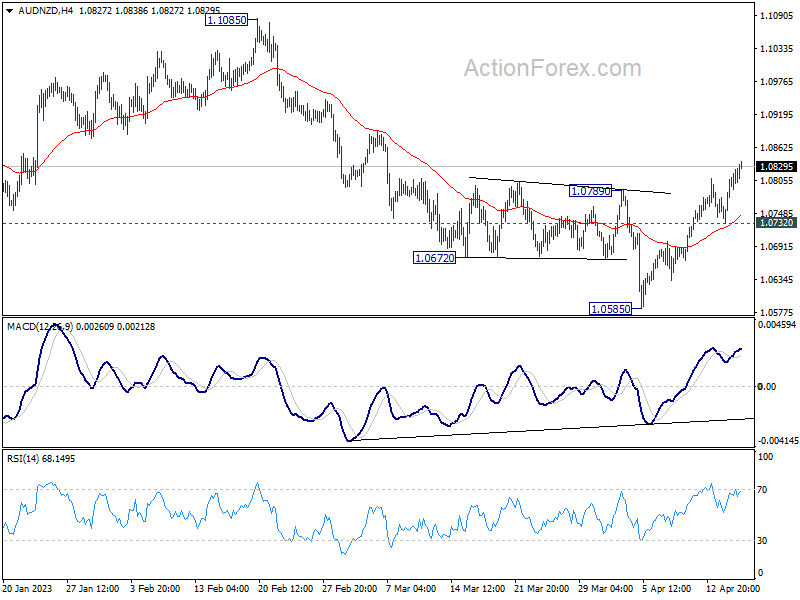
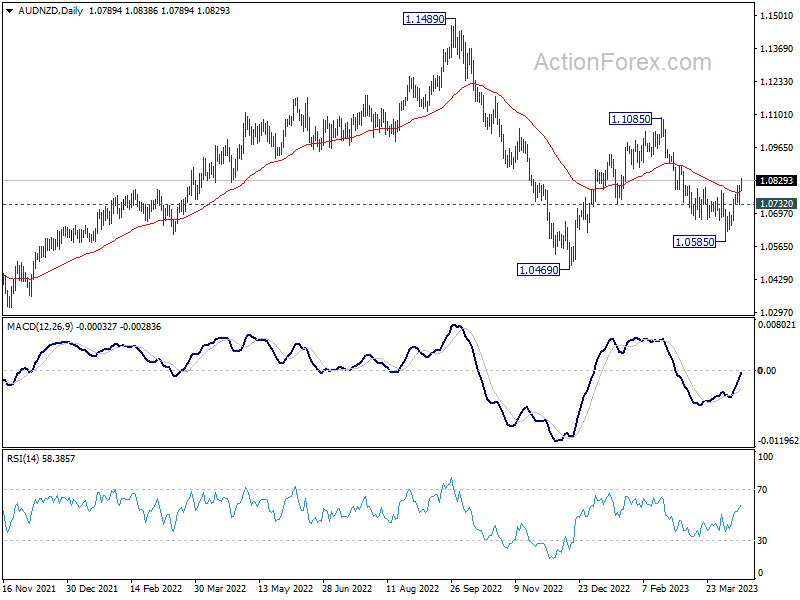
AUD/NZD continues to extend its rebound from 1.0585 short-term bottom, prompting traders to further close their short positions as the previous selloff failed to push the cross through 1.0469 low. Market participants are awaiting the release of RBA minutes in the upcoming Asian session, along with Australian PMIs and New Zealand CPI data this week.
Expectations on New Zealand's CPI remain divided, with some anticipating a slowdown from 7.2% yoy level. If realized, this would fall below RBNZ's forecast of 7.3%, potentially sparking speculation of a less aggressive rate hike path. Conversely, improvements in Australia's PMI could bolster RBA's confidence in resuming tightening with another rate hike in May.
Technically, break of 1.0789 resistance now argues that fall from 1.1085 has completed at 1.0585. Rise from there could be seen as the third leg of the pattern from 1.0469. Further rally could be seen back to 1.1085 resistance next. However, on the downside, break of 1.0732 support will bring retest of 1.0585 low instead.
ECB Kazaks hints at potential smaller rate hike in May
ECB Governing Council member Martins Kazaks has suggested that a smaller rate hike of 25 basis points in May is possible, although a 50 basis point increase should not be dismissed entirely.
In an interview with Latvian news service Leta, Kazaks stated, "At some points, it's only natural that the step size is reduced. For example, the increase could be not 50 basis points, but 25 basis points."
Regarding the upcoming ECB Council meeting in May, Kazaks commented, "Should we move to a lower step already at the ECB Council meeting in May? I think there is every possibility for that, but a 50 basis point increase is not an option that can be ignored."
Kazaks remains optimistic about the Eurozone's economic outlook, pointing out that "the economy is still resilient, there will probably not be a recession in the Eurozone this year, the labor market remains strong, the pressure on wages is still very high and in some cases even increasing. Therefore, in my opinion, a rate increase is necessary."
NZ BNZ Services dropped to 54.4, but keeps its head above water
New Zealand's service sector growth slowed down in March, with the BusinessNZ Performance of Services Index (PSI) declining to 54.4 from 55.8 in February. However, the index stayed above the long-term average of 53.6.
BusinessNZ Chief Executive Kirk Hope highlighted the uptick in negative sentiment, with the proportion of negative comments surging from 51.9% in February to 58.6% in March. The main concerns expressed were a cooling economy, the impact of price increases, and overall uncertainty.
Despite these challenges, BNZ Senior Economist Craig Ebert remains cautiously optimistic. He noted that while the PSI held relatively steady in March, the Performance of Manufacturing Index (PMI) slipped into slightly negative territory. Nonetheless, Ebert believes that there is enough positive momentum to suggest an underlying tendency for growth in activity.
USD/JPY Mid-Day Outlook
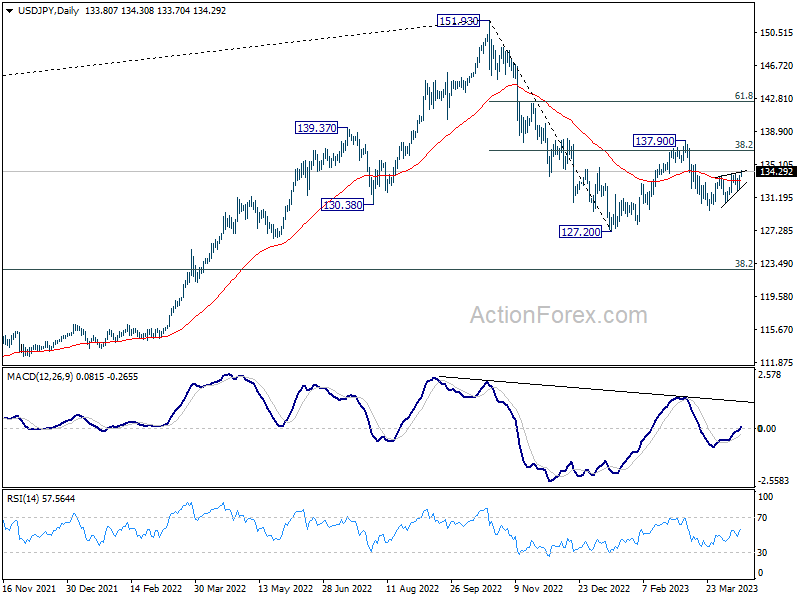
Daily Pivots: (S1) 132.68; (P) 133.26; (R1) 134.35; More...
Intraday bias in USD/JPY remains mildly on the upside as rebound from 129.62 is in progress. Further rally could be seen back towards 137.90 resistance. For now, further rise will remain in favor as long as 132.03 support holds, in case of retreat.
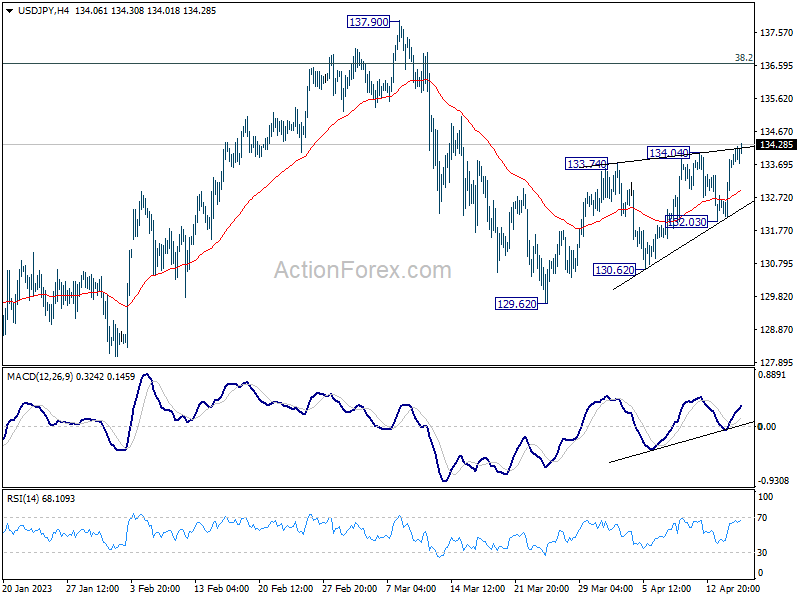
In the bigger picture, corrective pattern from 127.20 might be extending. But after all, down trend from 151.93 is expected to resume at a later stage. Break of 127.20 will resume this down trend and target 61.8% projection of 151.93 to 127.20 from 137.90 at 122.61. This will now be the favored case as long as 137.90 resistance holds.
Economic Indicators Update
| GMT | Ccy | Events | Actual | Forecast | Previous | Revised |
|---|---|---|---|---|---|---|
| 22:30 | NZD | Business NZ PSI Mar | 54.4 | 55.8 | ||
| 12:30 | CAD | Wholesale Sales M/M Feb | -1.70% | -1.60% | 2.40% | |
| 12:30 | CAD | Foreign Securities Purchases (CAD) Feb | 4.62B | 6.28B | 4.21B | |
| 12:30 | USD | Empire State Manufacturing Index Apr | 10.8 | -18.2 | -24.6 | |
| 14:00 | USD | NAHB Housing Market Index Apr | 44 | 44 |
AUD/NZD rebound gains traction ahead of RBA minutes
AUD/NZD continues to extend its rebound from 1.0585 short-term bottom, prompting traders to further close their short positions as the previous selloff failed to push the cross through 1.0469 low. Market participants are awaiting the release of RBA minutes in the upcoming Asian session, along with Australian PMIs and New Zealand CPI data this week.
Expectations on New Zealand's CPI remain divided, with some anticipating a slowdown from 7.2% yoy level. If realized, this would fall below RBNZ's forecast of 7.3%, potentially sparking speculation of a less aggressive rate hike path. Conversely, improvements in Australia's PMI could bolster RBA's confidence in resuming tightening with another rate hike in May.
Technically, break of 1.0789 resistance now argues that fall from 1.1085 has completed at 1.0585. Rise from there could be seen as the third leg of the pattern from 1.0469. Further rally could be seen back to 1.1085 resistance next. However, on the downside, break of 1.0732 support will bring retest of 1.0585 low instead.
FTSE 100 Wave Analysis
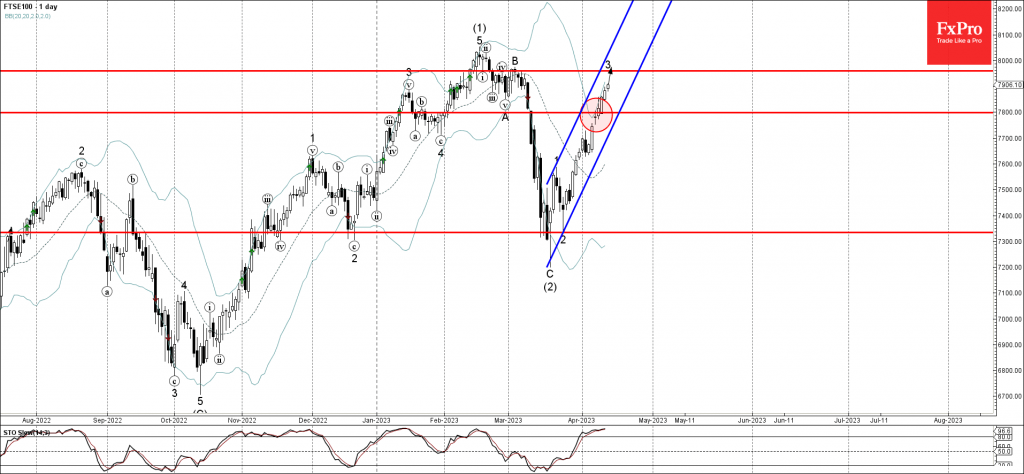
- FTSE 100 rising inside impulse wave 3
- Likely to reach resistance level 7960.00
FTSE 100 index rising inside the sharp minor impulse wave 3, which previously broke above the resistance level 7800.00 (upward target set in our earlier report for this index).
The active impulse wave 3 belongs to the intermediate impulse wave (3) from the middle of March.
Given the prevailing daily uptrend, FTSE 100 index can then be expected to rise further toward the next resistance level 7960.00 (target for the completion of the active impulse wave 3).
GBPUSD Wave Analysis
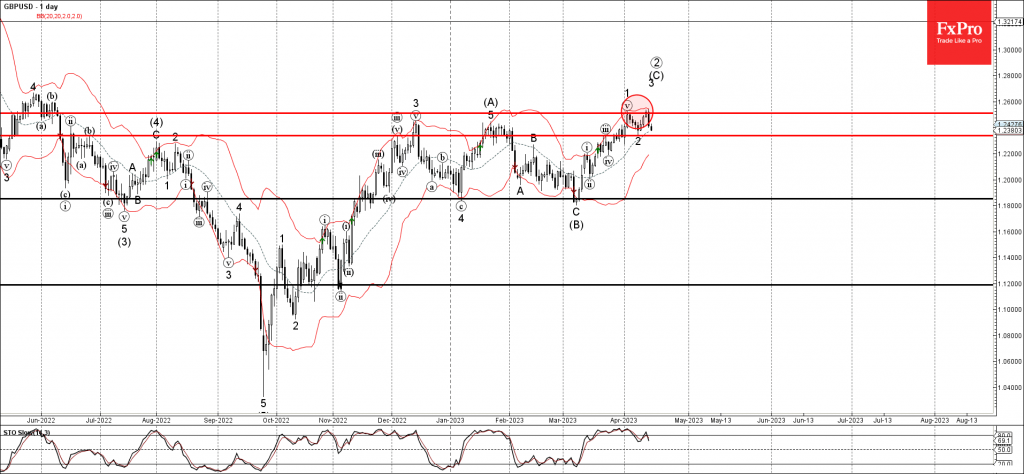
- GBPUSD reversed from resistance level 1.2510
- Likely to fall to support level 1.2340
GBPUSD continues to fall after the price reversed down from the key resistance level 1.2510 (which stopped the previous minor impulse wave 1 at the start of April).
The downward reversal from the resistance level 1.2510 created the daily Japanese candlesticks reversal pattern Evening Star.
Given the bearish divergence on the daily Stochastic, GBPUSD can then be expected to fall further toward the next support level 1.2340 (low of the previous minor correction 2).
Japanese Yen Extends Losses
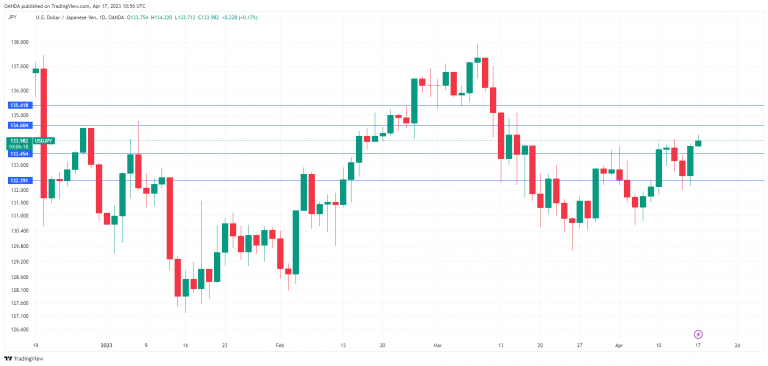
The Japanese yen took it on the chin on Friday, as USD/JPY jumped 0.90%. The yen has edged lower on Monday and fell as low as 134.22, its lowest level since March 15th. With expectations rising that the Fed will raise rates in May, the yen could remain under pressure and fall closer to the symbolic 135 line.
It was a light data calendar in Japan last week, giving investors plenty of time to focus on comments from new BoJ Governor Ueda. At the G-20 meeting in Washington, Ueda stuck to his script of “more of the same”, saying the Bank would continue its ultra-loose monetary policy. There has been pressure on Ueda to tighten policy, given that inflation hit 3.1% in February, higher than the 2% target.
The Bank of Japan has become an outlier as other central banks have raised rates in order to contain inflation. In fairness, inflation in Japan compares to the levels we are seeing in most developed economies. Former Governor Kuroda insisted that inflation has been driven by higher import costs rather than stronger domestic demand and said real wages would have to rise before the BoJ would consider raising rates. The problem is that real wages continue to fall – the decline of 2.6% in February, marked an 11th straight decline.
Until wage growth recovers, there is little chance that the BoJ will tighten policy. That doesn’t mean the BoJ won’t make any moves in the near future, especially if the yen continues to depreciate. In December, the BoJ blindsided the markets by widening the target band on 10-year government bonds, which sent the yen sharply higher.
Fed’s Waller, Bostic says more hikes needed
The US dollar powered higher on Friday despite a soft retail sales report, as a rise in inflation expectations and hawkish Fedspeak raised the odds of a rate hike in May.
UoM inflation expectations for the next 12 months jumped 4.6% in April, up sharply from 3.6% in March. Consumer confidence has been on the low side as inflation remains high, and the decline in retail sales was another sign that the US economy is losing steam.
Fed member Waller stated on Friday that the Fed would need to continue raising rates because inflation is “far above target” and the labor market remains “quite tight”. Waller warned that the Fed would have to keep rates at a high level for an extended period and for longer than the markets expected. Fed member Bostic urged one or two more 25-bp hikes before wrapping up the current rate-tightening cycle. The likelihood of a 25-bp increase in May jumped to 80% on Friday, up from 68% a day earlier, which propelled the US dollar to strong gains at the end of the week.
USD/JPY Technical
- There is resistance at 134.60 and 135.42
- 133.45 and 132.39 are providing support.
Gold Retreats from Recent Highs; Bulls Try to Keep It Above 2,000
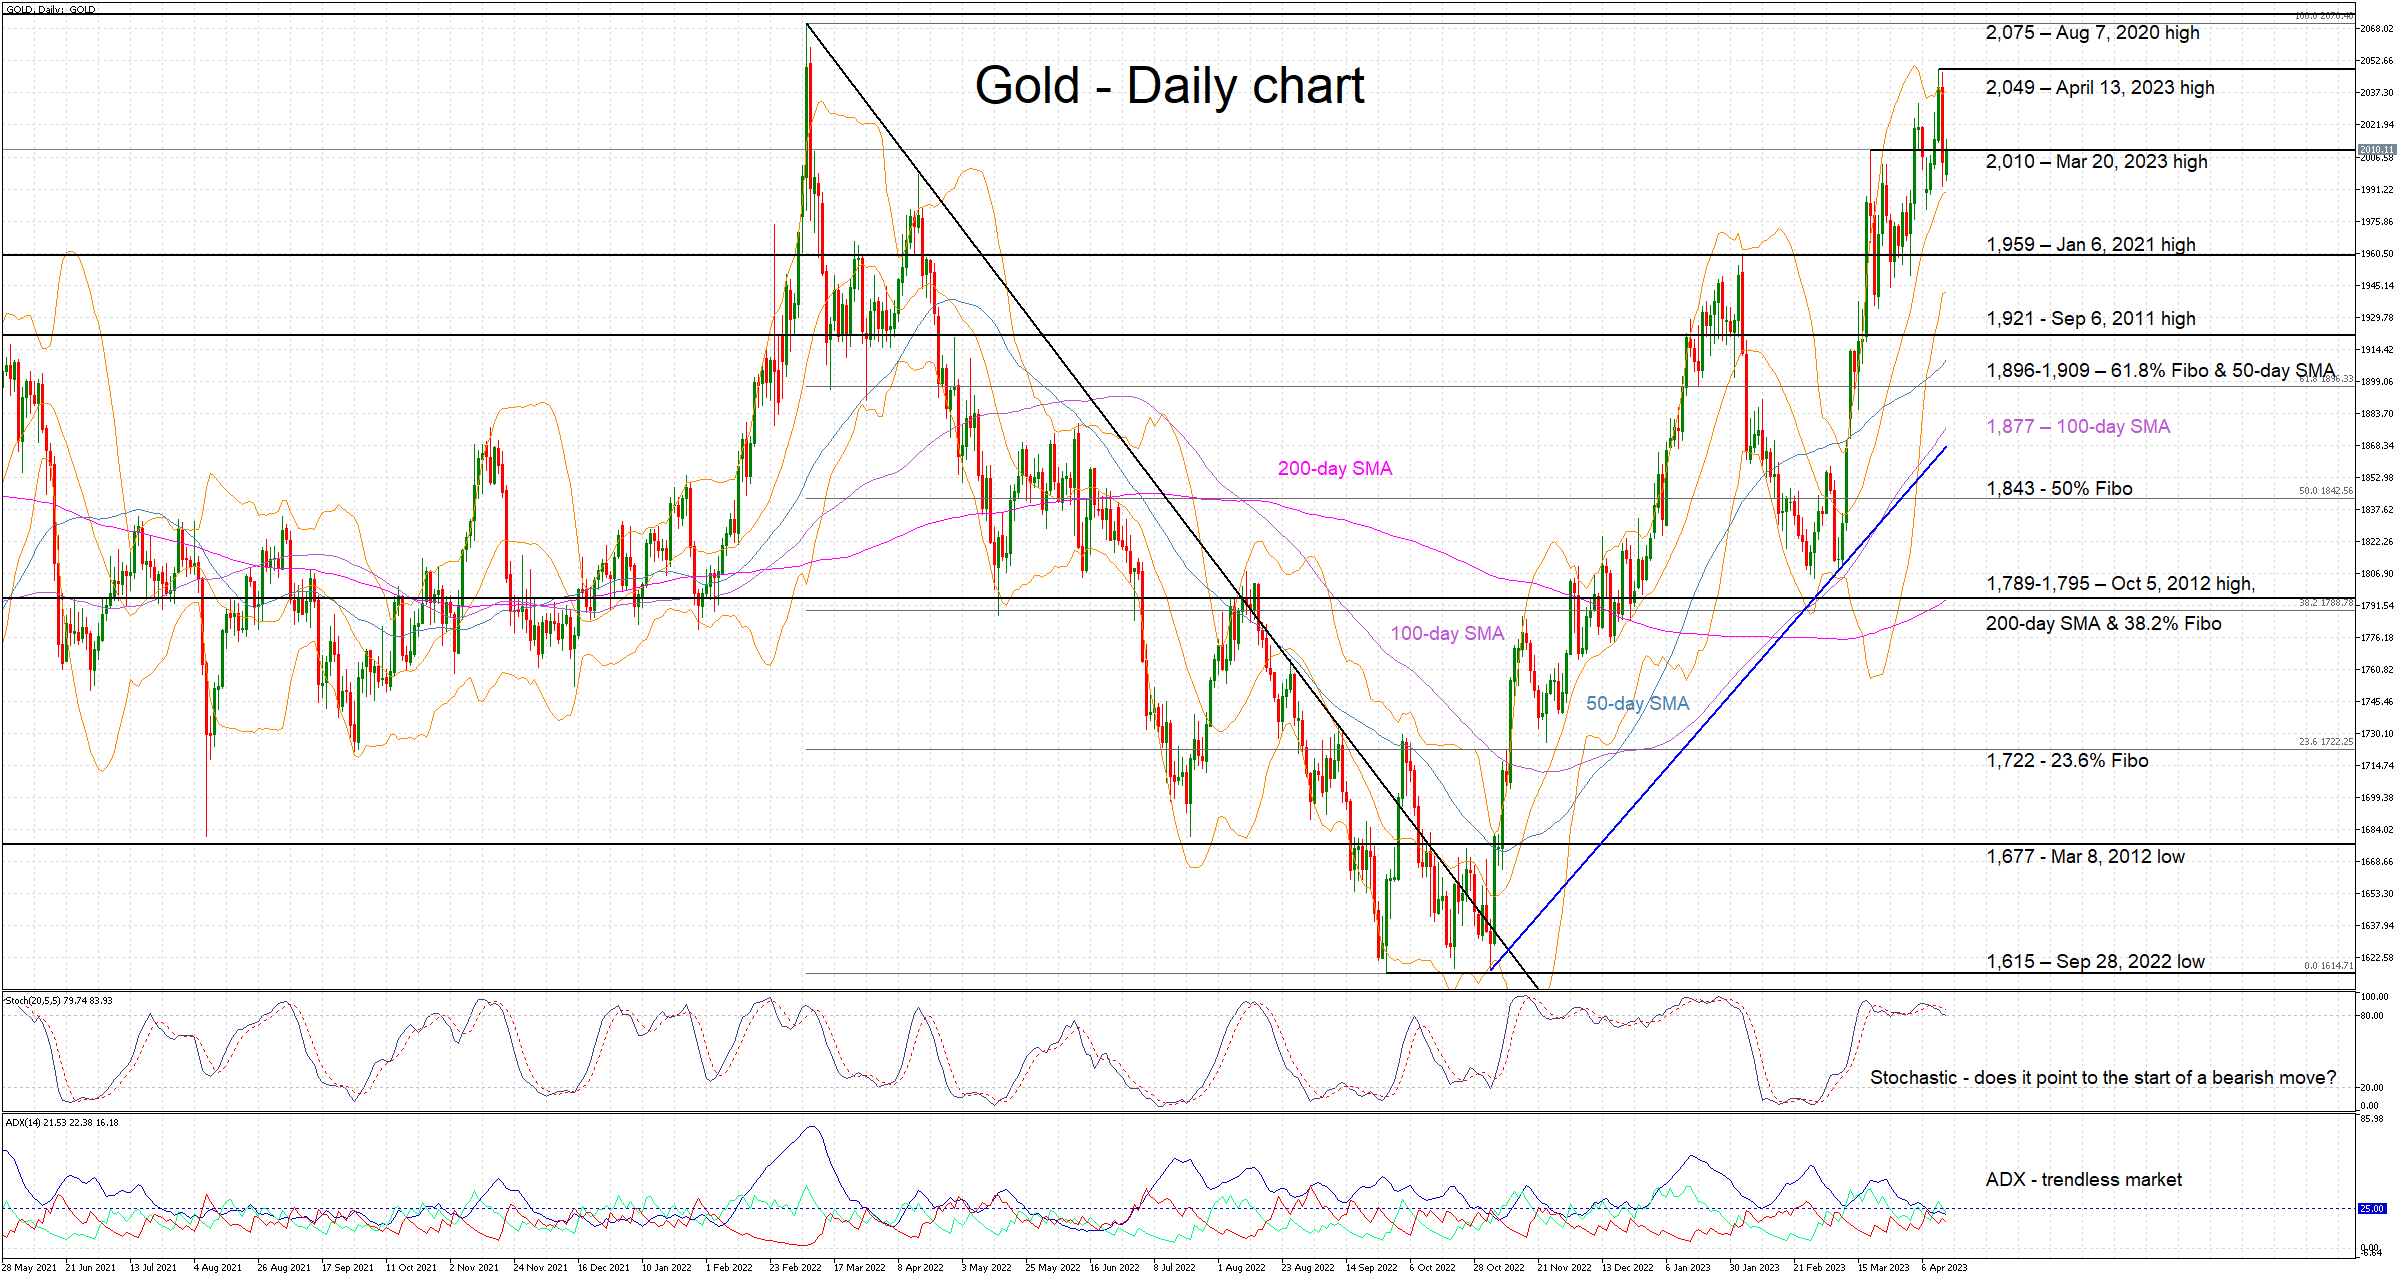
Gold is hovering around the March 20, 2023 high of 2,010, having retreated from the recent one-year higher high. Keeping gold price above the 2,000 threshold appears to be their primary target for the bulls, following the rather explosive move from the early March 2023 dip at the 1,800 area.
On the other hand, gold bears are trying to stage a comeback. They appeared massively unprepared at the recent rally as multiple resistance points were broken until the April 13, 2023 high of 2,049. Favouring the bears, the momentum indicators seem to suggest that the bullish move has run its course. In particular, the Average Directional Movement Index (ADX) is clearly pointing to a trendless market at this juncture.
Interestingly, the stochastic oscillator is sending a “double” message. This indicator has been hovering at its overbought (OB) territory for the past month, clearly showing signs of exhaustion. In addition, the recent higher high in gold has not been confirmed by a similar print in the stochastic, setting the scene for a bearish divergence.
Should the bears muster the courage and take advantage of the bearish signals, they would aim for a break of the 2,000 level. Lower, the January 6, 2021 high of 1,959 seems to be a strong support area, just ahead of the September 6, 2021 high of 1,921.
On the other hand, the bulls would love another retest of the recent high of 2,049. If successful, the August 7, 2020 high of 2,075 would then be the next target.
To sum up, the recent rally appears to have run out of gas. Gold bears are trying to push the price below the 2,000 mark on the back of some initial bearish signs from the momentum indicators.
EUR/USD: Short-Term Weakness Can Resume to 1.0925
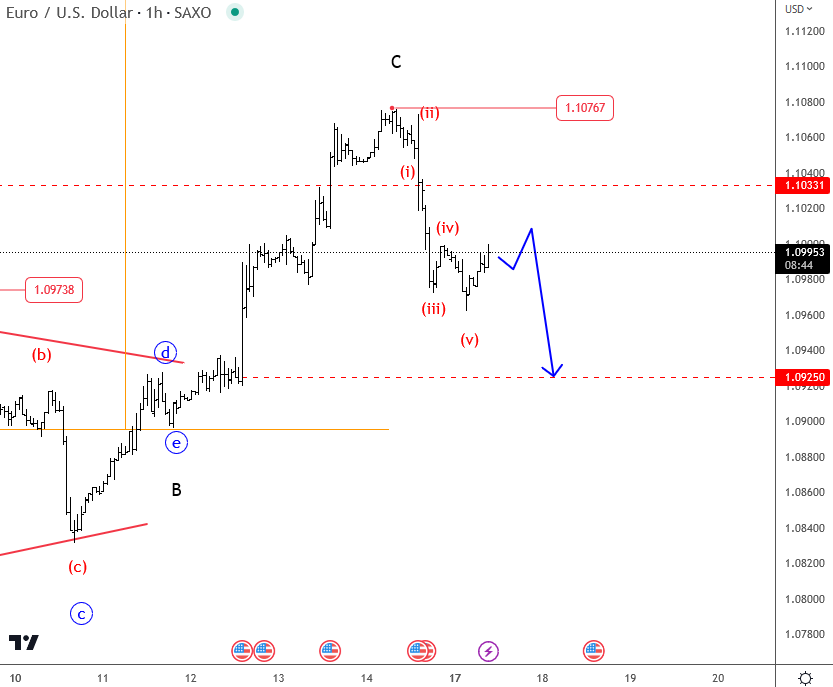
As you know the US CPI came out better than expected last week at 5.0%, so we have seen some USD weakness at the start of the week, but then some of the losses got erased on Friday after FED officials said that there is for another interest rate hike. In fact, the EURUSD pair is coming down in five waves after bulls failed at Feb 2023 highs, so it appears there can be more weakness early this week, possibly even back to the Apirl 12 level; the moment of the US CPI release.
Gold Formed an Important Bearish Pattern
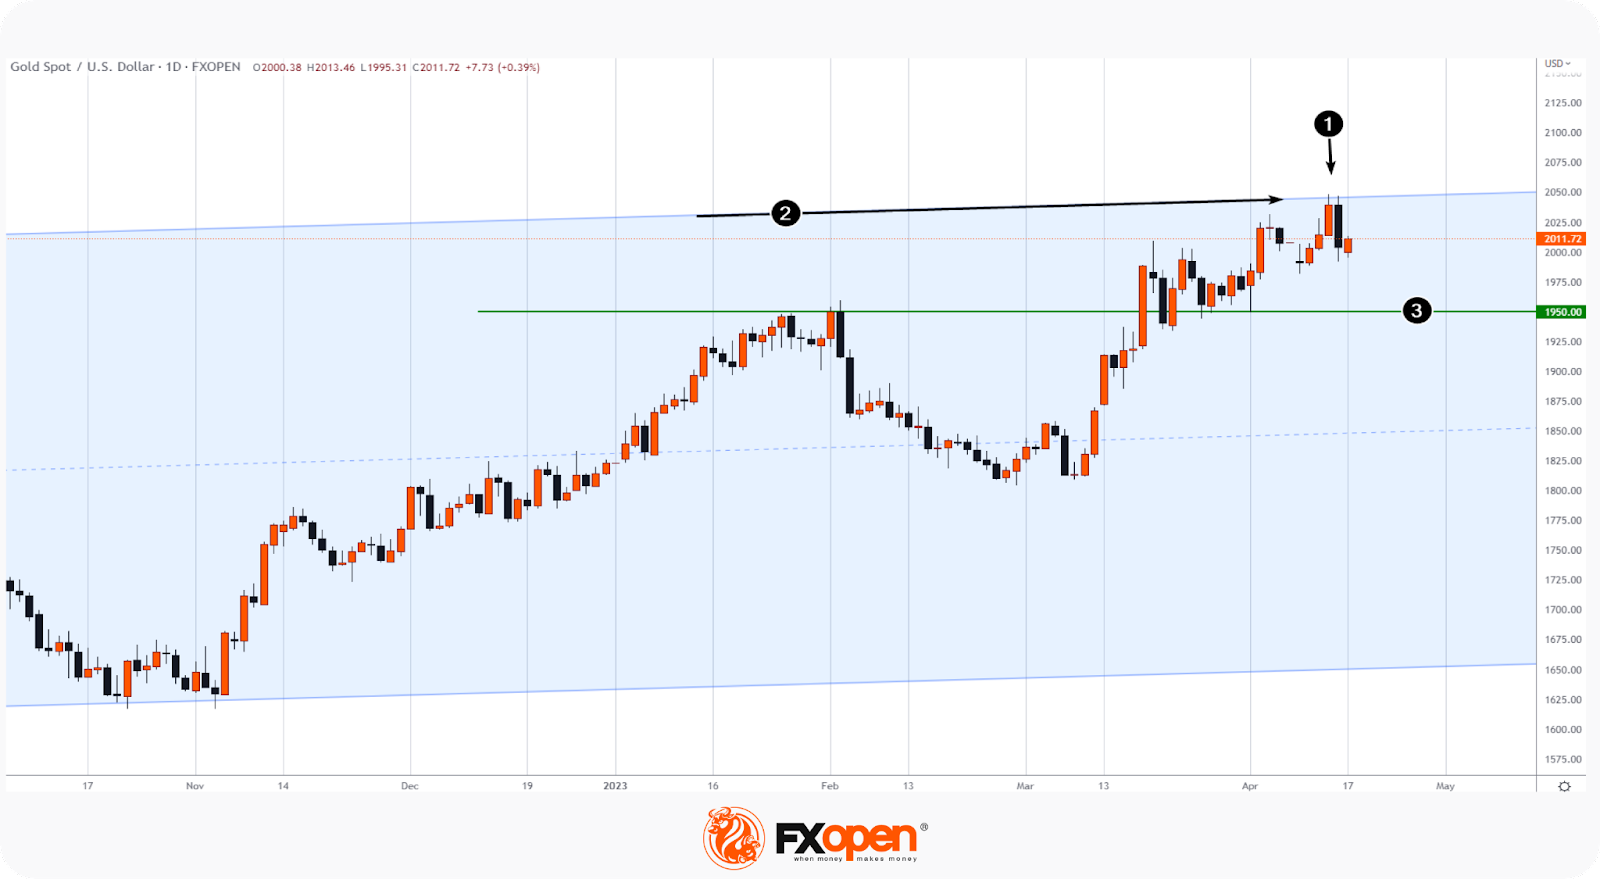
A bearish engulfing pattern (1) has formed on the gold price chart. Two facts make it important:
- The pattern has formed at the line (2) of the resistance of the trend channel, originating at the end of 2019;
- The pattern was formed against the background of the discussed news about the US economy, which affected the value of the US dollar.
On Thursday, the price of gold rose (and the US dollar index fell to the lows of the year) after the publication of the Producer Price Index, and on Friday, gold fell sharply in price (and the US dollar index recovered accordingly) after the publication of data on retail sales which turned out to be below expectations (forecast: - 0.2%; actual: -1.0%).
The mixed movements can be interpreted as market participants trying to determine when the Fed can pause the tightening of monetary policy in order to curb high inflation. So far, it is expected that on May 3 the rate will be increased by 0.25%, after which a pause may follow.
From the lows of March, gold has risen in price by almost 13%. Having defined this movement as an impulse, we can assume that the bearish pattern is a sign of an incipient correction. In this case, the price of gold may drop to the $1,927-1,950 zone, formed by the support line (3) and the level of 50% of the impulse.
GBP/USD Corrects Gains While USD/CAD Eyes Recovery
GBP/USD faced resistance near 1.2540 and started a downside correction. USD/CAD is recovering and might gain pace if it clears the 1.3370 resistance.
Important Takeaways for GBP/USD and USD/CAD
- The British Pound started a downside correction below the 1.2500 zone.
- There was a break below a key bullish trend line with support at 1.2455 on the hourly chart of GBP/USD at FXOpen.
- USD/CAD declined below the 1.3450 and 1.3400 support levels.
- A major bearish trend line is forming with resistance near 1.3370 on the hourly chart at FXOpen.
GBP/USD Technical Analysis
On the hourly chart of GBP/USD at FXOpen, the pair was able to climb above the 1.2455 resistance zone. However, the bears were active near the 1.2540 zone.
As a result, the pair started a downside correction below a key bullish trend line with support at 1.2455. Finally, it spiked below the 1.2400 support. A low is formed near 1.2383 and the pair is now consolidating losses.
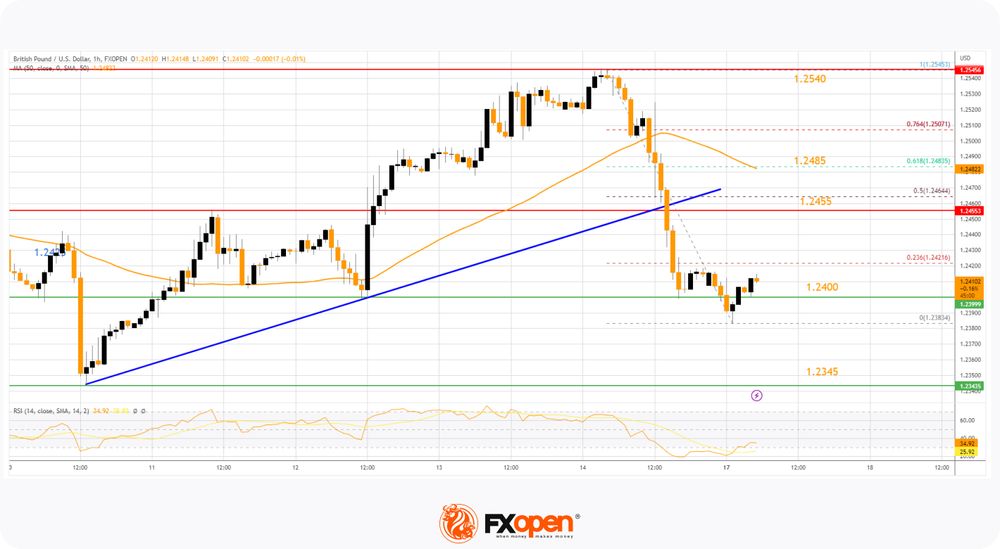
Immediate resistance is forming near the 23.6% Fib retracement level of the downward move from the 1.2545 swing high to the 1.2383 low at 1.2425.
The next resistance is near 1.2455 (the recent breakdown zone). With an upside break above the 1.2455 zone, the pair could rise toward the 50-hour simple moving average at 1.2485. It coincides with the 61.8% Fib retracement level of the downward move from the 1.2545 swing high to the 1.2383 low.
An upside break above the 1.2485 resistance might send the pair toward 1.2540. Any more gains might open the doors for a test of 1.2600.
On the downside, initial support is near the 1.2400 area. The next major support is near the 1.2345 level. If there is a break below 1.2345, the pair could extend its decline. The next key support is near the 1.2300 level. Any more losses might call for a test of the 1.2250 support.
USD/CAD Technical Analysis
On the hourly chart of USD/CAD at FXOpen, the pair started a fresh decline from the 1.3550 resistance zone. The US Dollar gained bearish momentum below the 1.3425 support against the Canadian Dollar.
Finally, it spiked below the 1.3315 support and traded as low as 1.3300. Recently, there was a recovery wave above the 1.3315 level. The pair climbed above the 23.6% Fib retracement level of the downward move from the 1.3553 swing high to the 1.3300 low.
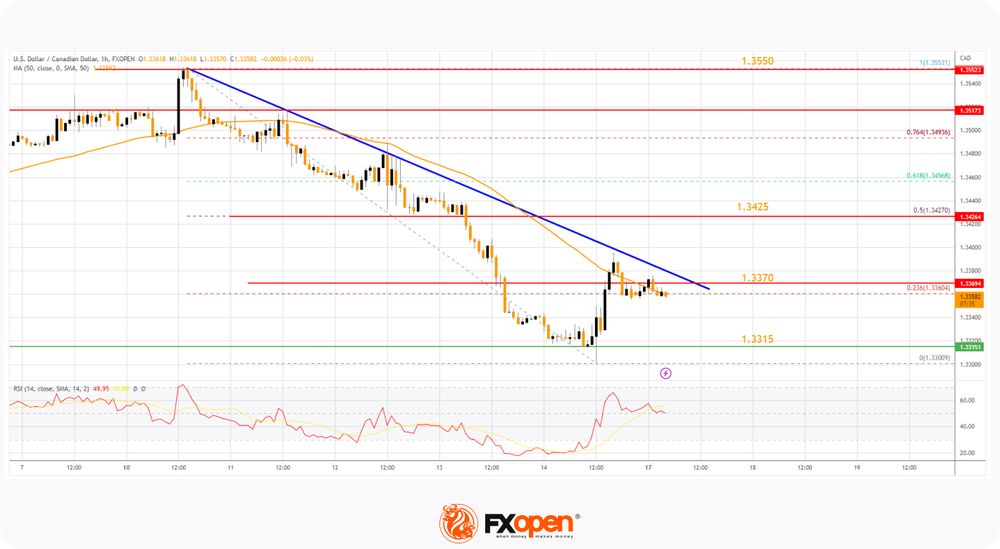
It is now facing resistance near a major bearish trend line and the 50-hour simple moving average at 1.3370. If there is an upside break above the trend line, the pair could rise toward the 50% Fib retracement level of the downward move from the 1.3553 swing high to the 1.3300 low at 1.3425.
A clear break above the 1.3425 level could open the doors for more gains. The next major resistance is near the 1.3550 level, above which USD/CAD could rise steadily toward the 1.3600 resistance zone.
Immediate support is near the 1.3315 level. A close below the 1.3315 level might trigger a strong decline. In the stated case, USD/CAD might test 1.3200. Any more losses may possibly open the doors for a drop toward the 1.3120 support.
Dollar Index: Recovery to Likely Stall Under Key Barriers
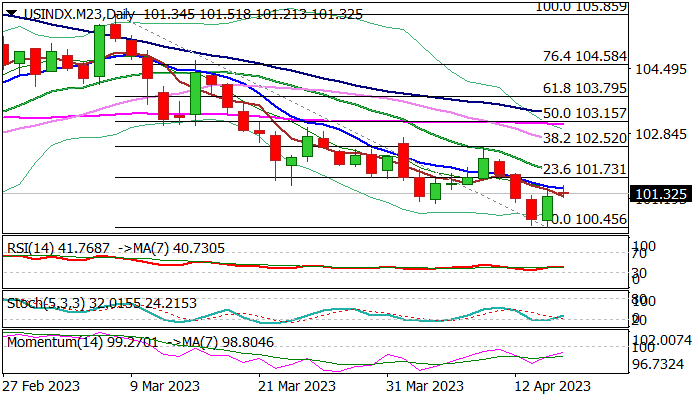
The dollar index keeps traction in early Monday’s trading, following 0.6% bounce on Friday, sparked by better than expected major bank earnings in the first quarter, while negative impact from much stronger than expected fall in US retail sales was partially offset by still resilient core retail sales (excluding fuel, food services, autos and building materials) that kept optimism and expectations for Fed’s rate hike in May.
Friday’s bounce, after the action repeatedly failed to register close below pivotal support at 100.66 (2023 low), generated initial positive signal on formation of bullish engulfing pattern on daily chart, although studies on daily chart are still predominantly bearish and weigh on fresh recovery attempts.
Renewed bulls faced headwinds from initial barrier at 101.45 (falling 10DMA), with break here and above first Fibo resistance at 101.73 (23.6% retracement of 105.85/100.45) needed to reduce downside risk and open way for further recovery.
Still, more work at the upside will be required to generate initial reversal signal (sustained break above Fibo 38.2% barrier at 102.52).
This looks quite unlikely for now, despite improved fundamentals, as the dollar index remains in downtrend and has so far registered 7 straight weekly losses, with pause above key supports at 100.66/00, rather to mark consolidation/limited correction, ahead of fresh push lower than to point to reversal.
Res: 101.45; 101.73; 101.86; 102.46.
Sup: 101.00; 100.66; 100.45; 100.00.