

Sample Category Title
Bank of England Considering a Major Reform of Deposit Guarantee Scheme
Markets
On Friday, (US) bond markets continued building on the post-payrolls trading paradigm that guided trading for most of last week. US import and export prices printed weaker than expected. January retail sales (headline -1.0%, control group -0.3% M/M) were mixed, at best. Even so, a shy uptick of Treasuries/downside test in yields immediately after the data release triggered renewed selling interest. More or less at the same time, Fed’s Waller indicated that recent developments warrant further tightening. Later, the consumer confidence report from the University of Michigan also supported a more hawkish positioning. Both current conditions and expectations printed stronger than expected. Inflation expectations 1-year ahead even jumped to a ‘shocking’ 4.6% from 3.6%. The market reaction to the Michigan data was modest. Even so, at the end of the day US yields gained between 13.6 bps (2-y) and 4.75 bps (30-y). The 2-y yield ‘easily’ surpassed the 4.0% barrier (close 4.10%). The 10-y closed just north of the 3.50% barrier. Market now again see an 80% chance of a Fed rate hike at the May 3 meeting. German yields followed the US ‘at a distance’ adding between 10.2 (2-y) and 4.5 bps (30-y) as several ECB governors last week suggested that at a 3.75% peak policy rate is probably necessary to clamp down inflation. US equities closed in red (S&P 500 -0.21%) but off the intraday lows. The rebound in US yields finally also caused USD shorters to take some chips off the table going into the weekend. DXY rebounded from an intraday low near 100.80 to close at 101.58. EUR/USD failed to extend gains beyond the 1.1033 previous YTD top to close at 1.0994. Sterling underperformed the dollar and the euro with EUR/GBP extending its bottoming process (close 0.8855).
This morning Asian markets show no clear directional trend. Today, the calendar is thin with only the US Empire manufacturing survey and NAHB housing index as data series worth mentioning and this will also be the case for most of this week. Friday’s PMI’s are the most high profile data series. China will publish Q1 GDP data tomorrow. ECB and Fed members will be able to give ‘final’ guidance in the run-up to the early May policy meetings. Investors will keep a close eye at the first corporate earnings/guidance. After last week’s rebound in yields, markets now are positioned more neutral compared to pre-payrolls. 4.17/25% & 3.64% is first (tough?) resistance respectively for the US 2 & 10-y yield. If the rally in (US) yields slows, the dollar might have difficulties to stage a sustained comeback. EUR/USD 1.1185 (March 2022 top) is next topside reference on the charts. EUR/USD 1.0831 remains first important support. UK markets will receive an in extenso data update this week (labour data Tuesday, inflation Wednesday, retail sales Friday) as markets ponder whether the BoE should take a pause in its hiking cycle early May.
News and views
Poland and Hungary temporarily suspended imports of Ukrainian grain in a move that’s aimed to put a bottom below sliding domestic grain prices and protect local farmers. After Russia’s invasion, the EU scrapped customs and quotas on Ukrainian grain imports and redirected some shipments from blockaded ports at the Black Sea via Poland and Romania. Most of that was meant for re-export to the Middle East and Africa but instead stayed in countries near Ukraine due to shortages of trucks and trains. Trade policy is an exclusively EU competence. With the move, both countries thus risk opening a new rift with the EU, alongside long-running disputes over the rule of law.
The Bank of England is considering a major reform of the deposit guarantee scheme, the Financial Times reported. Under current rules, the guarantee limit is set at £85 000, which covers only about two-thirds of deposits of businesses. In addition, the system is relatively low pre-funded, causing a delay of at least a week for customers to regain access to their cash in case of an SVB-alike event. This undermines the confidence in and thus the effectiveness of the scheme. Regulators are mulling a higher amount of insured deposits. Alternatively, they could increase the amount guaranteed for specific uses, such as working capital. A higher level of pre-funding to eliminate the payout delay is also being considered.
US Inflation Expectations Jump, as Earnings Season Kicks Off
Despite the softer-than-expected inflation data released earlier last week, US inflation expectations shocked investors at last Friday’s release; the 1-year expectation jumped from 3.6% to 4.6% due to the surprise surge in energy prices. The expectation was a further easing to 3.5%.
And energy bulls remain in charge of the market, as besides the tighter OPEC supply, the US Energy Secretary Jenifer Granholm said that the US could begin buying oil to refill the strategic reserves and the EIA warned that the global oil demand will rise by 2mbpd to almost 102mbpd. Both helped keeping the price of American crude at around its 200-DMA, a touch below the $83pb level.
Therefore, despite the easing inflation pressures on the CPI figures, the positive pressure building on energy prices and the surging inflation expectations boost the Federal Reserve (Fed) hawks. Combined to waning bank stress, the US 2-year yield – which is a good proxy of what investors think the Fed will do - rose last week, although we are still far below the 5% level before the Silicon Valley Bank (SVB) collapsed. The expectation of a 25bp hike at the next FOMC meeting is given a good 83.5% chance.
In the FX, the US dollar index tested the lowest ytd levels, and formed a triple bottom near the 100.75/100.80 range.
The major peers continue benefiting from a softer dollar to consolidate gains. The EURUSD tested waters above 1.10 last week, and even though the pair is below the 1.10 mark this Monday morning, the recovery could continue toward the 1.1225 mark, the major 61.8% retracement on 2021 to 2022 selloff, as the European Central Bank (ECB) chief Christine Lagarde reminded traders that the bank is ready ‘to act in light of elevated inflation’.
In precious metals, gold trades a few dollars below its all-time-high levels. Resistance is seen into the $2050 level, but a further dollar weakness could push the price of an ounce to a fresh all-time high in the coming weeks.
In equities, the S&P500 was boosted by stronger-than-expected earnings from big US banks. JP Morgan, Citigroup and Wells Fargo took advantage of rising interest rates for two reasons.
- Higher interest rates allowed the big banks to make more money out of lending, which resulted in significant gains in net interest income.
- Deposit outflows from the small US banks following the SVB collapse, were directed toward the big banks. JP Morgan’s deposits, for example, rose 2% last quarter.
JPM stock rallied more than 7.5% on Friday after the results, Citi rose by almost 5%. Bank of America, Goldman Sachs and Morgan Stanley are due to report their latest quarterly results this week. And investors will be watching how their deposits were impacted by the latest bank stress and how much they benefited from the rising interest rates.
Though, as their peers that reported results last Friday, the remainder of the big US banks could also warn of deteriorating economic conditions, and higher provisions for potential loan losses.
Earnings pessimism is good for stock prices
Earnings expectations for this quarter are not brilliant. The S&P500 earnings are expected to fall around 6% in Q1 this year compared to the Q1 of 2022. And if that’s the case, that will be the first time that y-o-y earnings fall since Covid shock.
That’s bad news. But the good news is, the expectations are driven by conversations with corporate executives which love sounding pessimistic, so that when the results come in better-than-expected, the market reaction could be positive despite soft results.
Besides the big bank earnings, Netflix, Tesla, TSM, Johnson and Johnson and P&G will be among companies that will walk into the earnings confessional this week.
Weak Spending Won’t Derail Another Fed Hike
Market movers today
We start the week off on a fairly quiet note with regards to data releases. We get US Empire manufacturing PMI and Norwegian trade balance.
Overnight, China releases a bunch of data including Q1 GDP data. Consensus is for around 2% growth q/q following a post-Covid rebound.
Through the remainder of the week, the most important release will be flash PMIs on Friday.
We will also keep an eye on final euro area HICP data and Japanese inflation.
The 60 second overview
Macro: While March retail sales were not particularly strong (with headlines sales declining by 1.0% m/m), the fall was largely driven by lower gasoline prices, as well as the reversal of some earlier weather-related strength (e.g. in car sales). Sales in most other categories held up decently, which was enough to spark a clear uptick in US yields on Friday. Fed's Waller supported the move by saying that US monetary policy would have to remain tight for a 'substantial period' and longer than markets are pricing in. Furthermore, the University of Michigan's April survey showed that consumers' 1y inflation expectations rose to 4.6% (from 3.6%), the highest since last November. Finally, the weekly Fed data showed that US bank lending had stabilized in early April after two weeks of decline, even among smaller banks and towards the non-commercial and non-residential real estate. Despite the generally softer March data (which we discussed in US Labour Market Monitor, 14 April), Friday's releases suggest that the US economy is not on the brink of an imminent recession, and that the Fed is likely to deliver a final hike in May.
Fed: Fed Governor Christopher Waller on Friday said he favoured more monetary tightening unless credit conditions tightened more than expected. The market discounts almost a full 25bp rate hike at the upcoming FOMC meeting in May.
US: According to Financial Times companies plan to spend more than USD200bn in investments in clean technology and semiconductor manufacturing - an indication that companies respond to the incentives given in the Inflation Reduction Act and Chips and Science Act.
Equities: Global equities slightly higher Friday driven by Europe, value, and the cyclical sectors. On top the performance rank were banks after strong earnings reports and higher yields. The three big US banks JPM, WFC, and C all delivered strong results but lift to guidance on the NII side was received very well by investors. In US on Friday, Dow -0.4%, S&P 500 -0.2%, Nasdaq -0.4% and Russell 2000 -0.9%. Asian markets are mostly higher this morning and the same goes for European and US futures.
FI: Global rates surged on Friday led by the front end after the US data supports further monetary policy tightening. While the 10y German yield rose 6bp on the day to 2.44%, the 2y point rose 9bp to 2.88%. During the past week, markets have added 10bp to the ECB peak policy to now stand at 3.76% in September. We still like our 4% call, which is slightly above market pricing.
FX: EUR/USD starts off the week back below 1.10 as US rates ended last week higher on the back of benign development for US financials. USD/JPY is testing 1M-highs of 134 and Scandies little changed since Friday. Our updated Riksbank call entails 50bp in April (previously 75bp), following lower-than-expected Swedish inflation for March, however EUR/SEK was little changed in Friday's trading, under depressed liquidity.
Credit: The market recovered further last week with iTraxx Main tightening 6bp to 82bp and Xover by 29bp to 430bp. The tendency could also be observed in the primary market; while EUR6.5bn of covered bonds were printed, issuance in financials was not only confined to the very safest part of the funding structure as KBC, Credit Agricole, ABN and Rabobank all brought senior deals while Generali printed Tier 2. That being said, the reopening following the period of banking stress has been led by large and established issuers and market demand for deals from less frequent issuers in unsecured format still needs to be tested.
Nordic macro
Peak inflation seems to finally have arrived in Sweden, and while the February inflation print showed a significant upside surprise, Friday's March inflation print surprised on the low side to expectations. That said, core inflation at 0.6% MoM and 8.9% YoY is still far too high for the Riksbank and the gap in core inflation compared to the Riksbank's February forecast increased to 1.4p.p.
In February, the Riksbank signalled 33bp of hikes for the April meeting. With the worst inflation fears not being realised, but inflation still far above both their target and forecast, we adjust our call ahead of the April meeting from 75bp to 50bp. We keep our expectations for another 50bp hike in June. Implying a policy rate top of 4% will be reached by summer.
Yen Extending Decline, CPIs and PMIs to Take Spotlights
Asian trading remains relatively subdued today, with the exception of Yen's ongoing selloff. Meanwhile, Dollar attempts a weak recovery, while Euro and New Zealand Dollar are softer for now. The focus may shift away from the greenback this week, as significant data releases from other regions take center stage. Specifically, CPI data from the UK, Canada, New Zealand, and Japan will be in the spotlight, while PMIs from Australia, Japan, the Eurozone, and the UK will also be closely monitored. Additionally, China's GDP data may have an impact on the markets.
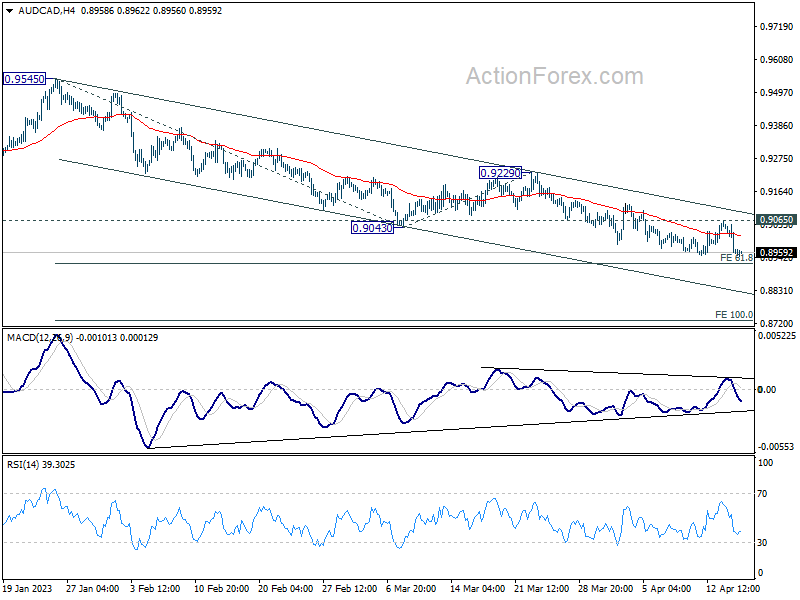
AUD/CAD is an intriguing pair to watch this week, as both Canadian CPI data and Chinese economic figures could spark strong market reactions. Technically, the cross is losing downside momentum, as evidenced by bullish convergence condition in 4H MACD, while it approaches 61.8% projection of 0.9545 to 0.9043 from 0.9229 at 0.8919. Solid support at this level, followed by a break of 0.9065 resistance, would confirm short-term bottoming and serve as an early indication of trend reversal towards 0.9229 resistance. On the other hand, decisive break of 0.8919 could trigger reacceleration towards 100% projection at 0.8727.
In Asia, at the time of writing, Nikkei is up 0.07%. Hong Kong HSI is up 0.85%. China Shanghai SSE is up 1.11%. Singapore Strait Times is up 0.10%. Japan 10-year JBG yield is up 0.0196 at 0.481.
NZ BNZ Services dropped to 54.4, but keeps its head above water
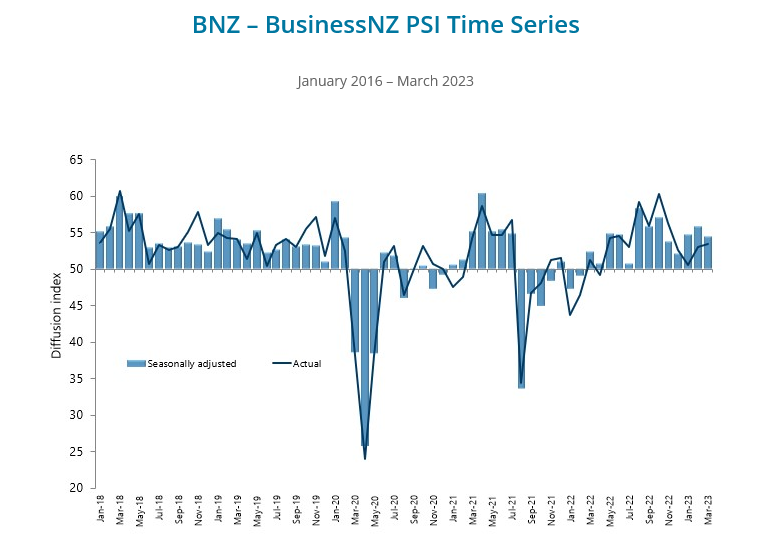
New Zealand's service sector growth slowed down in March, with the BusinessNZ Performance of Services Index (PSI) declining to 54.4 from 55.8 in February. However, the index stayed above the long-term average of 53.6.
BusinessNZ Chief Executive Kirk Hope highlighted the uptick in negative sentiment, with the proportion of negative comments surging from 51.9% in February to 58.6% in March. The main concerns expressed were a cooling economy, the impact of price increases, and overall uncertainty.
Despite these challenges, BNZ Senior Economist Craig Ebert remains cautiously optimistic. He noted that while the PSI held relatively steady in March, the Performance of Manufacturing Index (PMI) slipped into slightly negative territory. Nonetheless, Ebert believes that there is enough positive momentum to suggest an underlying tendency for growth in activity.
Yen's downward spiral persists ahead of inflation data, CHF/JPY aiming new high
Japanese Yen continues its selloff in Asian session, remaining the worst performer in April thus far. The currency's weakness is primarily driven by expectations of ongoing policy divergence between BoJ and other major central banks, as well as a rebound in major global benchmark yields.
New BoJ Governor Kazuo Ueda appears in no rush to modify the parameters of yield curve control or the framework itself, nor does he seem ready to alter the joint statement between the central bank and the government. Consequently, the BoJ's exit from its ultra-loose monetary policy appears distant.
This stance is based on the assumption that Japan's inflation will slow this year, while domestic wage growth momentum is insufficient to maintain a sustainable 2% inflation target. Markets are awaiting this week's March CPI report to determine the validity of this view.
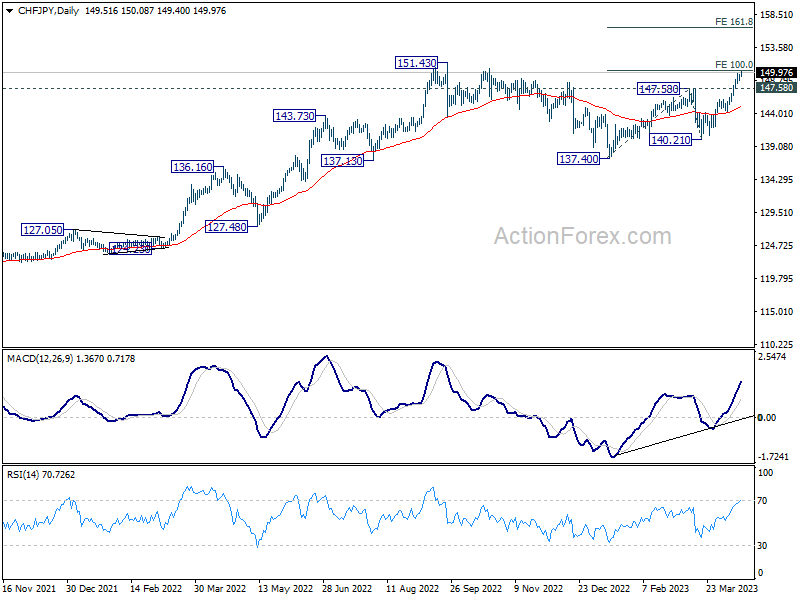
From a technical perspective, CHF/JPY is a key pair to watch, as it could be the first Yen pair to break through last year's high and resume its long-term uptrend. The cross is currently rallying towards 151.43 high, with upside acceleration reflected in daily MACD. A firm break here would target 161.8% projection of 137.40 to 147.58 from 140.21 at 154.27. The outlook will remain bullish as long as 147.58 resistance-turned-support holds during any retreats.
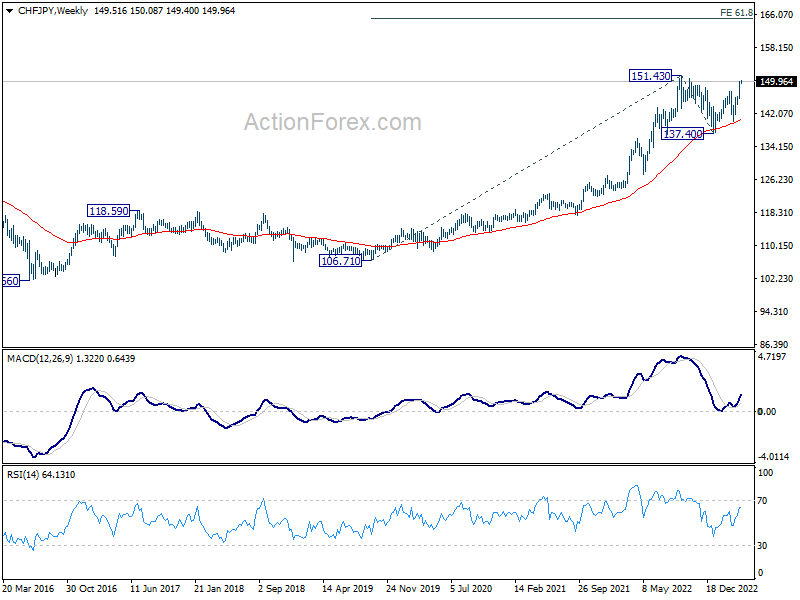
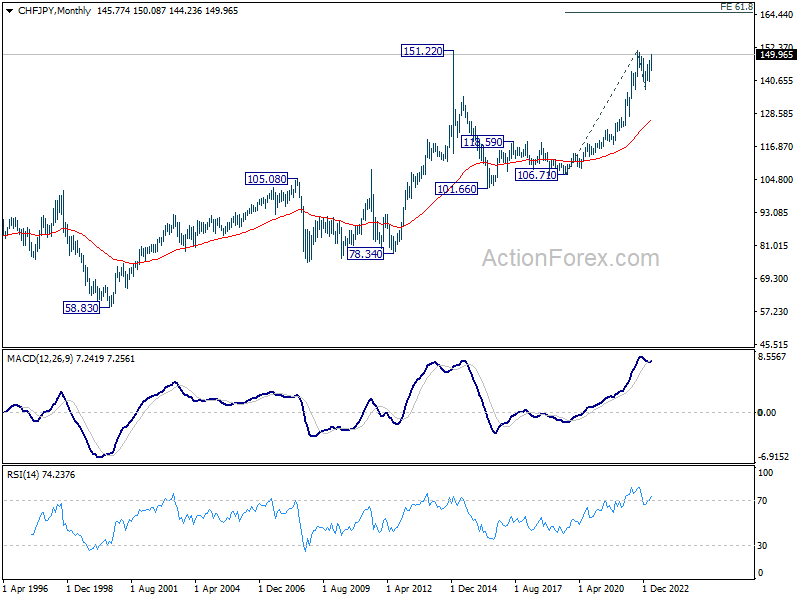
While it may be too early to evaluate, a sustained break of 151.54 could also signal the resumption of the two-decade uptrend from the 58.83 (2000 low). The next medium-term target would the 61.8% projection of 106.71 to 151.43 from 137.40 at 165.30.
Inflation Takes the Limelight in a Busy Week Ahead
The upcoming week is packed with key inflation data. The leading acts are undoubtedly the UK and New Zealand's CPI releases. These reports promise to not only grip our attention but also reaffirm BoE's and RBNZ's unwavering dedication to further monetary tightening. Canada and Japan's CPI data, while not the stars of the show, play critical supporting roles in guiding BoC's and BoJ's future strategies.
An ensemble of PMI reports from Australia, Japan, Eurozone, the UK, and the US graces the stage, and offer further insight into current economic trends, including activity, employment, and prices.
PMIs from Australia, Japan, the Eurozone, the UK, and the US will offer further insight into current economic trends, including activity, employment, and prices.
Additional data to watch include UK employment and retail sales, Germany's ZEW report, and a slew of Chinese data, including GDP. These acts have the potential to send ripples of volatility through the market sentiment.
In central bank activity, meeting minutes from the RBA and ECB will take the spotlight, while the Fed is set to release its Beige Book economic report.
Here are some highlights for the week:
- Monday: New Zealand BusinessNZ services index; Canada wholesales; US Empire state manufacturing index, NAHB housing index.
- Tuesday: RBA minutes; China GDP, industrial production, retail sales, fixed asset investment; UK employment; Germany ZEW; Eurozone trade balance; Canada CPI; US building permits and housing starts.
- Wednesday: UK CPI, PPI; Eurozone current account, CPI final; Canada housing starts, IPPI and RMPI; Fed's Beige Book.
- Thursday: Japan trade balance, tertiary industrial index, tertiary industry index; New Zealand CPI; Australia NAB quarterly business confidence; Germany PPI; ECB meeting accounts; US jobless claims, Philly Fed survey, existing home sales.
- Friday: Australia PMIs; Japan CPI, PMI manufacturing; UK retail sales PMIs; Eurozone PMIs; Canada retail sales; US PMIs.
EUR/GBP Daily Outlook
Daily Pivots: (S1) 0.8829; (P) 0.8844; (R1) 0.8871; More...
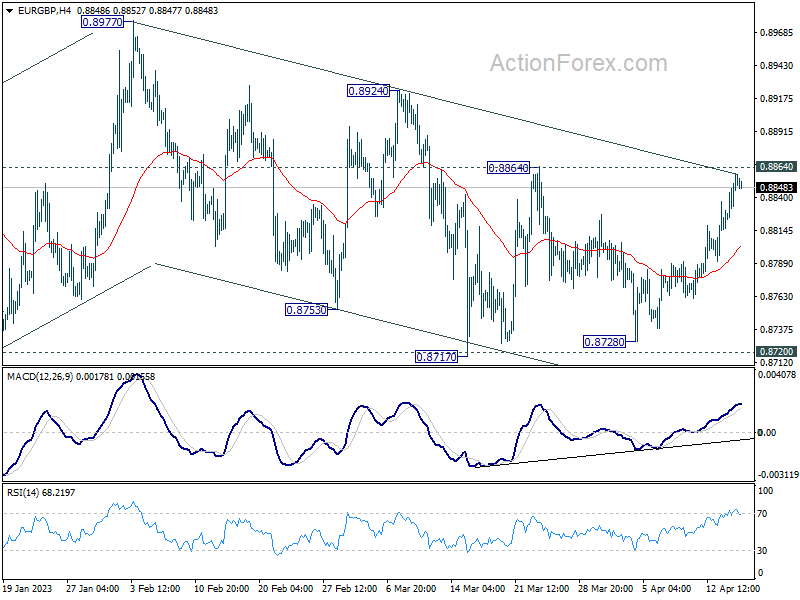
Intraday bias in EUR/GBP stays neutral first with focus on 0.8864 resistance. Firm break there will extend the rebound from 0.8717 to 0.8924 resistance. Further break there should confirm completion of the choppy decline form 0.8977, and should resume larger rise from 0.8545 through 0.8977 high. However, decisive break of 0.8717 support will resume the decline from 0.8977 instead.
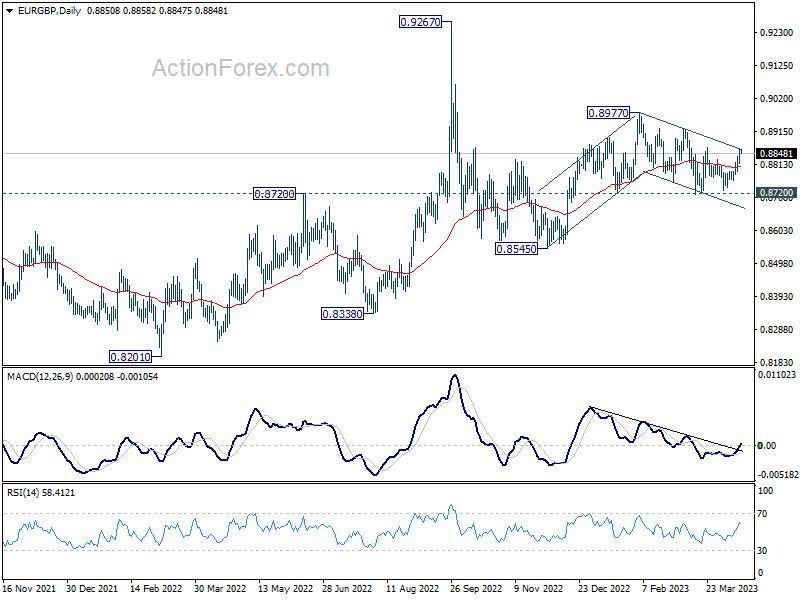
In the bigger picture, outlook remains rather mixed for now, except that price actions from 0.9267 (2022 high) are part of the long term range pattern from 0.9499 (2020 high). With 0.8720 support intact, rise from 0.8545 is in favor to continue through 0.8977. However, firm break of 0.8720 will argue that such rebound has completed, and open up deeper fall through this support level.
Economic Indicators Update
| GMT | Ccy | Events | Actual | Forecast | Previous | Revised |
|---|---|---|---|---|---|---|
| 22:30 | NZD | Business NZ PSI Mar | 54.4 | 55.8 | ||
| 12:30 | CAD | Wholesale Sales M/M Feb | -1.60% | 2.40% | ||
| 12:30 | CAD | Foreign Securities Purchases (CAD) Feb | 6.28B | 4.21B | ||
| 12:30 | USD | Empire State Manufacturing Index Apr | -18.2 | -24.6 | ||
| 14:00 | USD | NAHB Housing Market Index Apr | 44 | 44 |
EUR/GBP Daily Outlook
Daily Pivots: (S1) 0.8829; (P) 0.8844; (R1) 0.8871; More...
Intraday bias in EUR/GBP stays neutral first with focus on 0.8864 resistance. Firm break there will extend the rebound from 0.8717 to 0.8924 resistance. Further break there should confirm completion of the choppy decline form 0.8977, and should resume larger rise from 0.8545 through 0.8977 high. However, decisive break of 0.8717 support will resume the decline from 0.8977 instead.
In the bigger picture, outlook remains rather mixed for now, except that price actions from 0.9267 (2022 high) are part of the long term range pattern from 0.9499 (2020 high). With 0.8720 support intact, rise from 0.8545 is in favor to continue through 0.8977. However, firm break of 0.8720 will argue that such rebound has completed, and open up deeper fall through this support level.
Yen’s downward spiral persists ahead of inflation data, CHF/JPY aiming new high
Japanese Yen continues its selloff in Asian session, remaining the worst performer in April thus far. The currency's weakness is primarily driven by expectations of ongoing policy divergence between BoJ and other major central banks, as well as a rebound in major global benchmark yields.
New BoJ Governor Kazuo Ueda appears in no rush to modify the parameters of yield curve control or the framework itself, nor does he seem ready to alter the joint statement between the central bank and the government. Consequently, the BoJ's exit from its ultra-loose monetary policy appears distant.
This stance is based on the assumption that Japan's inflation will slow this year, while domestic wage growth momentum is insufficient to maintain a sustainable 2% inflation target. Markets are awaiting this week's March CPI report to determine the validity of this view.
From a technical perspective, CHF/JPY is a key pair to watch, as it could be the first Yen pair to break through last year's high and resume its long-term uptrend. The cross is currently rallying towards 151.43 high, with upside acceleration reflected in daily MACD. A firm break here would target 161.8% projection of 137.40 to 147.58 from 140.21 at 154.27. The outlook will remain bullish as long as 147.58 resistance-turned-support holds during any retreats.
While it may be too early to evaluate, a sustained break of 151.54 could also signal the resumption of the two-decade uptrend from the 58.83 (2000 low). The next medium-term target would the 61.8% projection of 106.71 to 151.43 from 137.40 at 165.30.
Technical Outlook and Review
DXY:
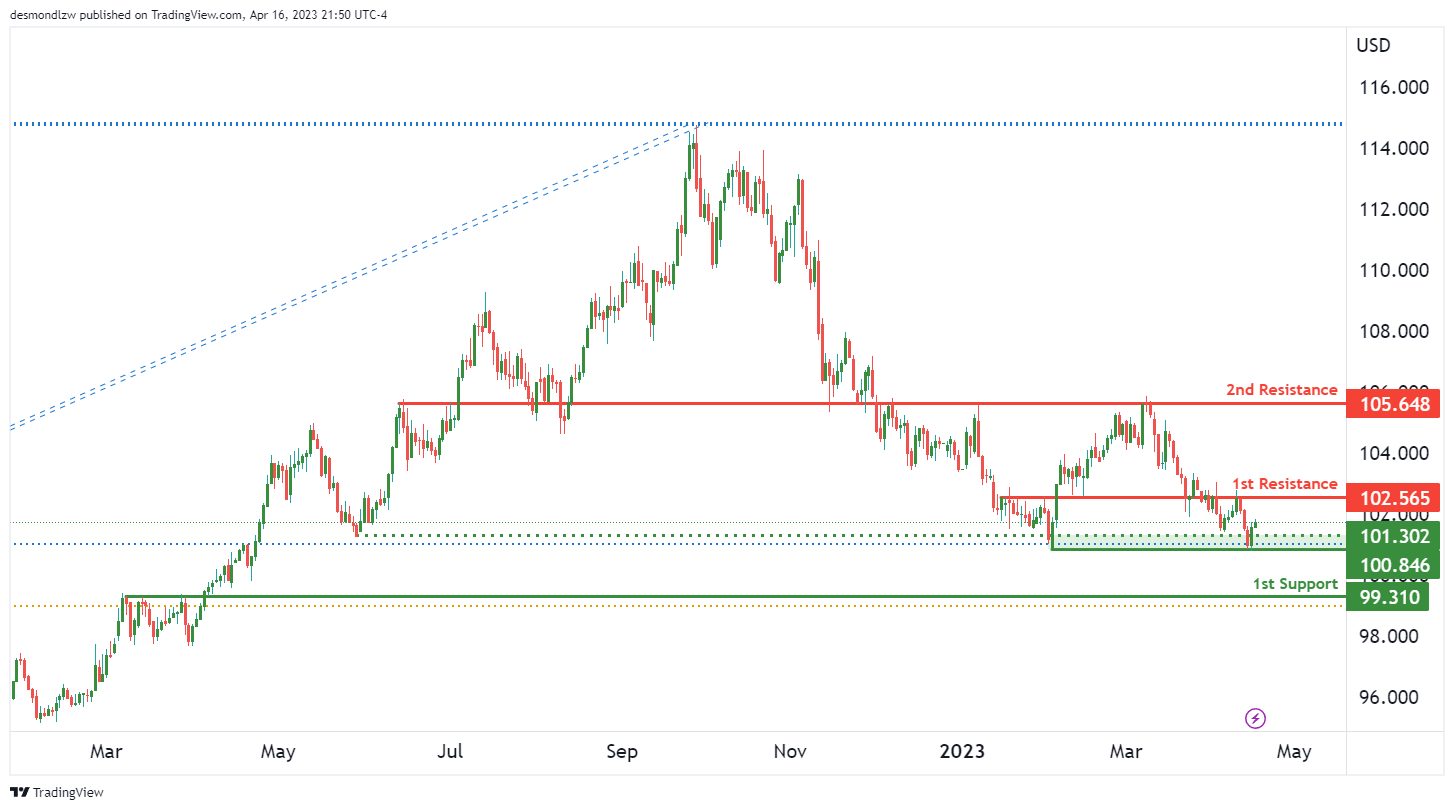
The overall momentum of theDXY, which currently shows a bullish momentum overall. This suggests that the price could potentially continue to rise further, with the potential to make a bullish continuation towards the 1st resistance level.
The first support level for DXY is at 100.85, which is a multi-swing low support. This level has proven to be a strong support in the past, and if the price were to bounce from this level, it could rise towards the 1st resistance at 102.56. The 1st resistance level is an overlap resistance, making it a key level to watch for potential bullish movements.
If the price were to break through the 1st resistance, it could potentially rise towards the 2nd resistance at 105.64, which is also an overlap resistance. However, if the price were to drop instead, the 2nd support level is at 99.31, which is a pullback support.
It’s worth noting that there is an intermediate support level between the current price and the 1st support, although it hasn’t been specified in the information provided. This intermediate support level could potentially trigger a strong bullish acceleration towards the 1st resistance if the price were to break through it.
EUR/USD:
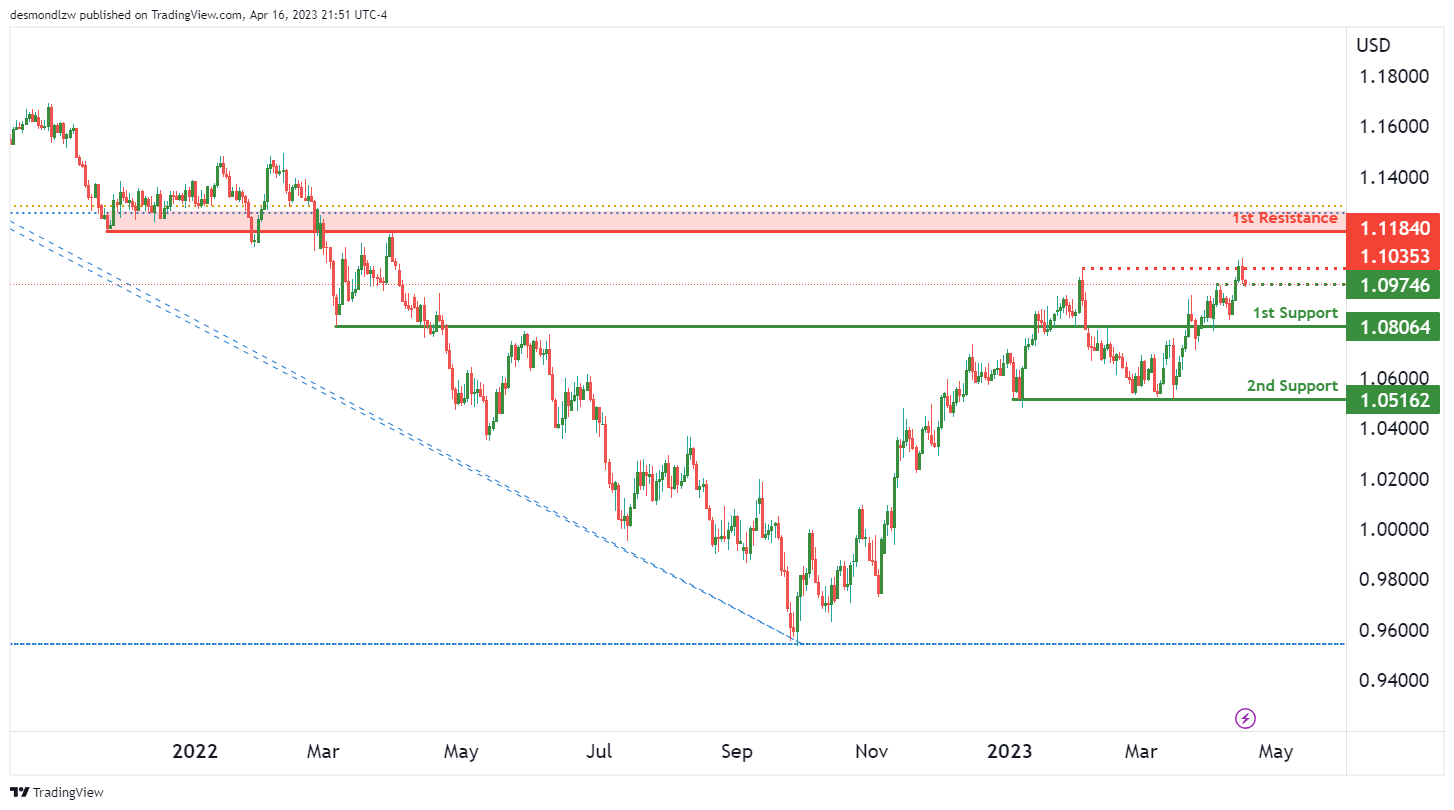
The chart of EUR/USD is currently showing bearish momentum overall, which suggests that the price could potentially make a bearish continuation towards the 1st support level.
The 1st support level for EUR/USD is at 1.0806, which is an overlap support. This level has proven to be a strong support in the past, and if the price were to break through this level, it could potentially drop towards the 2nd support at 1.0516, which is a multi-swing low support.
On the resistance side, the 1st resistance level is at 1.1184, which is an overlap resistance. This level is key to watch for potential bearish movements. Additionally, there is an intermediate resistance level at 1.1035, which is a multi-swing high resistance. If the price were to break through this intermediate resistance level, it could trigger a stronger bearish acceleration towards the 1st support.
It’s worth noting that there is also an intermediate support level at 1.0974, which is a pullback support. If the price were to bounce from this level, it could potentially rise towards the intermediate resistance at 1.1035.
GBP/USD:
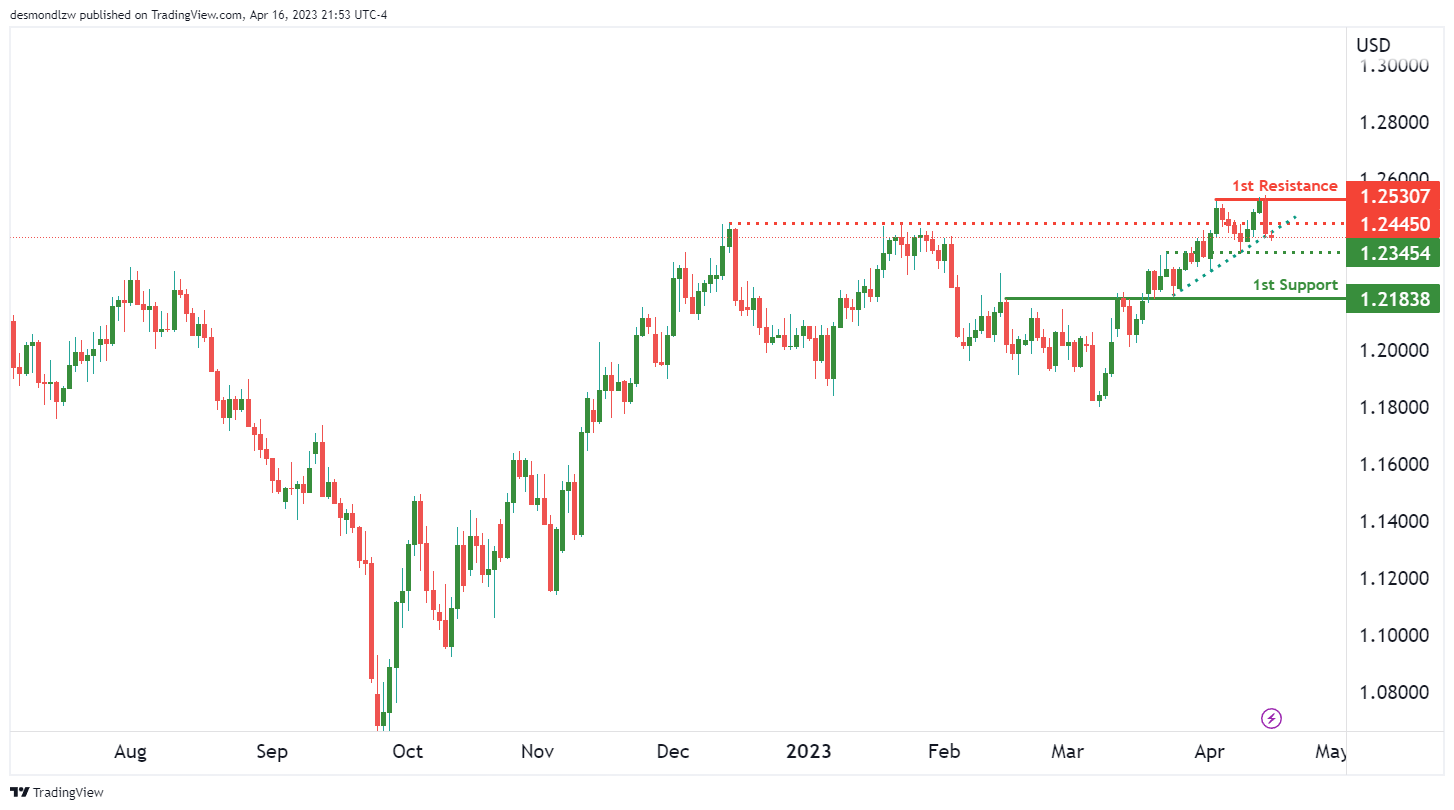
The GBP/USD, which currently shows a bearish momentum overall. This is due to the fact that the price is currently below a major descending trend line, which suggests that further bearish momentum is on the cards. Additionally, if the price were to break below the ascending trend line, it could potentially drop towards the 1st support level.
The 1st support level for GBP/USD is at 1.2183, which is an overlap support and is on an ascending trend line that acts as a support. This level has proven to be a strong support in the past, and if the price were to break through this level, it could potentially drop towards the intermediate support at 1.2345, which is also an overlap support.
On the resistance side, the 1st resistance level is at 1.2530, which is a multi-swing high resistance. This level is key to watch for potential bearish movements. Additionally, there is an intermediate resistance level at 1.2445, which is an overlap resistance. If the price were to break through this intermediate resistance level, it could trigger a stronger bullish acceleration towards the 1st resistance.
USD/CHF:
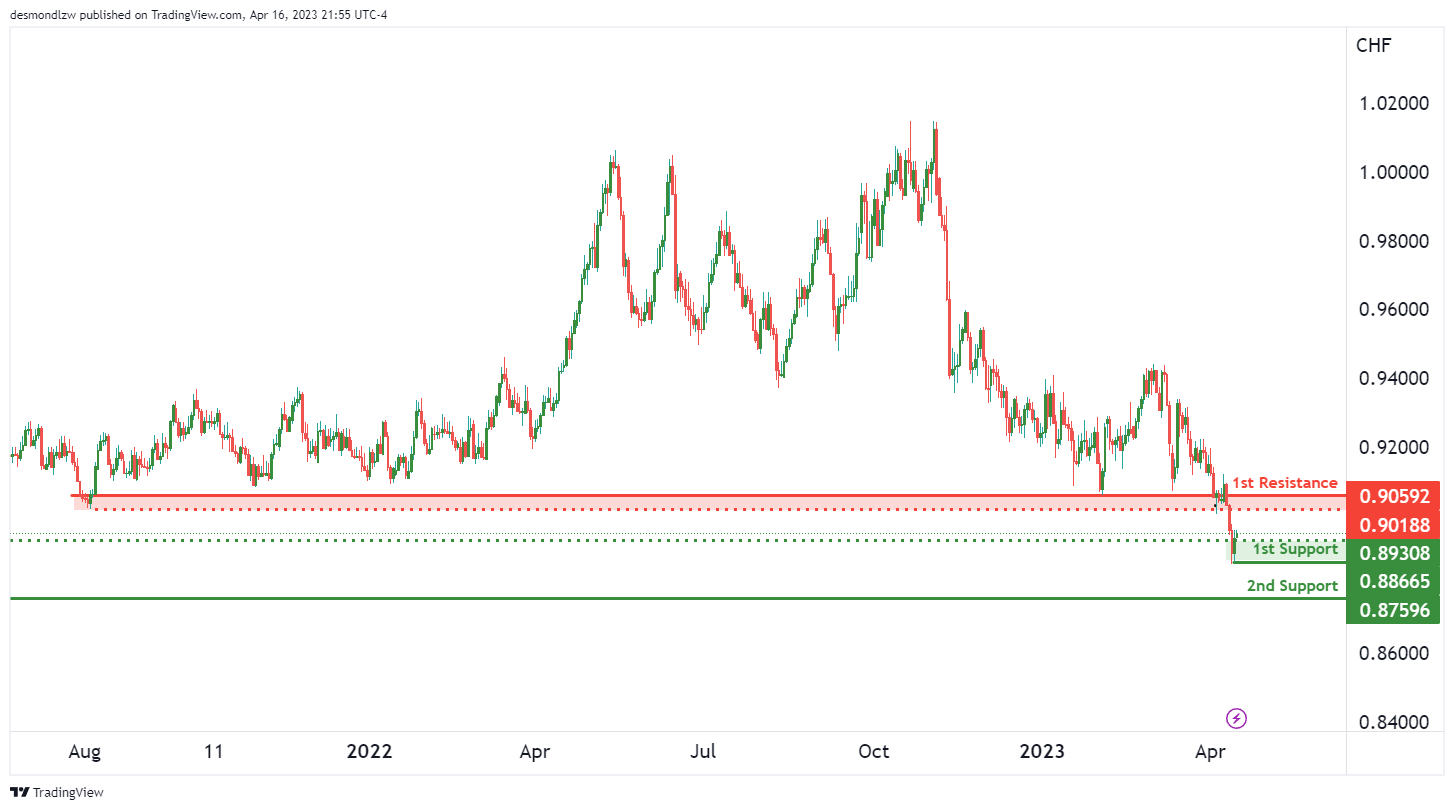
The chart of USD/CHF, which currently shows a bullish momentum overall. This suggests that the price could potentially continue to rise further, with the potential to make a bullish continuation towards the 1st resistance level.
The first support level for USD/CHF is at 0.8866, which is a multi-swing low support. This level has proven to be a strong support in the past, and if the price were to bounce from this level, it could rise towards the 1st resistance at 0.9059. The 1st resistance level is an overlap resistance, making it a key level to watch for potential bullish movements.
If the price were to break through the 1st resistance, it could potentially rise towards the intermediate resistance at 0.9018, which is a pullback resistance. However, if the price were to drop instead, the 2nd support level is at 0.8759, which is a swing low support.
USD/JPY:
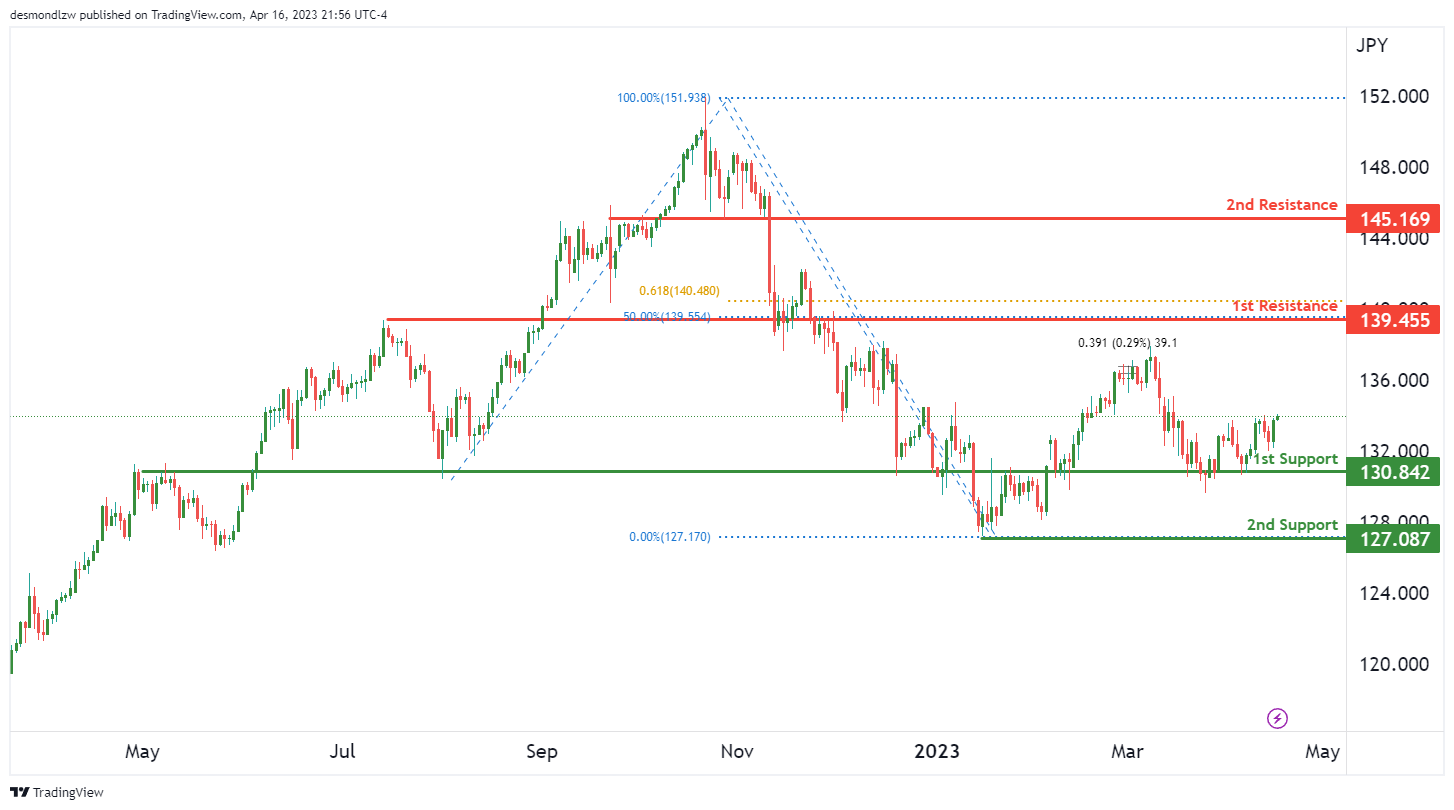
The chart of USD/JPY, which currently shows a bullish momentum overall. This suggests that the price could potentially continue to rise further, with the potential to make a bullish continuation towards the 1st resistance level.
The first support level for USD/JPY is at 130.84, which is an overlap support. This level has proven to be a strong support in the past, and if the price were to bounce from this level, it could rise towards the 1st resistance at 139.45. The 1st resistance level is an overlap resistance and also coincides with a 50% Fibonacci retracement, making it a key level to watch for potential bullish movements.
If the price were to break through the 1st resistance, it could potentially rise towards the 2nd resistance at 145.16, which is a pullback resistance. However, if the price were to drop instead, the 2nd support level is at 127.08, which is a swing low support.
AUD/USD:
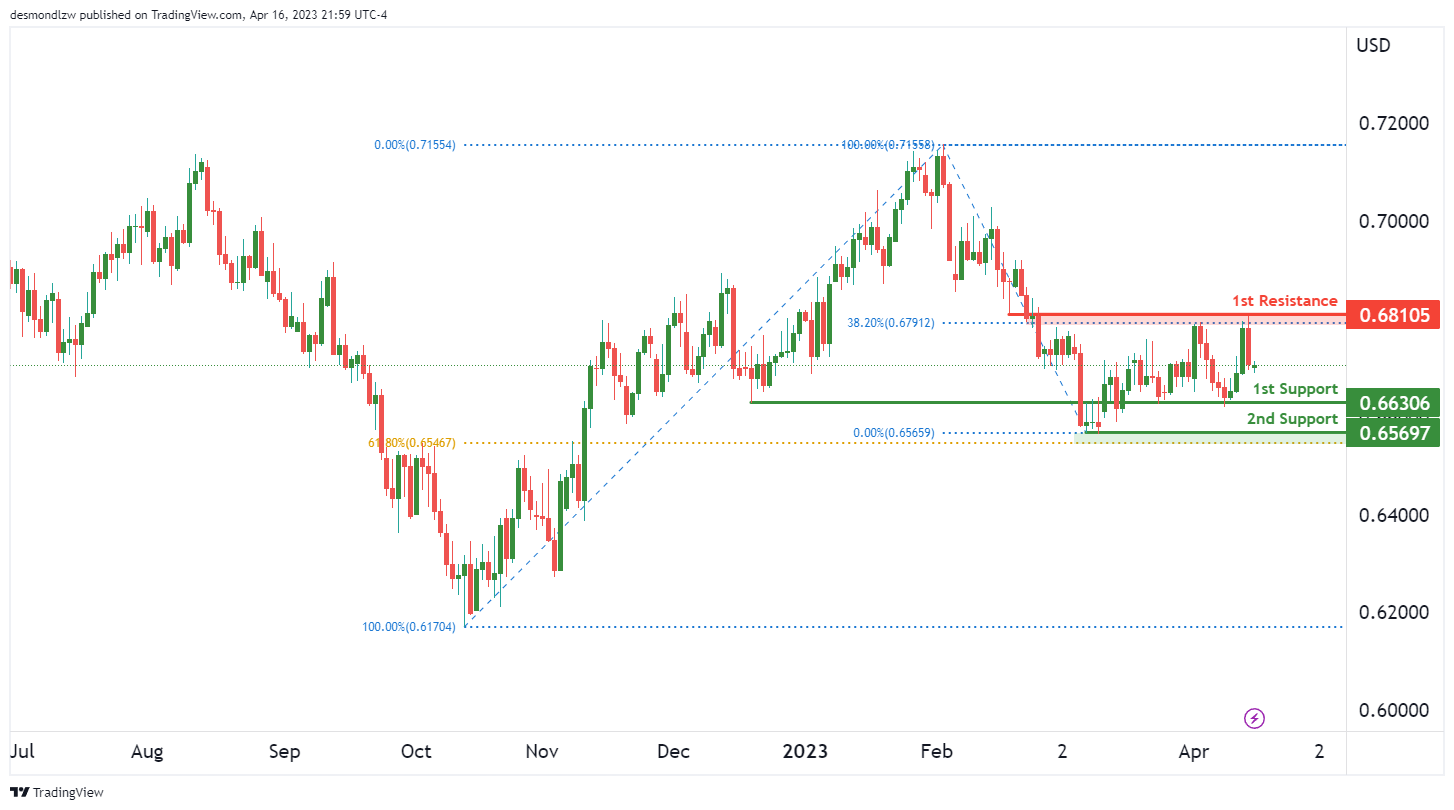
The chart of AUD/USD, which currently shows a bearish momentum overall. This suggests that the price could potentially continue to drop further, with the potential to make a bearish continuation towards the 1st support level.
The 1st support level for AUD/USD is at 0.66, which is an overlap support. This level has proven to be a strong support in the past and is currently at a 61.80% Fibonacci retracement. If the price were to break through this support level, it could potentially drop towards the 2nd support at 0.66, which is a multi-swing low support.
On the resistance side, the 1st resistance level is at 0.68, which is a pullback resistance and also coincides with a 38.20% Fibonacci retracement. If the price were to break through this resistance level, it could potentially rise towards the next resistance level. However, with the current bearish momentum in the chart of AUD/USD, a drop towards the support levels is more likely.
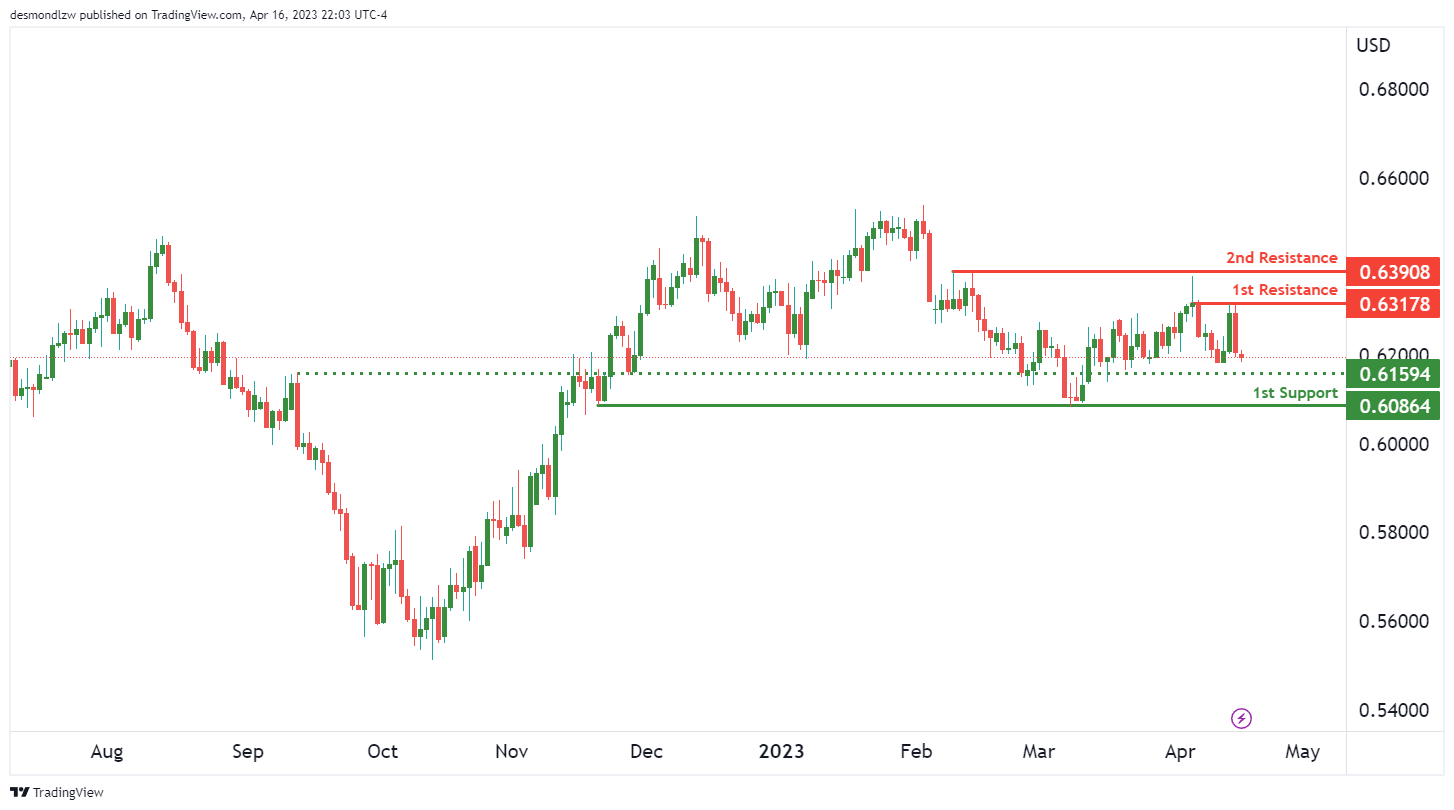
NZD/USD:
the chart of NZD/USD, which currently shows a bearish momentum overall. This suggests that the price could potentially continue to drop further, with the potential to make a bearish continuation towards the 1st support level.
The first support level for NZD/USD is at 0.6086, which is a multi-swing low support. This level has proven to be a strong support in the past and is currently an attractive entry point for investors looking to invest in this particular asset. If the price were to bounce from this level, it could potentially rise towards the intermediate support level at 0.6159, which is an overlap support.
On the resistance side, the 1st resistance level is at 0.6317, which is a multi-swing high resistance. If the price were to break through this resistance level, it could potentially rise towards the 2nd resistance level at 0.6390, which is another multi-swing high resistance.
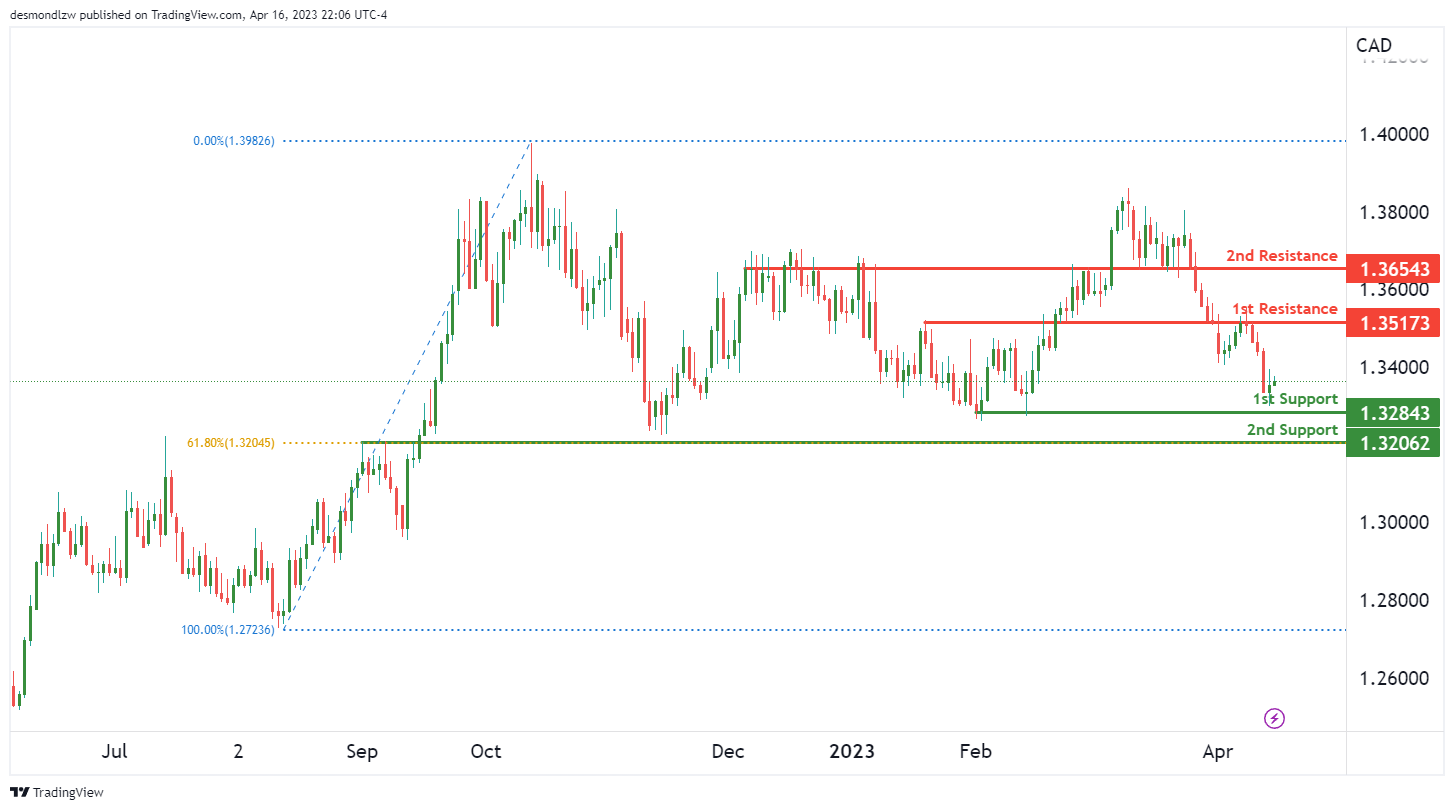
USD/CAD:
The overall momentum of the USD/CAD chart is currently bullish, suggesting that prices may continue to rise. In addition, the price is currently above the Ichimoku cloud, which further supports the bullish sentiment.
Looking at the support and resistance levels, we can see that the 1st support is at 1.3284. This level is a multi-swing low support and could potentially act as a key level for buyers to enter the market. The 2nd support is at 1.3206, and this level is an overlap support, adding to its significance as a potential buying zone.
On the resistance side, the 1st resistance is at 1.3517, which is an overlap resistance. This level is also important as it coincides with the 23.6% Fibonacci retracement level. If the price were to break above this level, it could potentially rise to the 2nd resistance at 1.3654. This level is a pullback resistance, adding to its significance as a potential target for buyers.
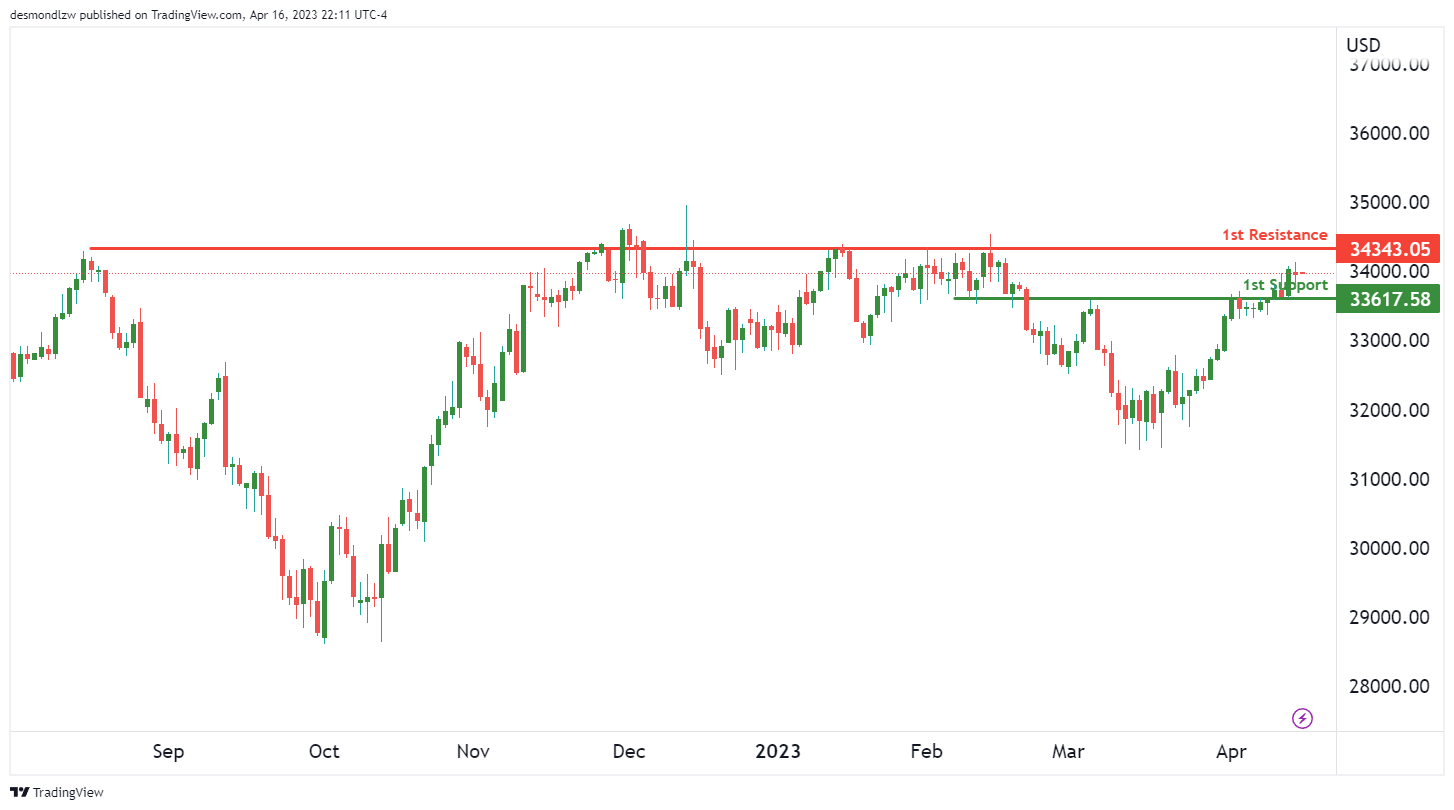
DJ30:
The DJ30 chart is currently showing neutral momentum, with price potentially fluctuating between the 1st support and 1st resistance levels. The 1st support level is at 33617.58, which is an overlap support. On the other hand, the 1st resistance level is at 34343.05, which is a multi-swing high resistance.
While the overall momentum is neutral, the DJ30 chart could see some movement as price fluctuates between these two levels. It’s important to note that breakouts from these levels may not be high conviction in nature due to the lack of a clear trend and momentum.
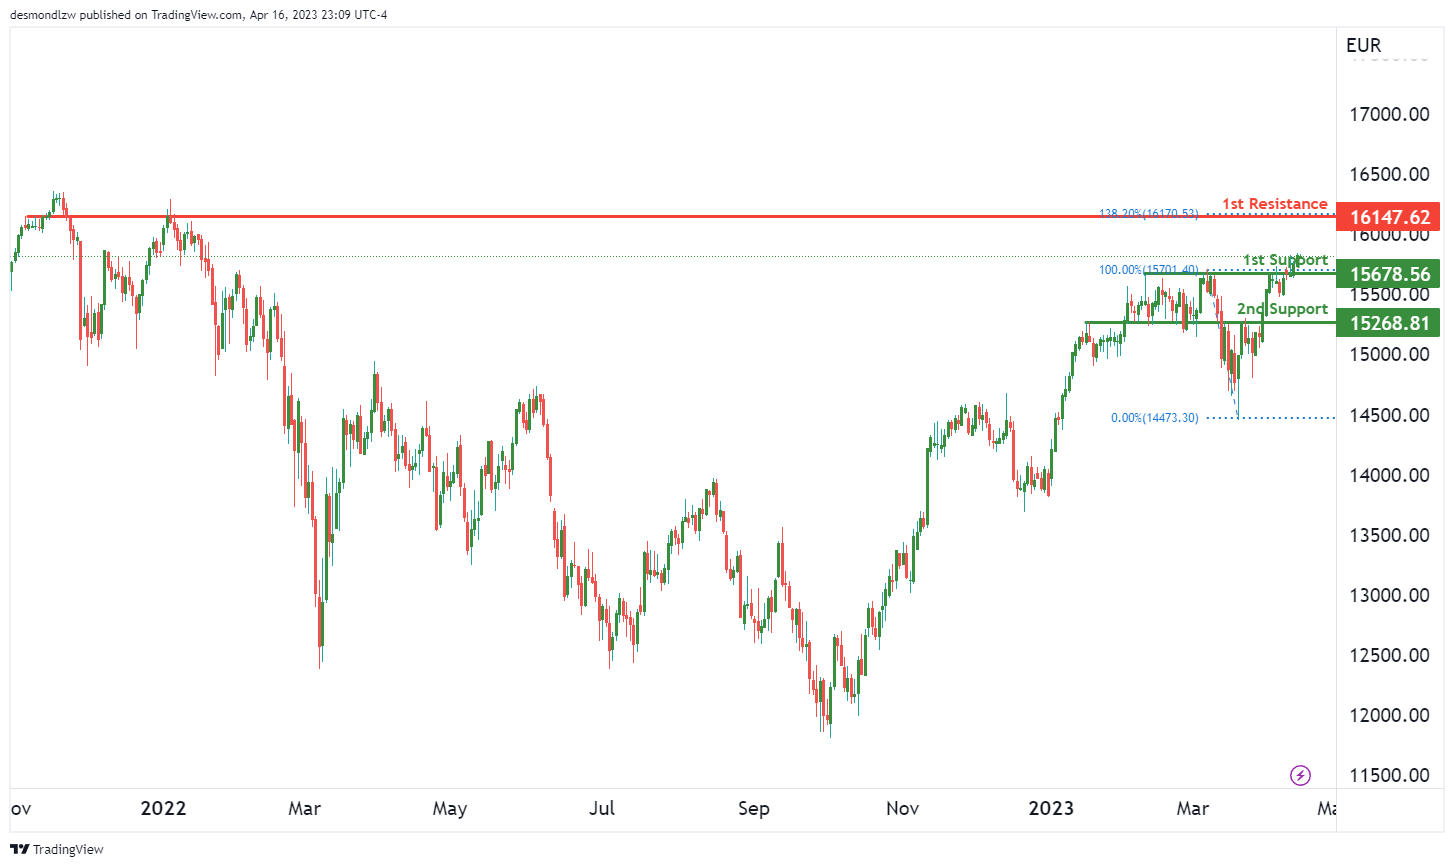
GER30:
The GER30 chart currently shows a bullish momentum, suggesting that prices may continue to rise. The current price could potentially make a bullish continuation towards the 1st resistance level. This indicates that the market is in an uptrend and may continue to be so for the foreseeable future.
In terms of support, the 1st support level is at 15678.56, which is a good pullback support. The 2nd support level at 15268.81 is also a pullback support, and both levels are below the current price. If the price falls, these levels may provide support and prevent the price from falling further.
On the other hand, the 1st resistance level at 16147.62 is a good overlap resistance level, with a 138.20% Fibonacci Extension. This level is above the current price, and if the price rises, this level may provide resistance and prevent the price from rising further.
BTC/USD:
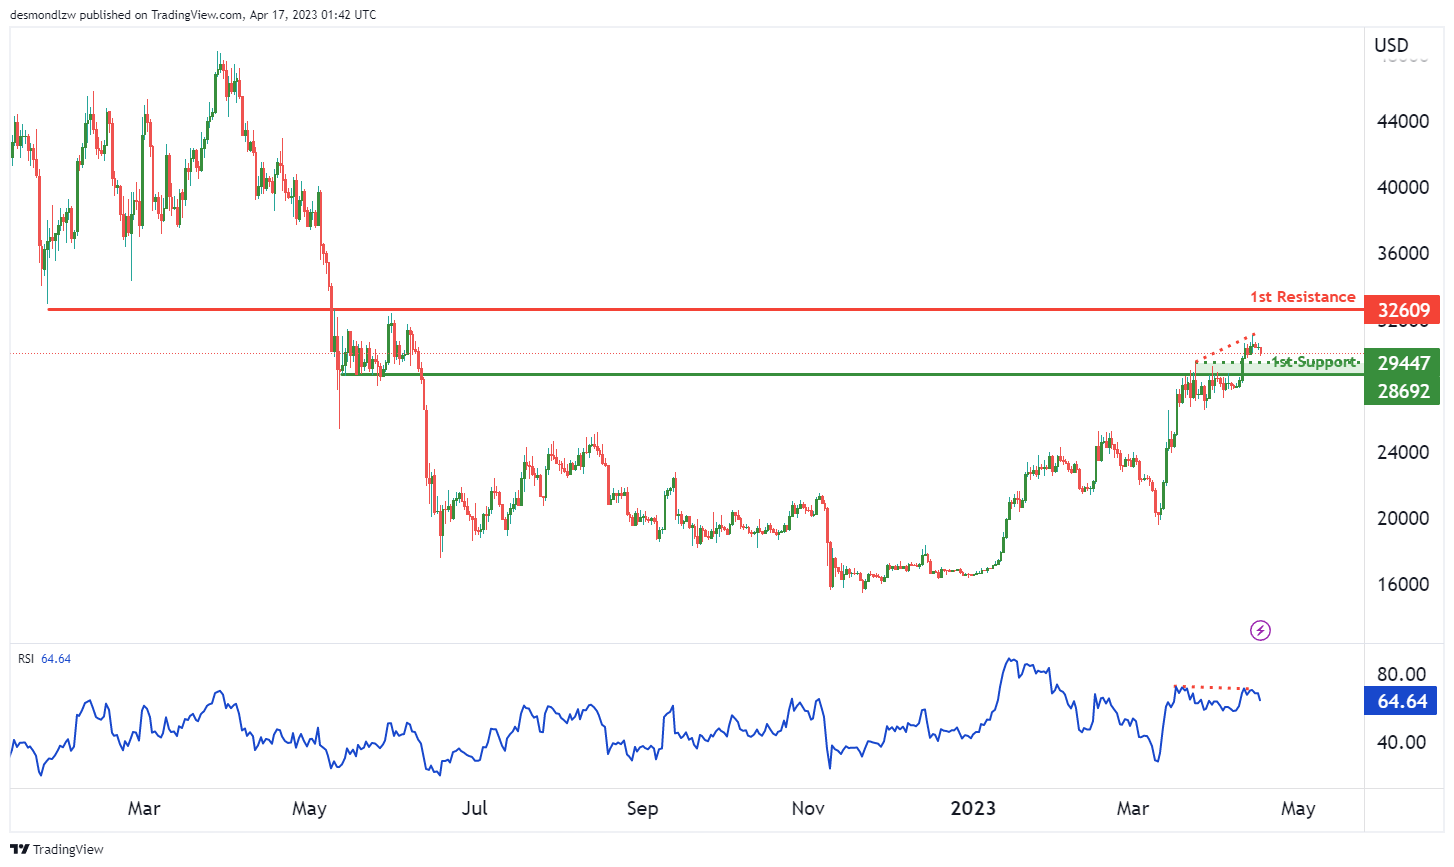
Bitcoin Analysis: Potential Short-Term Drop Before Reaching 1st Resistance
The overall momentum of the Bitcoin chart is currently bullish. However, it seems that price could potentially drop further in the short term before rising towards the first resistance level.
At the moment, price is testing the 1st support at 28692. This level is a pullback support and could potentially act as a bouncing point for price to rise towards the 1st resistance at 32609. However, there is an intermediate support at 29447 which is also a pullback support, suggesting that price may drop further in the short term before bouncing from there.
It’s worth noting that the RSI is displaying bearish divergence versus price, indicating that a reversal might occur soon.
US500
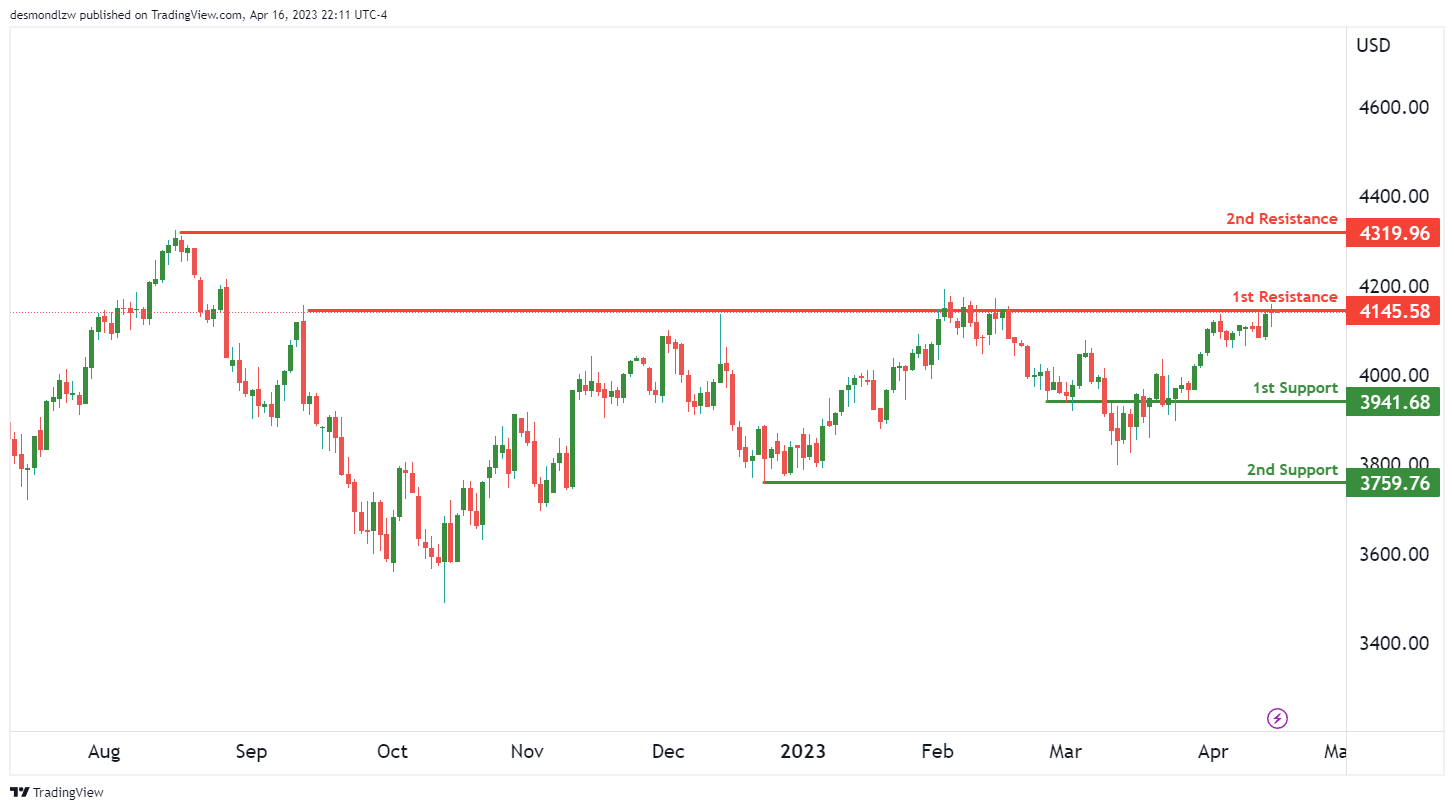
The US500 chart is currently showing a bearish momentum. There is a potential for a bearish reaction off the 1st resistance at 4145.58, which is a strong multi-swing high resistance level. Additionally, there is a 2nd resistance level at 4319.96 which is a swing high resistance.
On the other hand, there are support levels to look out for. The 1st support level is at 3941.68 which is a strong overlap support level, while the 2nd support level is at 3759.76 which is a swing low support.
If price were to break the 1st resistance, it could potentially rise towards the 2nd resistance level. However, given the overall bearish momentum of the chart, it is more likely that price will drop towards the 1st support level.
ETH/USD:
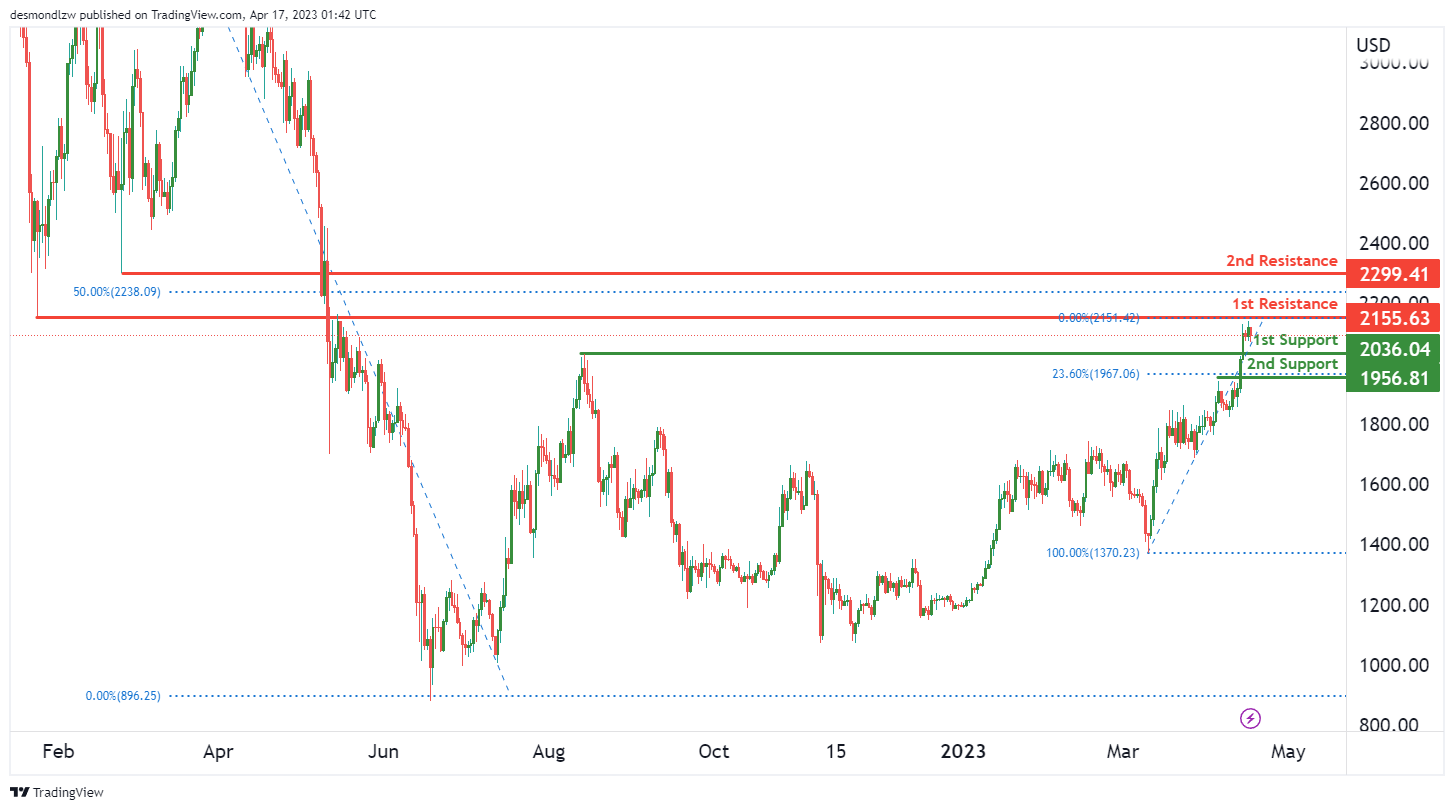
The price of ETH/USD has been showing bearish momentum on the chart, with potential for a continuation towards the 1st support at 2036.04, which is a pullback support level. Another support level to consider is the 2nd support at 1956.81, which is also a pullback support and aligns with the 23.6% Fibonacci retracement level.
On the resistance side, the 1st resistance is at 2155.63, which is a strong overlap resistance level. If the price manages to break above this level, it could potentially rise towards the 2nd resistance at 2299.41, which is a pullback resistance level. However, given the bearish momentum of the chart, it is more likely that the price will continue to drop towards the support levels rather than break above the resistance levels.
WTI/USD:
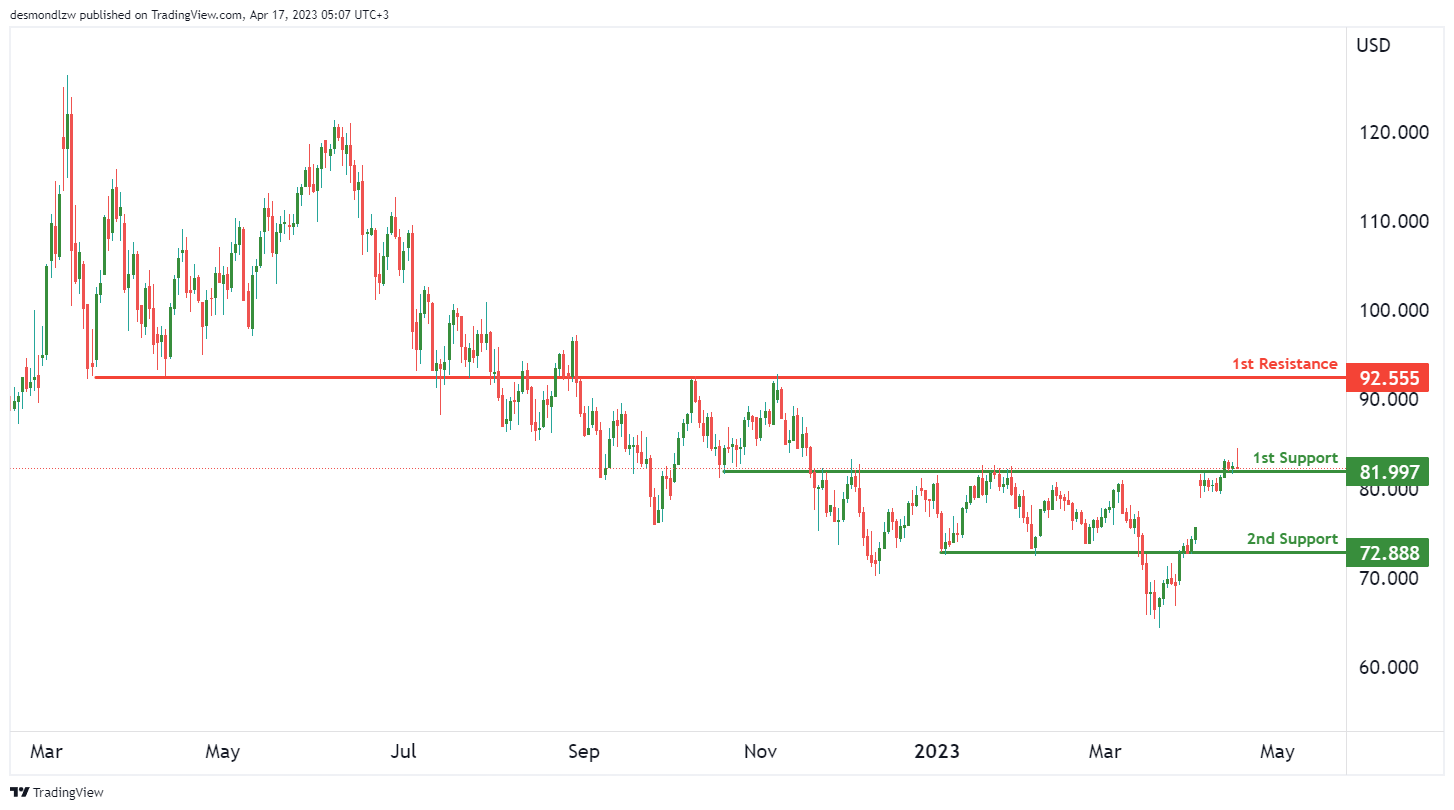
The price of WTI has been showing bullish momentum on the chart. However, in the short term, the price could potentially retrace towards the 1st support at 81.99, which is a strong overlap support level. If the price bounces off this support, it could resume its bullish momentum towards the 1st resistance at 92.55, which is also an overlap resistance level.
If the price were to drop below the 1st support, it could potentially fall towards the 2nd support at 72.88, which is another overlap support level. It’s worth noting that a drop towards the 2nd support is not our base scenario, but it is a possible scenario to keep in mind.
XAU/USD (GOLD):
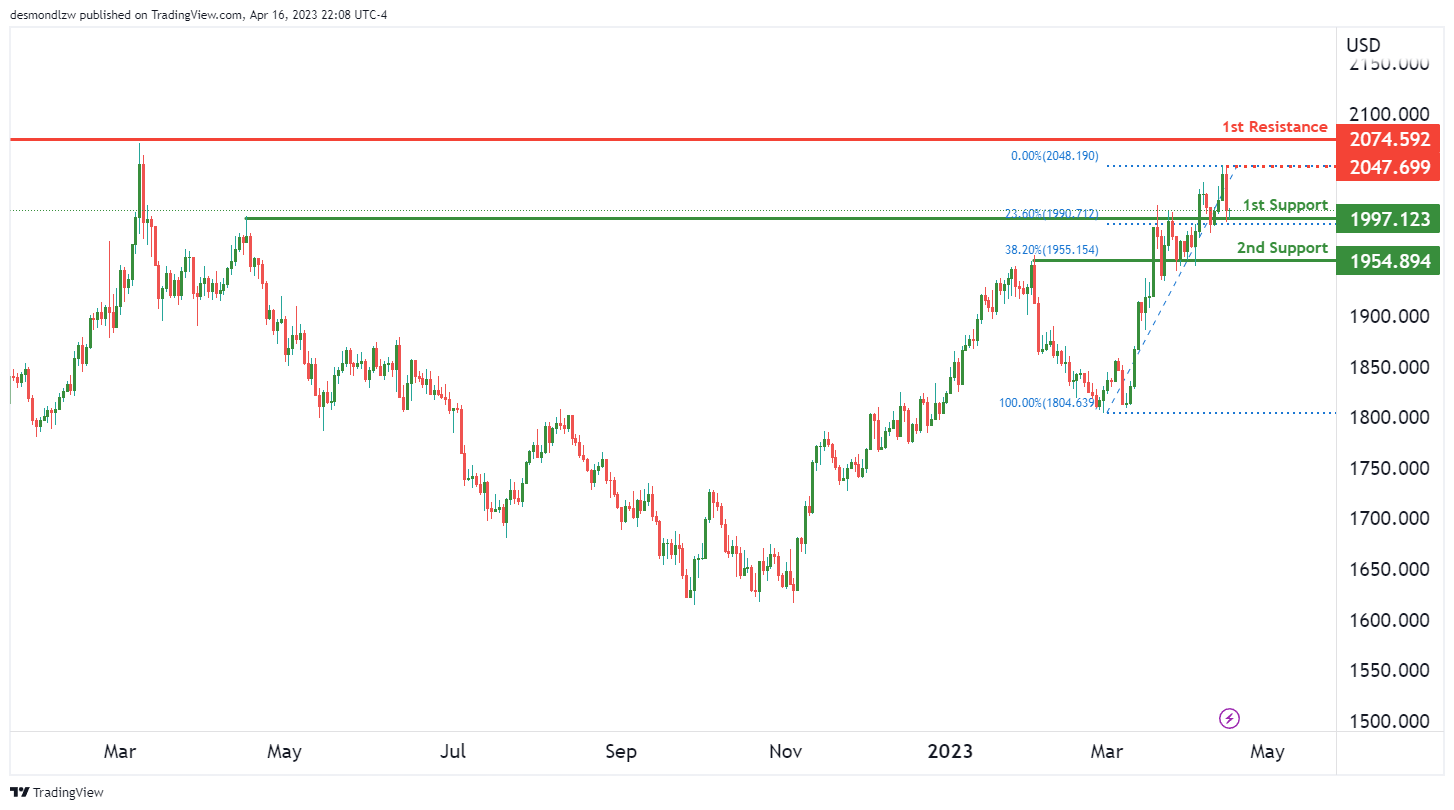
The XAU/USD chart is currently showing bullish momentum, and the price could potentially drop in the short term towards the 1st support at 1997.12, which is a strong overlap support level and also aligns with the 23.6% Fibonacci retracement level. If the price breaks below this level, it could drop further towards the 2nd support at 1954.89, which is also an overlap support and aligns with the 38.2% Fibonacci retracement level.
On the resistance side, the 1st resistance is at 2070.59, which is a swing high resistance level. If the price manages to break above this level, it could potentially rise towards the intermediate resistance at 2047.69, which is also a swing high resistance. Overall, the chart suggests that the momentum is bullish, and the price may continue to rise towards the resistance levels after a short-term drop towards the support levels.
NZ BNZ Services dropped to 54.4, but keeps its head above water
New Zealand's service sector growth slowed down in March, with the BusinessNZ Performance of Services Index (PSI) declining to 54.4 from 55.8 in February. However, the index stayed above the long-term average of 53.6.
BusinessNZ Chief Executive Kirk Hope highlighted the uptick in negative sentiment, with the proportion of negative comments surging from 51.9% in February to 58.6% in March. The main concerns expressed were a cooling economy, the impact of price increases, and overall uncertainty.
Despite these challenges, BNZ Senior Economist Craig Ebert remains cautiously optimistic. He noted that while the PSI held relatively steady in March, the Performance of Manufacturing Index (PMI) slipped into slightly negative territory. Nonetheless, Ebert believes that there is enough positive momentum to suggest an underlying tendency for growth in activity.
EUR/USD Dips But Key Uptrend Support Intact
Key Highlights
- EUR/USD extended gains above 1.1000 before the bears appeared.
- A key bullish trend line is forming with support near 1.0940 on the 4-hour chart.
- GBP/USD spiked above 1.2540 before it faced resistance.
- Crude oil prices started a consolidation phase above $80.
EUR/USD Technical Analysis
The Euro started another increase from the 1.0820 support against the US Dollar. EUR/USD broke many hurdles near 1.0880 to move into a bullish zone.
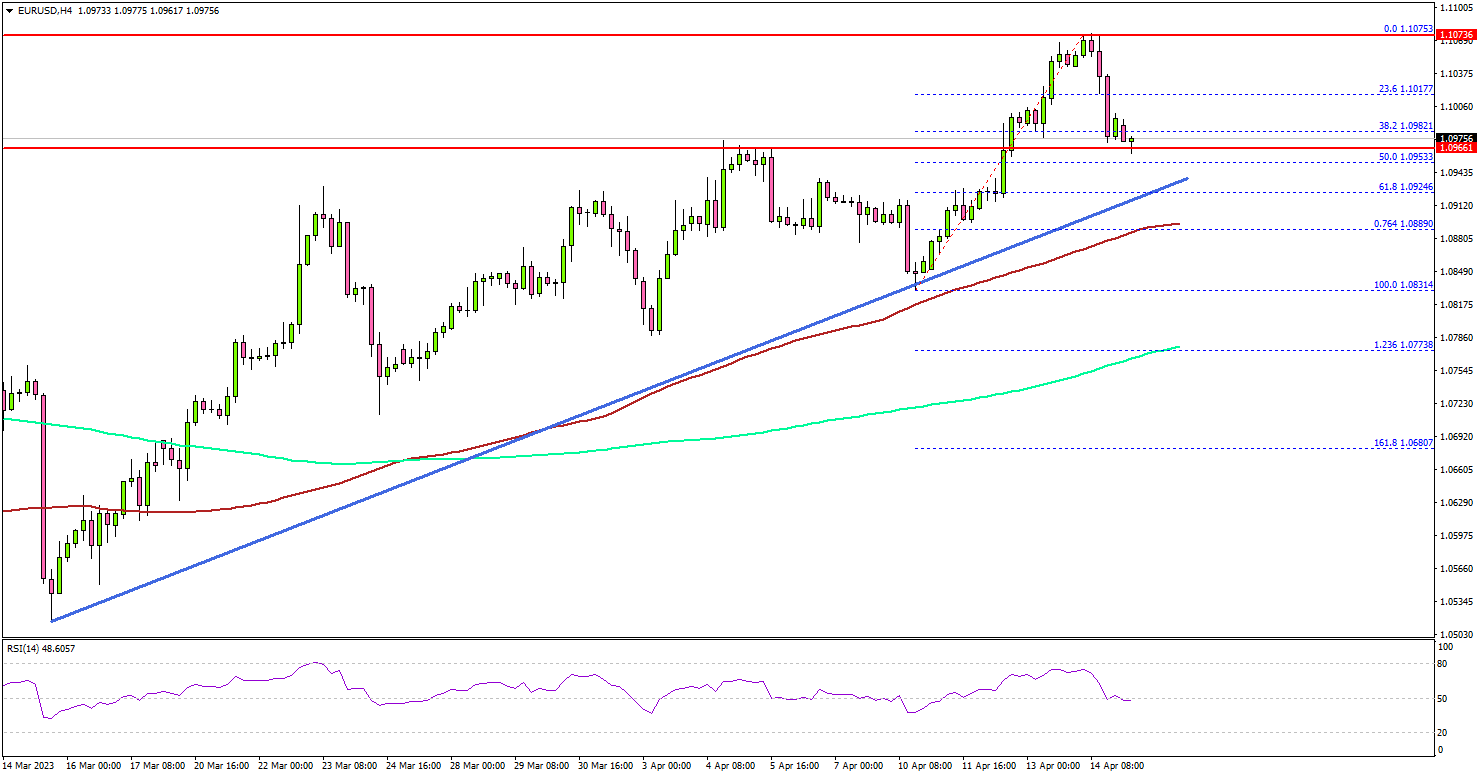
Looking at the 4-hour chart, the pair gained pace after it broke the 1.0920 resistance. The pair even settled above the 1.0950 level, the 200 simple moving average (green, 4 hours), and the 100 simple moving average (red, 4 hours).
It traded as high as 1.1075 before the bears appeared. Recently, there was a downside correction below the 1.1020 level. The pair dipped below the 38.2% Fib retracement level of the upward move from the 1.0831 swing low to the 1.1075 high.
The next major support is near the 1.0940 level. There is also a key bullish trend line forming with support near 1.0940 on the same chart.
The trend line is close to the 50% Fib retracement level of the upward move from the 1.0831 swing low to the 1.1075 high. A break below the trend line might push EUR/USD toward the 1.0890 level or the 100 simple moving average (red, 4 hours).
On the upside, the pair is facing resistance near the 1.1050 level. The next key resistance is near the 1.1075 zone. A clear move above the 1.1075 resistance might send the pair toward the 1.1150 zone. Any more gains might send the pair toward 1.1200.
Looking at GBP/USD, the pair climbed above the 1.2500 resistance zone before it faced sellers and started a short-term downside correction.
Economic Releases
- ECB's President Lagarde speech.