Sample Category Title
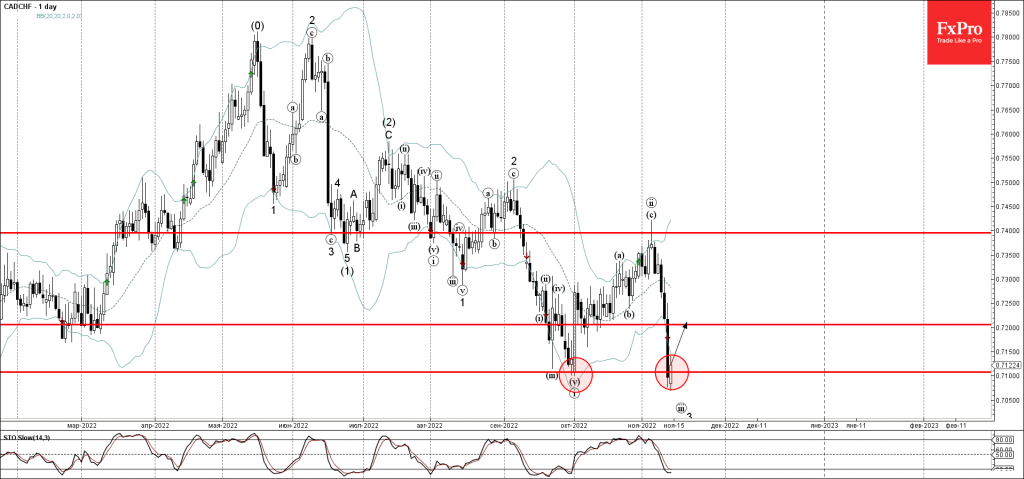
CADCHF Wave Analysis
- CADCHF reversed from support level 0.7100
- Likely to rise to resistance level 0.7200
CADCHF recently reversed up from the key support level 0.7100 (which stopped the sharp downtrend in September), standing near the lower daily Bollinger Band.
The upward reversal from the support level 0.7100 stopped the earlier short-term impulse wave 3.
Given the oversold reading on the daily Stochastic, CADCHF can be expected to rise further toward the next resistance level 0.7200.
CADJPY Wave Analysis
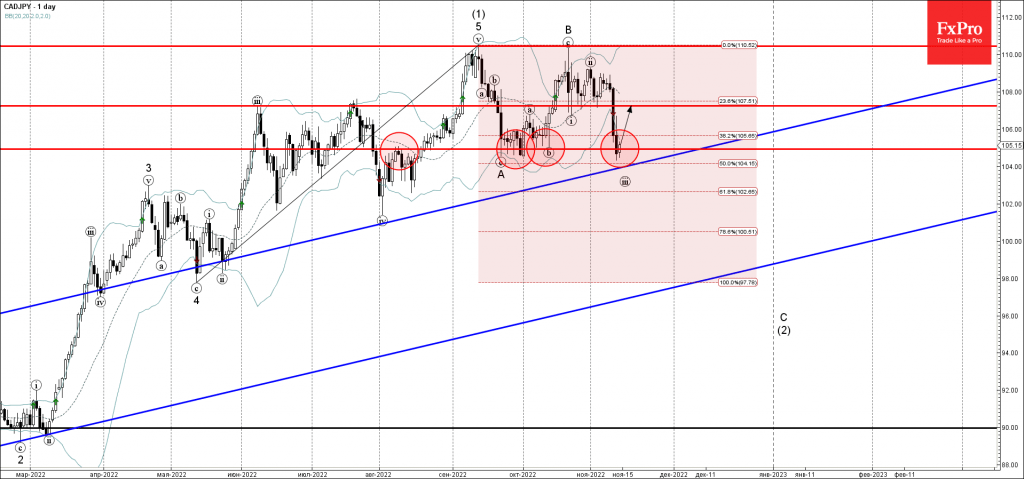
- CADJPY reversed from support level 104.90
- Likely to rise to resistance level 107.25
CADJPY reversed up from the key support level 104.90 (which has been reversing the price from August), 50% Fibonacci correction of the upward impulse form May, standing near the lower daily Bollinger Band.
The upward reversal from the support level 104.90 stopped the earlier short-term impulse wave (iii).
Given the clear daily uptrend, CADJPY can be expected to rise further toward the next resistance level 107.25 (former support from the end of October).
Is Dollar Growth Over? Likely So
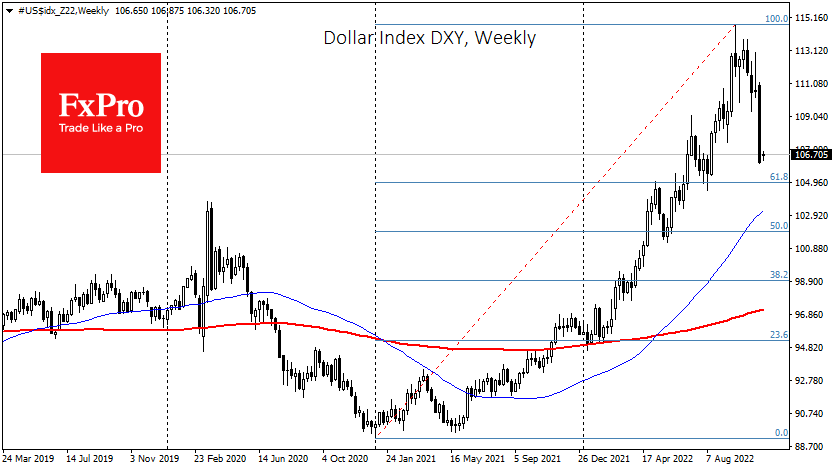
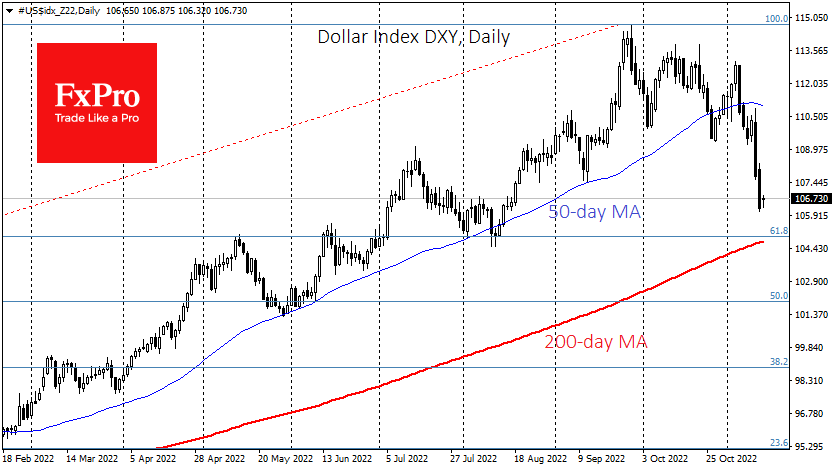
The dollar index lost 4% last week, the most significant drop since March 2020. Such powerful moves against the trend often signal a further trend reversal. However, it will probably be a slower pace of decline and not a one-way street as we see it over the previous ten days.
The pressure on the dollar has intensified over the past two weeks on speculation that the Fed will slow down the pace of policy tightening and that the maximum interest rate in this monetary cycle could be lower than previously feared. Signals from Fed members and slower-than-forecast inflation supported this view, triggering a wave of demand for risky assets.
At the same time, monetary regulators in other countries were in no hurry to soften their rhetoric, returning markets to a familiar situation where the Fed acts first and more aggressively than its peers in lowering and raising rates. But overall, it does not stand out for any rigidity.
The monetary watchdogs in the Eurozone have continued to signal in recent weeks that they are prepared to maintain the high speed of rate hikes, which fed their purchases in the Euro. That pressure could be fuelled by sales of dollar assets from the reserves of the SNB and the BoJ.
USDCHF and USDJPY returned under the emotionally significant levels of 1.0 and 150, attracting market-oriented and trend-following participants’ interest.
The nearest target for the Dollar Index correction is 105, actively operating as a resistance and support between May and August. This is also where the 61.8% Fibonacci retracement level of 2021-2022 comes in.
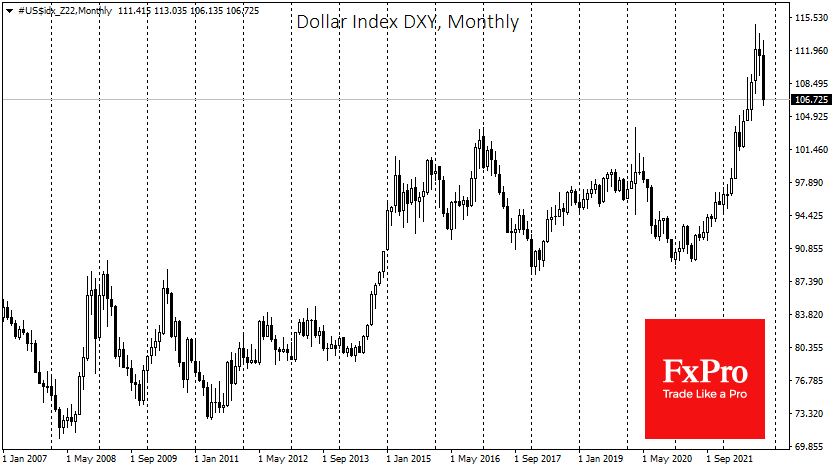
A decisive failure below would confirm that we see the Dollar moving into a decline and not just a correction in a long-term uptrend. In this scenario, the Dollar Index heads into the 90-100 area, where it has been comfortable since 2015, with a potential pullback to the upper bound of this range in the first quarter of 2023.
History has other examples. In late 2008, two weeks of a significant sell-off in the dollar were followed by three months of gains, and the DXY rewrote local highs, finally reversing only in March 2009. However, it is essential to remember that in both March 2020 and March 2009, the EUR reversal was sustained when supported by the equity market surge we also witnessed last week.
AUDUSD: The Market May Collapse to the Previous Low
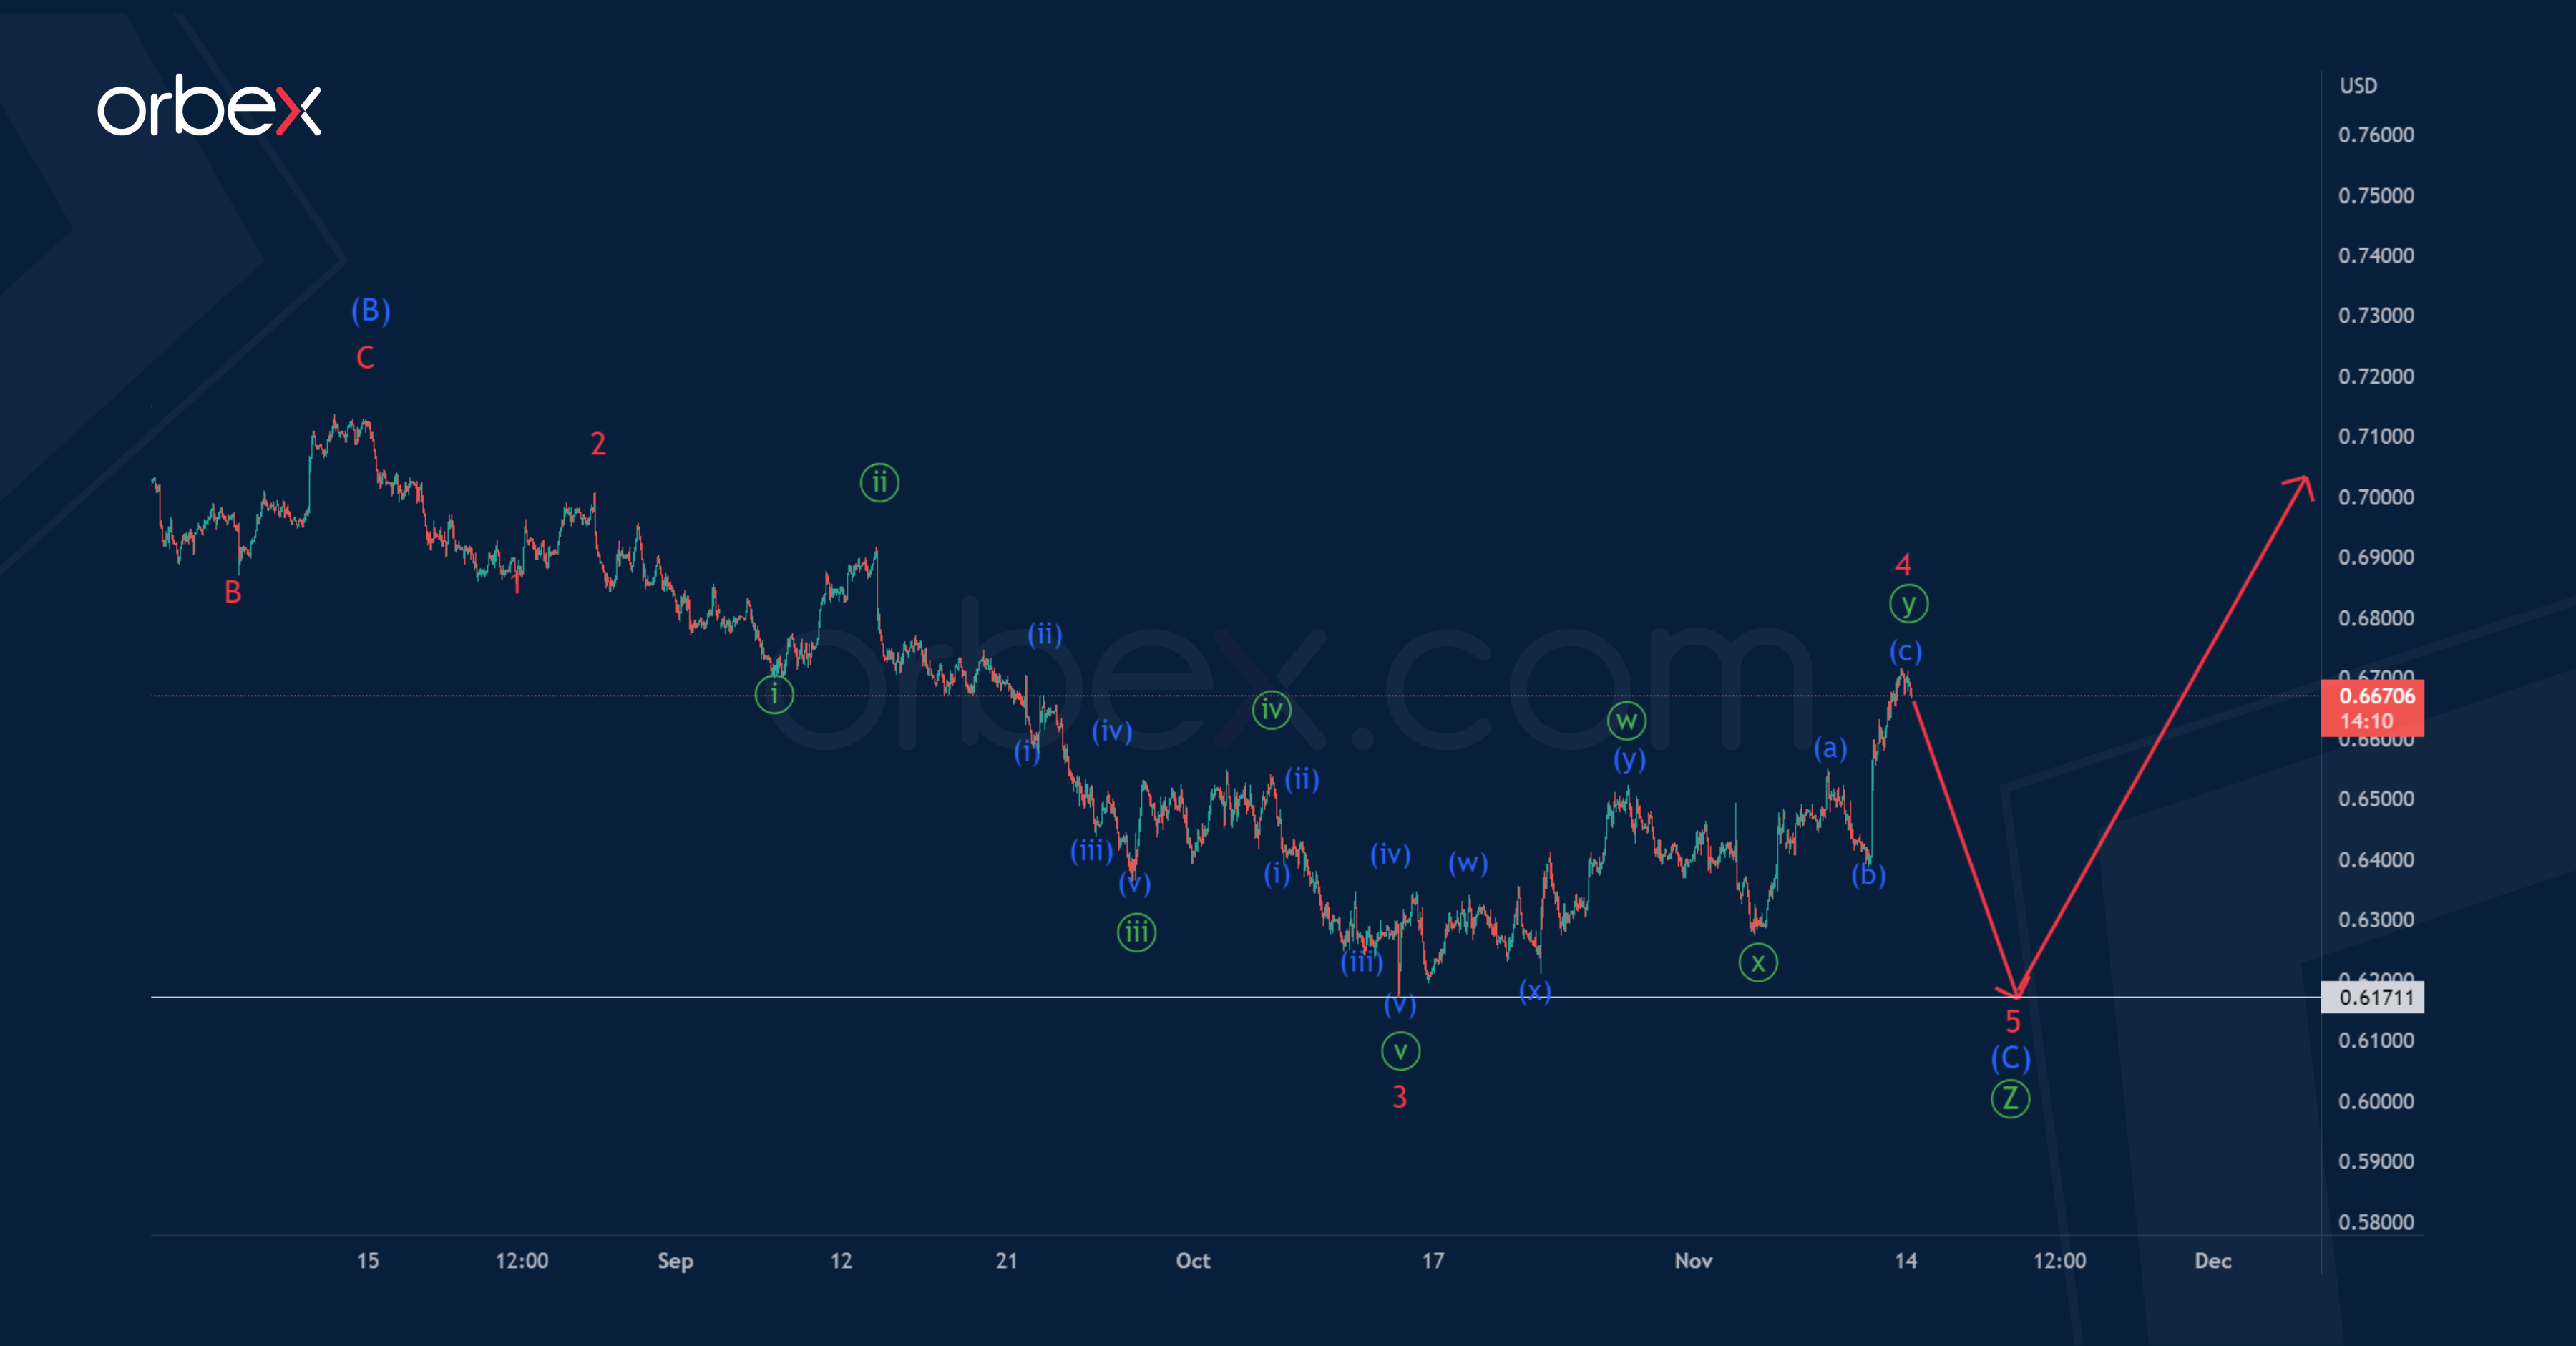
In the long term, AUDUSD seems to be forming a bearish triple zigzag Ⓦ-Ⓧ-Ⓨ-Ⓧ-Ⓩ, where the primary wave Ⓩ is a simple zigzag (A)-(B)-(C). The intermediate wave (B) of this zigzag took the form of a simple bullish zigzag A-B-C.
At the moment, an impulse wave (C) is being formed, which consists of minor sub-waves 1-2-3-4-5. Minor wave 3 consists of five minute sub-waves.
Most likely, the minor correction wave 4 was completed not so long ago, so the market may continue to move down in the impulse wave 5.
The currency is expected to decline to the previous low of 0.617, marked by impulse 3.
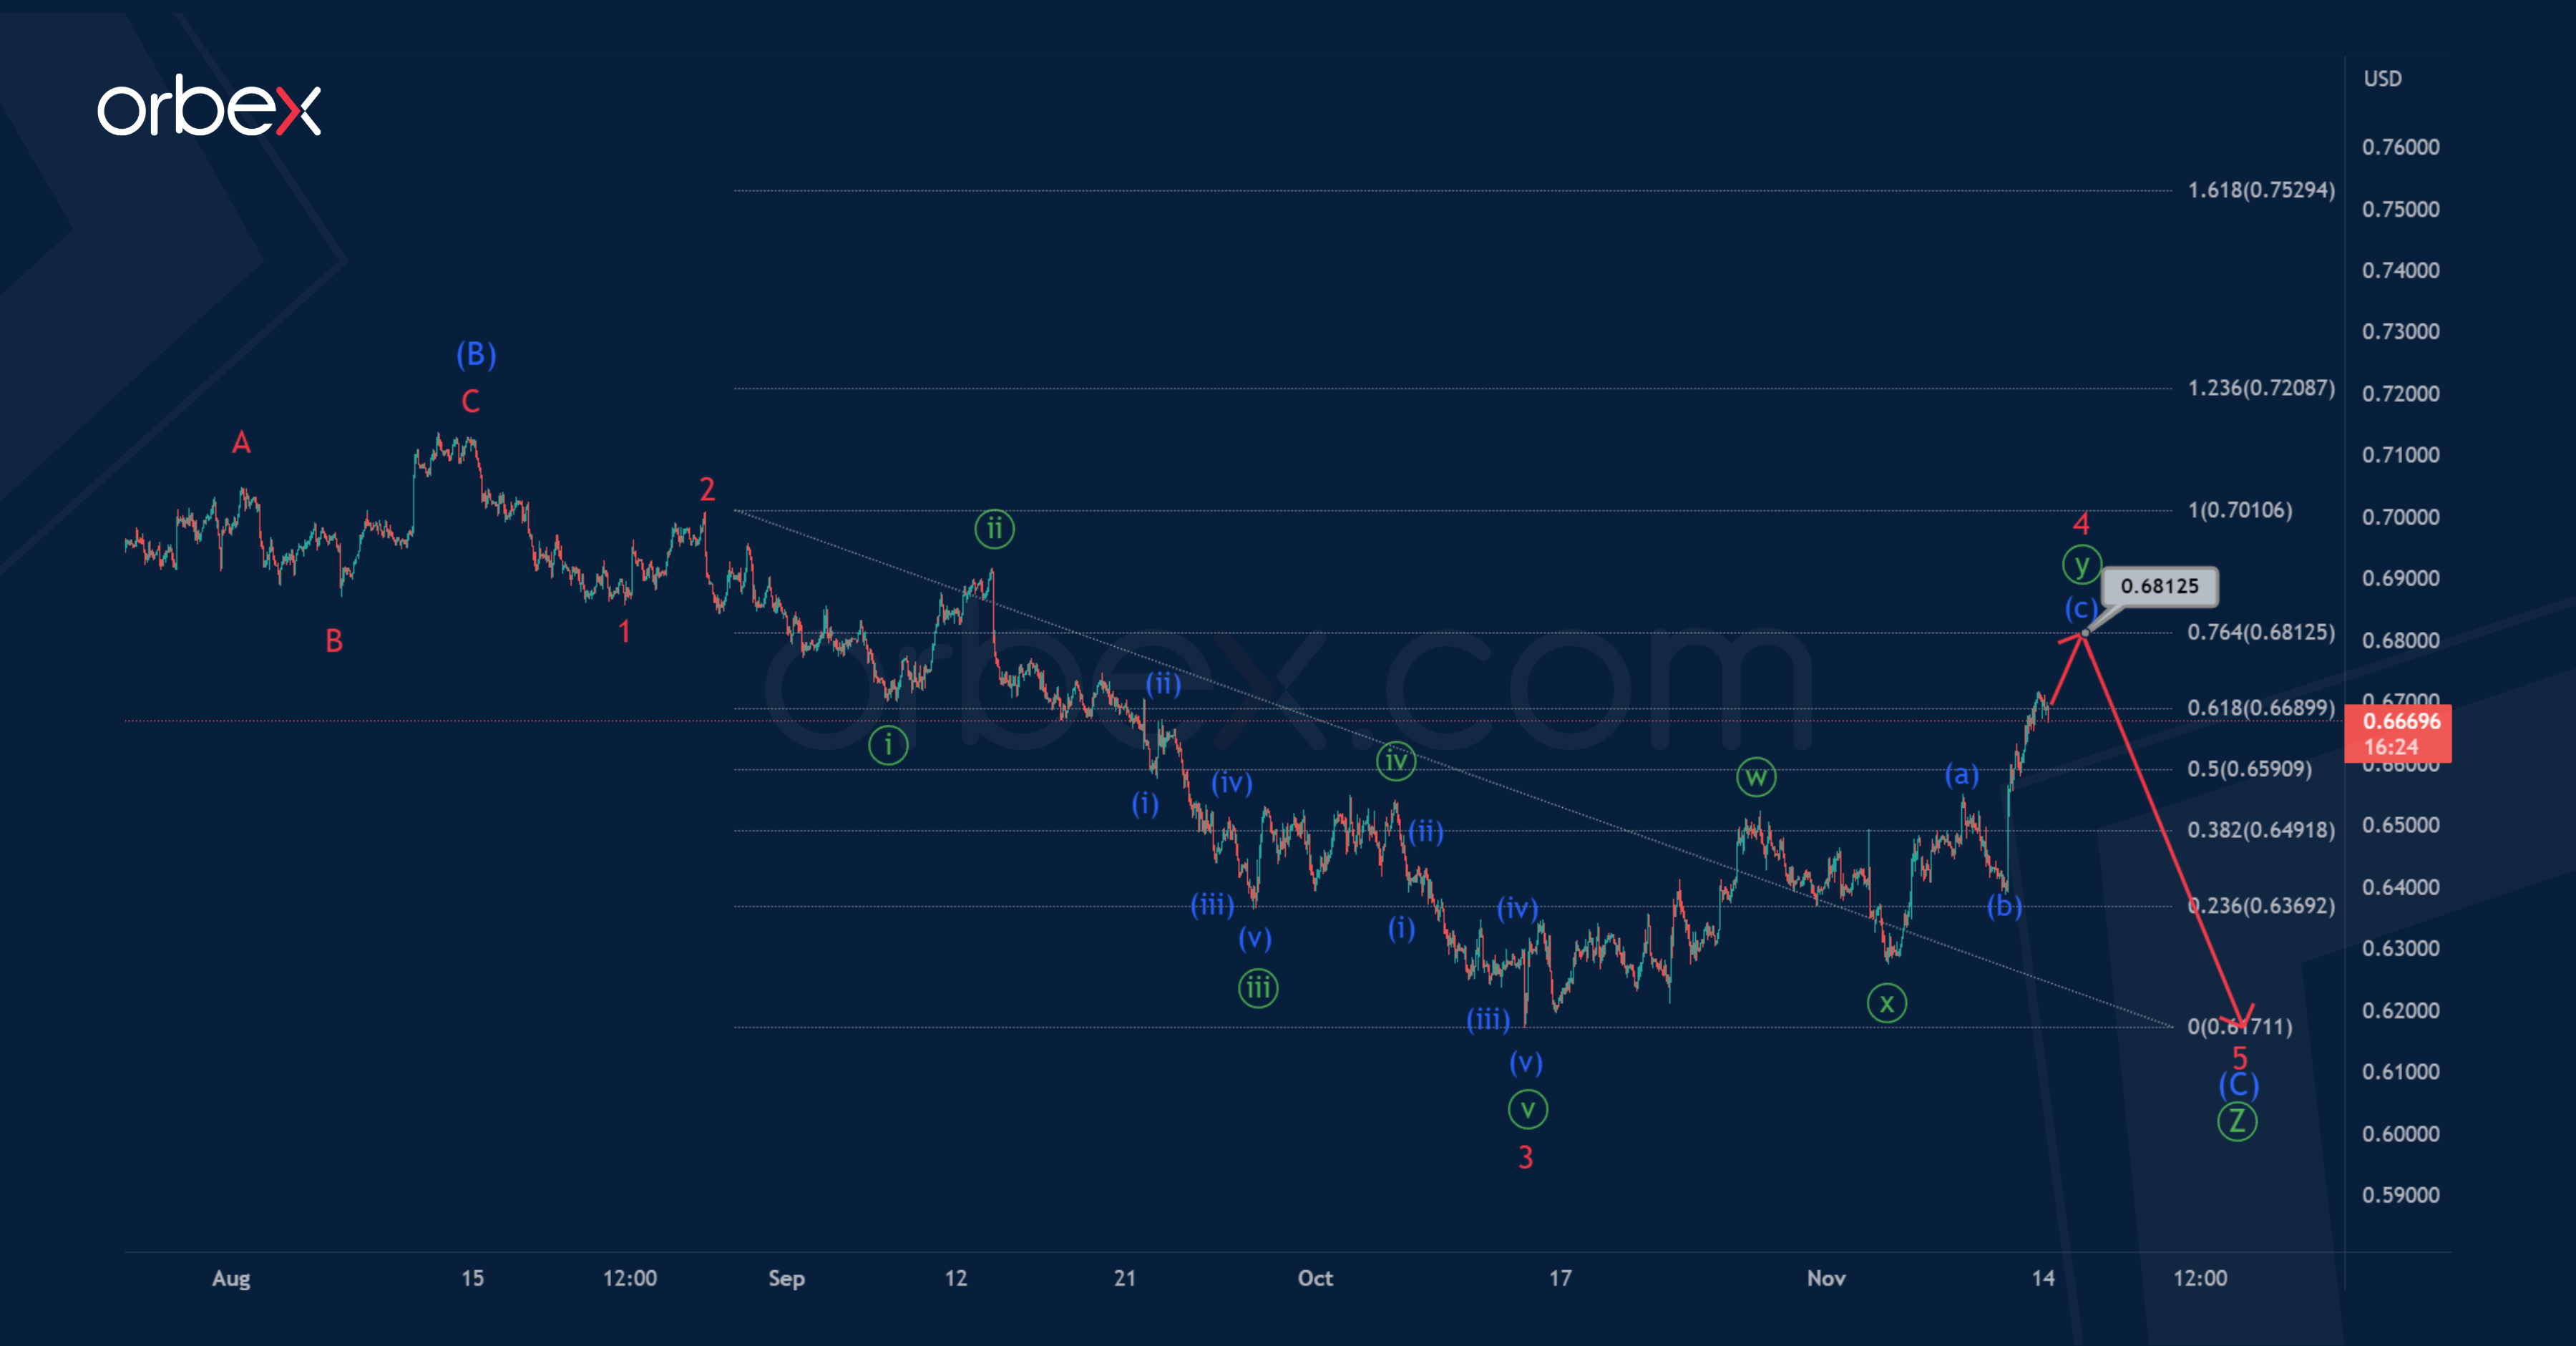
An alternative scenario shows that the correction wave 4, which is currently being formed, has not yet been fully completed. This wave may take the form of a longer one than in the main version.
Bulls could build only two parts of correction 4, that is, we could see fully formed sub-waves ⓦ-ⓧ, the sub-wave ⓨ is still being built, but is already close to its completion.
In the near future, the market may grow to 0.681. At that level, corrective wave 4 will be at 76.4% along the Fibonacci lines of previous bearish impulse 3. Then, after the full completion of wave 4, we can expect a decline in the minor wave 5.
USD/JPY Claws Back
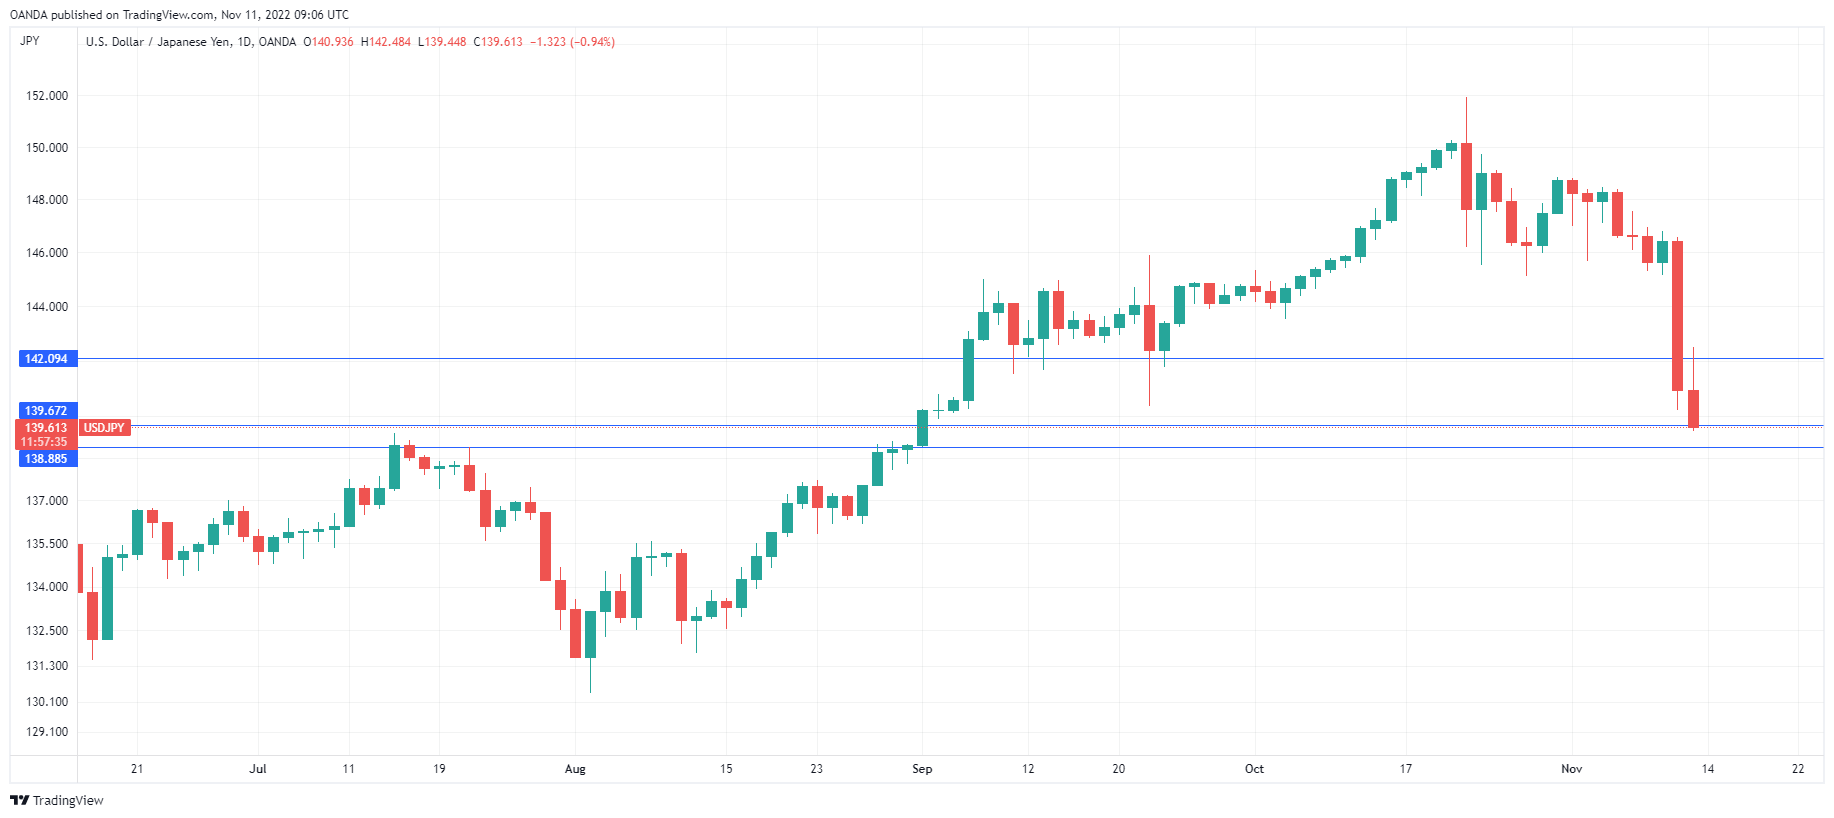
After a huge rally last week, the Japanese yen has reversed directions today. USD/JPY is trading at 140.21, up 0.99%. On the economic calendar, Japan releases GDP for the third quarter. There are no economic events in the US today.
A week to remember
The US dollar dropped like a stone last week, courtesy of a soft inflation report that saw both the headline and core readings fall in October. Both readings were lower than expected, and investors pounced on the news, as stock markets soared and the US dollar took a tumble. The yen made the most of the dollar’s misery, as USD/JPY slumped by a massive 5.3% last week and dropped to a 10-week low. The market reaction to the inflation data looks a bit extreme, and this explains the dollar’s comeback today.
The soft inflation report has raised expectations that the Fed will put the brakes on its tightening, after pushing full speed ahead with four straight jumbo hikes of 0.75%. Fed policy makers aren’t bandying around the magical word “peak” to describe inflation just yet, but we are now seeing a change in terminology, such as “gradual” and “measured”. What is interesting is that the markets have gone giddy over a drop in inflation but appear to be ignoring the Fed’s warning that rates could end up higher for longer than expected. I don’t detect any signs of the Fed going dovish, but the markets are expecting a pivot, as there is already talk in the markets of the Fed cutting rates in H2 of 2023.
The dollar is dusting itself off after last week’s disaster, and the yen may have trouble holding onto last week’s impressive gains. The Fed will almost certainly raise rates in December by at least 0.50%, and with the Bank of Japan maintaining a cap on JGB yields, the US/Japan rate differential will continue to widen. That spells trouble for the yen, which has lost about 20% against the dollar this year.
USD/JPY Technical
- USD/JPY is testing resistance at 139.91 and 141.61
- There is support at 137.34 and 135.90
US Dollar Index: Bears Pausing after Strong Acceleration, But Expected to Keep Control
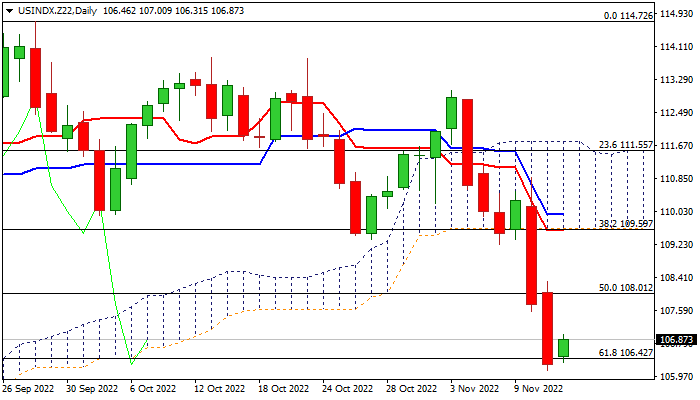
The dollar index edges higher in Asian / early European trading on Monday, after the greenback lost ground and fell over 4% last week, on growing expectations that cooler inflation would prompt Fed to ease its aggressive stance in policy tightening.
Comments from one of Fed’s policymakers over the weekend that the central bank was not softening its fight against inflation and that slightly lower inflation in past two months was insufficient to trigger stronger reaction from the Fed, but more easing is required to signal that inflation have peaked.
The dollar’s latest drop may continue to boost inflation by offsetting the effect of recent strong rate hikes, while inflation has registered only a marginal easing, implying that interest rates may have to remain elevated for extended period to bring inflation under control and that terminal interest rate would be higher than initially estimated.
Today’s bounce could be seen as reaction on oversold daily studies and a profit-taking after a massive fall last week, but overall near-term structure is expected to remain bearish while corrective action stays below the base of thick daily cloud (109.58), reinforced by daily Tenkan-sen and 50% retracement of 113.02/106.12 bear-leg.
Such scenario would offer better selling opportunities for further drop of dollar and extension through cracked Fibo 61.8% of 104.46/114.72 (106.42) towards 104.46 (Fibo 76.4%).
Conversely, penetration of daily cloud and further rise, would signal that bears gave up and the greenback regained traction after deeper correction, but scenario would require confirmation on rise above cloud top (111.76).
Res: 107.57; 108.01; 108.30; 109.22.
Sup: 106.42; 106.12; 105.42; 104.46.
Euro Sky-Rocketed to Four Months Highs
The euro is supported by the market interest to risk and strong confidence that the US Federal Reserve System on its December meeting will take a pause and increase the interest rate by fewer base points than before. For now, expectations concerning the rate and the speed of the tightening of the US monetary policy are the crucial factors.
As for the drivers for the euro itself, they are ridiculously few. The economy of the Euro zone is expected to have grown by 3.2% in 2022. Yet in 2023 it is forecast to slow down by 0.4%.
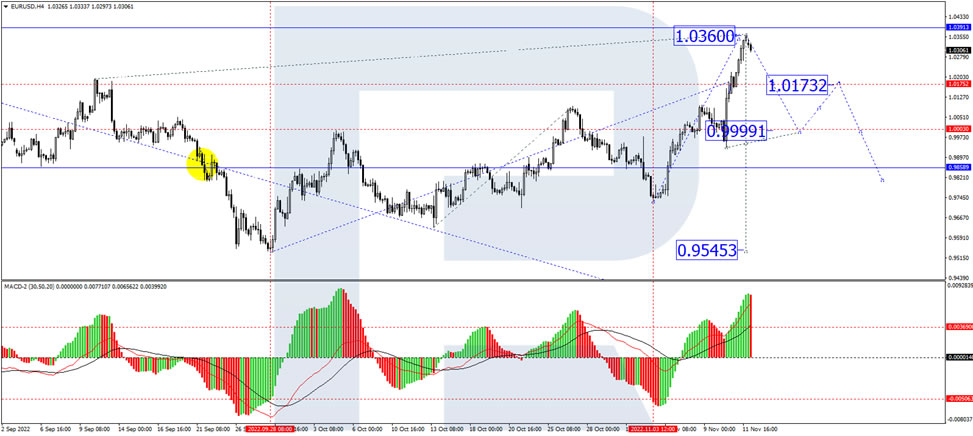
On H4, EUR/USD has completed a wave of growth to 1.0360. Today the market is forming a consolidation range under this level. With an escape downwards, a wave of decline to 1.0173 is expected to start. After this level is reached, a link of growth to 1.0250 is expected to start, followed by a decline to 1.0000. Technically, this scenario is confirmed by the MACD: its signal line is at the highs, preparing to begin a decline to zero.
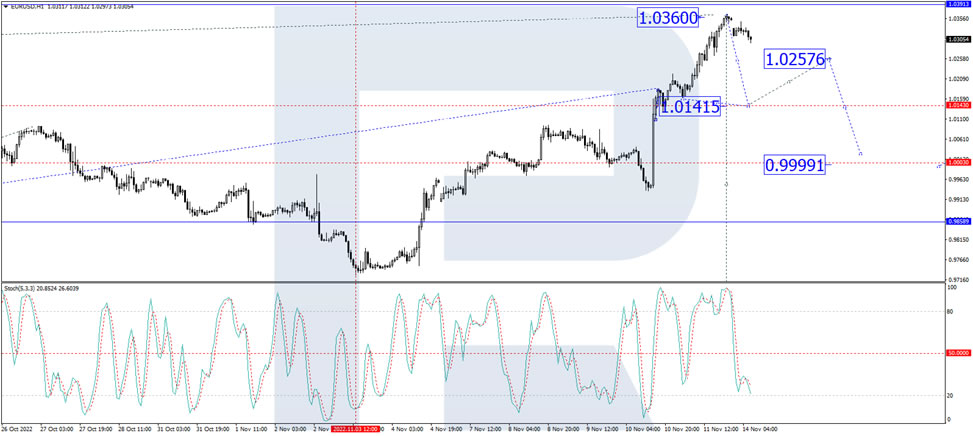
On H1, the pair has completed a wave of growth to 1.0360. At the moment, it is forming a consolidation range beneath it. An escaped downwards to 1.0255 is 3xpected. After this level is reached, a link of growth to 1.0320 is not excluded, followed by a decline to 1.0141, from where the wave may continue to 1.0000. Technically, the scenario is confirmed by the Stochastic oscillator. Its signal line is near 20, preparing to grow to 50. A bounce off it downwards and a return to 20 are expected.
ECB Panetta: Aggressive tightening is not advisable now
ECB Executive Board member Fabio Panetta said in a speech, "after the progress we have already done in adjusting our policy stance, an aggressive tightening is not advisable, for two main reasons."
First, "current macroeconomic policies should be designed to avoid unnecessarily heightening the risk that the increasingly likely contraction in coming months becomes a severe and protracted one, which would scar the economy... it also requires that monetary policy does not ignore the risks of overtightening," he said".
Second, "even in the face of lasting consequences of supply shocks on potential output, the implications for the output gap, inflation dynamics and optimal policy calibration can only be derived over time. And this reinforces the case that, for as long as inflation expectations remain anchored, monetary policy should adjust but not overreact".
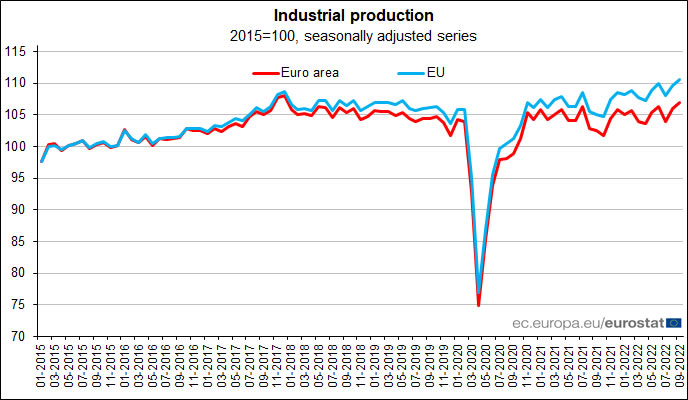
Eurozone industrial production rose 0.9% mom, EU up 0.9% mom
Eurozone industrial production rose 0.9% mom in September, well above expectation of 0.1% mom. Production of non-durable consumer goods rose by 3.6% and capital goods by 1.5%, while production of intermediate goods as well as durable consumer goods fell by -0.9% and energy by -1.1%.
EU industrial production also rose 0.9% mom. Among Member States for which data are available, the highest monthly increases were registered in Ireland (+11.9%), Belgium (+7.1%) as well as in Hungary and the Netherlands (both +1.6%). The largest decreases were observed in Lithuania (-8.2%), Greece (-4.5%) and Estonia (-3.6%).
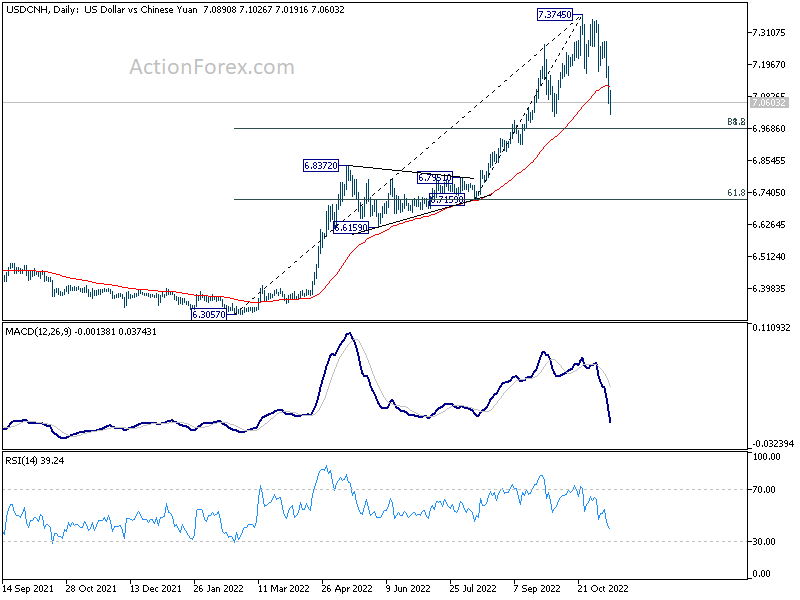
USD/CNH falling towards 7.000, but shouldn’t break there for long
Chinese Yuan surges today and hits the highest level against Dollar since early October. The rally was fueled by growing optimism that China is going to relax is strict zero-COVID policy, even as outbreaks worsen with highest infections in six months. At the same time, of course, decline in USD/CNH happened with global selloff in Dollar, after last week's lower than expected CPI data solidified the case for Fed to start to slow its tightening pace in December.
Technically speaking, there is room for more pull back in USD/CNH, towards 7.000 psychological level. However, there's an important cluster support, with 61.8% retracement of 6.7159 to 7.3475 at 6.9675 and 38.2% retracement of 6.3057 to 7.3745 at 6.9662 just nearby. Downside should be contained by this 6.9662/75 support zone to bring rebound, unless there are some fundamental changes, in China, or the US, or their diplomatic relations, or any combinations of these factors.