

Sample Category Title
GBPUSD: Consolidation Likely to Precede Push Towards 1.20 Target
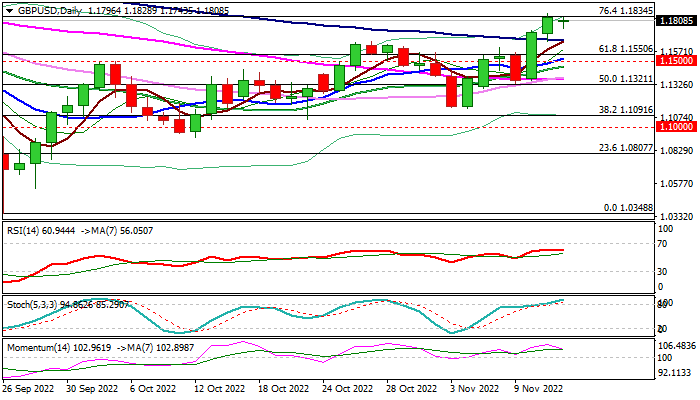
Cable is consolidating under new multi-week high (1.1854) reinforced by cracked Fibo 76.4% of 1.2293/1.0348 (1.1834), where last week’s strong rally faced headwinds.
Bulls remain firmly in play despite overextended daily studies, boosted by weekly bullish engulfing pattern, pressuring 1.1834 Fibo pivot, break of which would open way for attack at psychological 1.20 barrier.
Converged 5/100DMA’s are about to form bull-cross (1.1655) and offer good support which should protect the downside and keep focus at the upside.
Only loss of pivotal 1.1550/1500 support zone (broken Fibo 61.8% / 10DMA / psychological) would harm bulls and signal deeper pullback.
Res: 1.1854; 1.1900; 1.2000; 1.2048.
Sup: 1.1743; 1.1655; 1.1645; 1.1550.
AUD/USD Pair Moved into a Bullish Zone above 0.6550
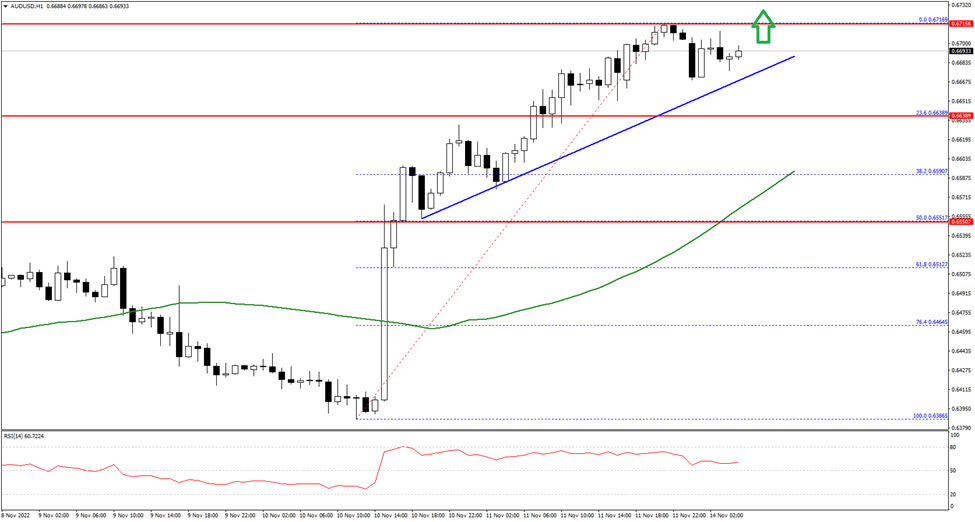
The Aussie Dollar started a decent increase from the 0.6400 zone against the US Dollar. The AUD/USD pair climbed above the 0.6550 level to move into a bullish zone.
There was a clear move above the 0.6660 level and the 50 hourly simple moving average. The pair even spiked above the 0.6700 level and is currently consolidating gains. An immediate resistance on the upside is near the 0.6715 level and the recent high.
If there is an upside break above the 0.6715 zone, the pair could rise steadily towards the 0.6750 level in the near term. The main resistance now sits near the 0.6800 level.
An immediate support is near the 0.6680 level a connecting bullish trend line on the hourly chart. The next key support is near 0.6640 on FXOpen. A downside break below the 0.6640 support could lead the pair towards the 0.6590 support.
EURUSD: Bulls Taking a Breather after Biggest Weekly Rally Since March 2020
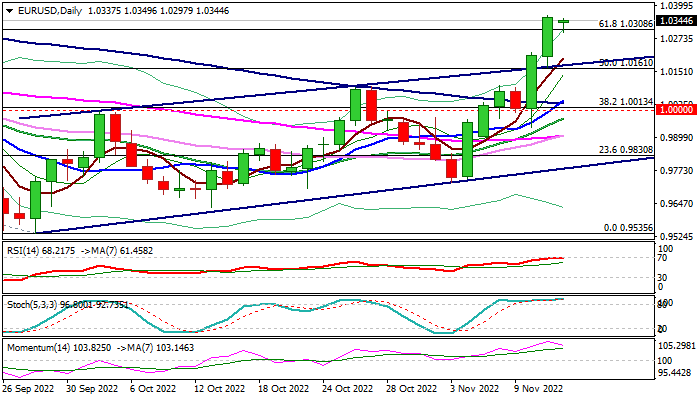
Bulls are taking a breather in early Monday’s trading following strong rally last week (up 4.5% for the week, the biggest weekly gains since mid-March 2020).
Last week’s acceleration of the recovery from new 20-year low (0.9535) was mainly driven by weaker dollar on growing signs that the Fed may ease its aggressive approach to policy tightening after US inflation further dropped in October.
Bulls registered weekly close above 1.0308 (Fibo 61.8% of 1.0786/0.9535) but faced strong headwinds on approach to Aug high (1.0368).
Partial profit-taking on overbought daily studies may keep bulls on hold for consolidation, with additional pressure seen from 100/200DMA’s bear-cross.
Broken trendline which marks the upper boundary of bull-channel reverted to solid support (1.0177) which should ideally contain dips and offer better buying opportunities for fresh push higher.
Bulls need clear break through Aug peak (1.0368) to generate fresh signal for extension towards falling 200DMA (1.0433) and Fibo 76.4% of 1.0786/0.9535 (1.0491).
Caution on break below trendline support which would risk deeper pullback and put bulls on hold, with loss of parity zone to weaken near-term structure and signal top.
However, early downside rejection would signal that bulls remain firmly in play for further advance after a brief pause.
Res: 1.0368; 1.0400; 1.0433; 1.0491.
Sup: 1.0300; 1.0197; 1.0177; 1.0138.
A Choppy Start
It's been quite a choppy start to the trading week, with much of the focus on China where Covid relaxation measures and property market support have brought some relief.
Unfortunately, both come at a time of record Covid infections in major cities including Beijing and Guangzhou. And those relaxation measures that were announced are not ambitious enough to make any difference in those cities seeing rising cases which means activity is going to weaken.
There is hope that China could further relax its zero-Covid policy next spring but for now, mass testing, heavy restrictions, and lockdowns are here to stay, despite growing opposition and fatigue. Those hoping that this initial relaxation phase would be more substantial were always setting themselves up for disappointment.
Property stocks in China and Hong Kong were given a big lift at the start of the week as Beijing unveiled its 16-point plan to support the industry. Having almost brought the industry to its knees as part of its reform efforts, Beijing is attempting to build it back up but as it's already finding, the former is much easier to do than the latter.
Confidence is shattered and it will take time, effort, and patience to restore it. Now it's a question of how much these measures will undermine Beijing's initial reform measures and whether they'll even succeed in reinvigorating the industry. Efforts until now have been like pushing on a piece of string.
Oil is steady but upside risks remain
The prospect of looser restrictions has boosted the price of oil recently and yet Brent still finds itself trading around the middle of its $90-$100 range. The US inflation data last week gave crude another boost as traders were left to dream again about a possible soft landing if the data continues that way and the Fed raises rates less.
There's still a long way to go though and much of the world won't be so lucky, assuming it isn't already too late for the US. But further signs of inflation peaking will no doubt be welcome, you just wonder whether it will also be the catalyst for oil to break $100 again, further complicating the growth outlook once more.
Gold's spectacular rebound
It's been a fantastic 10 days for gold, with the yellow metal going from at risk of breaking below $1,620 support to rallying almost 10% to its highest level in almost three months. It's been quite the ride, fueled by signals from the central bank that the next hike could be less aggressive and then that inflation report.
Can gold hold onto this momentum and break $1,800, taking it into territory that it hasn't traded within since late-Spring, early-summer? It's a big ask but if the data is generous and the dollar continues to give back some of its enormous gains from the past year, there's every chance gold could build momentum from here.
Bad timing
Bitcoin waited patiently for this moment, forming a base around $20,000 in anticipation of inflation falling and the Fed narrative becoming much less hawkish. Unfortunately, that moment coincided with the spectacular collapse of FTX which has sent shockwaves through the industry and hammered crypto prices. Rather than taking off, bitcoin has plummeted to levels not seen in two years and further pain may lie ahead. There's now enormous uncertainty in the space which could hold it back in the near term and weigh on prices.
S&P 500 Tests Resistance
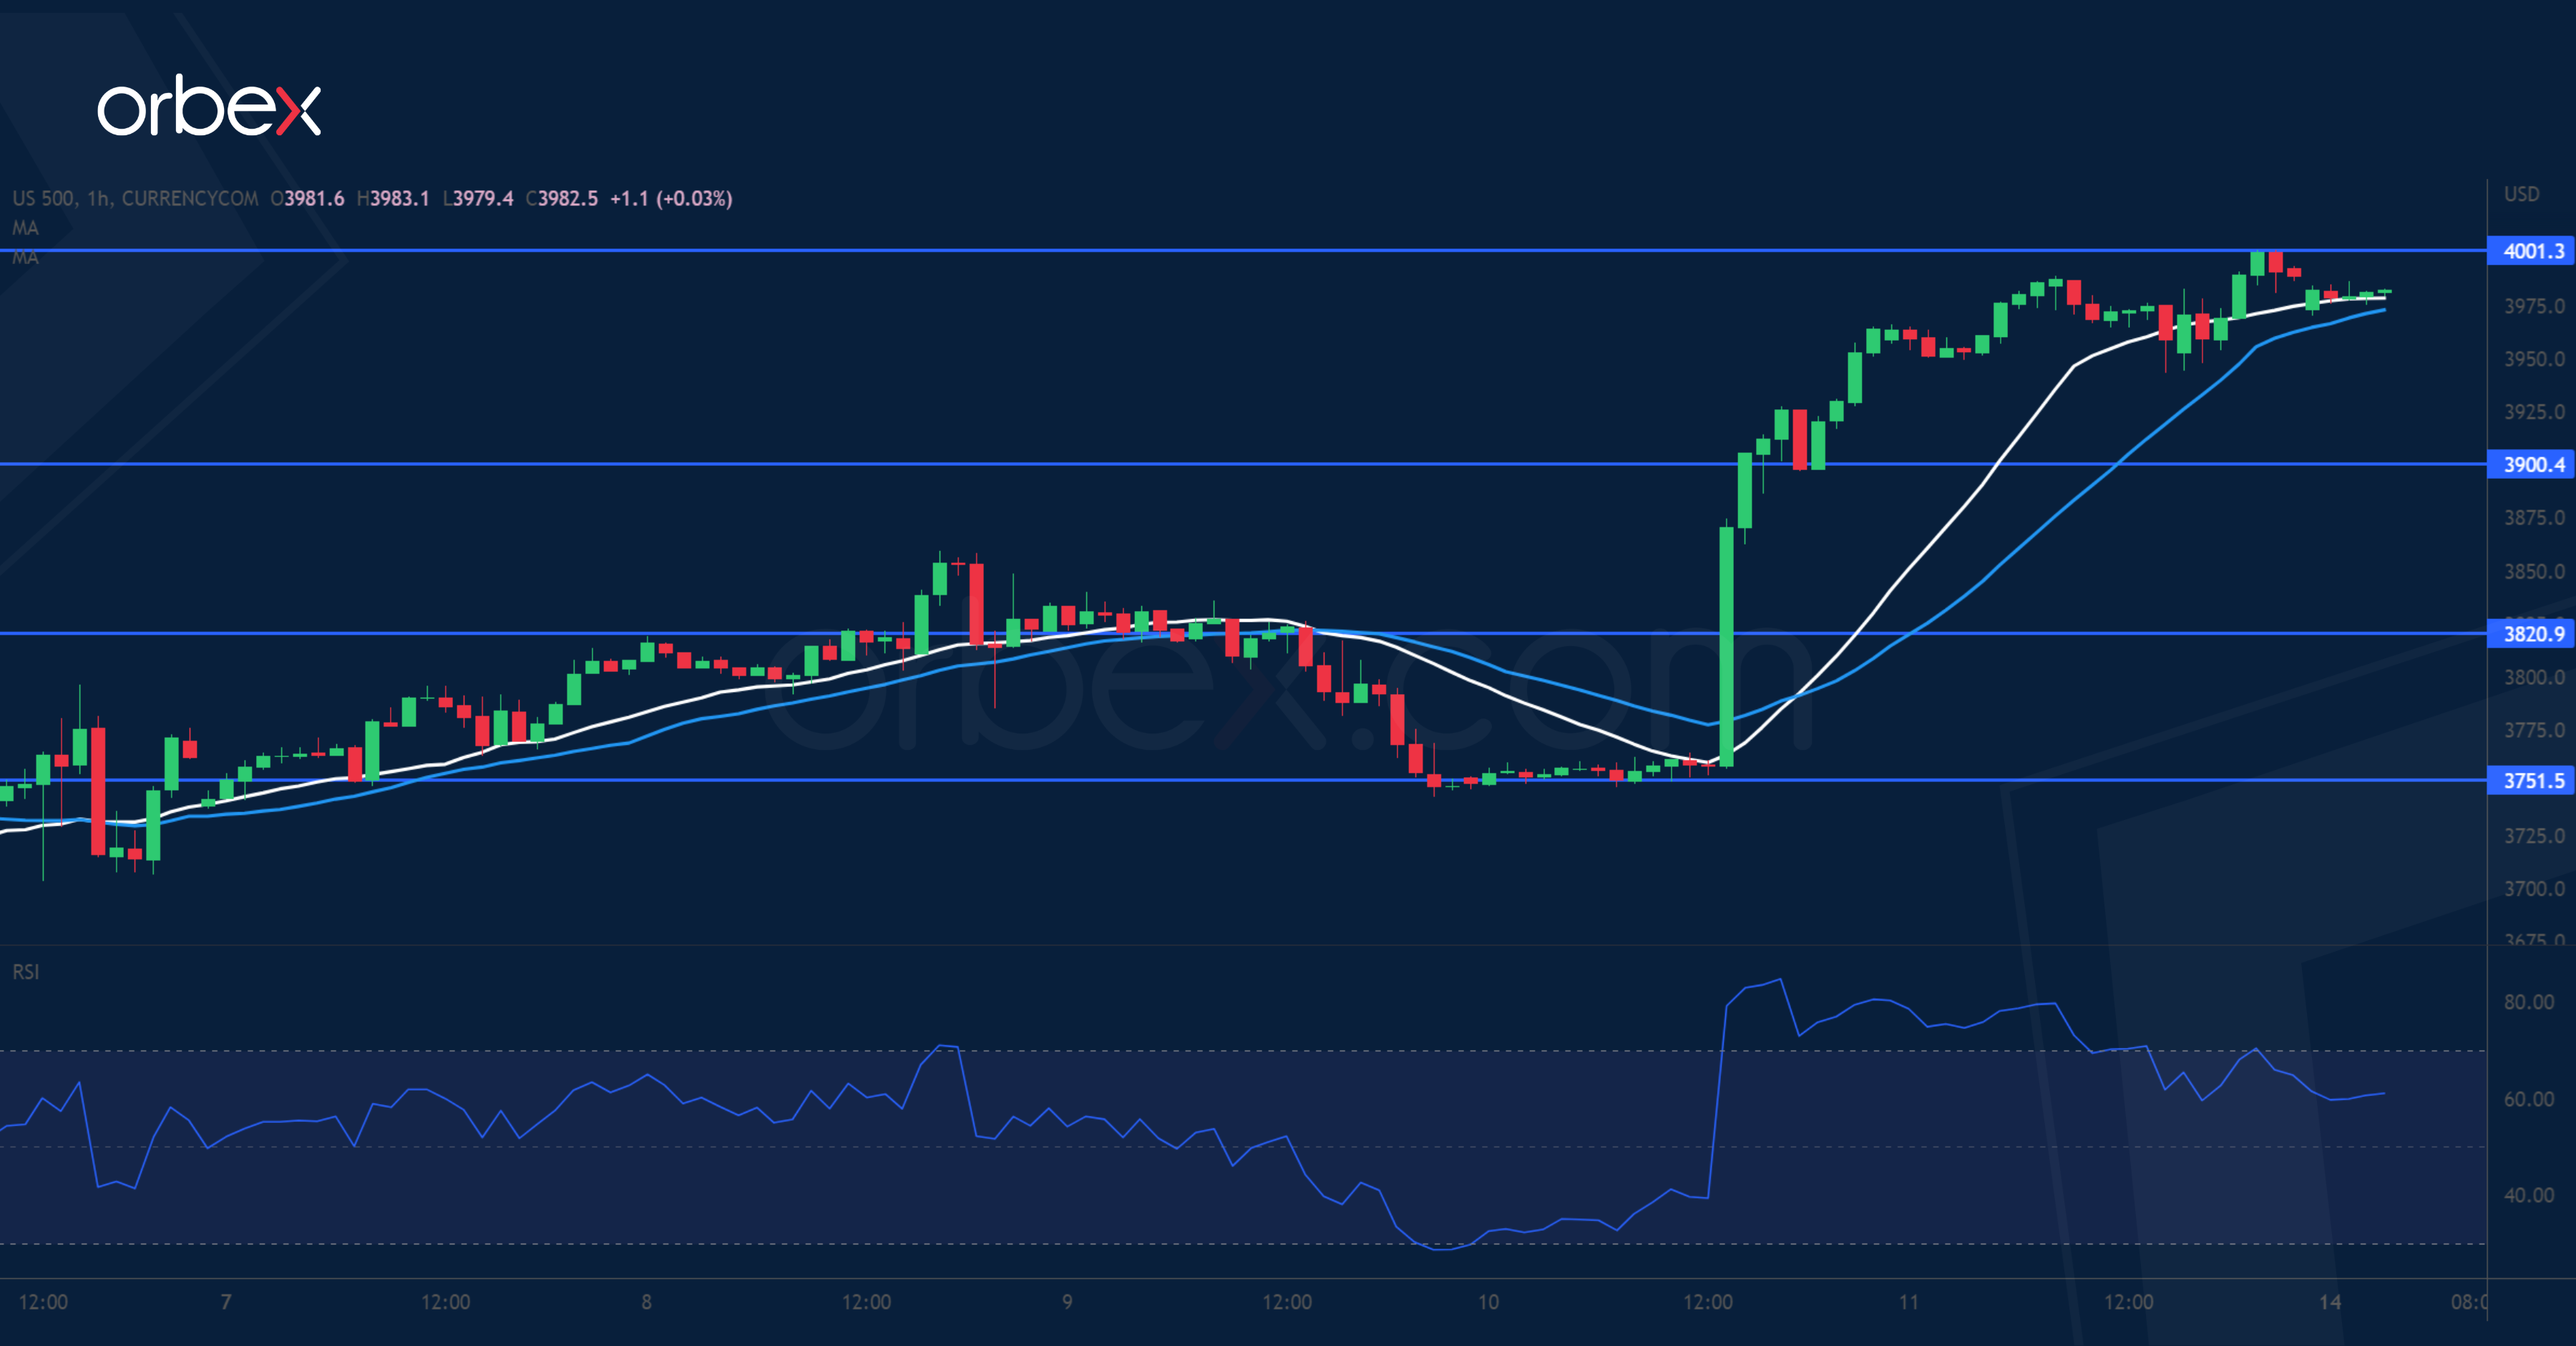
The S&P 500 flies high fuelled by the Fed pivot optimism. The vertical rise above 3900 confirms the bullish MA cross on the daily chart, suggesting an acceleration to the upside. The index is testing the psychological level of 4000, which is also a former support from a mid-September sell-off. A breakout would put the September peak of 4150 within reach. The RSI shows an overextension and may prompt intraday buyers to take profit in the supply zone. The resistance-turn-support at 3900 would be the first level to monitor.
EURGBP Meets Support
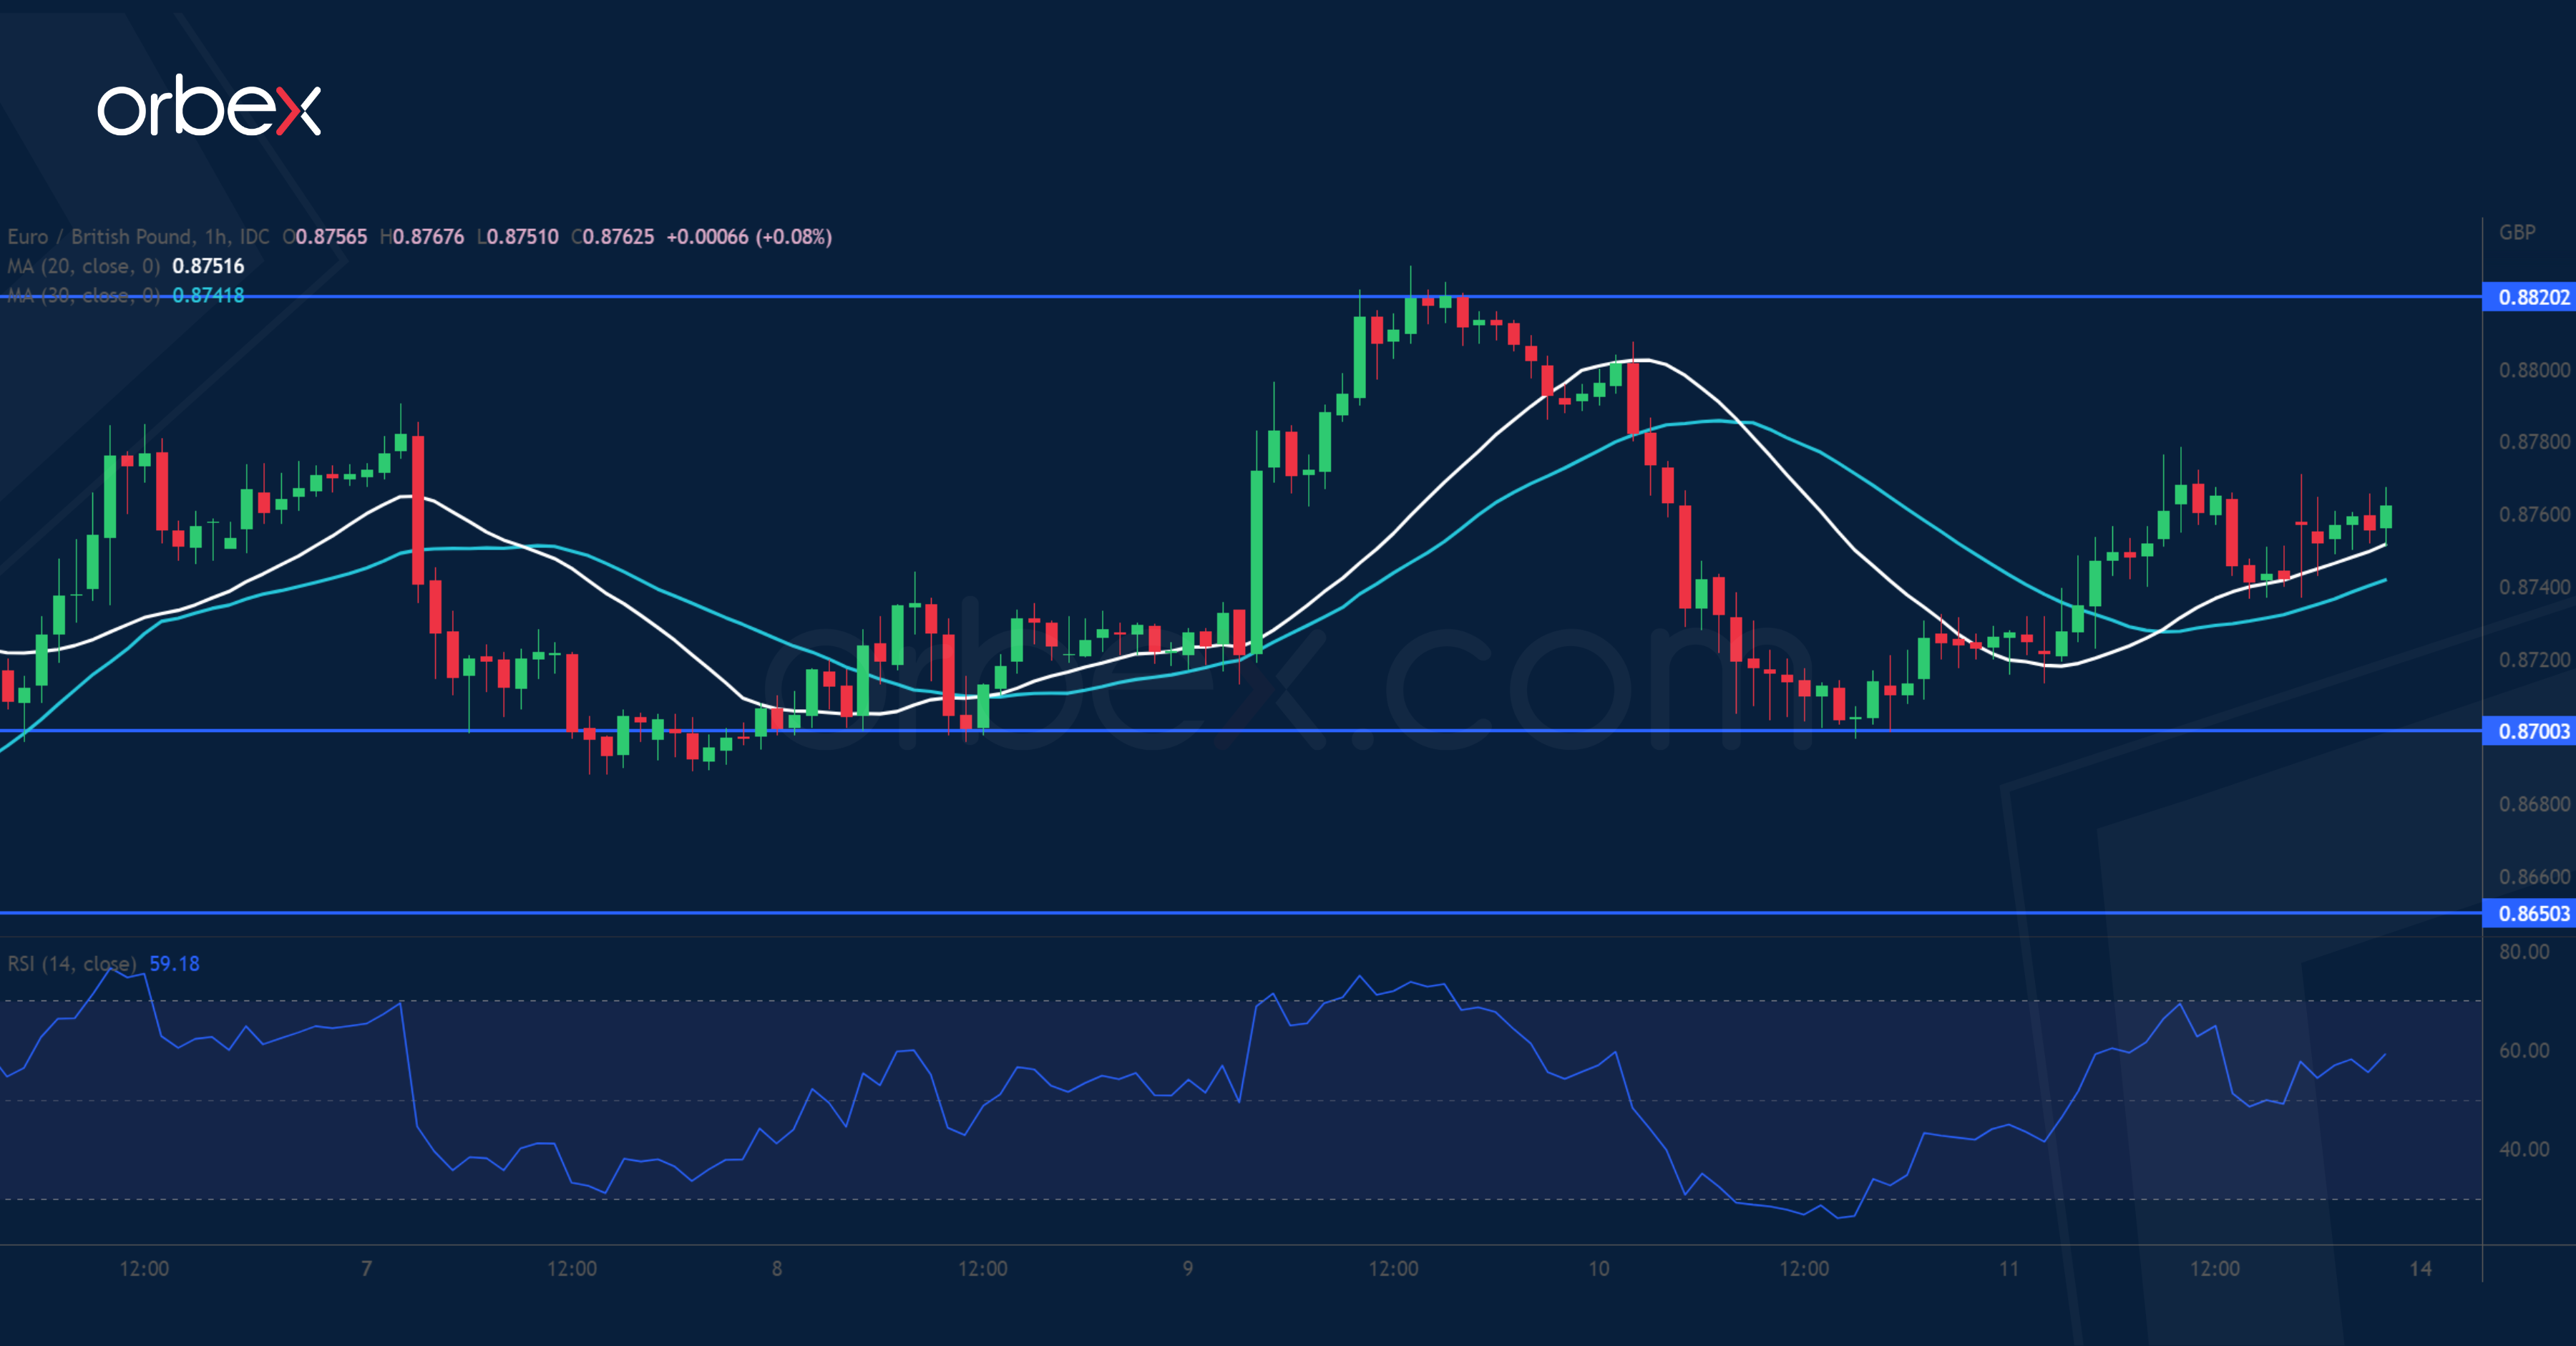
The pound found support from upbeat GDP in Q3. The pair has been looking to hold onto its recent gains above 0.8780, which is a prerequisite before a sustained recovery could materialise. The latest retracement came to a rest over the previous low at 0.8700, a sign of robust interest in keeping the single currency’s edge. A close above 0.8820 could attract momentum and trigger a runaway rally above 0.8900, confirming a bullish reversal in the process. On the downside, 0.8650 is a second line of defence in case of hesitation.
USDCHF Probes August’s Low
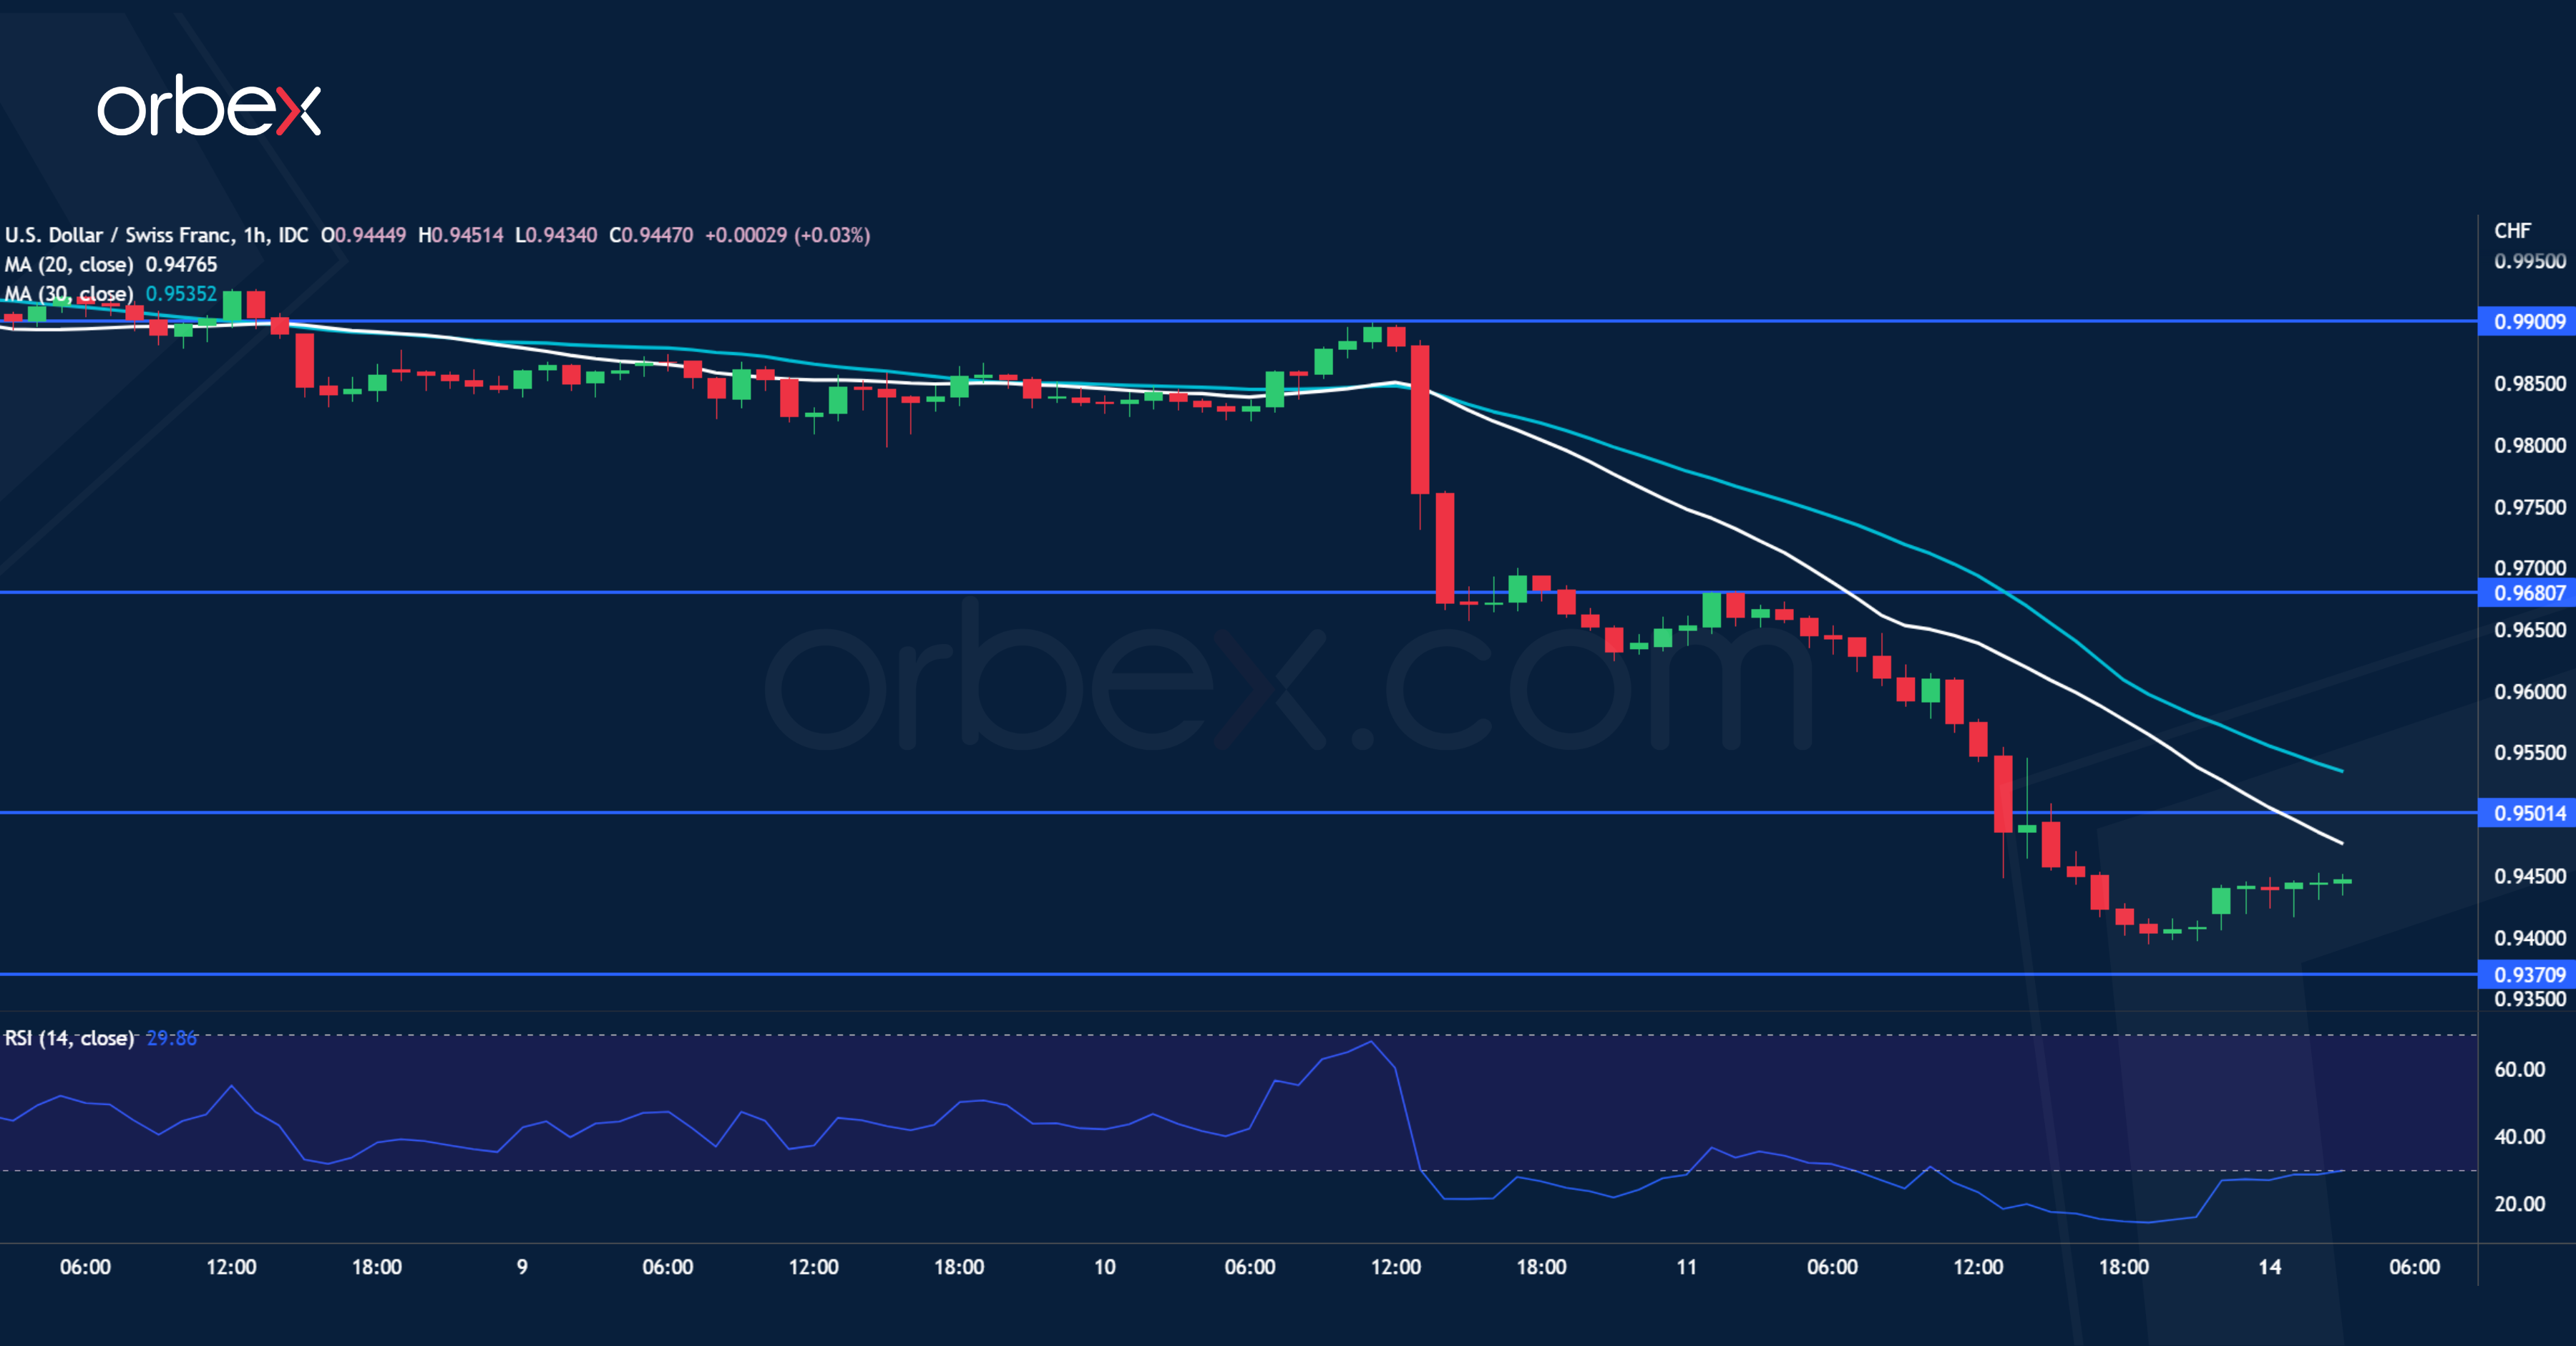
The US dollar sank as traders reassessed the Fed’s stance in light of cooling inflation. A sharp fall below the daily support at 0.9740 prompted more buyers to bail out. Then strong momentum below 0.9500 was a sign that the reversal has caught the bulls off-guard, causing a mass liquidation. August’s low of 0.9370 is the next support but buyers could be wary of catching a falling knife. A bearish breakout would pave the way for a slide towards 0.9300. The support-turned-resistance 0.9500 is the first hurdle when the dust settles.
Gold Inches Below Key Resistance, But Still Shines
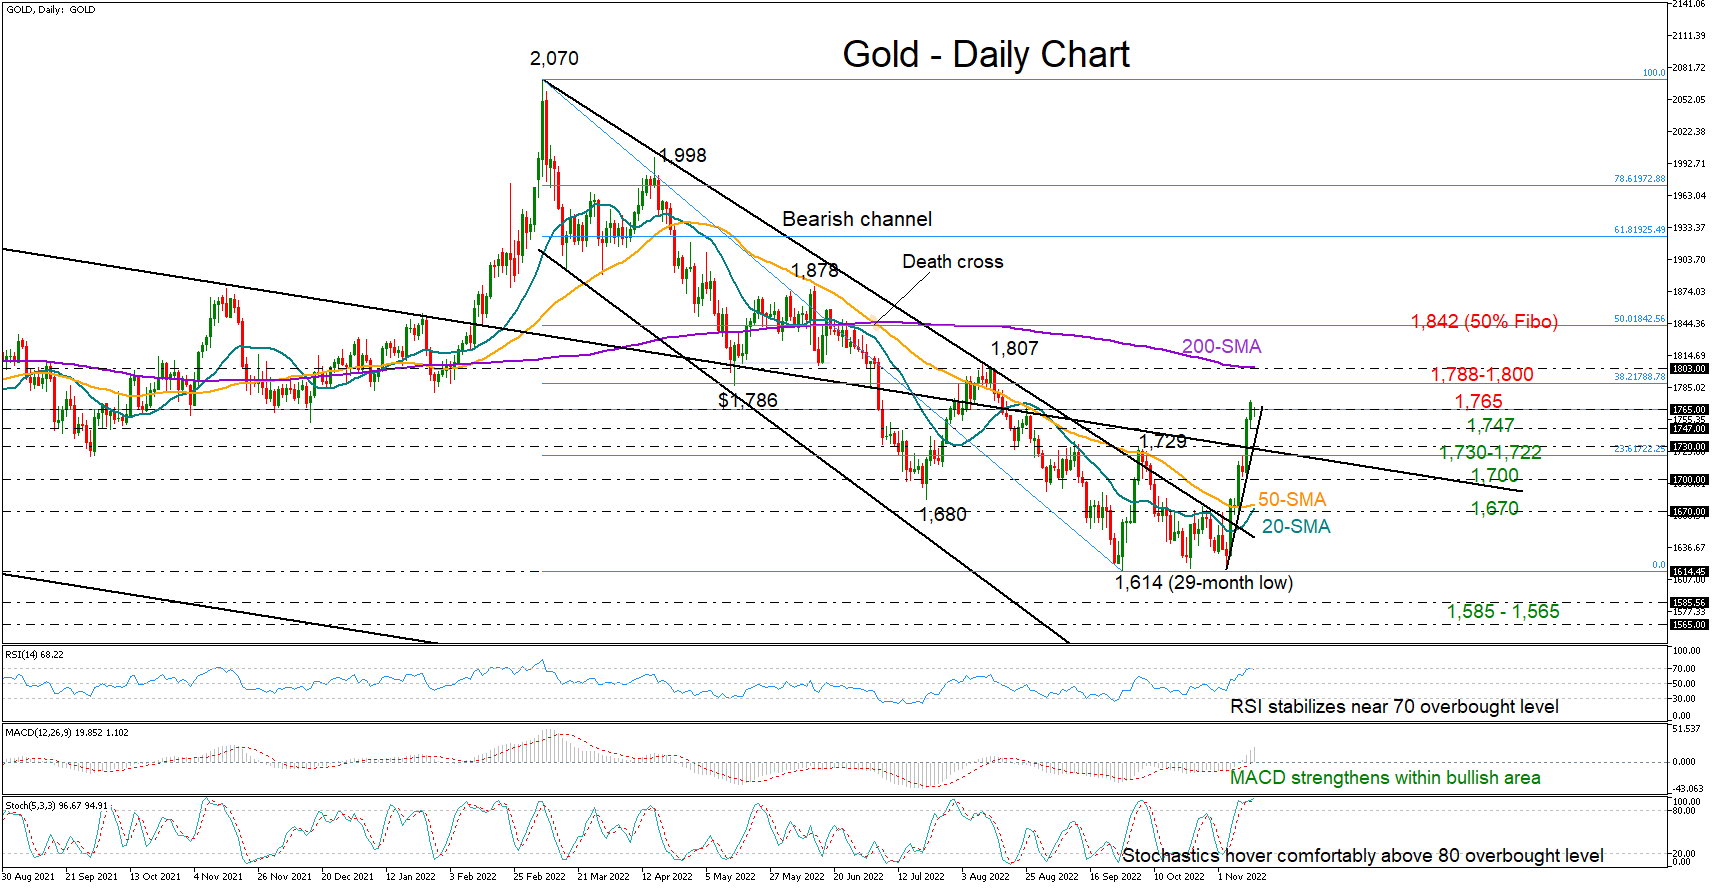
Gold opened with a small negative gap on Monday, pulling back below the August 25 high of 1,765 after stretching its extraordinary rally to a two-and-a-half month high of 1,772 last Friday.
The latest impressive ascent confirmed a triple bottom structure around the 29-month low of 1,614, flagging a bullish trend reversal. Yet, some easing cannot be ruled out in the near term as the RSI and the stochastics seem to be losing momentum near oversold levels.
Should the price reverse lower, Friday’s base of 1,747 could immediately provide some footing. A step below that floor would shift the spotlight to the key 1,730-1,722 area once again, where the 23.6% Fibonacci retracement of the 2,070-1,614 downleg is positioned. Additional declines from here could re-challenge the 1,700 psychological mark ahead of the 20- and 50-day simple moving averages (SMAs) and the important barrier of 1,670.
If the rally resumes above 1,765, the next target could be the 1,788-1,800 zone, formed by the 38.2% Fibonacci level and the 200-day SMA. This is also where the price peaked in August. Therefore, a violation at this point could further power the bullish wave, bringing the 50% Fibonacci of 1,842 next into view.
In summary, gold has the potential for more upside, though the bulls may take a breather after last week’s swift upturn before they continue higher. A break below 1,730-1,722 could raise negative risks.
EURUSD Skyrockets to 3-Month High; Bullish Bias in Near Term
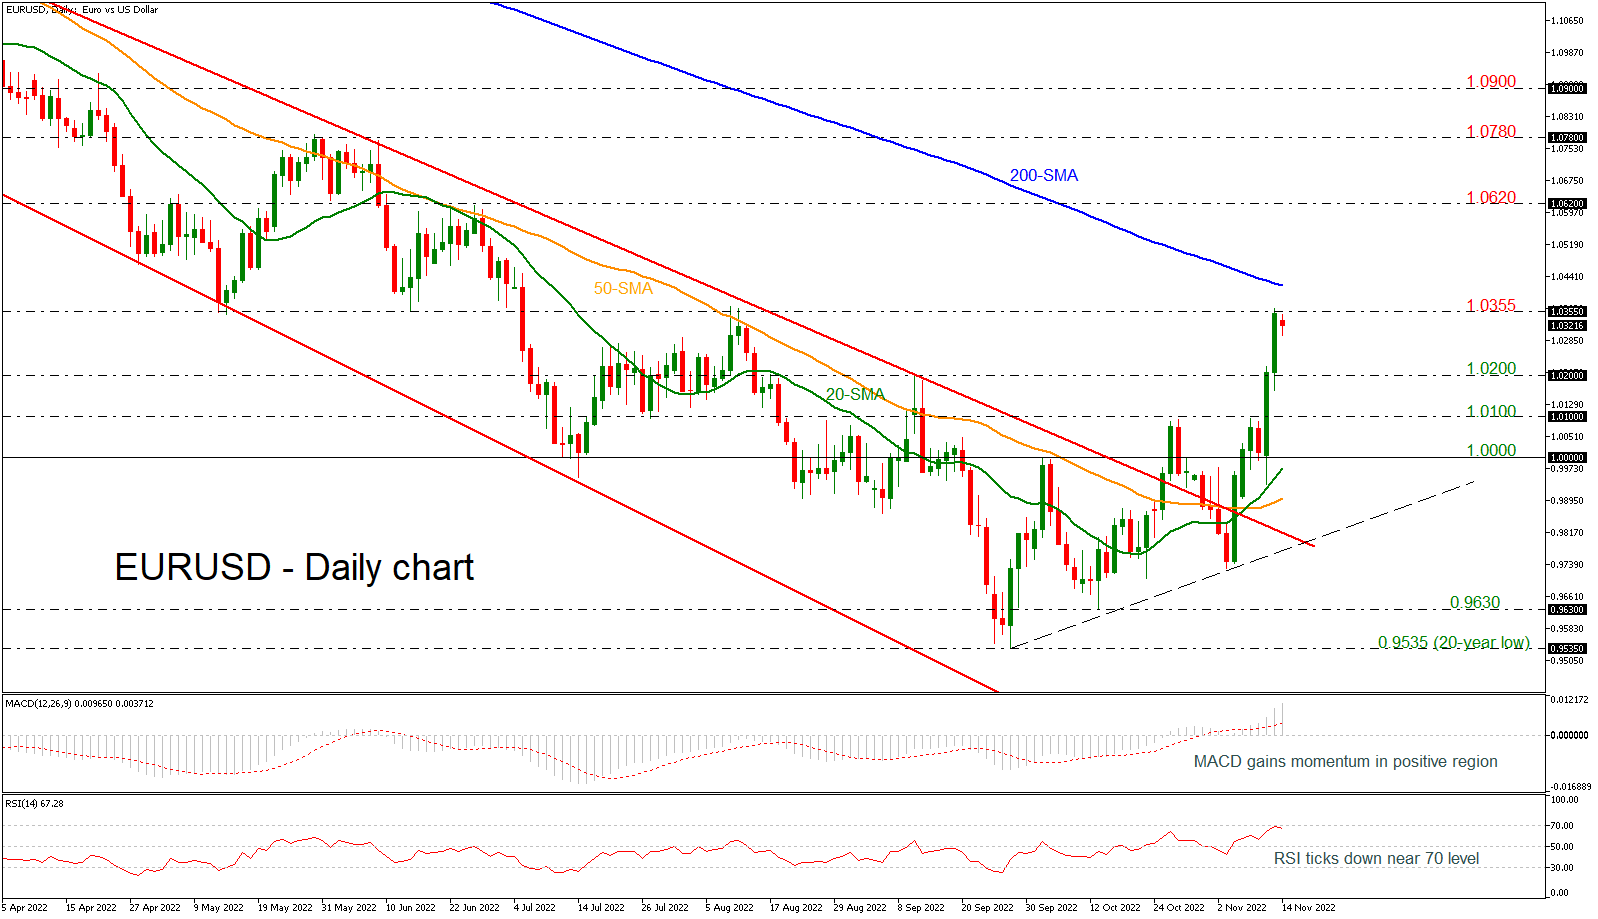
EURUSD advanced sharply to a new three-month high of 1.0363 on Friday, continuing the bullish extension from Thursday’s session following the rebound off the parity level.
The pair has jumped above the long-term descending channel, that was drawn since February, and is moving towards the 200-day simple moving average (SMA). If the market successfully surpassed the aforementioned line, then it may suggest a positive correction in the bigger outlook as well. However, the price is currently retreating with weak momentum, indicating a potential minor bearish move in the near term.
Regarding the technical oscillators, the MACD is strengthening its upside movement above its trigger and zero lines; however, the Relative Strength Index (RSI) touched the 70 region and is ticking slightly lower, suggesting an overbought market and a possible bearish move in the short-term timeframe.
More upside actions could hit the 200-day SMA at 1.0420 ahead of the 1.0620 resistance level, registered back on June 27. Edging higher, the bulls may meet the next resistance hurdles such as 1.0780 and 1.0900, taken from the high on May 30 and the lows on March 14, correspondingly.
On the other hand, a downside reversal may take the price towards the 1.0200 inside swing high from August 17 before meeting the 1.0100 barrier and the 1.0000 psychological mark. A drop lower again could turn the bias back to negative and attract traders’ attention to hit the bullish crossover within the 20- and 50-day SMAs at 0.9875 ahead of the short-term ascending trend line near 0.9820. Breaking this obstacle too, then the pair may re-touch the lows at 0.9630.
All in all, EURUSD is posting an aggressive bullish structure in the near-term and any moves beyond the next key line of the 200-day SMA could endorse this outlook, switching the picture to bullish in the bigger view.
Post-CPI Market Reaction Calls an End to Very Strong Market Trends
Markets
Last Thursday’s US October CPI release still dominates the debates. The relative small downward surprise (headline 0.4% M/M & 7.7% Y/Y; core 0.3% M/M & 6.3% Y/Y) triggered an outsized market reaction. They flipped odds for the outcome of the December Fed policy meeting completely towards 50 bps where FOMC Chair Powell after the November policy meeting still left the door open for a continuation at the 75 bps rhythm. A lot of Fed governors welcomed the inflation number, effectively using the opportunity to slow things down. However, each and every one of them stressed that slowing isn’t the same as stopping. There’s a strong consensus that the policy rate peak in the US will be higher than the 4.5% suggested in the September dot plot.
US Treasuries rallied significantly on Thursday with bond markets closed on Friday for Veteran’s Day. The US 2-yr yield approached the neckline of a double top formation at 4.25%, but a real test didn’t occur. The US 10-yr yield closed the week below a similar technical reference at 3.9%, but is trying to regain this level this morning. US stock markets in a two-day rally gained as much as 9.5% for Nasdaq. The tech index managed to close above the neckline of a triple bottom formation at 4404. The S&P 500 won 7% with the move above the multiple bottom formation at 3908 suggesting that this year’s downtrend could morph into more sideways action going forward. The dollar fell off a cliff. The trade-weighted dollar (DXY) lost the support zone around 109-110, dropping out of this year’s upward trend channel to currently change hands at 106.85. The key and next reference is 104.64. The same pattern is visible in EUR/USD with the pair in no time leapfrogging all intermediate resistance to arrive at the big one: 1.0341 (2017 bottom/1.0350 (May low)/1.0368 (August high). Recall that the pair traded around 0.9950 ahead of the CPI release.
The post-CPI market reaction calls an end to very strong market trends (firmer USD, weaker stocks, weaker bonds) with more choppy action ahead. The narrative changed in the sense that the call for ever faster and ever more in the tightening cycle is over. The bigger risk is to overinterpret it as a sudden stop. From a momentum point of view, lack of important US eco data ahead of the key December releases, the confirmed Democratic Senate victory and the illiquid Thanksgiving weekend suggest markets could hold on to their corrective stance for a while. Today’s eco calendar in any case is empty apart from outdated EMU production numbers and speeches by some ECB governors. We retain from weekend comments that ECB governing council member de Cos made an opening to start running down the APP portfolio already in December rather than early 2023.
News Headlines
Bloomberg reports on a notice from the People’s Bank of China (PBOC) and Chinese financial regulators about a 16-point plan to support the real estate market. The plan contains a wide range of measures to support liquidity and financing for the sector, including debt extensions and easing of down-payment rules for home buyers. The headlines on the real estate support plan are supporting Chinese equity markets this morning.
In his weekly column published in the Mlada Fronta Dnes Newspaper, Czech central bank governor Michl said that nominal growth in Czech salaries should be capped at 5% next year to avoid a price wage spiral. The CNB governor also reiterated that in order to slow inflation, lower budget deficits and stable rates are necessary.
UK Q3 GDP growth came in at -0.2% Q/Q and 2.4% Y/Y last Friday. It was the first negative quarterly reading for UK growth since the first quarter of 2021. The contraction was due to a quarterly decline in private consumption (-0.5% Q/Q). Gross fixed capital formation (2.5% Q/Q), government spending (1.3%) and net-exports still supported global demand. The quarterly figure was slightly better than expected, but an unexpected sharp decline of the monthly figure of September (-0.6%) suggests further headwinds for the UK economy in the final quarter of the year.