

Sample Category Title
Republicans are the Favourites to Win the House While Senate Race is Too Tight to Call
Market movers today
This is a very quiet day in terms of data releases but we do get September industrial production data from Sweden in the morning. In the central bank calendar, we have ECB's Elderson and Fed's Williams and Barkin scheduled.
The European Commission will publish a first draft proposal on EU fiscal rules reform, which aims to give individual countries a bigger say in their debt reduction plans, while also strengthening enforcement rules.
Otherwise, the markets will be digesting the results from the US midterm election.
The 60 second overview
US midterms: While votes are still being counted, exit polls suggest that republicans are the favourites to win control of the House of Representatives, while the Senate race is still too tight to call. At the time of writing, results received so far indicate that the Democratic Party has been able to flip one seat in senate in Pennsylvania. Focus remains on results for Georgia, Wisconsin and Nevada. Focus remains on results for Georgia, Wisconsin, Nevada and Pennsylvania. The race for the house has also turned out to be tighter than expected. It might take days or even weeks until the final results are confirmed especially for the Senate. In Georgia, the final senate result could require a run-off election at a later date if neither Democratic nor Republican candidate manages to secure at least 50% of votes (as was the case in 2020).
Markets have remained calm overnight, as a divided government with republicans controlling at least the house still seems like the most likely outcome - in line with what prediction markets expected ahead of the election. Both parties would have limited chances to push forward major legislative changes, and the next focus points would be the discussions on the government debt ceiling and further support for Ukraine. The former provides the likely republican lower chamber some leverage in pushing forwards their initiatives, as failing to increase the debt ceiling could result in US government defaulting on its debt. Republican Party's focus has been on cost cuts, especially on social security and medicare. Aid to Ukraine has also been discussed ahead of the election, and while we think an abrupt cut-off of all support seems unlikely given the bipartisan approval of past packages, it remains a key question from European perspective given that US has clearly been the most important supporter of Ukraine so far during the war.
China: Chinese producer prices declined in y/y terms for the first time since December 2020 (-1.3%), which is a clear sign that price pressure on goods stemming from high commodity prices is easing. The rally in Chinese equities has taken a breather early this week, as officials have pushed back on rumours of easing Covid-policies and new infections have climbed higher especially in the manufacturing hub of Guangzhou.
Equities: Equities continued its solid march higher. Cyclicals and especially growth cyclicals took the lead. A great proxy for this change in sentiment is Storskogen, up 11% yesterday. It was also a good day for Nordic consumer discretionary as both Boozt and Pandora beat earnings expectations. On the other side of the Atlantic, S&P500 closed up 0.6% with materials in the lead. Futures slightly lower today.
FI: European rates rallied markedly in the afternoon on no apparent news or headline. 10y German yields ended 6bp lower on the day, amid general intra-euro area spread tightening (Italian-German yield spread tightened 3bp to 210bp).
FX: We see a notable gap between our short-term regression models for EUR/NOK and USD/NOK to actual spot levels with fair-value estimates of 10.44 and 10.80, respectively. While we never base recommendation on these models alone they have historically proven reliable cross checks as to when correction opportunities have arisen. EUR/DKK dropped below 7.4400 this week and towards the 7.4360-65 low. We expect Danmarks Nationalbank (DN) to maintain the floor around this level and another DKK20-30bn of FX intervention selling would trigger a further widening of the spread to ECB's policy rate.
Credit: Mirroring the overall positive sentiment yesterday, the credit markets continued to see tightening in CDS indices. iTraxx Main closed the day 1.8bp lower at 105.2bp, while iTraxx Xover was 4.1bp lower at 515.6bp. The primary market continued the constructive tone with numerous new deals.
Nordic macro
Sweden: Statistics Sweden releases September consumption indicator and the production value index (PVI). Both are of less importance this time as the GDP indicators for both September and Q3 have already been released. There is some interest mainly in how in particular the services components cope in the consumption indicator as we have already seen retail trade declining by more than 5 % yoy on the back of a worsening economy.
Norway: In Norway, keep an eye on job vacancies, which hit record levels in Q2. The labour market still seems to be tight, but the number of new job openings has begun to come down. We may therefore see a moderate fall in the total number of vacancies in Q3. In addition, we get employment and wage figures for Q3.
Technical Outlook and Review
USD/JPY:
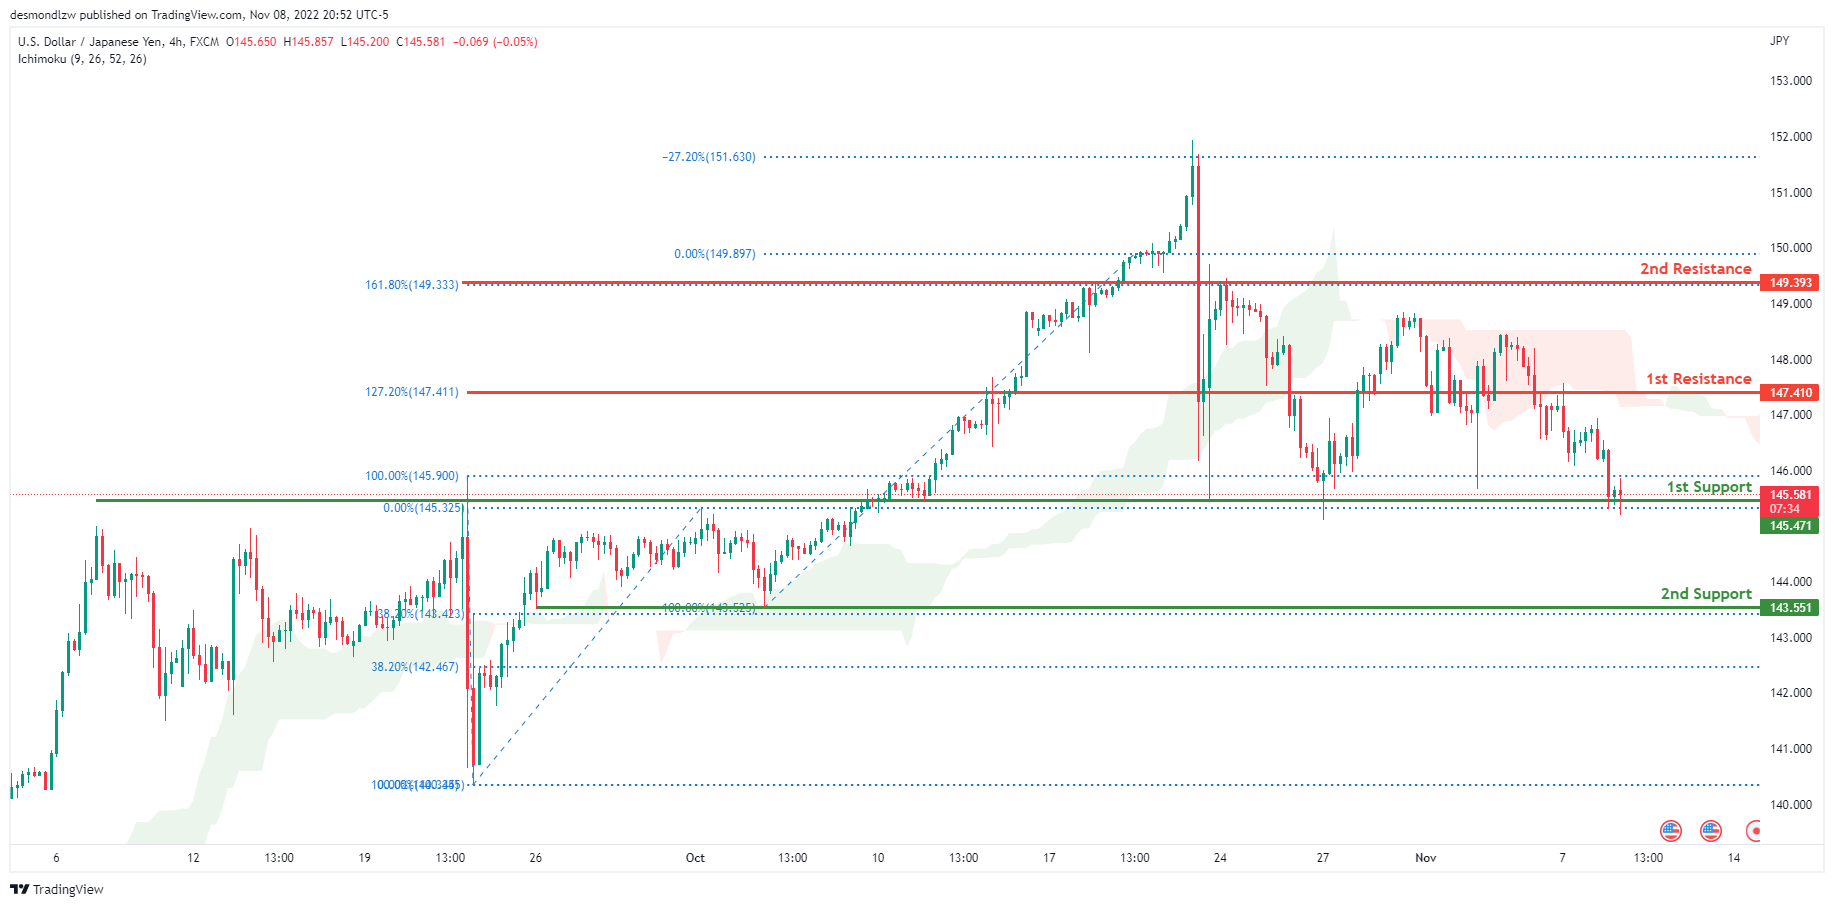
The current general bias for USDJPY on the H4 chart is bearish. To add confluence to this, the price is below the Ichimoku cloud which indicates a bearish market. Overnight, USDJPY continued its bearish momentum with the price currently resting on the 1st support line. Price is currently trading at 145.603 at time of writing. If the bearish momentum continues, expect USDJPY to break the 1st support line at 145.471, where the 100% and 0% Fibonacci lines are located and head towards the 2nd support line at 143.551 where the 38.2% and 100% Fibonacci lines are located. In an alternative scenario, price could break above the 1st resistance and head towards the 2nd resistance at 149.393 where the 161.8% and 0% Fibonacci lines are located.
Areas of consideration:
- H4 time frame, 1st resistance at 147.410
- H4 time frame, 1st resistance at 149.393
- H4 time frame, 1st support at 145.471
DXY:
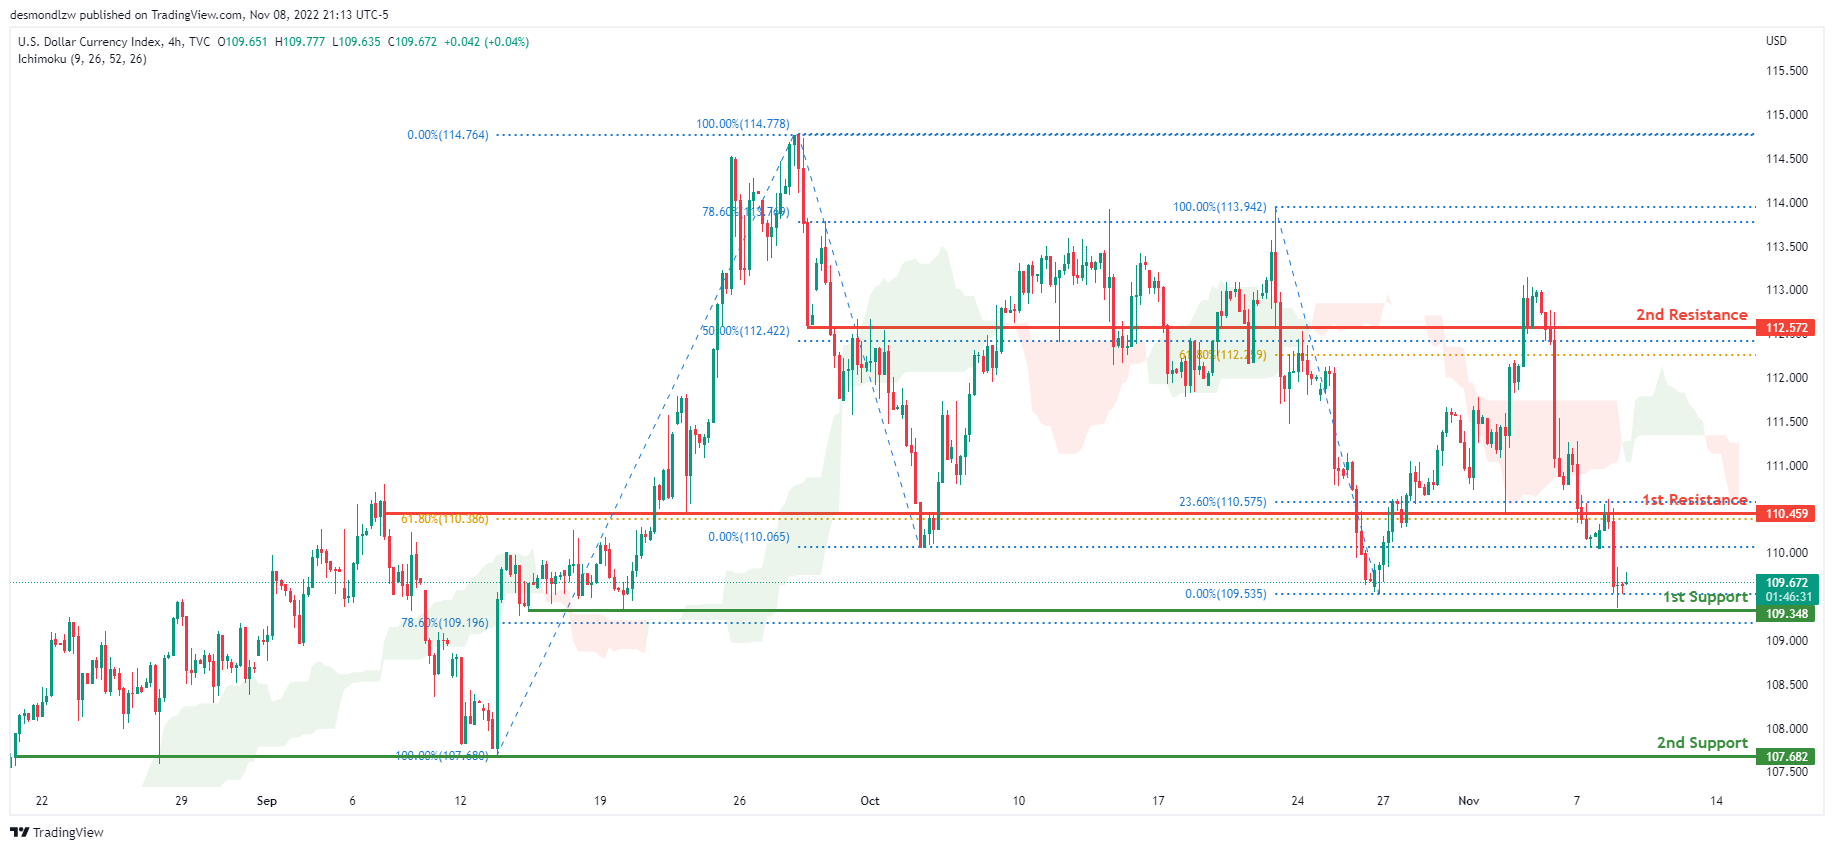
On the H4 chart, the overall bias for DXY is bearish. To add confluence to this, the price is below the Ichimoku cloud which indicates a bearish market. Overnight, price continued its bearish momentum downwards with price closing under the 1st resistance at 110.459 where the 61.8% and 23.6% Fibonacci lines are located and just right above where the 1st support is. The price is currently trading at 109.664 at the time of writing. If this bearish momentum continues, price could head towards the 1st support line at 109.348 where the 78.6% Fibonacci line and previous low are located. In an alternative scenario, price could head back up to retest the 1st resistance line.
Areas of consideration:
- H4 time frame, 1st resistance at 110.459
- H4 time frame, 1st support at 109.348
EUR/USD:
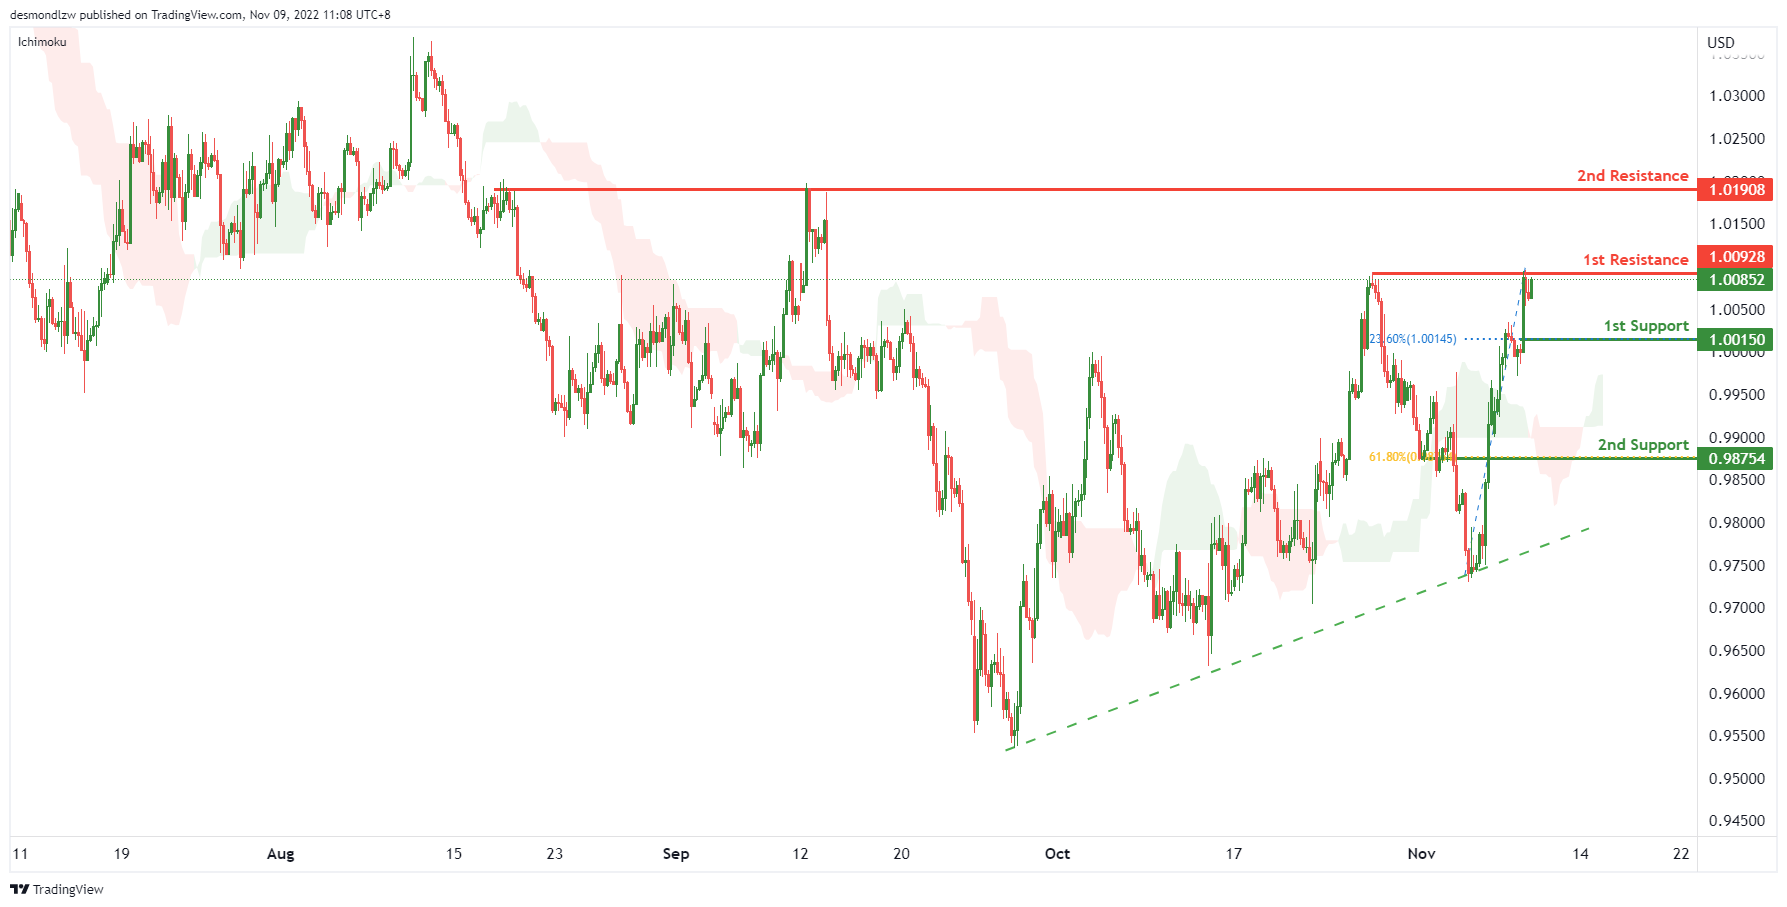
On H4, with the price moving above the ichimoku cloud and ascending trendline, we have a bullish bias that the price may rise to the 1st resistance at 1.00928, which is in line with the swing highs. If the 1st resistance is broken, the 2nd resistance is at 1.01908, where the previous swing highs are. Alternatively, the price may drop to the 1st support at 1.00150, where the 23.6% fibonacci retracement is. If the 1st support is broken, the 2nd support is at 0.98754, where the 61.8% fibonacci retracement sits.
Areas of consideration :
- H4 1st resistance at 1.00928
- H4 2nd resistance is 1.01908
GBP/USD:
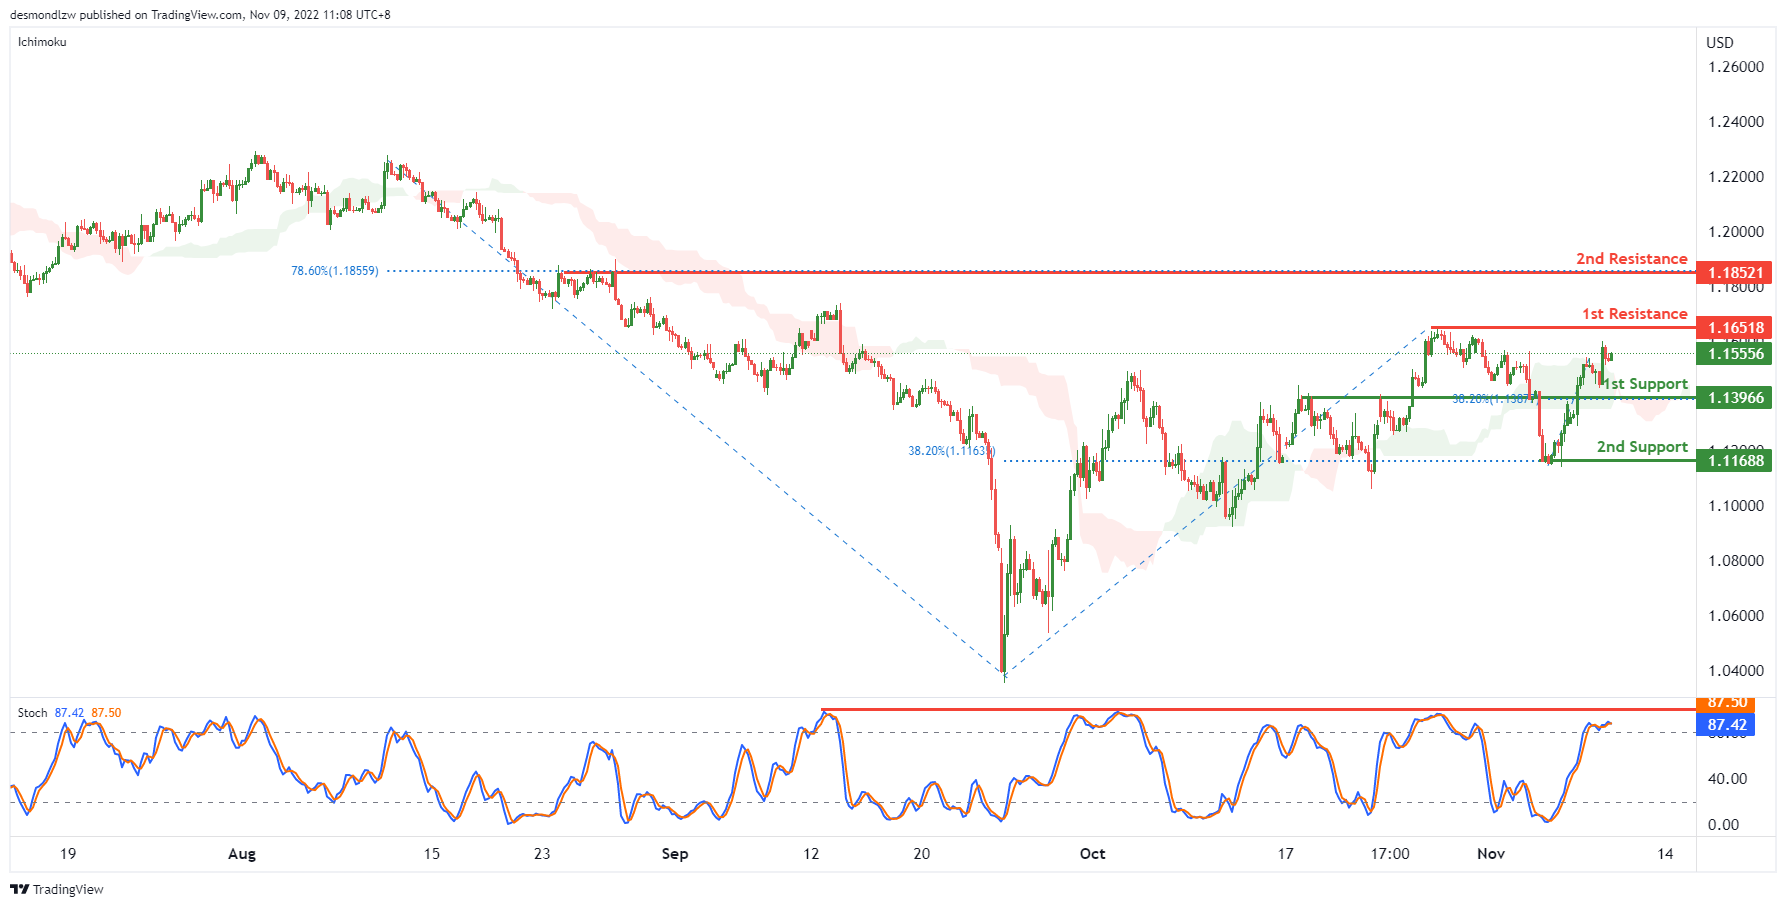
On the H4, price is crossing the ichimoku cloud and stoch is rising to test the resistance level, we have a bullish bias that the price may rise to test the 1st resistance at 1.16518, which is in line with the previous swing high to the 2nd resistance at 1.18521, where the 78.6% fibonacci retracement is. Alternatively, the price may drop to the 1st support at 1.13966, where the 38.2% fibonacci retracement is, if the 1st support is broken, the 2nd support is at 1.11688, which is in line with the previous swing low and 38.2% fibonacci retracement.
Areas of consideration:
- H4 1st resistance at 1.16518
- H4 2nd resistance at 1.18521
USD/CHF:
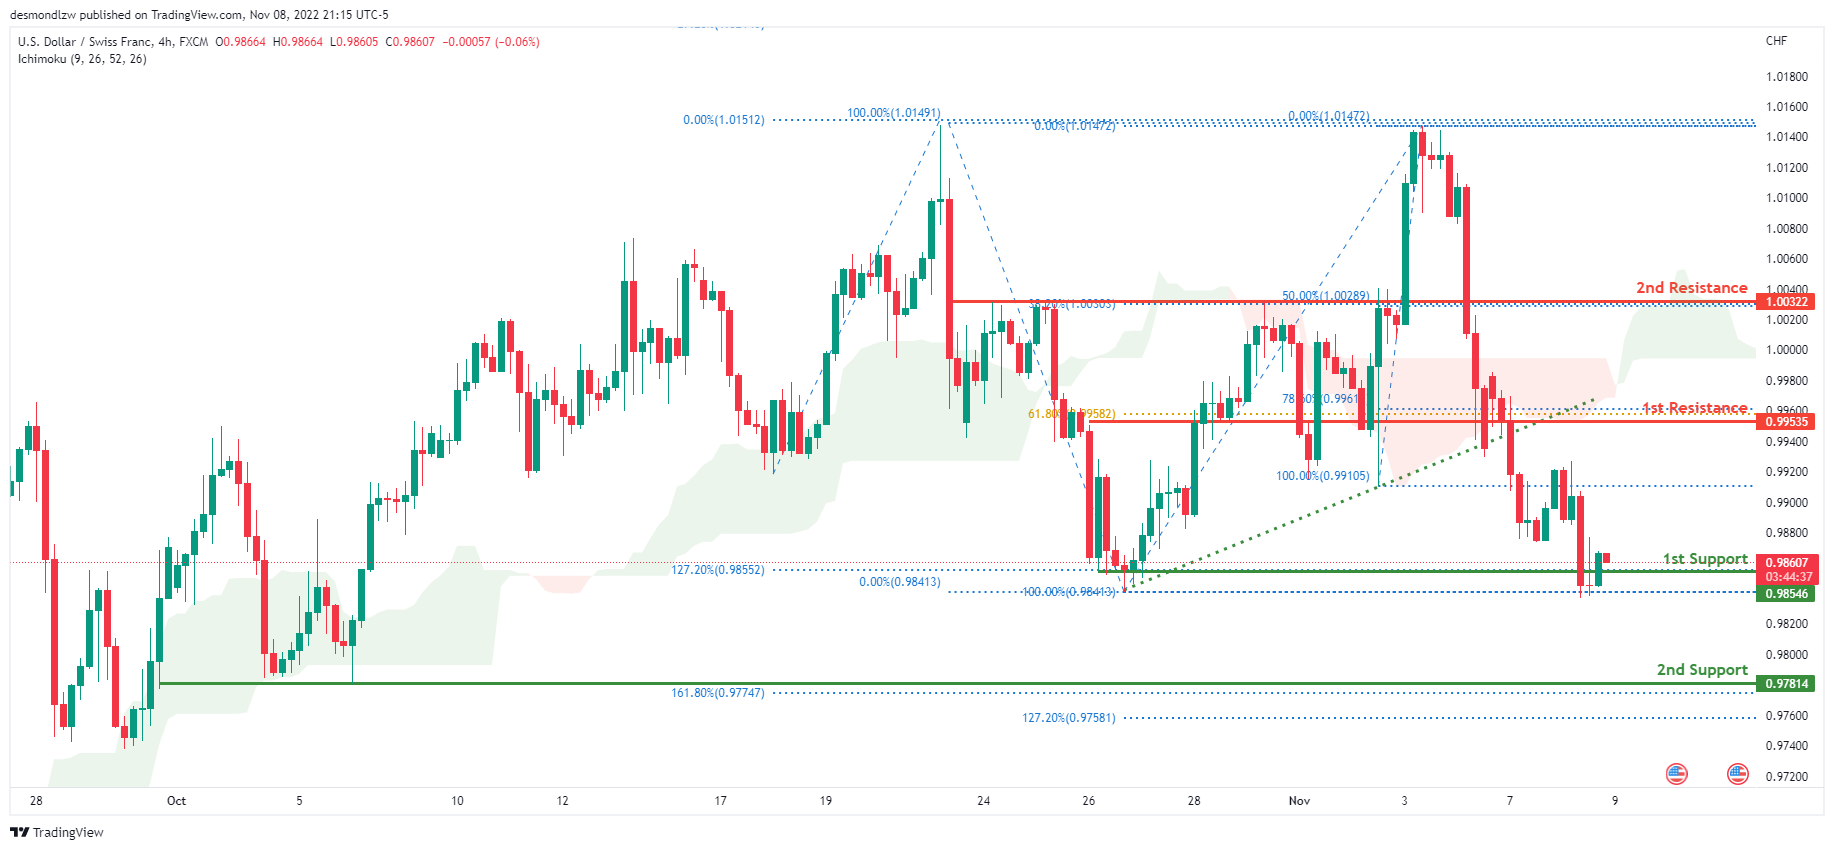
On the H4 chart, the overall bias for USDCHF is bearish. To add confluence to this, the price is below the Ichimoku cloud which indicates a bearish market. Overnight, price continued its bearish momentum downwards with price resting just above the 1st support line . The price is currently trading at 0.98604 at the time of writing. If this bearish momentum continues, expect price to head towards the 1st support line at 0.98546, where the 127.2% Fibonacci extension line, 100% Fibonacci line and previous swing low are located. In an alternative scenario, price could head back up to retest the 1st resistance line.
Areas of consideration
- H4 1st support at 0.98546
- H4 1st resistance at 0.99535
XAU/USD (GOLD):
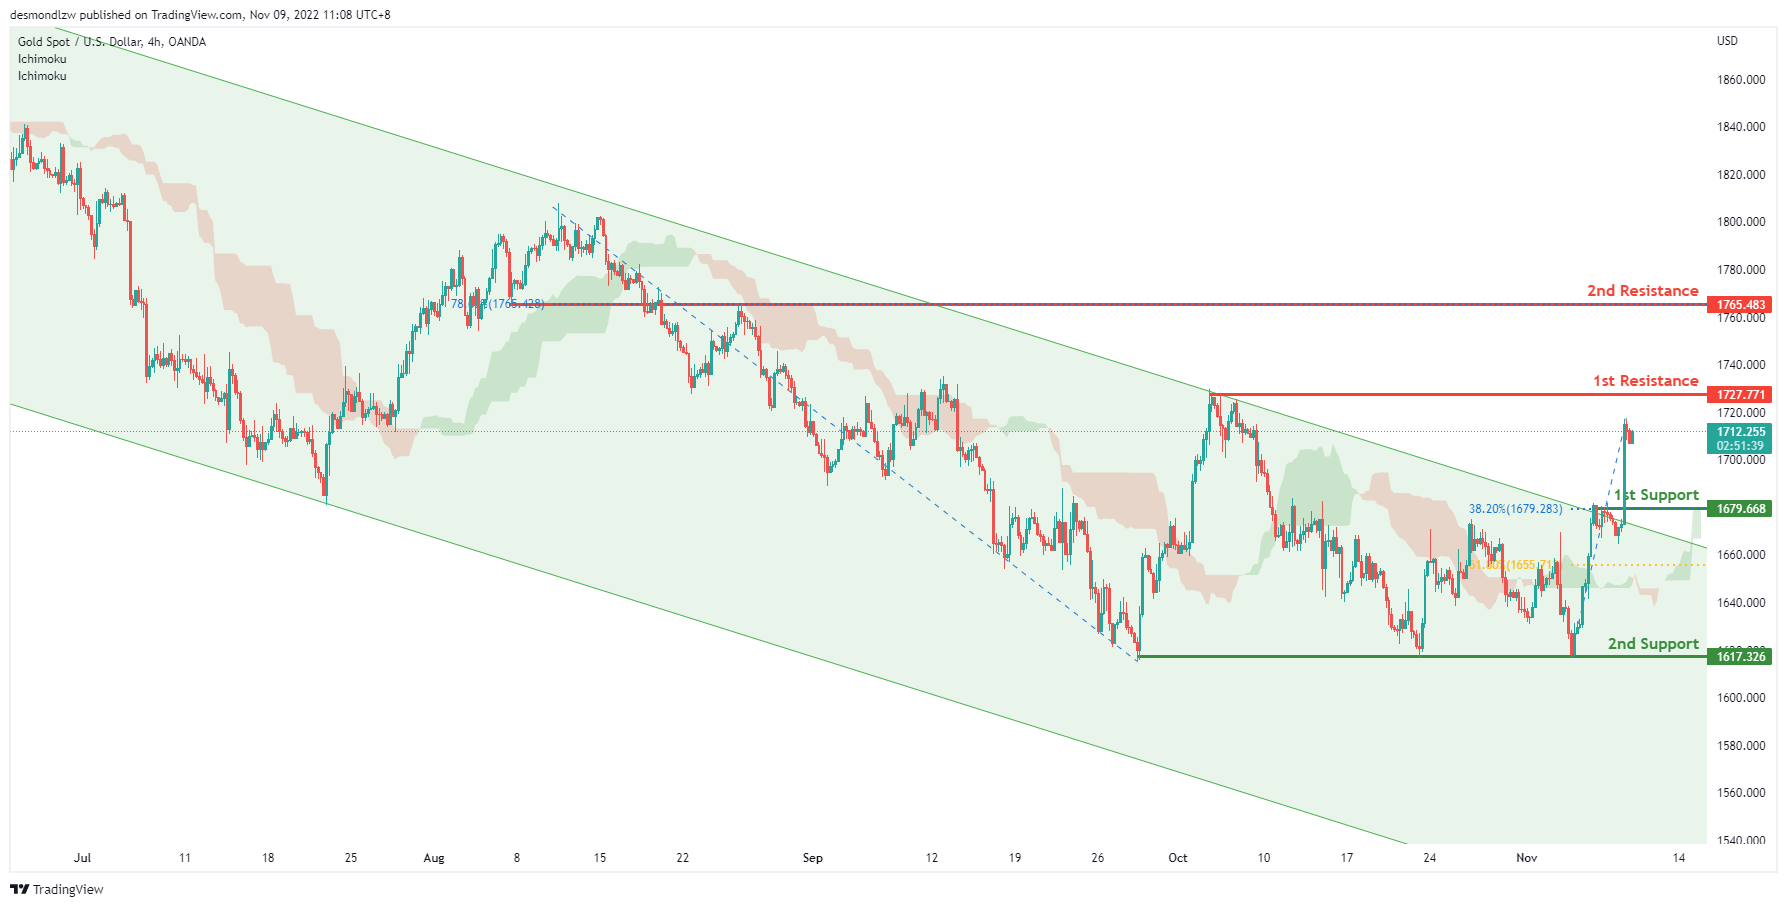
On H4, with the price breaking the descending channel and above the ichimoku cloud, we can expect the price rise to the 1st resistance at 1727.771, which is in line with the previous swing high, if the 1st resistance is broken, the 2nd resistance is at 1765.483, where the 78.6% fibonacci retracement is. Alternatively, the price may drop to the 1st support at 1679.668, where the 38.2% fibonacci retracement is. If the 1st support is broken, the 2nd support is at 1617.326, where the swing lows are.
Areas of consideration:
- H4 time frame, 1st resistance at 1727.771
- H4 time frame, 2nd resistance is at 1765.483
AUD/USD:
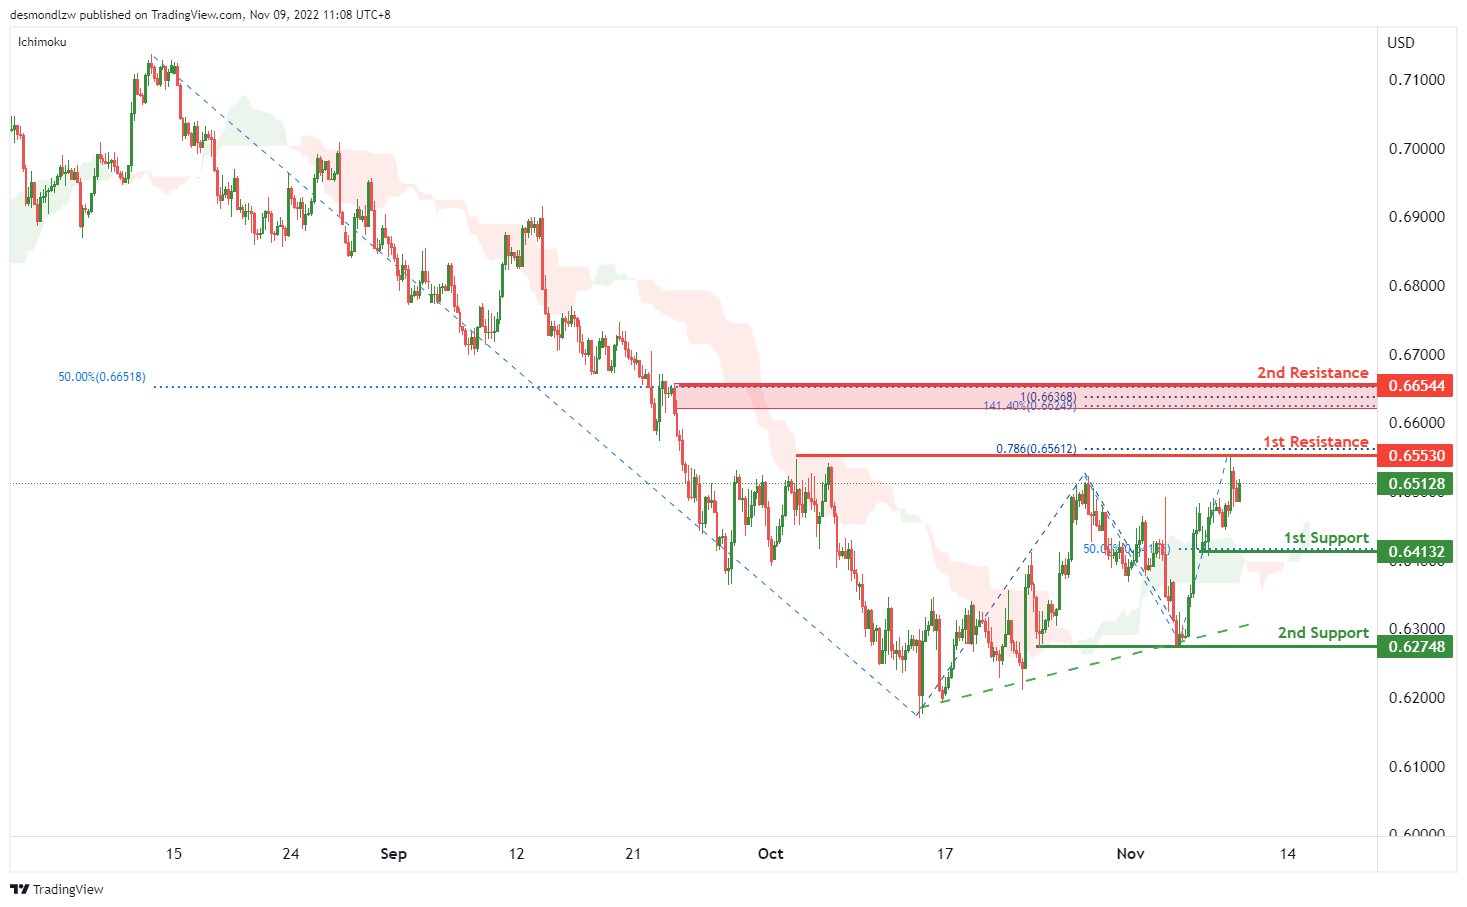
On the H4, with the price crossing the ichimoku cloud and moving above the ascending trendline, we can expect the price to break the 1st resistance at 0.65530, which is in line with the swing highs and 78.6% fibonacci projection. If the 1st resistance is broken, the 2nd resistance is at 0.66544, where the 100% fibonacci projection, 50% fibonacci retracement and 141.4% fibonacci extension are. Alternatively, the price may drop from the 1st resistance to the 1st support at 0.64132, where the 50% fibonacci retracement and previous swing low are. If the 1st support is broken, the 2nd support is at 0.62748, where the swing lows are.
Areas of consideration
- H4, 1st resistance at 0.65530
- H4, 2nd resistance at 0.66544
NZD/USD:
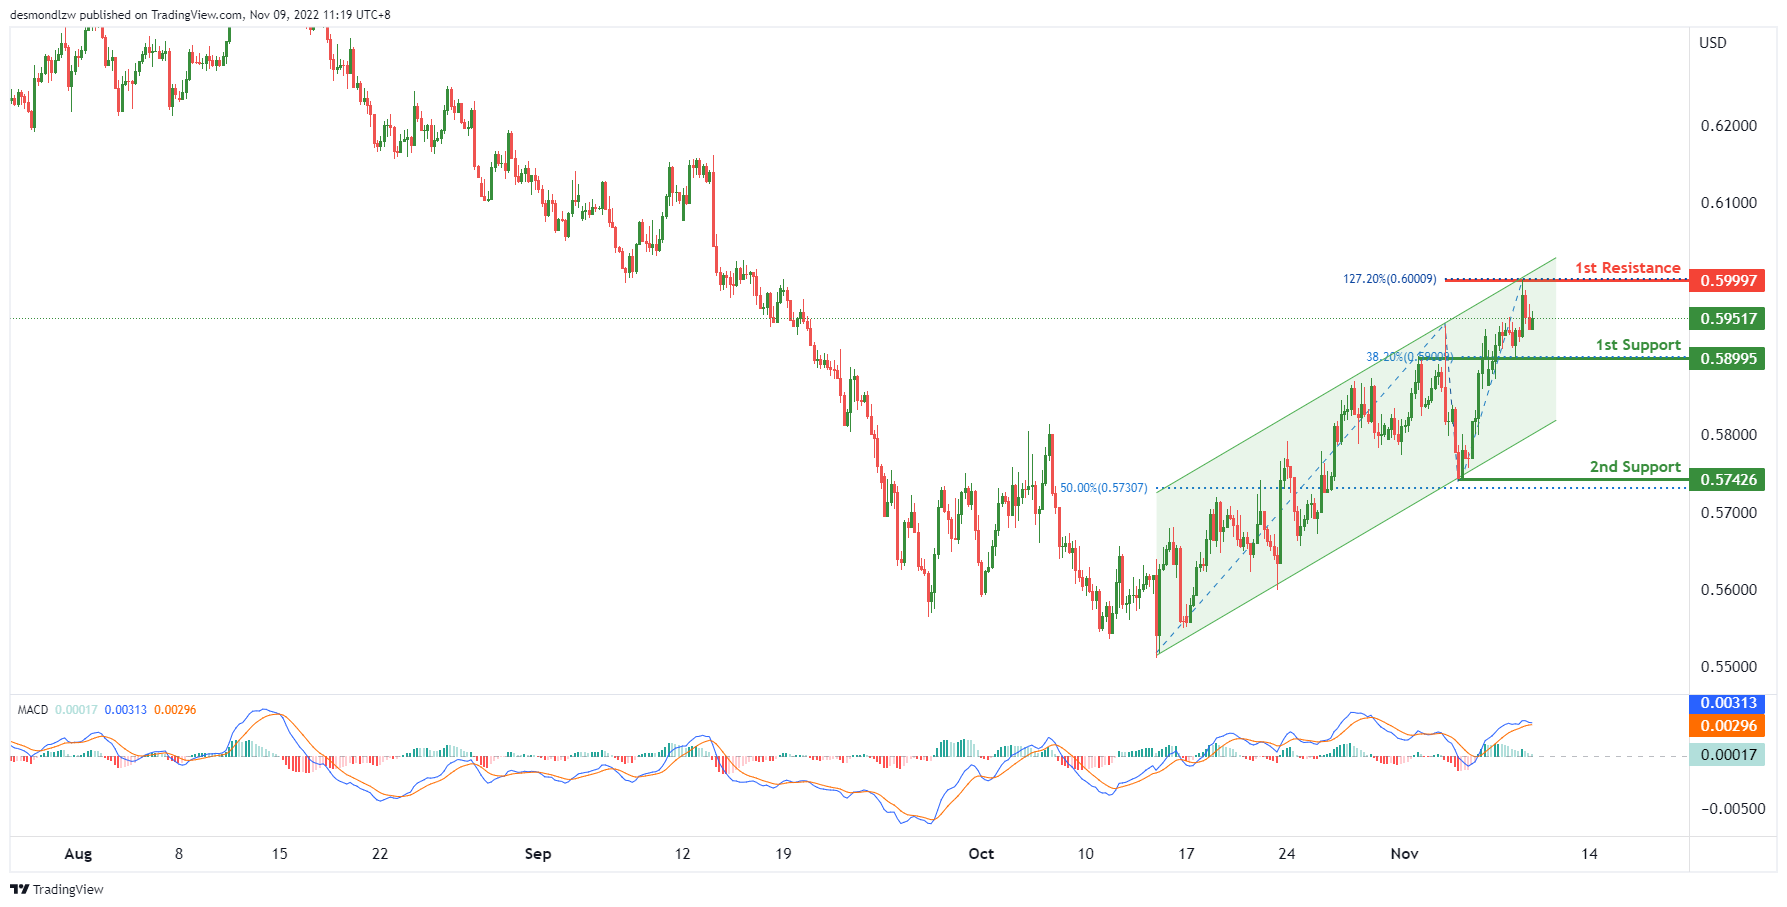
On the H4 chart, as the price is moving above ichimoku cloud and ascending channel, the price may rise to the 1st resistance at 0.59997, which is in line with the swing high and 127.2% fibonacci extension. As the MACD is showing a death cross, the price may drop form the 1st resistance and test the 1st support at 0.58995, which is in line with the 38.2% fibonacci retracement. If the 1st support is broken, the 2nd support is at 0.57426, where the swing low and 50% fibonacci retracement are.
Areas of consideration:
- H4 time frame, 1st resistance at 0.59997
- H4 time frame, 1st support at 0.58632
USD/CAD:
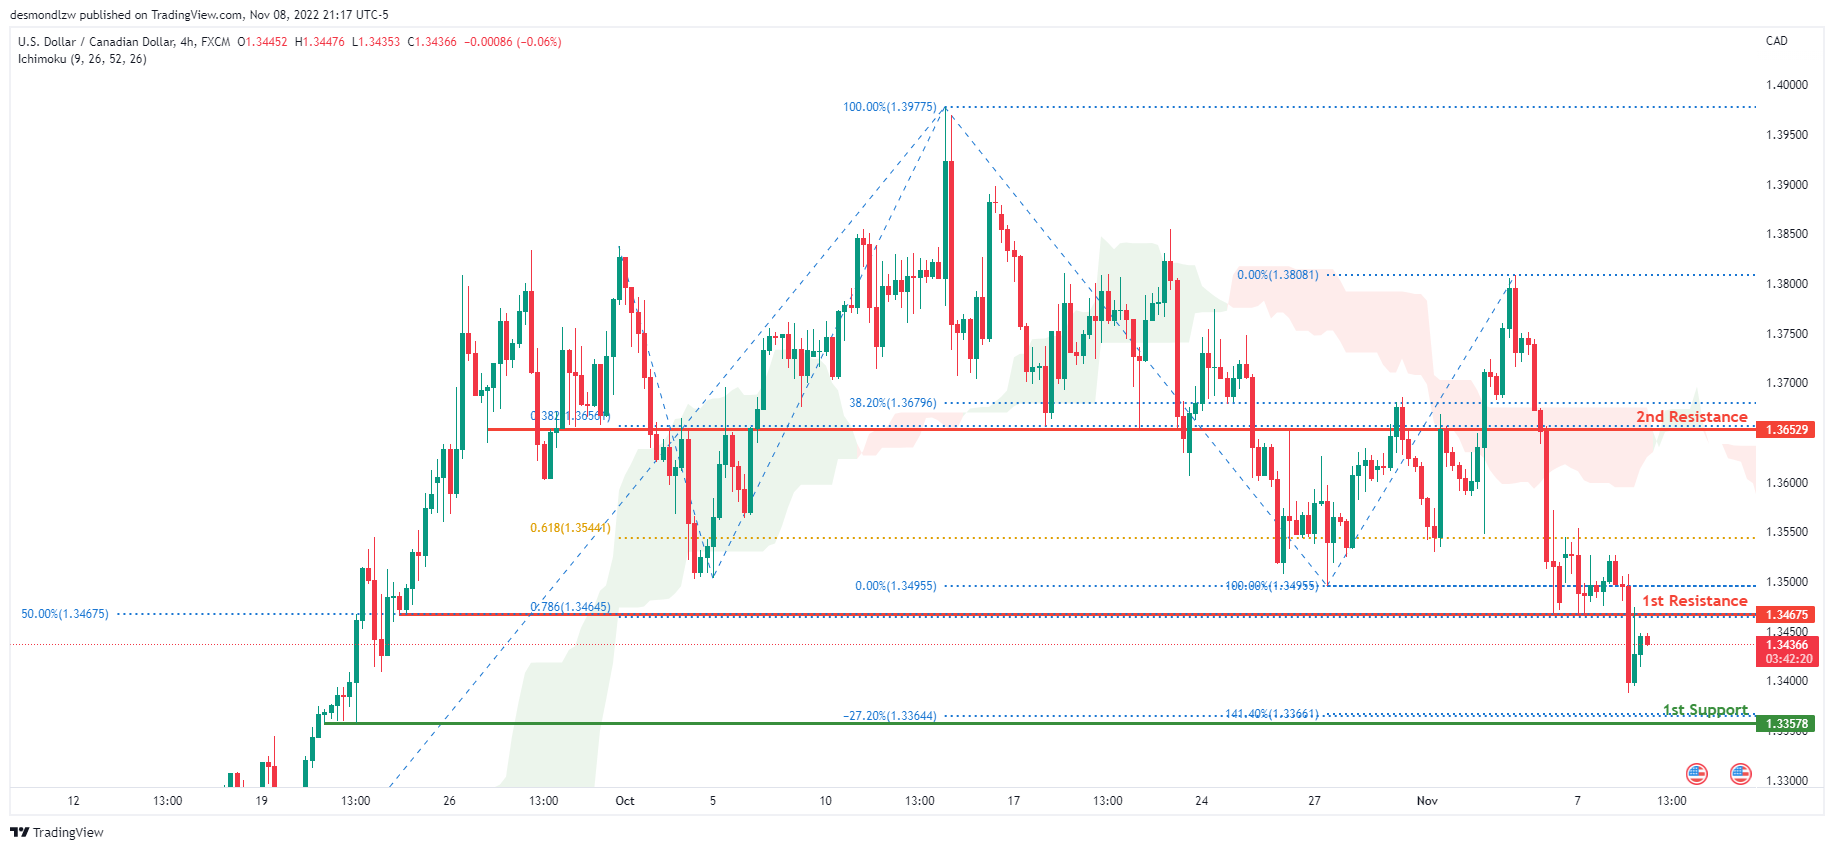
On the H4 chart, the overall bias for USDCAD is bearish. To add confluence to this, the price is below the Ichimoku cloud which indicates a bearish market. Overnight, the price continued its bearish momentum downwards with price closing under the 1st resistance line at 1.34675 where the 78.6% Fibonacci projection line and previous low is located.. The price is currently trading at 1.34384 at the time of writing. If this bearish momentum continues, expect the price to head back down towards the 1st support line at 1.33578 where the -27.2% Fibonacci expansion line and 141.4% Fibonacci line is located. In an alternative scenario, price could head back up to retest the 1st resistance line.
Areas of consideration:
- H4 time frame, 1st resistance at 1.34675
- H4 time frame, 1st support at 1.33578
OIL:
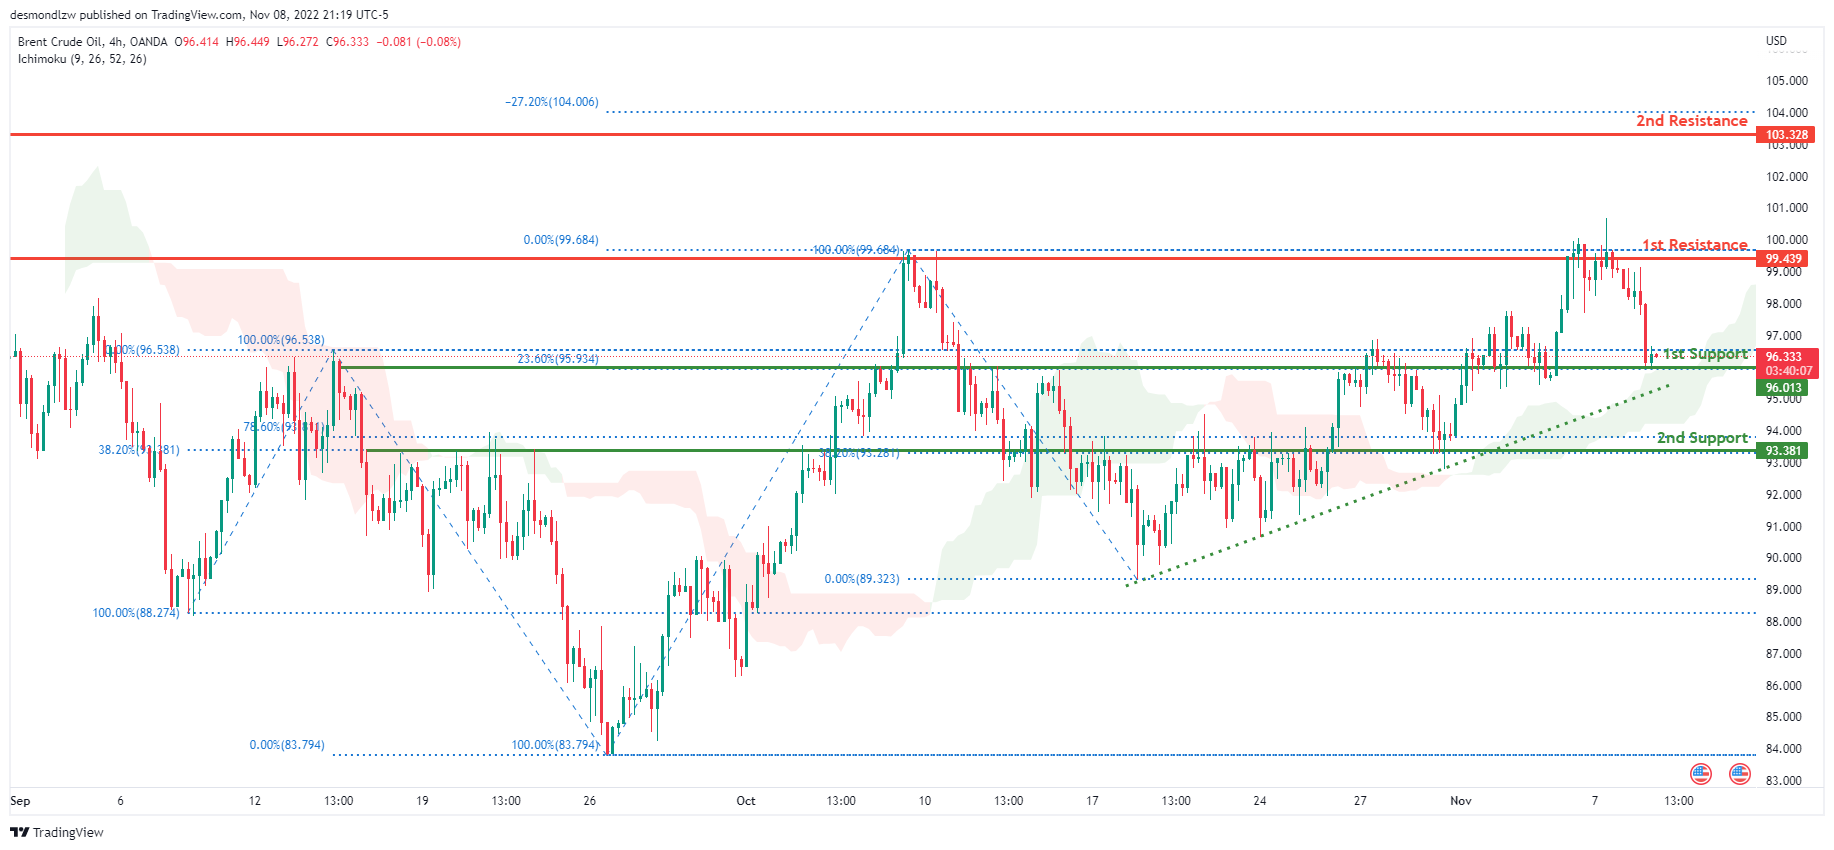
Looking at the H4 chart, the current overall bias for Oil is bullish. To add confluence to this, the price is above the Ichimoku cloud which indicates a bullish market. Overnight, price had bearish momentum downwards with the price currently resting on the 1st support line at 96.013 where the 23.6% and 100% Fibonacci lines are located. The price is currently trading at 96.333 at the time of writing. If this bullish momentum continues, expect price to possibly head back up towards the 1st resistance at 99.439 where previous swing high and 0% Fibonacci line is located. In an alternative scenario, price could head back down to break the 1st support level before heading towards the 2nd support level at 93.381 where the 38.2% and 78.6% Fibonacci lines are located.
Areas of consideration:
- H4 time frame, 1st resistance at 99.439
- H4 time frame, 1st support at 96.013
- H4 time frame, 2nd support at 93.381
Dow Jones Industrial Average:
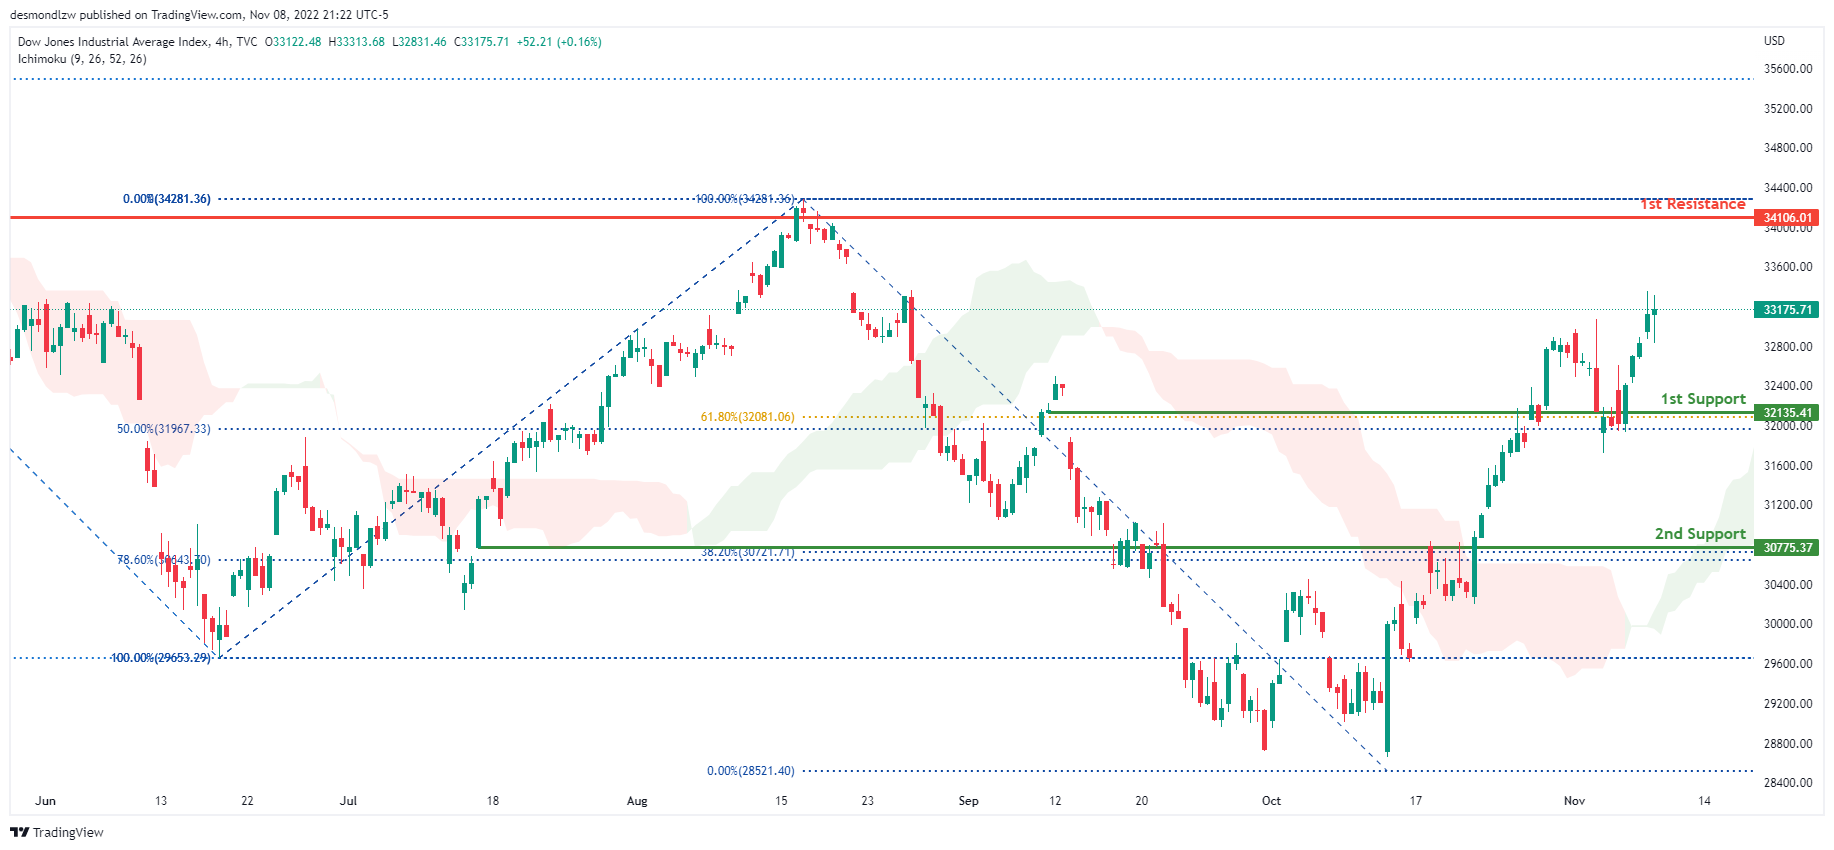
On the H4 chart, the overall bias for DJI is bullish. To add confluence to this, the price is above the Ichimoku cloud which indicates a bullish market. Overnight, price continued its bullish momentum upwards. The price is currently trading at 33175.71 at time of writing. If this bullish momentum continues, expect the price to possibly head towards the 1st resistance at 34106.01 where the previous high and 100% Fibonacci line is located. In an alternative scenario, price could head towards the 1st support line at 32135.41, where the 61.8% and 50% Fibonacci lines are located.
Areas of consideration:
- H4 time frame, 1st support at 32135.41
- H4 time frame, 1st Resistance at 34106.01
DAX:
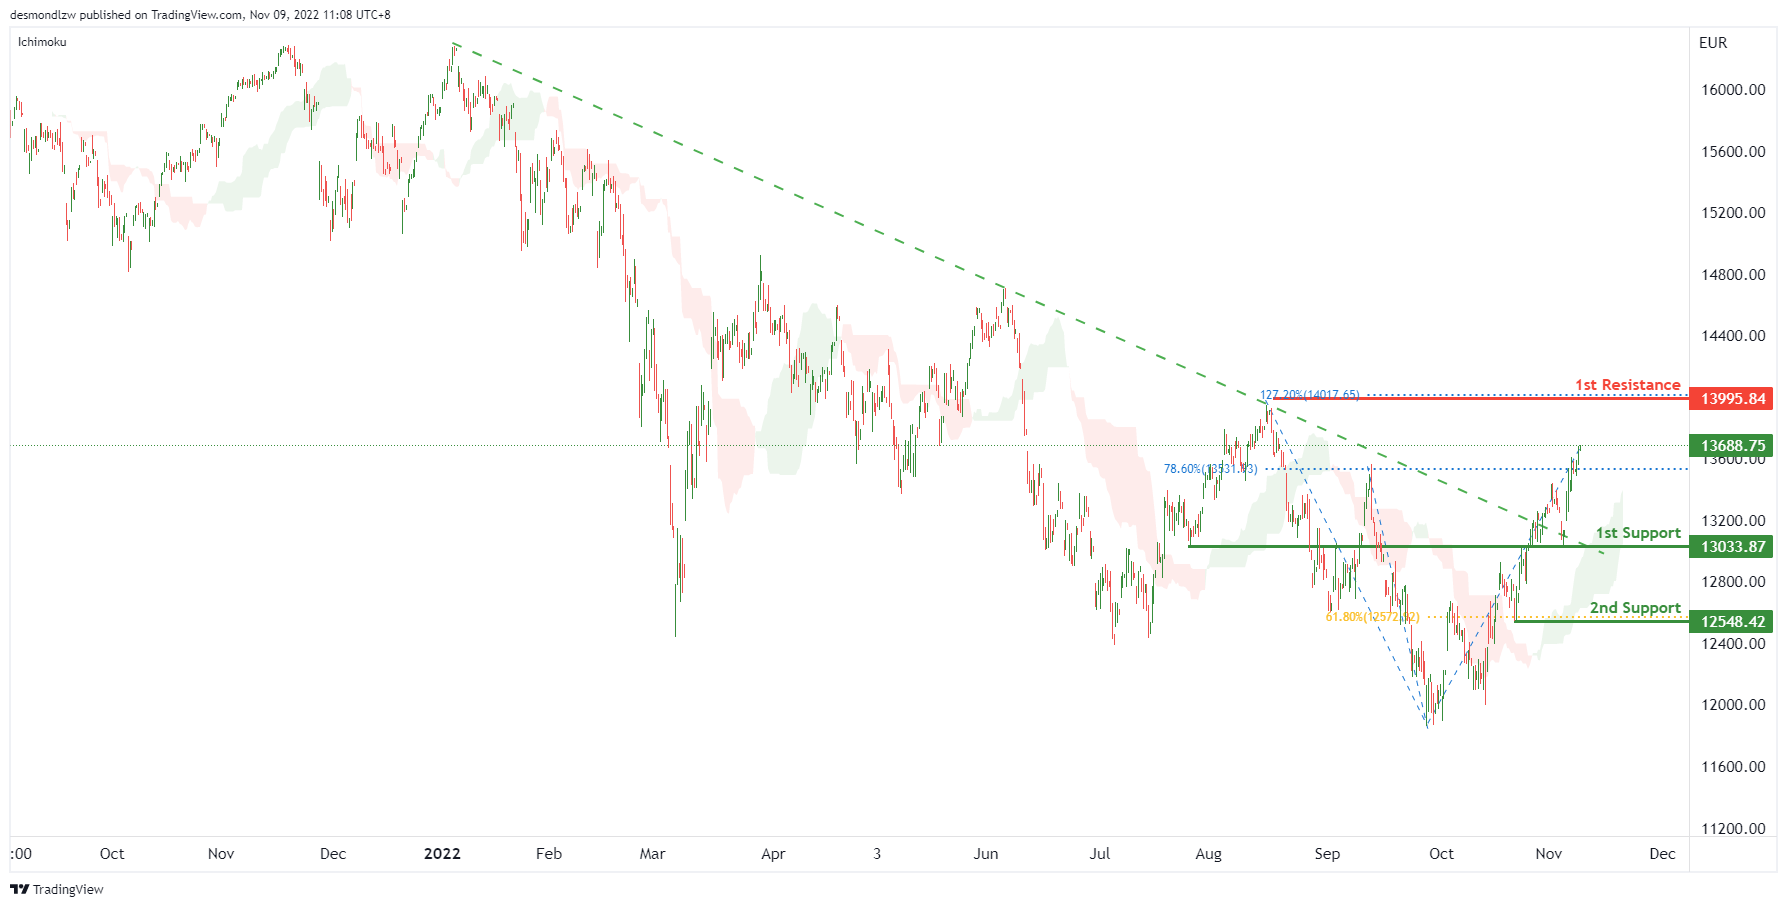
On the H4 chart, the price breaks a descending trendline. Expecting price to possibly continue this bullish momentum and rise to the 1st resistance is at 13995.84, where 127.2% fibonacci extension sits. Alternatively, the price may drop to the 1st support at 13033.87, which is in line with the previous swing low, if the 1st support is broken, the 2nd support is at 12548.42, which is in line with the 61.8% fibonacci retracement.
Areas of consideration:
- H4 time frame, current price
- H4 time frame, 1st resistance is at 13995.84
ETHUSD:
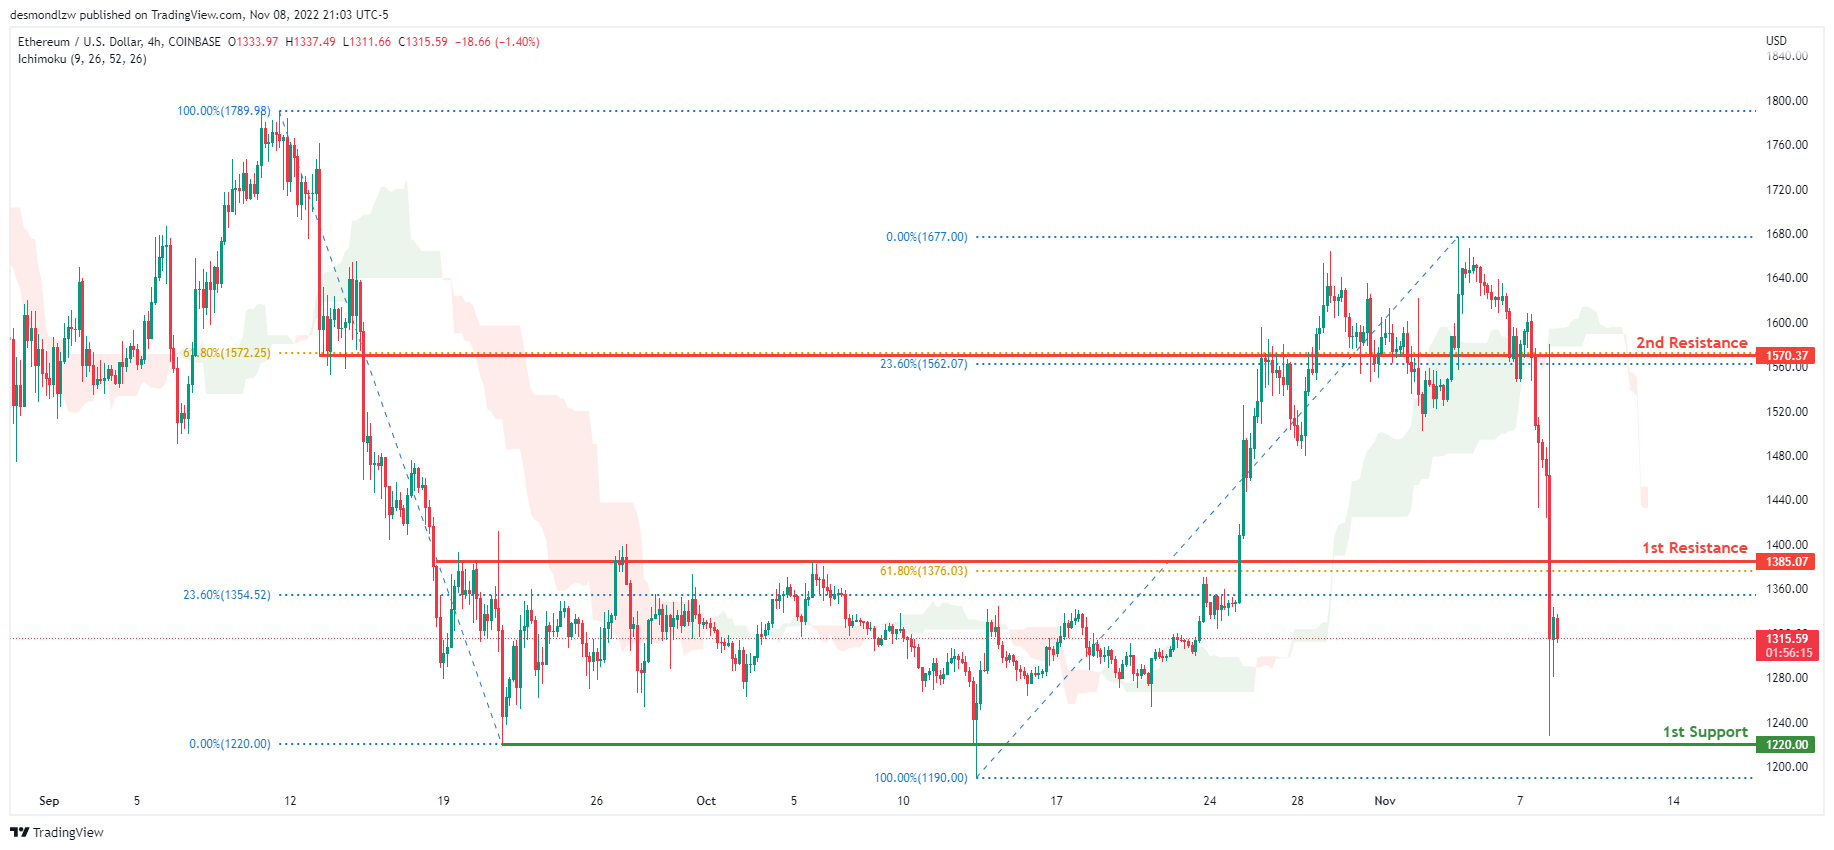
Looking at the H4 chart, the current overall bias for ETHUSD is bearish, with price currently under the Ichimoku cloud indicating a bearish market. Overnight, prices had huge bearish momentum downward. The price is currently trading at 1317.43 at the time of writing. If this bearish momentum continues, expect the price to head towards the 1st support line at 1220.00 where the previous low and 100% Fibonacci line is located. In an alternative scenario, price could head back up to retest the 1st resistance line at 1385.07 where the 23.6% and 61.8% Fibonacci lines are located.
Areas of consideration:
- H4 time frame, 1st resistance of 1385.07
- H4 time frame, 1st support at 1220.00
BTCUSD:
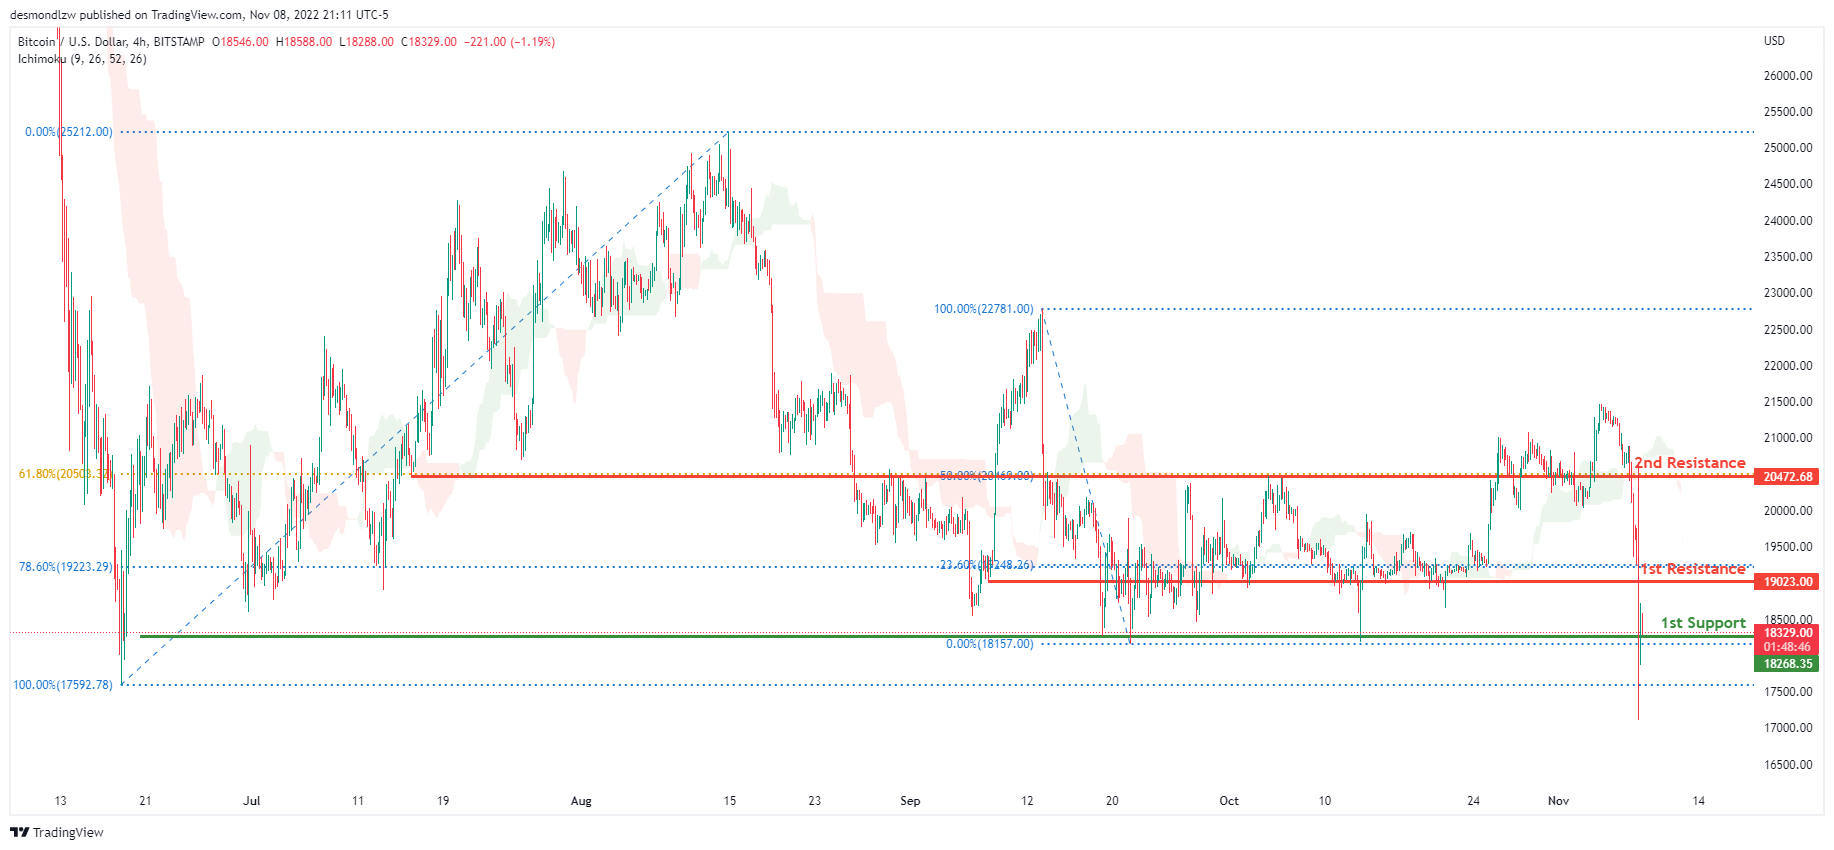
On the H4 chart, the overall bias for BTCUSD is bearish. To add confluence to this, the price is below the Ichimoku cloud which indicates a bearish market. Overnight, price continued its huge downwards bearish momentum with price currently resting on the 1st support line. Price is currently trading at 18357.00 at time of writing. If this bearish momentum continues, expect the price to break the 1st support line at 18268.35 where the previous low is located. In an alternative scenario, price could retrace back up to retest the 1st resistance line at 19023.00, where the 23.6% and 78.6% Fibonacci lines are located.
Areas of consideration:
- H4 time frame, 1st resistance 19023.00
- H4 time frame, 1st support at 18268.35
S&P 500:
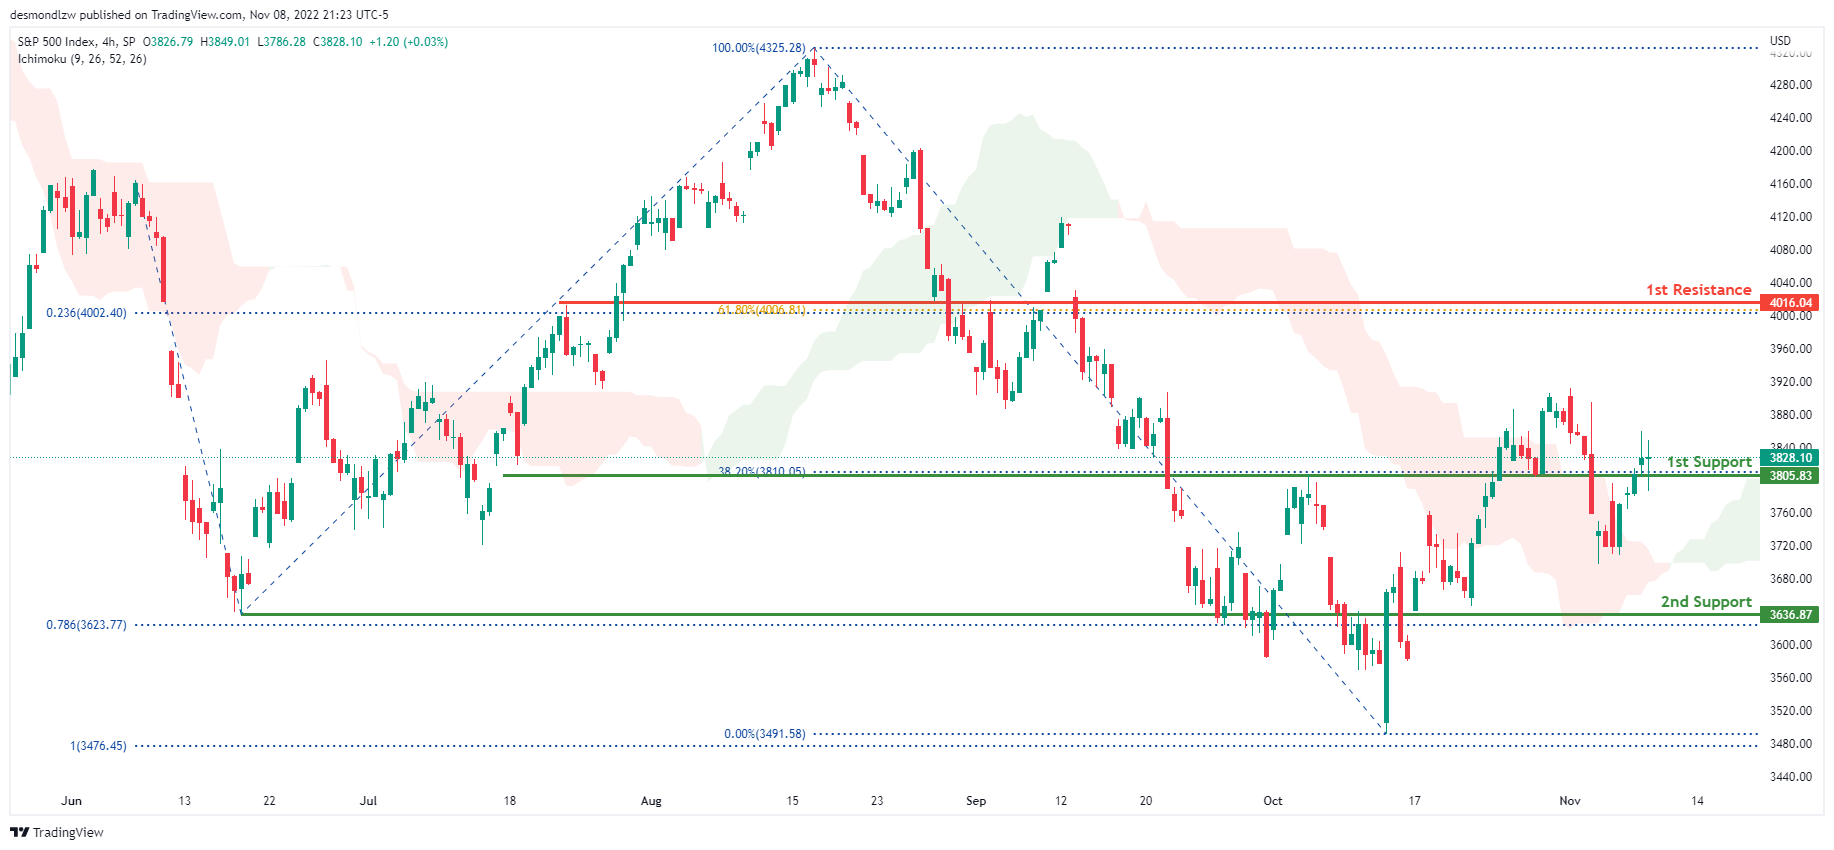
On the H4 chart, the overall bias for S&P500 is bullish with price currently crossing above the Ichimoku cloud. Overnight, price had bullish momentum with the price closing above the 1st support at 3805.83 where the 38.2% Fibonacci line is located. The price is currently trading at 3828.10 at time of writing. If bullish momentum continues, expect price to head towards the 1st resistance line at 4016.04, where the 23.6% Fibonacci projection line and 61.8% Fibonacci line is located. In an alternative scenario, price could possibly head back down and break the 1st support line and head towards the 2nd support line at 3636.87 where the previous swing low and 78.6% Fibonacci projection line is located.
Areas of consideration:
- H4 time frame, 1st support at 3805.83
- H4 time frame, 2nd support at 3636.87
- H4 time frame, 1st resistance at 3805.83
Gold Price Rallies Above $1,700, Oil Price Dips
Key Highlights
- Gold price started a fresh increase above the $1,700 resistance.
- It broke a crucial bearish trend line with resistance near $1,650 on the 4-hours chart.
- Crude oil price failed to clear the $94 resistance zone.
- EUR/USD eyes a clear upside break above the 1.0120 resistance.
Gold Price Technical Analysis
Gold price formed a base above the $1,620 level against the US Dollar. The price formed a top near $1,729 and started a downside correction.
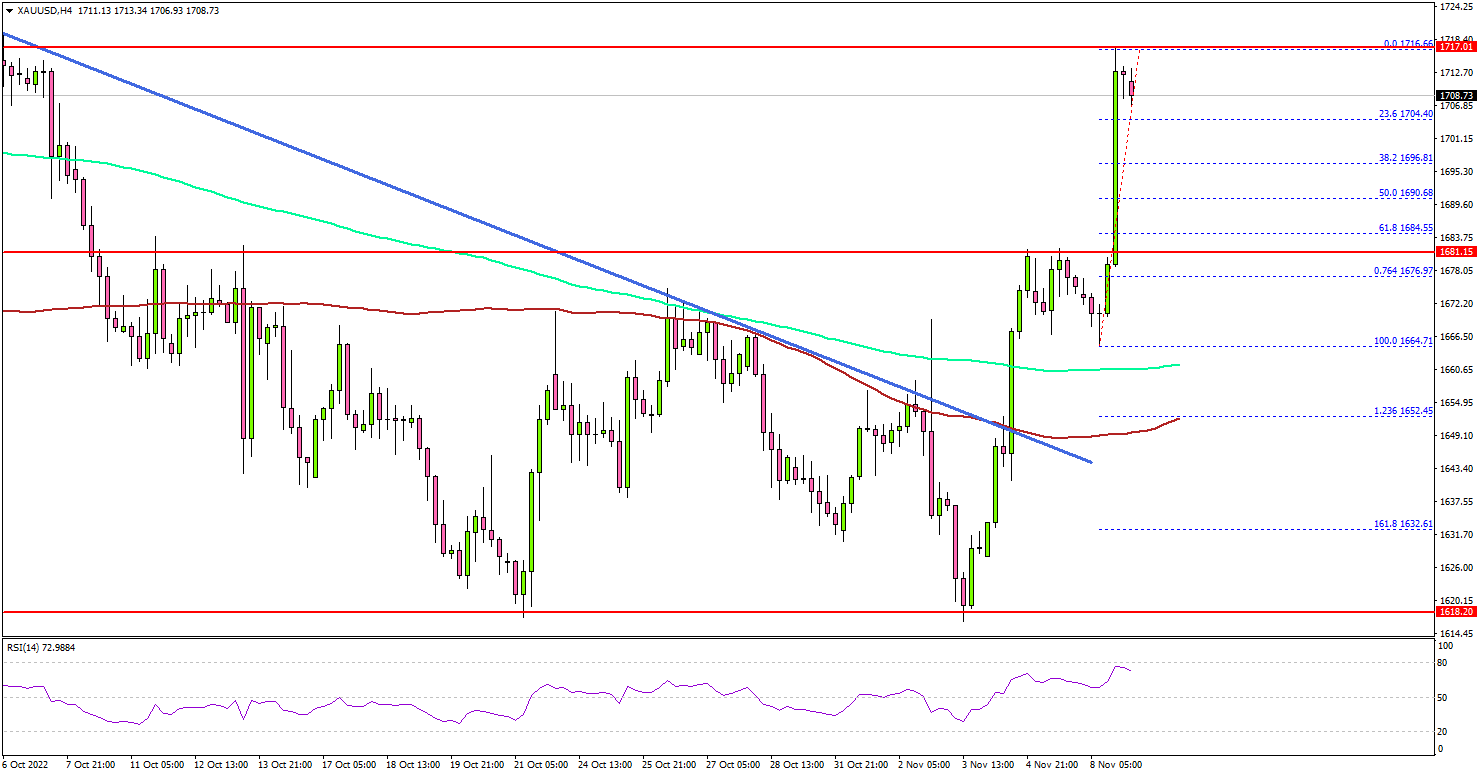
The 4-hours chart of XAU/USD indicates that the price gained pace above the $1,650 resistance zone. There was also a move above a crucial bearish trend line with resistance near $1,650.
It opened the doors for more gains above $1,680, the 100 simple moving average (red, 4-hours), and the 200 simple moving average (green, 4-hours). The bulls even pumped the price above the $1,700 resistance zone.
The price tested the $1,715 resistance zone and is currently consolidating gains. On the downside, an initial support is near the $1,700 level.
The next major support is near the $1,690 level or the 50% Fib retracement level of the upward move from the $1,664 swing low to $1,716 high, below which the price could accelerate lower. In the stated case, the price may perhaps decline towards the $1,650 level.
On the upside, the price might face sellers near the $1,715 level. The next major resistance is near the $1,725 level. Any more gains might send the price towards the $1,750 resistance level, above which gold price might revisit the $1,780 resistance.
Looking at crude oil price, there was a failed attempt to surpass the $94 resistance and the price reacted to the downside.
Economic Releases to Watch Today
- US Wholesale Inventories for Sep 2022 – Forecast +0.8%, versus +0.8% previous.
Sunset Market Commentary
Markets
We’ll dive into some central bank comments in absence of other stories in today’s rangebound, waiting game session. ECB vice-chair de Guindos didn’t provide much guidance when it comes to future interest rates. He went with the data dependence line saying the rate peak will depend on the data that the ECB receives, the evolution of inflation, economic conditions, demand and energy prices. Headline and core inflation will remain very high next year even if he expects to see some topping off in H1 2023. On quantitative tightening, he prefers the start of a passive version in 2023 by not fully reinvesting the maturing securities in the APP portfolio. Over the next 12 months, APP redemptions average around €30bn with a minimum amount of €15bn. Assuming that the latter serves as a monthly floor, the APP portfolio could shrink some €180bn in its first year, which is slightly over 5% of the €3.2tn bond portfolio. German Bundesbank Nagel was more aggressive on the rate topic. More rate hikes are needed to bring down inflation and the ECB mustn’t let up too early on normalization even if that weighs on growth. The latter marks a contrast with Bank of England’s Chief Economist Pill. He thinks that the BoE should try to manage the recession, not cause one. Additionally, he’s not convinced that front-loading rate hikes has a big impact in reining in inflation expectations. The BoE in his view already did a big part of the heavy lifting. Rates may rise further from the current 3%, but unlike the ECB, the UK central bank seems to be thinking about the end point.
Above-mentioned comments have no market impact. This week’s key events are tonight’s US mid-term elections and Thursday’s US CPI print. Republicans are expected to flip the House while the Senate remains a toss-up. In October US inflation numbers, we might see more evidence of topping of headline inflation but accelerating underlying core inflation. Such combo could keep 75 bps December Fed rate hike bets alive given ongoing labour market strength. The German yield curve flattens in a daily respective with yields around 3 bps higher at the front end of the curve and down 2 bps at the very long end. US yields drop 2 to 3 bps across the curve. European bourses record gains of up to 0.5% with key US indices opening mixed. EUR/USD switches sides around parity with EUR/GBP up a few ticks at 0.8740. We recently mentioned outperformance of smaller currencies, including CEE FX. The Czech koruna, Polish zloty and Hungarian forint today trade in the defensive with technical elements likely at play. EUR/CZK bounced off the April/July/August bottom of 24.25. EUR/PLN approached, but didn’t really test 4.65 support before today’s counter towards 4.70. EUR/HUF for now fails to take out 400 support (previous cycle high & incoming upward trend line).
News Headlines
Ireland’s Foreign Minister Coveney said the UK’s new government under Sunak provides an opportunity to strike a deal in the standoff between the EU and UK over Northern Ireland’s trade arrangements. According to Coveney, a settlement is doable by the end of the year, citing “a real intent in London to try to resolve the protocol issues through negotiation.” The stalemate also comes with consequences for the formation of a Northern Ireland government as the DUP refuses to join the power-sharing executive until the protocol is scrapped or meaningfully altered. NI elections were held back in May but new elections under UK law are due within 12 weeks of October 28. But the Secretary of State for Northern Ireland has already ruled out elections happening this year.
The Czech National Bank’s foreign exchange reserves dropped by 4.4bn euros in October to 131.63bn euros. The CNB started intervening in FX markets in May to prevent a weakening Czech koruna from further fueling inflation. Reserves since then have dropped by almost 30bn euros, or some 18% of the total amount. In May/June this year, the CNB put a bottom below the koruna around EUR/CZK 24.75. From August, it targeted the EUR/CZK 24.65 area. The Czech currency today is trading at EUR/CZK 24.33, matching the temporary CZK highs seen last summer.
Dollar Gears Up for Another Crucial US Inflation Report
The latest batch of US inflation data will be released at 13:30 GMT Thursday, and will be absolutely crucial for the dollar's fortunes. Inflation is expected to have cooled, but not significantly, keeping the Fed on track to continue raising rates. As for the dollar, while the outlook remains positive, we seem to be entering the final phase of this uptrend.
Risk management
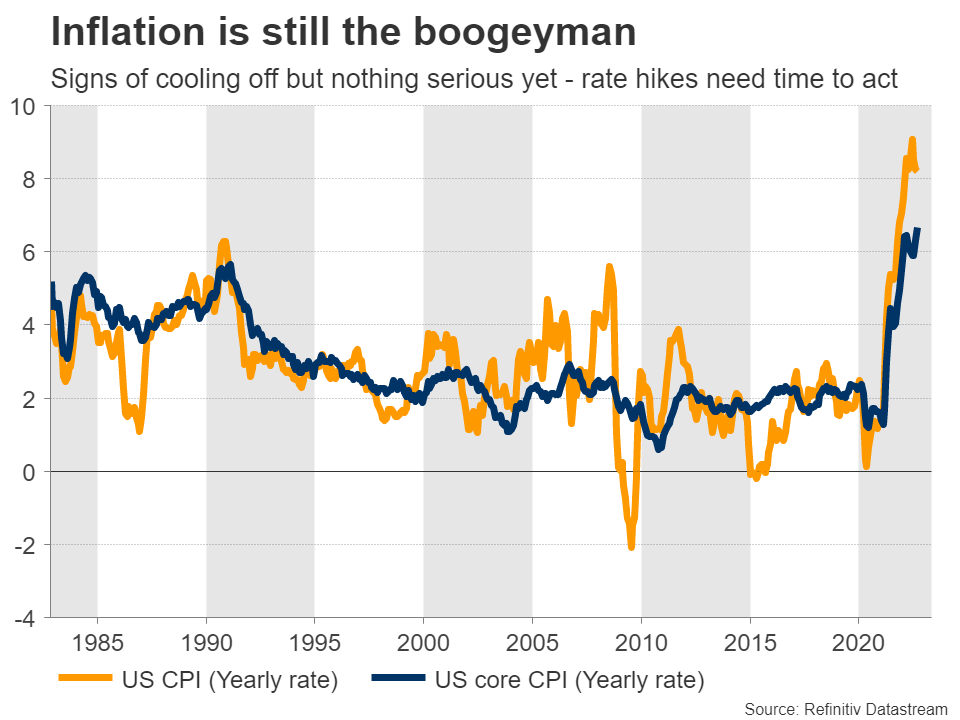
Inflation remains the boogeyman for consumers and financial markets alike. Despite a barrage of powerful rate increases by the Fed this year, which were meant to cool demand and by extension price pressures, there hasn't been any serious improvement in inflation yet.
Some of that is a story of data lags - inflation is a lagging indicator after all. It naturally takes some time before all the rate increases filter their way through the economy. This is especially true in the United States since most loans are given with fixed interest rates, so it takes longer before higher rates can impact economic activity.
Nevertheless, the Fed is determined to get the job done. Last week, Chairman Powell emphasized that his central bank is operating with a risk management approach, whereby it is preferable to over-tighten and risk causing a recession, rather than under-tighten and leave inflation unchecked for years.
Markets seem to have absorbed this message, as the federal funds rate is currently priced to peak around 5.1% early next year.
Simmering down
In October, the CPI rate is forecast to have fallen to 8%, from 8.2% previously. The core rate is expected to have declined one tick, reaching 6.5% on a yearly basis. Such numbers would be a step in the right direction, but not meaningful enough to alter the Fed's battle plan.
As for any surprises, the tea leaves point to softer-than-expected numbers. Business surveys from S&P Global revealed that businesses raised their selling prices at the slowest pace in almost two years, while used car prices continued to decline, alongside shipping costs.
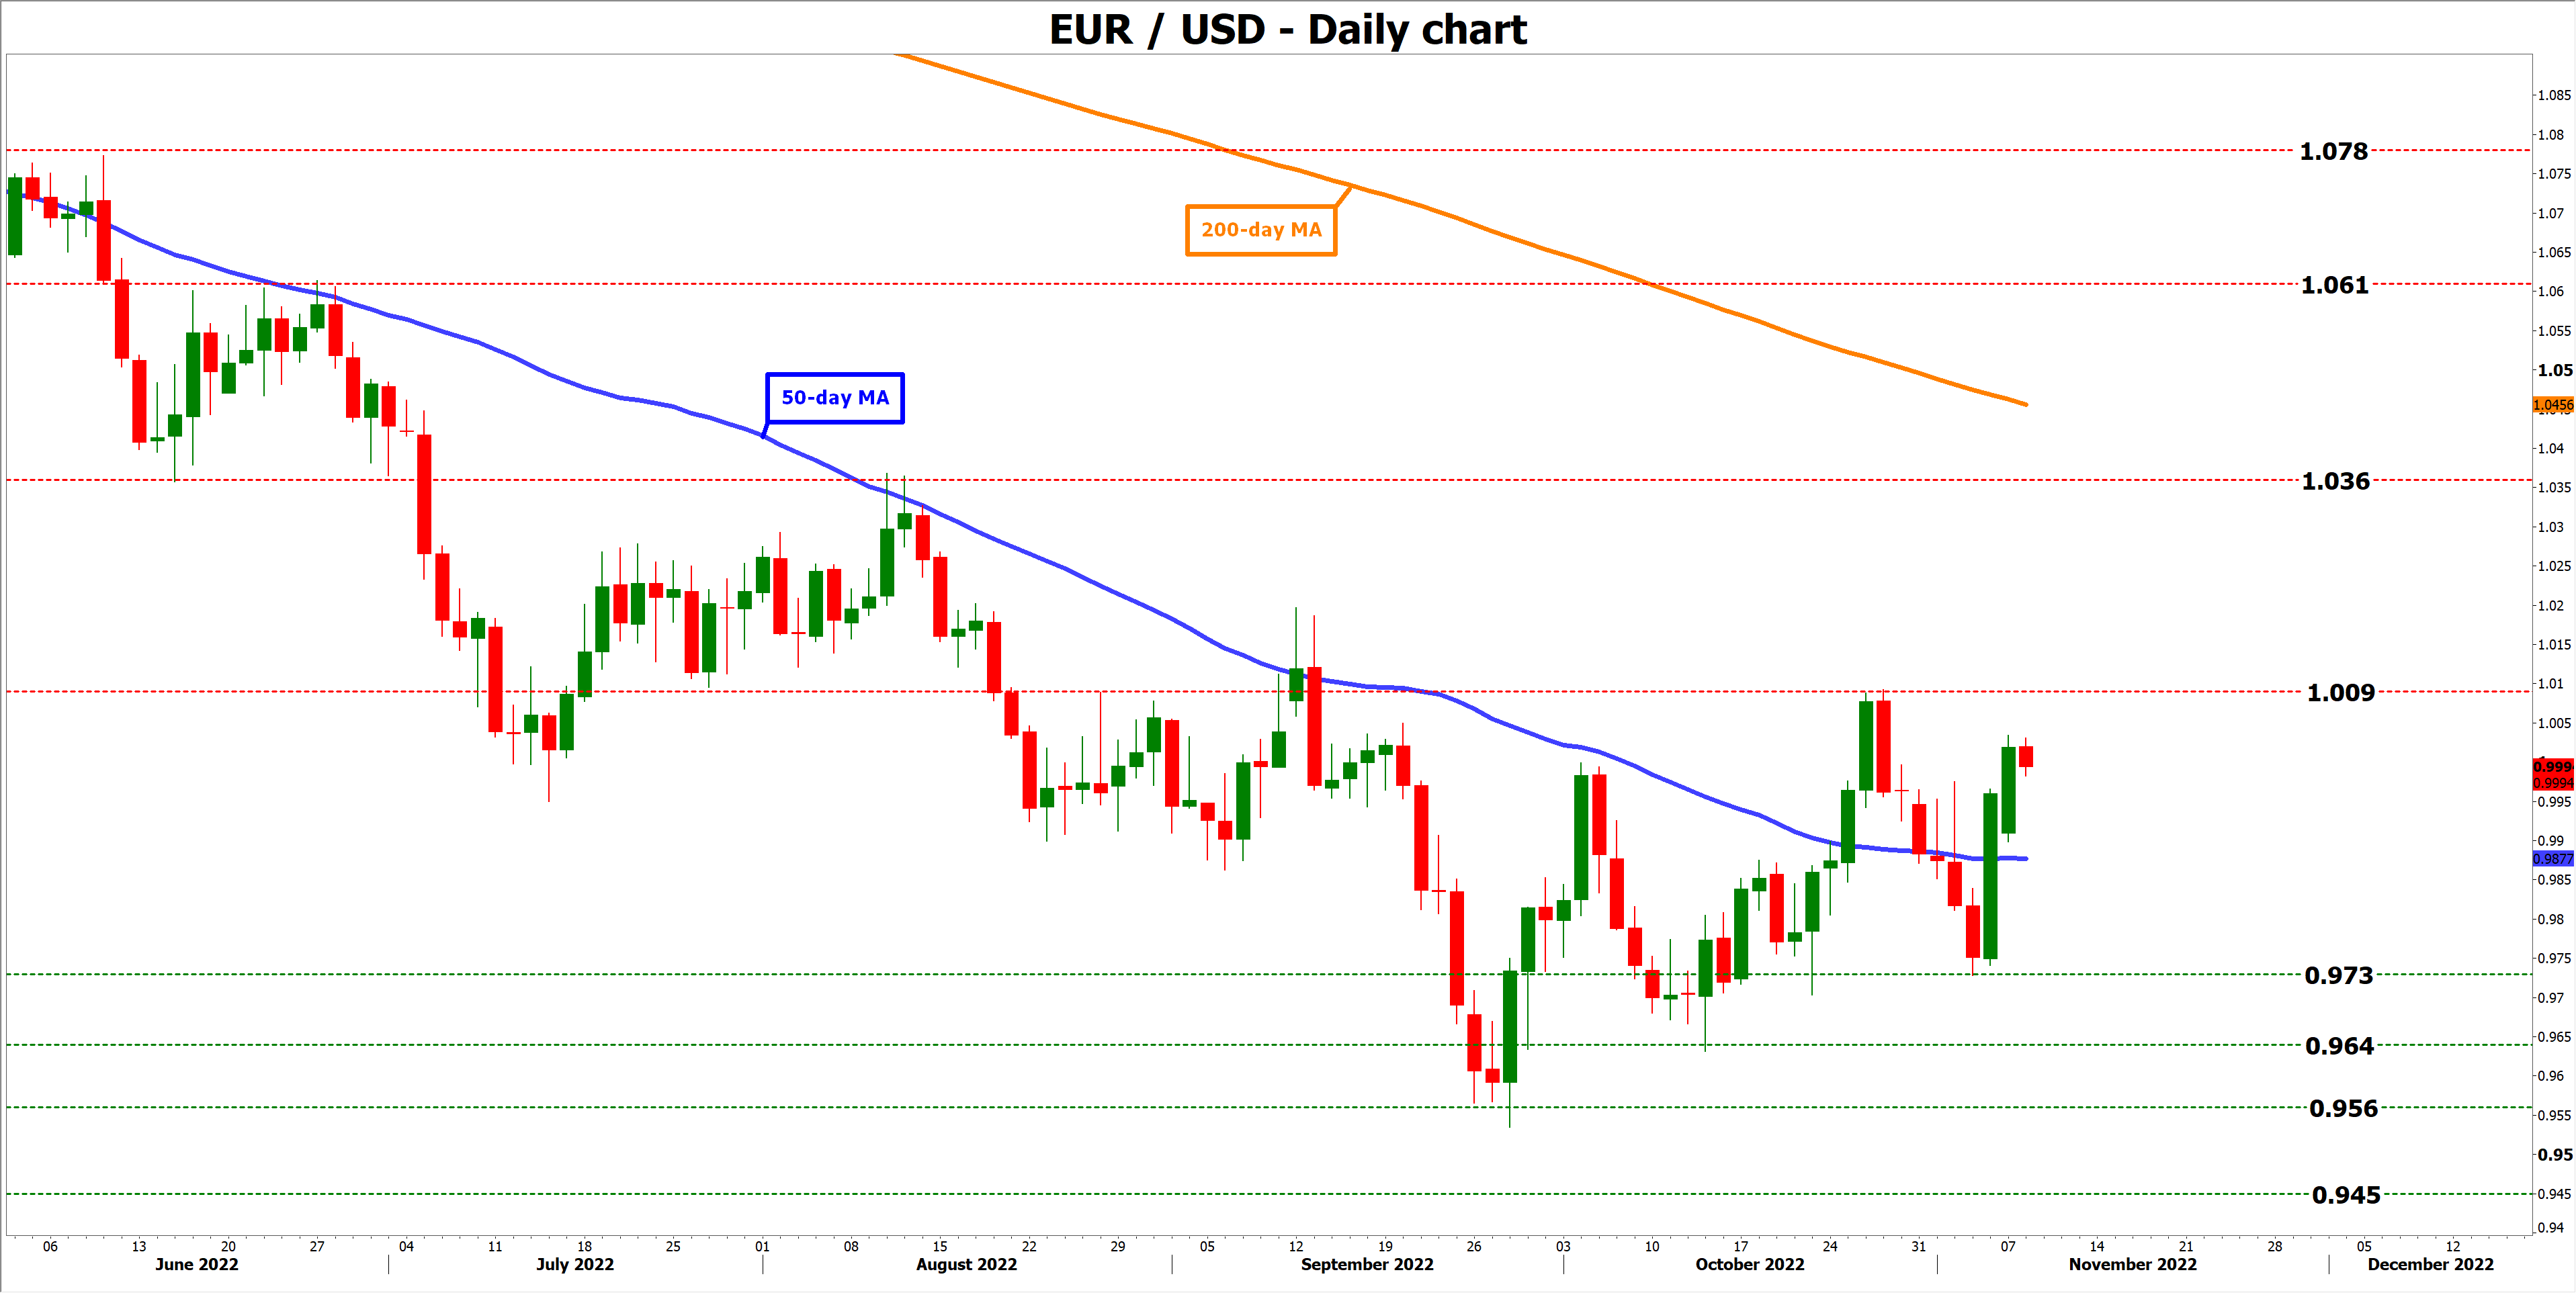
Markets are currently leaning towards a smaller rate hike in December and a setback in inflation could cement this prospect, dealing a blow to the dollar. In this case, euro/dollar could edge higher to initially challenge the 1.0090 region.
The uncertainty revolves around the bigger categories such as rents, which single-handedly account for one-third of the CPI basket. Rents follow trends in house prices but with a lag of several quarters, so they might continue to heat up, simply to reflect what house prices were doing last year.
A hotter-than-expected print would likely catch investors off guard, sending euro/dollar lower. The first obstacle to any declines could be the 50-day moving average, currently at 0.9877.
Dollar rally enters 'final act'
As for the dollar, although the outlook remains positive, this rally seems to be entering its final stages. Whether it happens this month or closer to year-end, there are mounting signs that inflation is cooling down and the Fed is about to shift into lower gear with its rate increases.
With the Democrats about to lose control of Congress too, big spending packages won't happen in the next couple of years, which also argues for softer inflation and smaller Fed hikes moving forward. And since 'long dollar' is already such a crowded trade, any unwinding could be brutal.
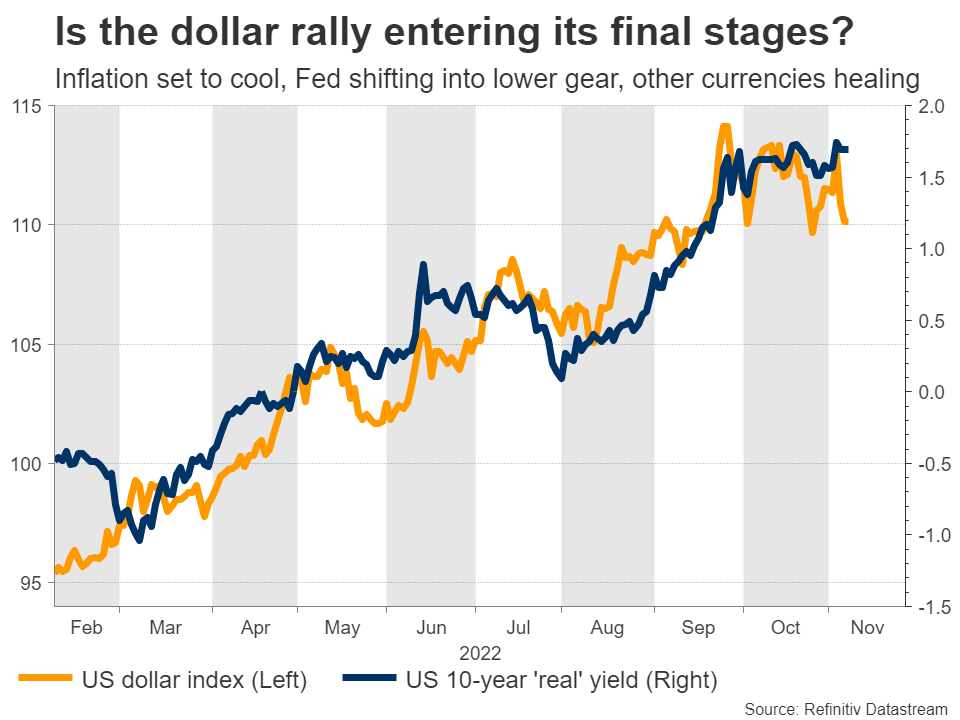
Meanwhile, the fundamentals of other major currencies have started to improve, with sharp declines in European energy prices, nerves around the UK fiscal outlook calming down, and the Bank of Japan opening the door for adjusting the yield ceiling strategy that has destroyed the yen.
It's still too early to call for a proper trend reversal, and the dollar could still hit new highs if the global economy continues to deteriorate, but the scope for further gains seems limited from here.
USD/JPY Mid-Day Outlook
Daily Pivots: (S1) 146.02; (P) 147.21; (R1) 147.86; More...
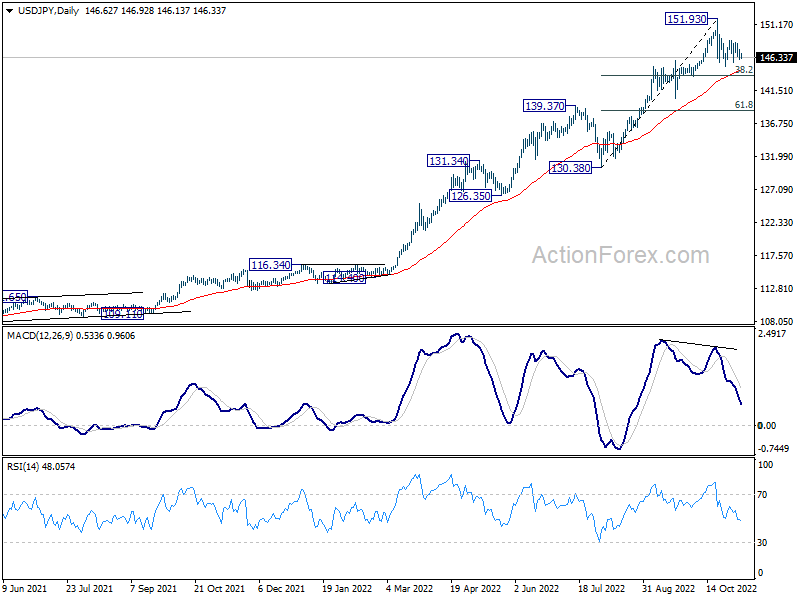
USD/JPY is extending the consolidation from 151.93. Intraday bias stays neutral at this point. In case of deeper fall, downside should be contained by 38.2% retracement of 130.38 to 151.93 at 143.69 to bring rebound. On the upside, above 148.84 minor resistance will bring stronger rebound back towards 151.93 high. But upside should be limited there to continue the corrective pattern.
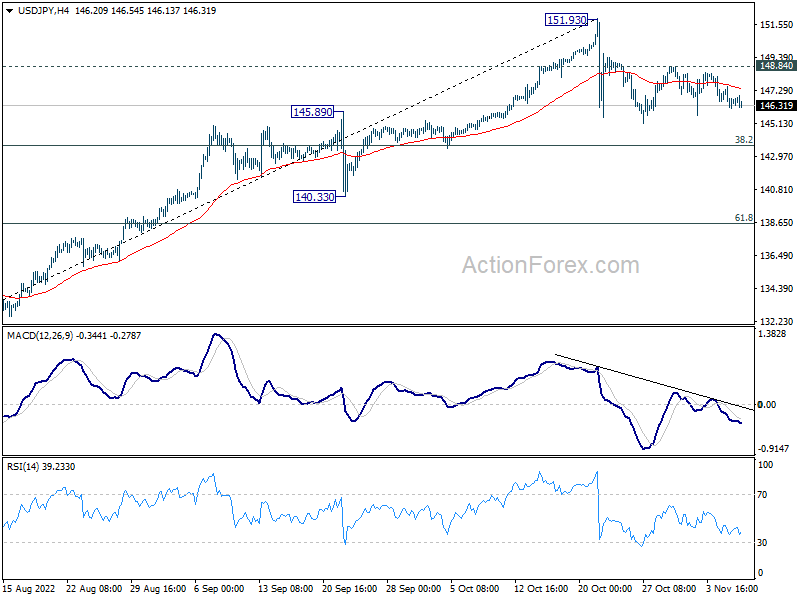
In the bigger picture, up trend from 101.18 is still in progress, as part of the whole up trend from 75.56 (2011 low). 147.68 (1998 high) was already met and there is no clearly sign of topping yet. In any case, break of 140.33 support is needed to be the first sign of medium term topping. Otherwise, further rise is in favor to next target at 160.16 (1990 high).
USD/CHF Mid-Day Outlook
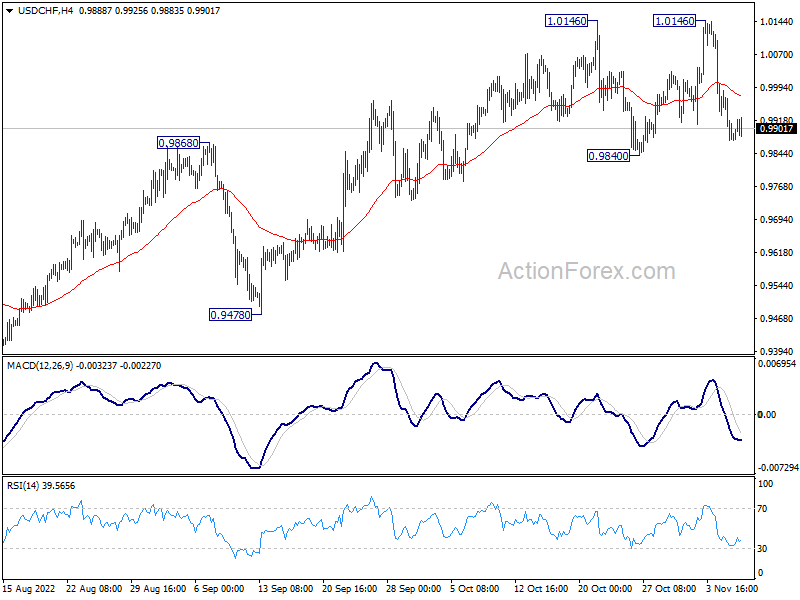
Daily Pivots: (S1) 0.9843; (P) 0.9916; (R1) 0.9957; More...
Range trading continues in USD/CHF and intraday bias remains neutral for the moment. Further rally is expected as long as 0.9840 support holds. Break of 1.0146 will resume larger up trend to 1.0283 projection level. However, sustained break of 0.9840 will now complete a double top pattern, and turn bias back to the downside for 0.9478 support instead.
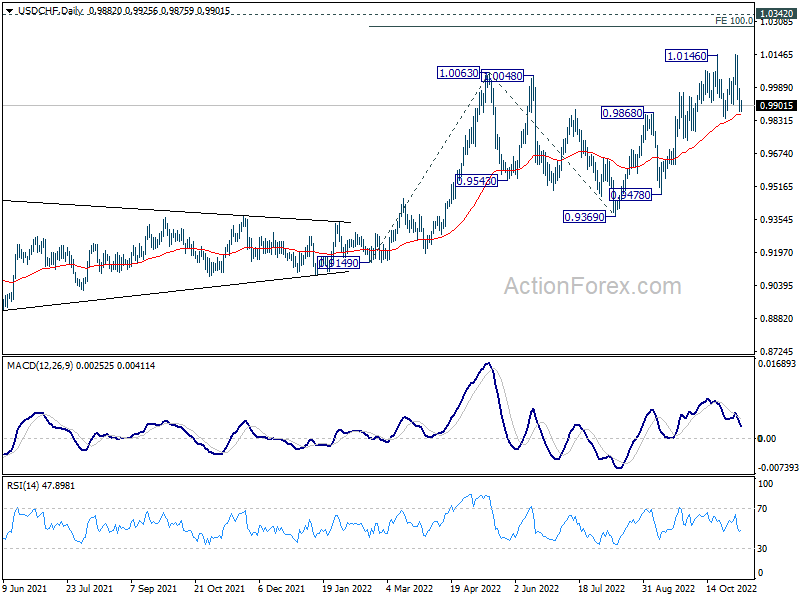
In the bigger picture, up trend from 0.8756 (2021 low) is still in progress. Next target is 100% projection of 0.9149 to 1.0063 from 0.9369 at 1.0283, and then 1.0342 (2016 high). For now, this will remain the favored case as long as 0.9779 support holds, even in case of deep pull back.
GBP/USD Mid-Day Outlook
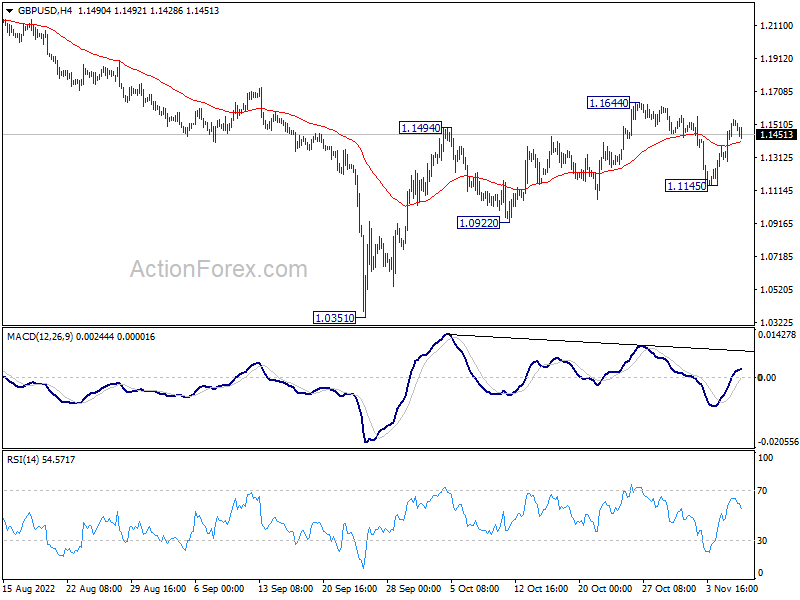
Daily Pivots: (S1) 1.1356; (P) 1.1449; (R1) 1.1607; More...
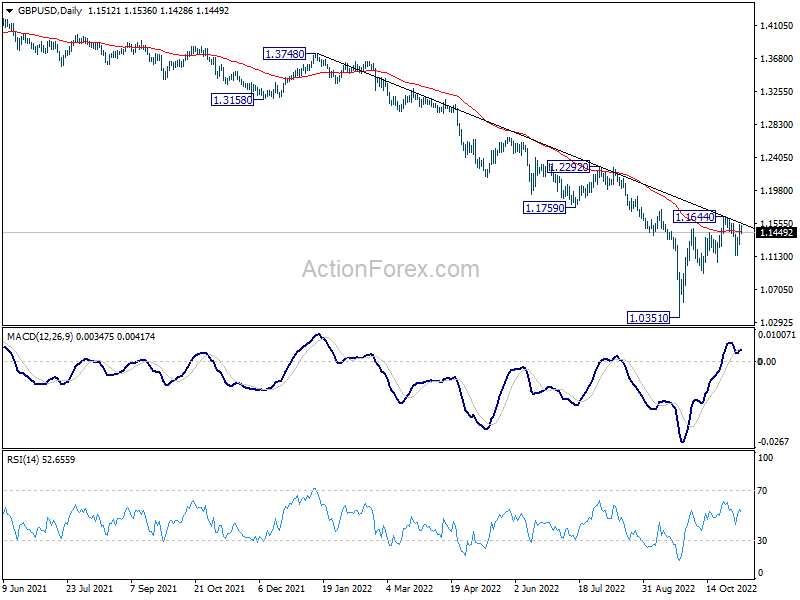
Intraday bias in GBP/USD remains neutral as range trading continues. On the upside, break of 1.1644 will resume the whole rise from 1.0351 and target 1.1759/2292 resistance zone. On the downside, break of 1.1145 will reaffirm the case that corrective rise from 1.0351 has completed at 1.1644. Deeper fall would then be seen back to 1.0922 support and below.
In the bigger picture, fall from 1.4248 (2018 high) is part of the long term down trend from 2.1161 (2007 high). Outlook will stay bearish as long as 1.1759 support turned resistance holds. Parity would be the next target on resumption. Nevertheless, firm break of 1.1759 will confirm medium term bottoming, and open up stronger rise back to 55 week EMA (now at 1.2357).
EUR/USD Mid-Day Outlook
Daily Pivots: (S1) 0.9939; (P) 0.9987; (R1) 1.0068; More...
EUR/USD's rebound lose momentum ahead of 1.0092 resistance and intraday bias remains neutral. On the upside, firm break of 1.0092 will resume the rebound from 0.9534. Next target is 1.0368 resistance. On the downside, break of 0.9729 will reaffirm the case the corrective rise from 0.9534 has completed at 1.0092. Deeper fall would then be seen to retest 0.9534 low next.
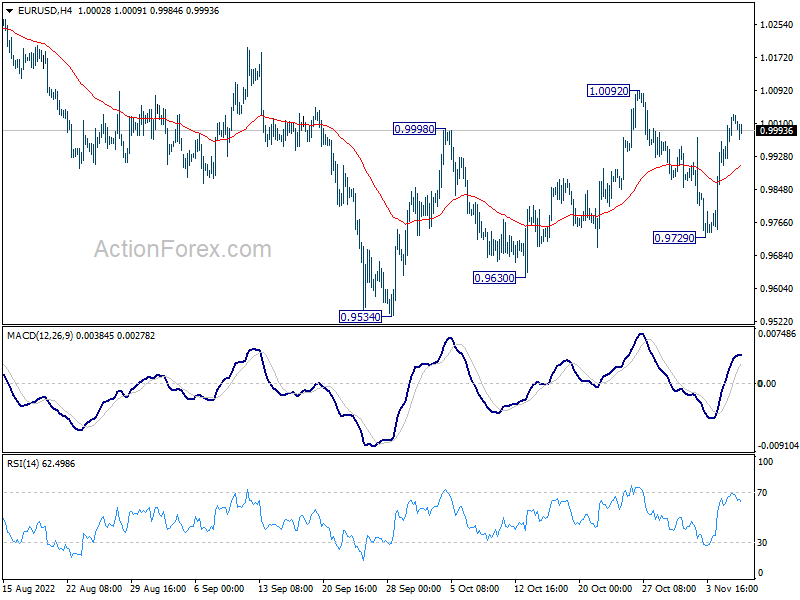
In the bigger picture, medium term outlook stays bearish with trading inside the falling channel. That is larger down trend from 1.2348 (2021 high) is still in progress. Firm break of 0.9534 low will confirm this bearish case. However, break of 1.0092 will add to the case of medium term bottoming, on bullish convergence condition in daily MACD, and bring further rally towards 55 week EMA (now at 1.0583).
