Sample Category Title
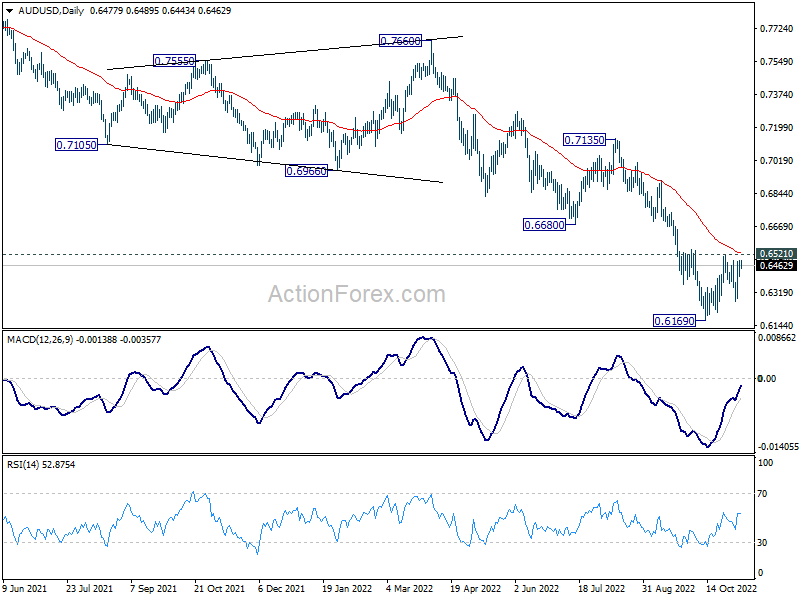
Eurozone retail sales rose 0.4% mom in Sep, EU up 0.4% mom
Eurozone retail sales rose 0.4% mom in September, better than expectation of 0.0% mom. Volume of retail trade increased by 1.0% for non-food products and by 0.4% for food, drinks and tobacco, while it decreased by -0.6% for automotive fuels.
EU retail sales rose 0.4% mom. Among Member States for which data are available, the highest monthly increases in the total retail trade volume were registered in Austria (+3.9%), Malta (+1.7%) and Poland (+1.4%). The largest decreases were observed in Slovenia (-3.7%), Ireland and Portugal (both -2.0%) and Slovakia (-1.3%).
GBPUSD Aims for Bullish Breakout
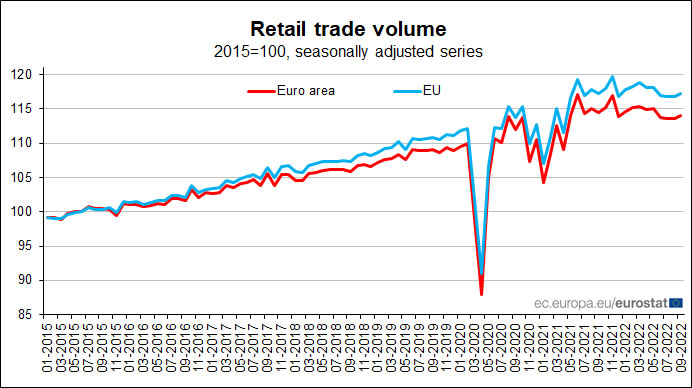
GBPUSD returned to test February's crucial descending trendline near 1.1535 after two strong consecutive bullish days.
The positive intersection between the 20- and 50-day simple moving averages (SMAs), if sustained, could increase hopes for a bullish trend reversal. In other encouraging signs, the RSI keeps hovering above its 50 neutral mark and the stochastics have changed course to the upside. Yet, the MACD has yet to climb above its red signal line, suggesting that further improvement is needed to confirm a bullish bias.
Hence, traders may eagerly wait for a decisive close above the trendline before they target the short-term resistance line near September’s high of 1.1737. Not far above, the 38.2% Fibonacci retracement of the 1.4248-1.0324 downleg could block the way towards the 1.2045-1.2145 constraining zone. Even higher, the spotlight will fall on the 50% Fibonacci of 1.2285, where the 200-day SMA happens to be.
Should the bulls lose control, the price may seek shelter within the 1.1250-1.1200 area formed by two ascending trendlines. Failure to bounce here and a clear extension below 1.1150 could fortify selling pressures towards the 1.0922 low. Beneath the latter, the price could tumble to meet the lower boundary of the broad bearish channel near 1.0660.
In brief, although the technical picture favors the bulls, GBPUSD will need a sustainable rise above 1.1535 to bring new buyers into the market.
EURJPY Trades Sideways after Hitting 8-year High
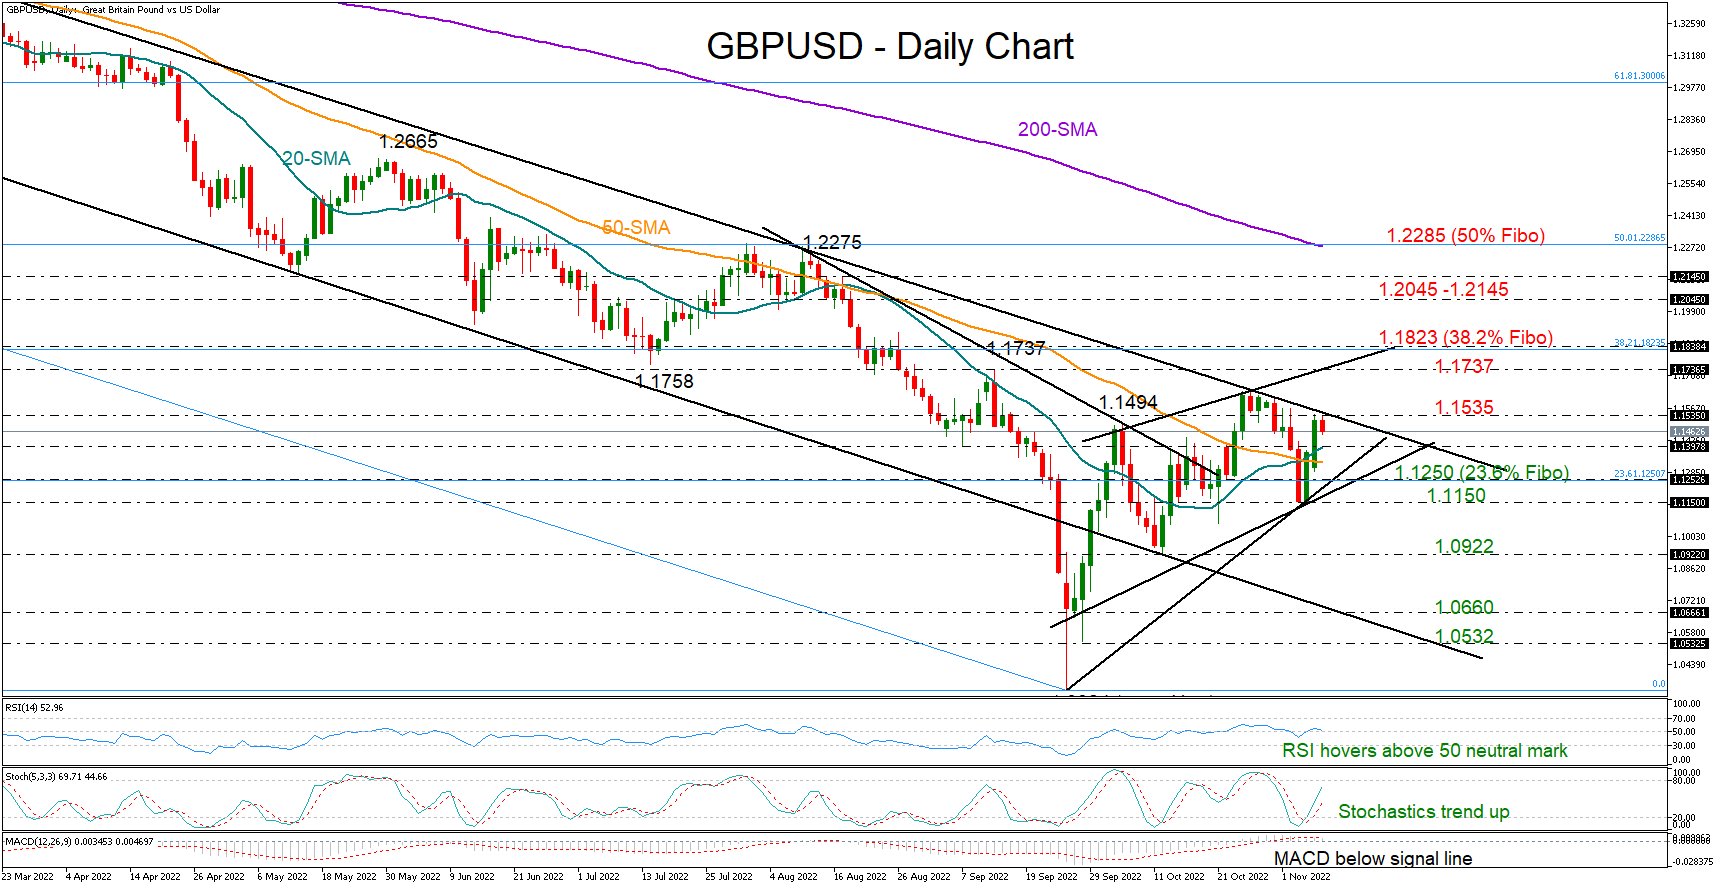
EURJPY has been in a prolonged uptrend since early March, generating consecutive multi-year peaks. However, the pair has been consolidating in the last few daily sessions as its rally paused at the eight-year high of 148.39.
The momentum indicators currently suggest that bullish forces are strengthening. Specifically, the RSI has crossed above its 50-neutral mark, while the stochastic oscillator is surging after bouncing at the 20-oversold zone.
Should the positive momentum intensify, the recent resistance region of 147.75 could act as the first line of defence. A break above the latter might then set the stage for the eight-year high of 148.39. Piercing through that zone, the price could ascend to form fresh multi-year highs, where the December 2014 peak of 149.78 could curb further advances.
On the flipside, if sellers re-emerge and push the price lower, initial support could be met at the 145.62 region, which has acted both as support and resistance in the last couple of months. Diving beneath that region, the bears could aim for the recent support of 144.00 before the 141.00 barrier comes under examination. Even lower, the September low of 137.30 could provide downside protection.
In brief, EURJPY appears to be in a consolidation mode, waiting for developments that could provide fresh directional impetus. Therefore, a break above or below its recent range is likely to be followed by a significant move towards the same direction.
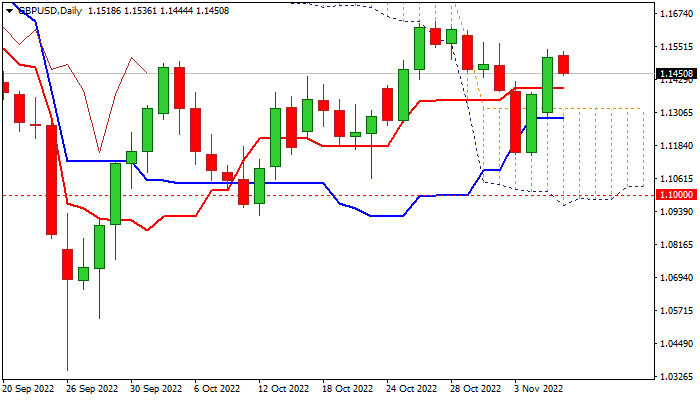
GBP/USD: Near-term Action to Keep Bullish Bias While Holding Above Daily Tenkan-sen
Cable eases in early Tuesday after strong two-day rally, as bulls take a breather on firmer dollar, so far unable to register a clear break above cracked 1.15 barrier.
Fundamentals remain weak as red-hot inflation bites, raising cost of living and hurting consumer spending that results in gloomy short-term outlook, though expectations of a tough budget boost confidence and partially offset negative signals.
Daily techs, on the other side, are so far bullishly aligned and supportive, but the price action needs to hold above daily Tenkan-sen (1.1395) to maintain bullish bias for renewed attack at 1.15 pivot and possible extension towards key barrier at 1.1645 (Oct 27 high).
Caution on break of daily Tenkan-sen, which would weaken near-term structure and expose key supports at 1.1321 and 1.1284 (daily cloud top / daily Kijun-sen).
Res: 1.1500; 1.1541; 1.1566; 1.1645
Sup: 1.1395; 1.1337; 1.1284; 1.1264
AUDUSD: Aussie Keeps Firm Tone Despite Weak Economic Data
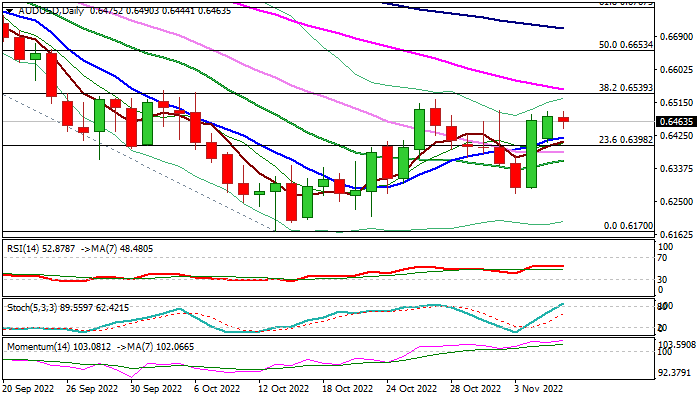
The Australian dollar edges lower from new highest in nearly two weeks in early Tuesday, consolidating strong rally in past two days.
Overbought conditions on daily chart prompted a partial profit taking, though near-term structure remains bullish and so far unharmed from downbeat data which showed Australian consumer confidence falling to multi-year lows, while business activity is showing signs of slowdown due to worsening economic conditions.
Daily technical studies maintain strong bullish momentum and moving averages formed a multiple bull-crosses, underpinning the advance.
Bulls eye key barriers at 0.6522/39 (Oct 27 top / Fibo 38.2% of 0.7136/0.8170 descend) break of which is needed to generate strong bullish signals (on completion of failure swing and violation of pivotal Fibo resistance) for further recovery and test of the base of falling daily cloud (0.6596).
Broken daily Tenkan-sen (0.6397) reverted to strong support which should contain extended dips and keep near-term bulls in play.
Res: 0.6490; 0.6522; 0.6539; 0.6596.
Sup: 0.6444; 0.6397; 0.6387; 0.6358.
EURUSD: Bulls Consolidating Ahead of Fresh Push Higher
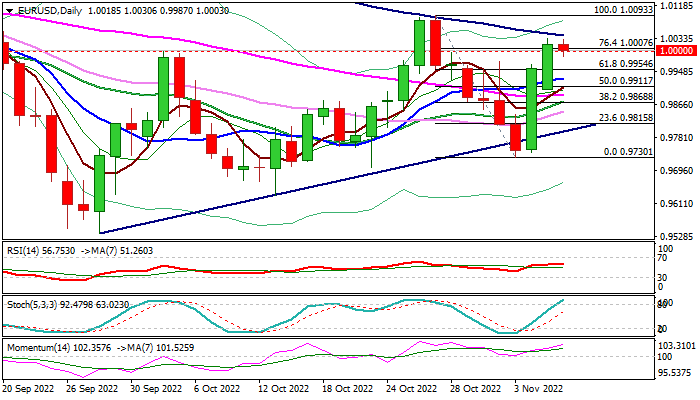
Bulls are taking a breather for consolidation after advancing 2.7% in past two days (Friday’s rally was the biggest daily gain since June 2016).
Initial strong bullish signal was generated on Friday’s close above thick daily cloud and boosted by Monday’s upside extension and close above parity level, suggesting that rally couldextend further.
Bullish daily studies support the action, but overbought conditions may keep bulls on hold for consolidation, after the action faced headwinds on approach to falling 100DMA (1.0041).
Dips should find ground above daily cloud top (0.9954, also broken Fibo 61.8% of 1.0093/0.9730) to keep bullish bias for push through 100DMA and attack at key near-term barrier at 1.0093 Oct 26/27 double-top).
Res: 1.0041; 1.0093; 1.0179; 1.0198.
Sup: 0.9987; 0.9954; 0.9930; 0.9911.
SNB Jordan: Determined action is necessary
SNB Chairman Thomas Jordan, said in a conference, "In an environment such as the one we face today, mixed signals on the persistence of inflation might tempt policymakers to postpone further reaction to inflationary pressures until uncertainty about future inflation has receded".
"Yet uncertainty must not mean indecision. A risk management approach to policy-making sometimes calls for decisive action," he added
"When faced with large shocks that increase the risk of persistent movements of inflation away from the range, determined action is necessary, irrespective of whether these movements are below or above the range," Jordan said.
ECB de Guindos: We will start QT sooner or later, for sure in 2023
ECB Vice President Luis de Guindos said in an interview, "we will continue raising rates to a level that ensures inflation will come back into line with our definition of price stability". The level will depend on " data that we receive, the evolution of inflation, economic conditions, demand, and energy prices."
He expected inflation to hover around its present level of 10.7% "hover the next few months". Inflation will then "start to decline in the first half of next year". Quarterly GDP growth in Q4 will be "negative", and to continue in Q1. This "technical recession" is not expected to be "very profound".
On the topic of quantitative tightening, de Guindos said ECB will start it "sooner or later, for sure in 2023". It must be implemented with "a lot prudence". He expects to start with a "passive QT by not fully reinvesting the maturing securities in our portfolio.". The "characteristics and the timing" of QT will be discussed in December. QT may overlap or not with normalization of interest rates.
USD/CAD Daily Outlook
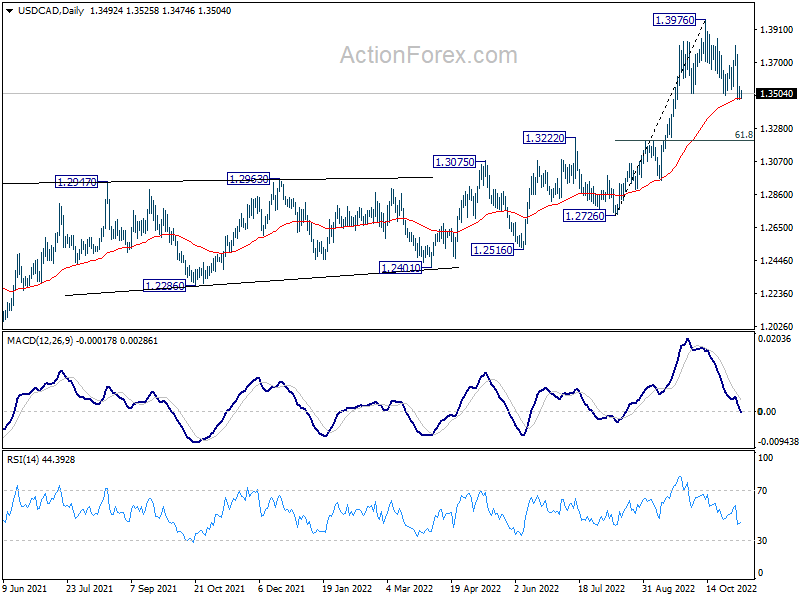
Daily Pivots: (S1) 1.3454; (P) 1.3503; (R1) 1.3541; More....
Intraday bias in USD/CAD remains on the downside for the moment. A head and should top pattern (1.3832; h: 1.3976; rs: 1.3807) should be formed already. Sustained trading below 1.3494 will confirm, and bring deeper fall to .3207 cluster support (61.8% retracement of 1.2726 to 1.3976 at 1.3204. Strong support should be seen there to bring rebound. But for now, risk will stay on the downside as long as 1.3807 resistance holds, in case of recovery.
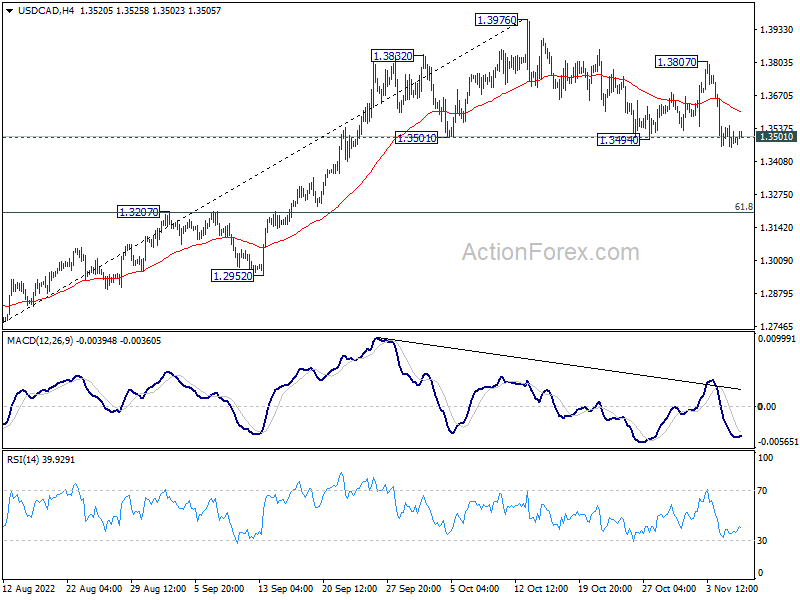
In the bigger picture, up trend from 1.2005 (2021 low) is still in progress. Based on current impulsive momentum, it could be resuming long term up trend from 0.9056 (2007 low). Whether it is or it isn't, retest of 1.4689 (2016 high) should be seen next. This will now remain the favored case as long as 1.3222 resistance turned support holds.
AUD/USD Daily Report
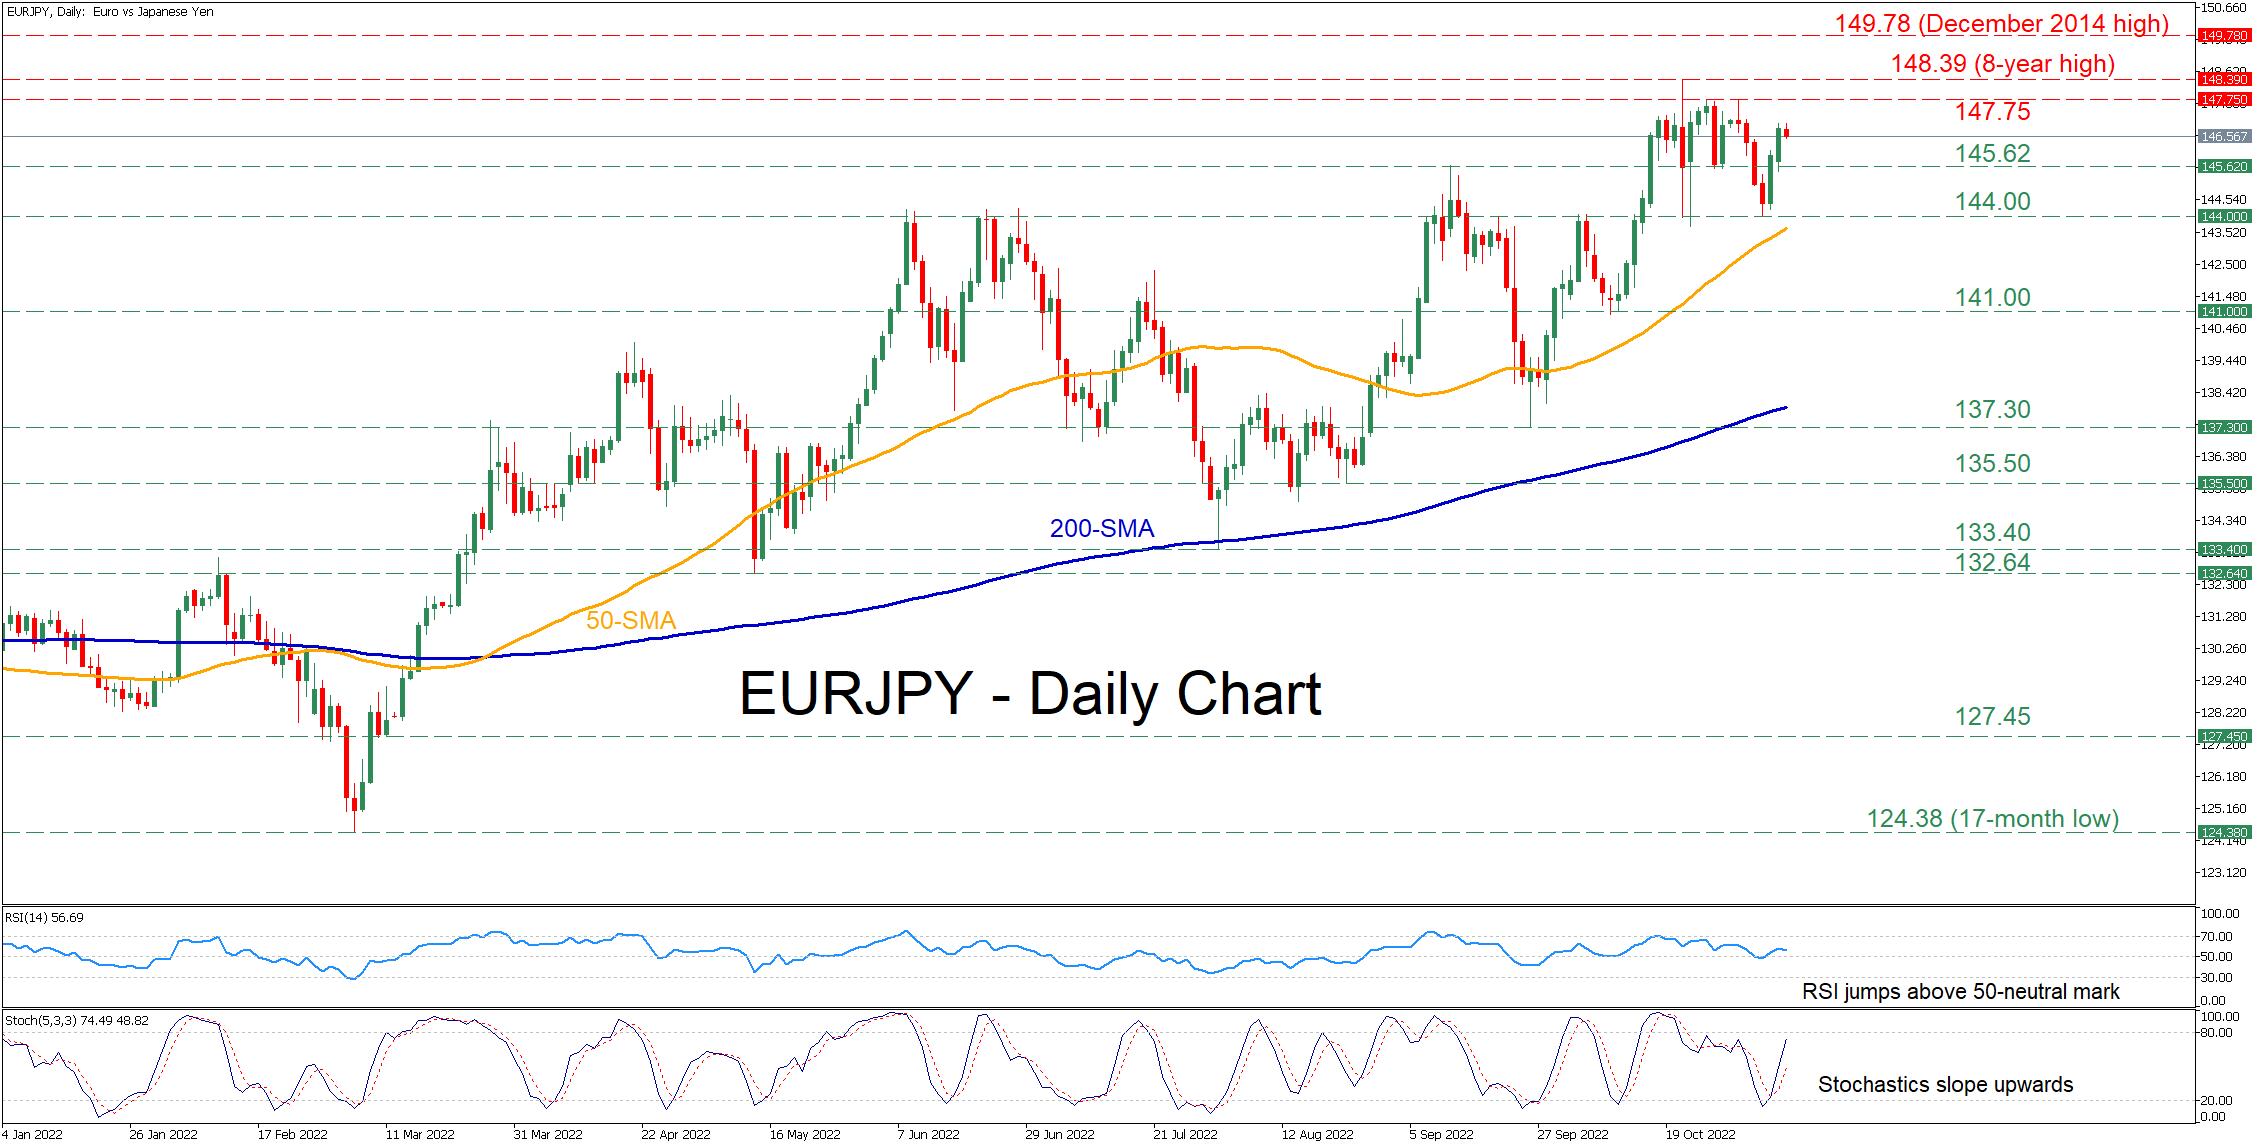
Daily Pivots: (S1) 0.6428; (P) 0.6460; (R1) 0.6512; More...
Intraday bias in AUD/USD stays neutral for the moment. On the upside, decisive break of 0.6521 resistance will now complete a head and shoulder bottom pattern (ls: 0.6362; h: 0.6169; rs: 0.6271). That would also come with sustained trading above 55 day EMA (now at 0.6529). Further rally should then be seen to 0.6680/7315 resistance zone next. On the downside, however, break of 0.6271 will bring retest of 0.6169 low instead.
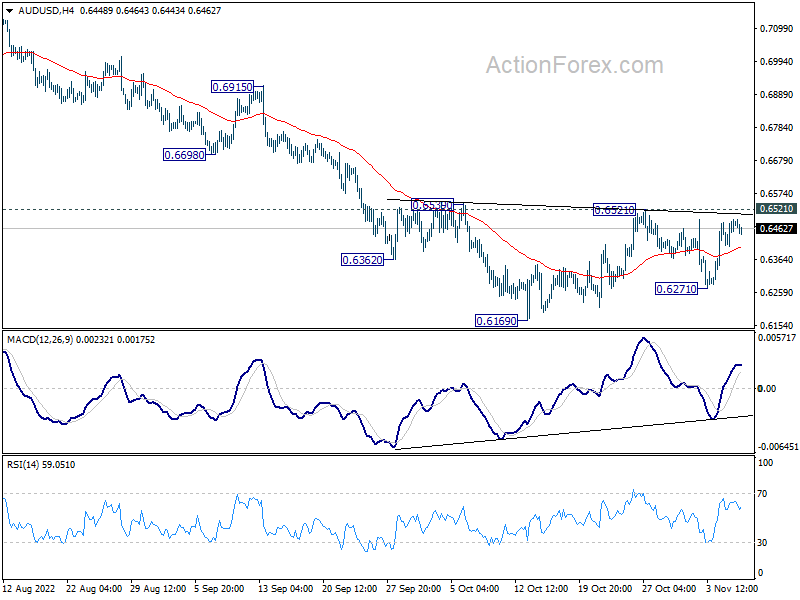
In the bigger picture, down trend from 0.8006 (2021 high) is expected to continue as long as 0.6680 support turned resistance holds. Medium term momentum remains strong and retest of 0.5506 (2020 low) cannot be ruled out. But firm break of 0.6680 will be the first sign of reversal, and bring stronger rebound back to 0.7135 resistance.