Sample Category Title
Dollar Recovering Slightly in Consolidative Markets, Breakout Awaited
The currency markets are generally quiet, without committed directions. Dollar is recovering broadly, ahead of near term support against European majors. Commodity currencies are softening while Yen is mixed. Some focuses be on US mid-term elections, as well as a Bundesbank symposium. But overall trading activities might remain subdued until US CPI release on Thursday.
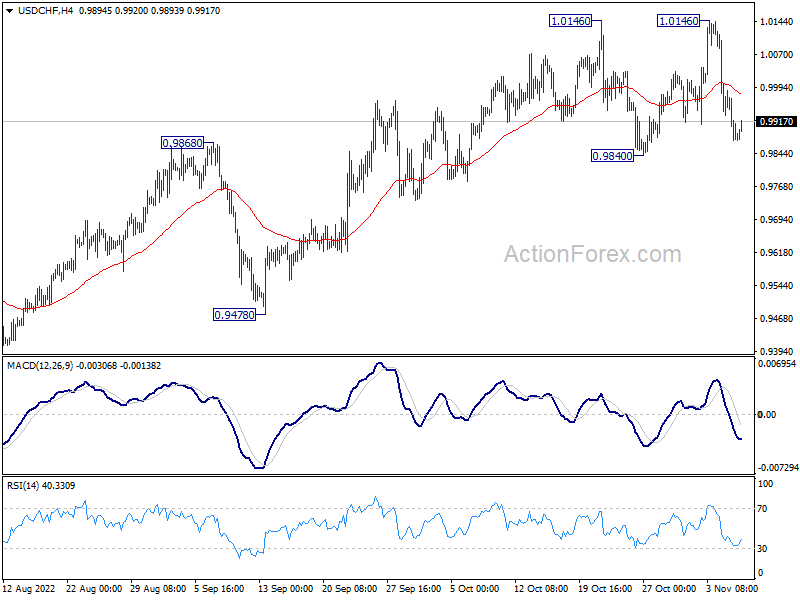
Technically, for now, Dollar-Europeans are staying in range. That is, EUR/USD is trading inside 0.9729/1.0092, GBP/USD inside 1.1145/1.1644, USD/CHF 0.9840/1.0146. Any movements inside these ranges are seen as near term volatility only. Concurrent breakouts in these pairs are needed to confirm the next direction of the greenback.
In Asia, at the time of writing, Nikkei is up 1.31%. Hong Kong HSI is down -0.70%. China Shanghai SSE is down -0.69%. Singapore Strait Times is up 0.21%. Japan 10-year JGB yield is down -0.0078% 0.251. Overnight, DOW rose 1.31%. S&P 500 rose 0.96%. NASDAQ rose 0.85%. 10-year yield rose 0.058 to 4.214.
BoJ opinions: Undesirable to make premature changes to monetary policy
In the Summary of Opinions at BoJ's October 27-28 meeting, it's noted that it's wages increase in a "sustainable and stable manner" to achieve the inflation target. Inflation could "deviate upward" form the baseline scenario but it's still "uncertain" whether the rises in prices will be "sustainable". It is "undesirable" to "make premature changes" to monetary policy for the "risk of disrupting the formation of a virtuous cycle between prices and wages."
Nevertheless, on member noted, "it is necessary to examine the impact of high prices on household behavior and wages humbly and without any preconceptions while paying attention to the side effects of monetary easing.
Another member noted, "it is also important to continue to examine how future exit strategies will affect the market and whether market participants will be well prepared for them."
Australia NAB business confidence dropped to 0, conditions dropped to 22
Australia NAB Business Confidence dropped from 5 to 0 in October. Business Conditions dropped slightly from 23 to 22. Trading conditions dropped from 37 to 31. Profitability conditions rose from 21 to 22. Employment conditions dropped from 17 to 14.
NAB Chief Economist Alan Oster said, "Conditions remained strong in October with demand still very elevated and profitability holding up... Despite the strength in conditions, confidence has been falling for several months as headwinds have weighed on the outlook for the global economy and Australia."
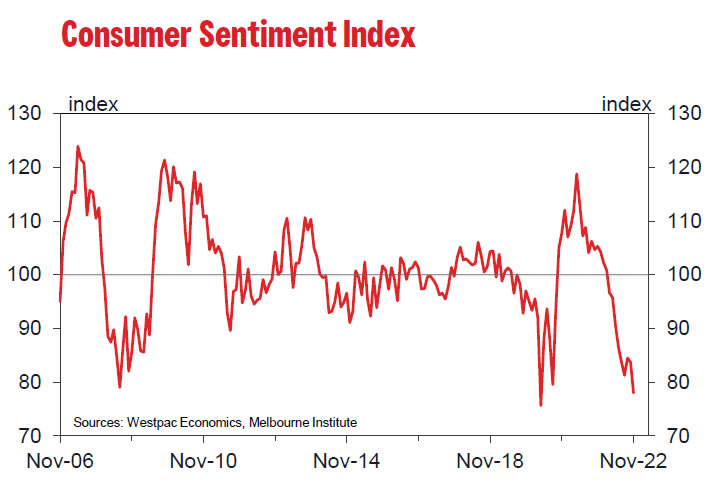
Australia Westpac consumer sentiment dropped to 78, just slightly above pandemic low
Australia Westpac Consumer Sentiment dropped -6.9% to 78.0 in November. The reading was below the low point of the Global Financial Crisis in 2008, and was just slightly higher than pandemic low at 75.6.
Westpac said that inflation and interest rates are weighing heavily on family finances. Nearly 40% of consumers, a record high, look to cut Christmas spending. Confidence in house prices is heading towards 2018.19 lows.
Regarding RBA policy, Westpac expects it to hike by a further 25bps on December 6. Westpac also expects RBA to hike by an additional 0.75% out to May next year.
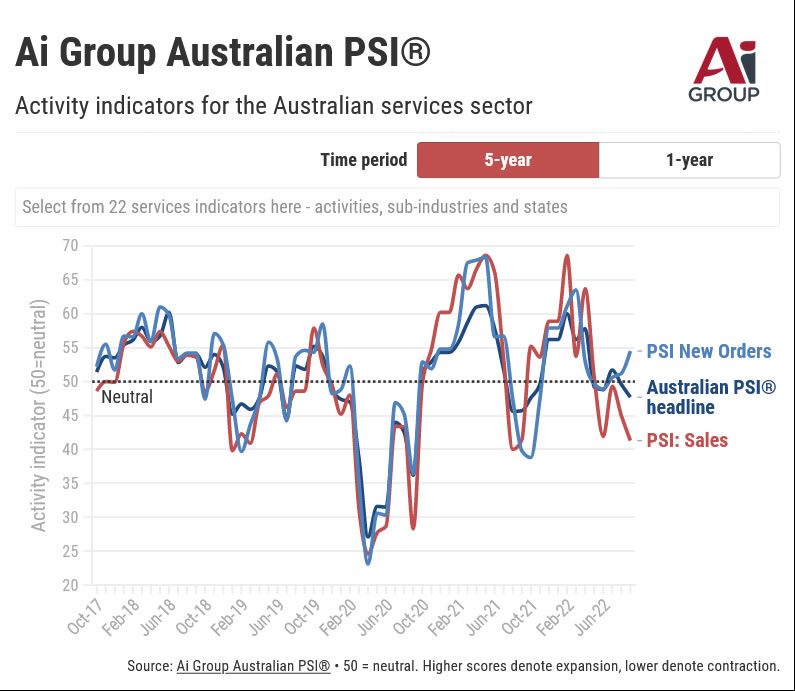
Australia AiG services dropped to 47.7, second month of contraction
Australia AiG Performance of Services Index dropped slightly from 48.0 to 47.7 in October, staying in contraction for a second month. Looking at some details, sales dropped -0.5 to 41.3. Employment rose 1.3 to 53.9. New orders rose 4.3 to 54.5. Input prices rose 4.2 to 77.6. Selling prices rose 3.9 to 62.2. Average wages dropped -1.1 to 64.8.
Innes Willox, Chief Executive of Ai Group, said: "Australia's service sector faces weakening conditions. Chronic labour shortages have dragged on the supply-side of the sector for most of this year. And now the effects of cumulative interest rate rises are weakening demand conditions as well. Conditions particularly deteriorated for retail & hospitality and business & property, which are most exposed to consumer sentiment."
RBNZ 2-yr inflation expectations rose to 3.62%
In RBNZ's Survey of Expectations, businesses expect interest rate to rise 65bps to 4.15% a quarter ahead. In a year's time, they saw interest rates rose further to 4.67%.
Mean one-year ahead GDP growth decreased from prior survey's 1.49% to 1.27%. One year ahead inflation expectations rose from 4.86% in last quarter to 5.08%. Two year ahead inflation expectations rose sharply from 3.07% to 3.62%.
Looking ahead
France trade balance, Italy retail sales and Eurozone retail sales will be released in European session. US will release NFIB business optimism index.
USD/CHF Daily Outlook
Daily Pivots: (S1) 0.9843; (P) 0.9916; (R1) 0.9957; More...
Intraday bias in USD/CHF remains neutral as range trading continues inside 0.9840/1.0146. Further rally is expected as long as 0.9840 support holds. Break of 1.0146 will resume larger up trend to 1.0283 projection level. However, sustained break of 0.9840 will now complete a double top pattern, and turn bias back to the downside for 0.9478 support instead.
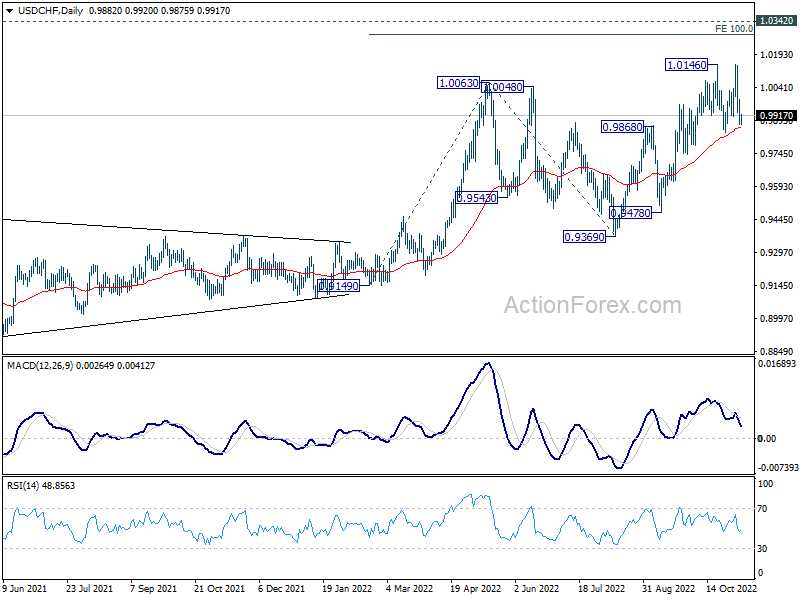
In the bigger picture, up trend from 0.8756 (2021 low) is still in progress. Next target is 100% projection of 0.9149 to 1.0063 from 0.9369 at 1.0283, and then 1.0342 (2016 high). For now, this will remain the favored case as long as 0.9779 support holds, even in case of deep pull back.
Economic Indicators Update
| GMT | Ccy | Events | Actual | Forecast | Previous | Revised |
|---|---|---|---|---|---|---|
| 22:30 | AUD | AiG Performance of Services Index Oct | 47.7 | 48 | ||
| 23:30 | AUD | Westpac Consumer Confidence Nov | -6.90% | -0.90% | ||
| 23:30 | JPY | Labor Cash Earnings Y/Y Sep | 2.10% | 1.60% | 1.70% | |
| 23:30 | JPY | Overall Household Spending Y/Y Sep | 2.30% | 2.70% | 5.10% | |
| 23:50 | JPY | BoJ Summary of Opinions | ||||
| 00:01 | GBP | BRC Like-For-Like Retail Sales Y/Y Oct | 1.20% | 1.50% | 1.80% | |
| 00:30 | AUD | NAB Business Confidence Oct | 0 | 5 | ||
| 00:30 | AUD | NAB Business Conditions Oct | 22 | 25 | 23 | |
| 02:00 | NZD | RBNZ Inflation Expectations Q/Q Q4 | 3.62% | 3.07% | ||
| 05:00 | JPY | Leading Economic Index Sep P | 97.4 | 101.6 | 101.3 | |
| 07:45 | EUR | France Trade Balance (EUR) Sep | -14.0B | -15.3B | ||
| 09:00 | EUR | Italy Retail Sales M/M Sep | -0.10% | -0.40% | ||
| 10:00 | EUR | Eurozone Retail Sales M/M Sep | 0.00% | -0.30% | ||
| 11:00 | USD | NFIB Business Optimism Index Oct | 91.7 | 92.1 |
BoJ opinions: Undesirable to make premature changes to monetary policy
In the Summary of Opinions at BoJ's October 27-28 meeting, it's noted that it's wages increase in a "sustainable and stable manner" to achieve the inflation target. Inflation could "deviate upward" form the baseline scenario but it's still "uncertain" whether the rises in prices will be "sustainable". It is "undesirable" to "make premature changes" to monetary policy for the "risk of disrupting the formation of a virtuous cycle between prices and wages."
Nevertheless, on member noted, "it is necessary to examine the impact of high prices on household behavior and wages humbly and without any preconceptions while paying attention to the side effects of monetary easing.
Another member noted, "it is also important to continue to examine how future exit strategies will affect the market and whether market participants will be well prepared for them."
RBNZ 2-yr inflation expectations rose to 3.62%
In RBNZ's Survey of Expectations, businesses expect interest rate to rise 65bps to 4.15% a quarter ahead. In a year's time, they saw interest rates rose further to 4.67%.
Mean one-year ahead GDP growth decreased from prior survey's 1.49% to 1.27%. One year ahead inflation expectations rose from 4.86% in last quarter to 5.08%. Two year ahead inflation expectations rose sharply from 3.07% to 3.62%.
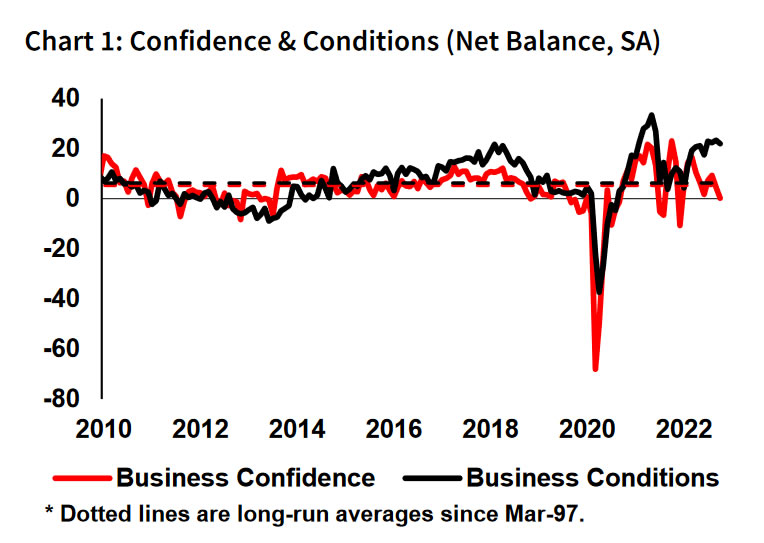
Australia NAB business confidence dropped to 0, conditions dropped to 22
Australia NAB Business Confidence dropped from 5 to 0 in October. Business Conditions dropped slightly from 23 to 22. Trading conditions dropped from 37 to 31. Profitability conditions rose from 21 to 22. Employment conditions dropped from 17 to 14.
NAB Chief Economist Alan Oster said, "Conditions remained strong in October with demand still very elevated and profitability holding up... Despite the strength in conditions, confidence has been falling for several months as headwinds have weighed on the outlook for the global economy and Australia."
Australia Westpac consumer sentiment dropped to 78, just slightly above pandemic low
Australia Westpac Consumer Sentiment dropped -6.9% to 78.0 in November. The reading was below the low point of the Global Financial Crisis in 2008, and was just slightly higher than pandemic low at 75.6.
Westpac said that inflation and interest rates are weighing heavily on family finances. Nearly 40% of consumers, a record high, look to cut Christmas spending. Confidence in house prices is heading towards 2018.19 lows.
Regarding RBA policy, Westpac expects it to hike by a further 25bps on December 6. Westpac also expects RBA to hike by an additional 0.75% out to May next year.
Australia AiG services dropped to 47.7, second month of contraction
Australia AiG Performance of Services Index dropped slightly from 48.0 to 47.7 in October, staying in contraction for a second month. Looking at some details, sales dropped -0.5 to 41.3. Employment rose 1.3 to 53.9. New orders rose 4.3 to 54.5. Input prices rose 4.2 to 77.6. Selling prices rose 3.9 to 62.2. Average wages dropped -1.1 to 64.8.
Innes Willox, Chief Executive of Ai Group, said: "Australia's service sector faces weakening conditions. Chronic labour shortages have dragged on the supply-side of the sector for most of this year. And now the effects of cumulative interest rate rises are weakening demand conditions as well. Conditions particularly deteriorated for retail & hospitality and business & property, which are most exposed to consumer sentiment."
Technical Outlook and Review
USD/JPY:
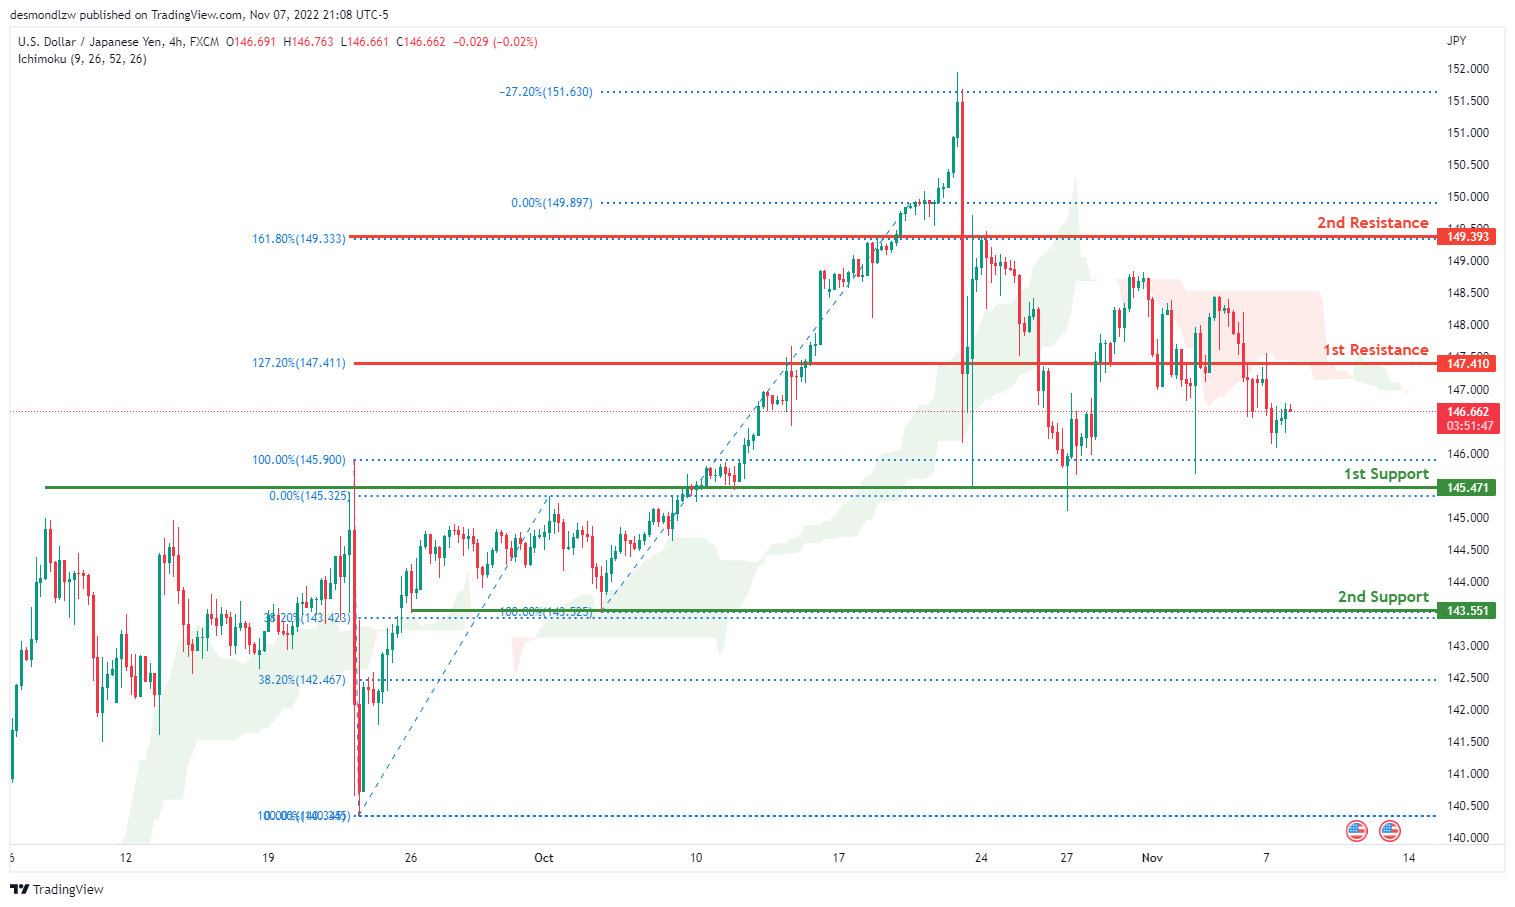
The current general bias for USDJPY on the H4 chart is bearish. To add confluence to this, the price is below the Ichimoku cloud which indicates a bearish market. Overnight, USDJPY continued its bearish momentum with the price currently below the 1st resistance line at 147.410 where the 127.2% Fibonacci extension line is located. Price is currently trading at 146.677 at time of writing. If the bearish momentum continues, expect USDJPY to possibly head towards the 1st support line at 145.471, where the 100% and 0% Fibonacci lines are located. In an alternative scenario, price could break above the 1st resistance and head towards the 2nd resistance at 149.393 where the 161.8% and 0% Fibonacci lines are located.
Areas of consideration:
- H4 time frame, 1st resistance at 147.410
- H4 time frame, 1st resistance at 149.393
- H4 time frame, 1st support at 145.471
DXY:
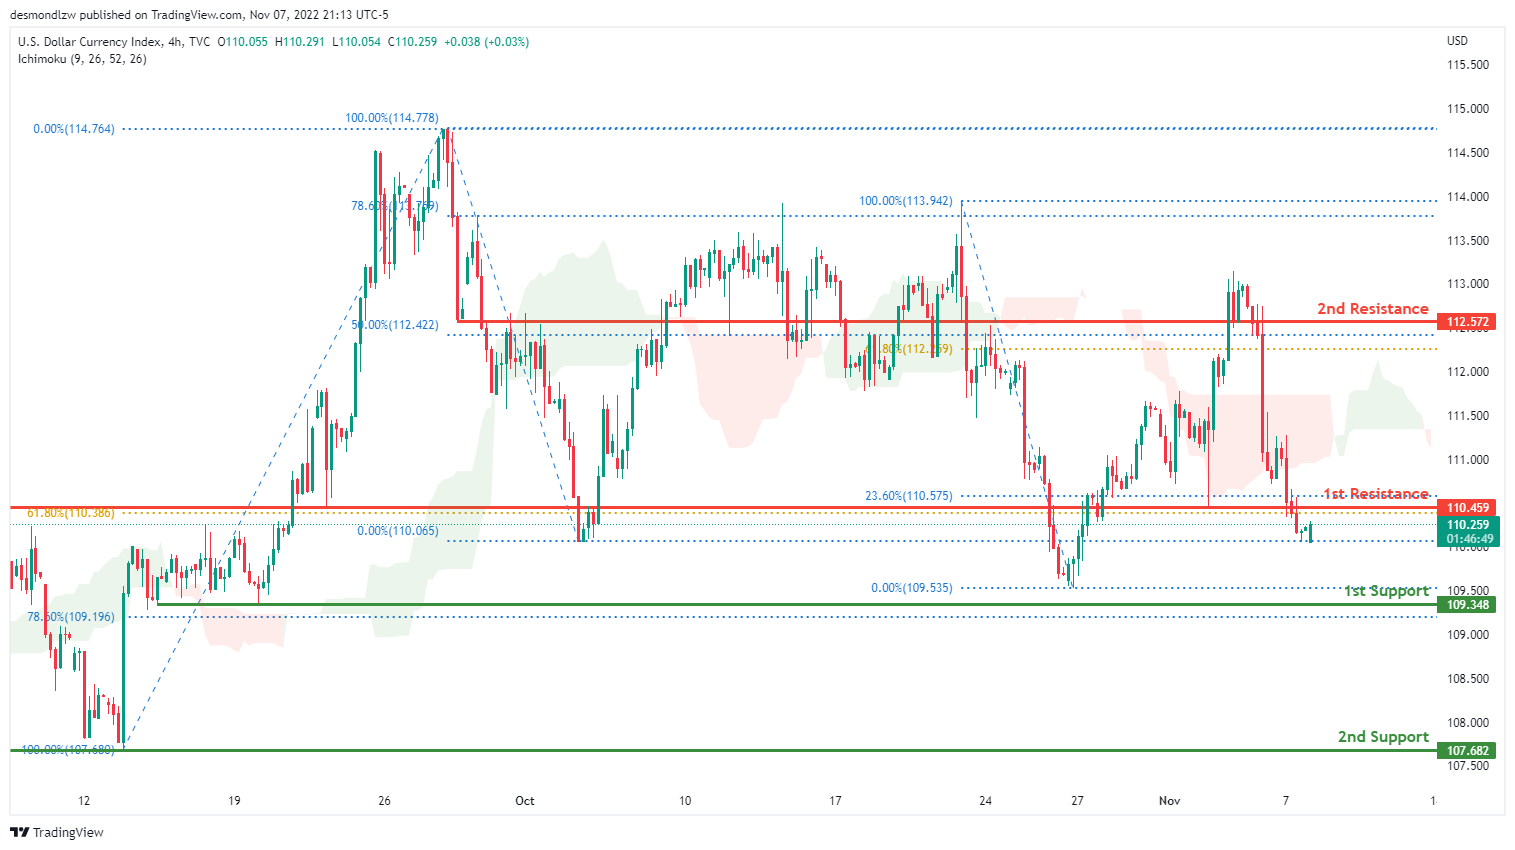
On the H4 chart, the overall bias for DXY is bearish. To add confluence to this, the price is crossing below the Ichimoku cloud which indicates a bearish market. Overnight, price continued its bearish momentum downwards with price closing under the 1st resistance at 110.459 where the 61.8% and 23.6% Fibonacci lines are located. The price is currently trading at 110.258 at the time of writing. If this bearish momentum continues, price could head towards the 1st support line at 109.348 where the 78.6% Fibonacci line and previous low are located. In an alternative scenario, price could head back up to retest the 1st resistance line.
Areas of consideration:
- H4 time frame, 1st resistance at 110.459
- H4 time frame, 1st support at 109.348
EUR/USD:
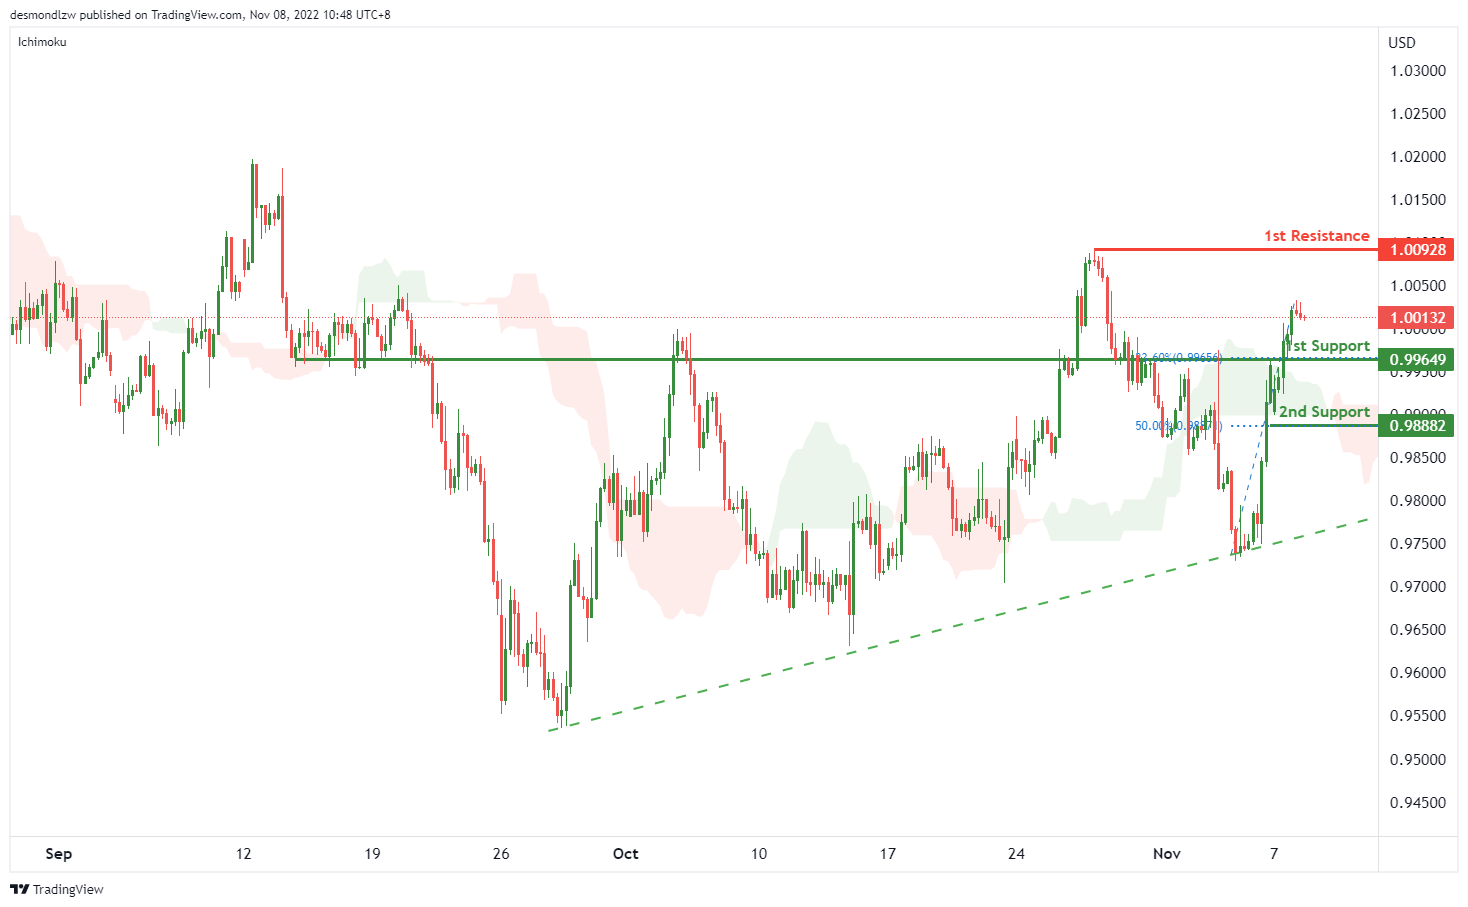
On H4, with the price moving above the ichimoku cloud and ascending trendline, we have a bullish bias that the price may rise from 1st support at 0.99649, which is in line with the 23.6% fibonacci retracement and previous swing lows to the 1st resistance at 1.00928, where the swing high is. Alternatively, the price may drop to the 2nd support at 0.98882, which is in line with the 50% fibonacci retracement .
Areas of consideration :
- H4 1st support at 0.99649
- H4 1st resistance at 1.00928
GBP/USD:
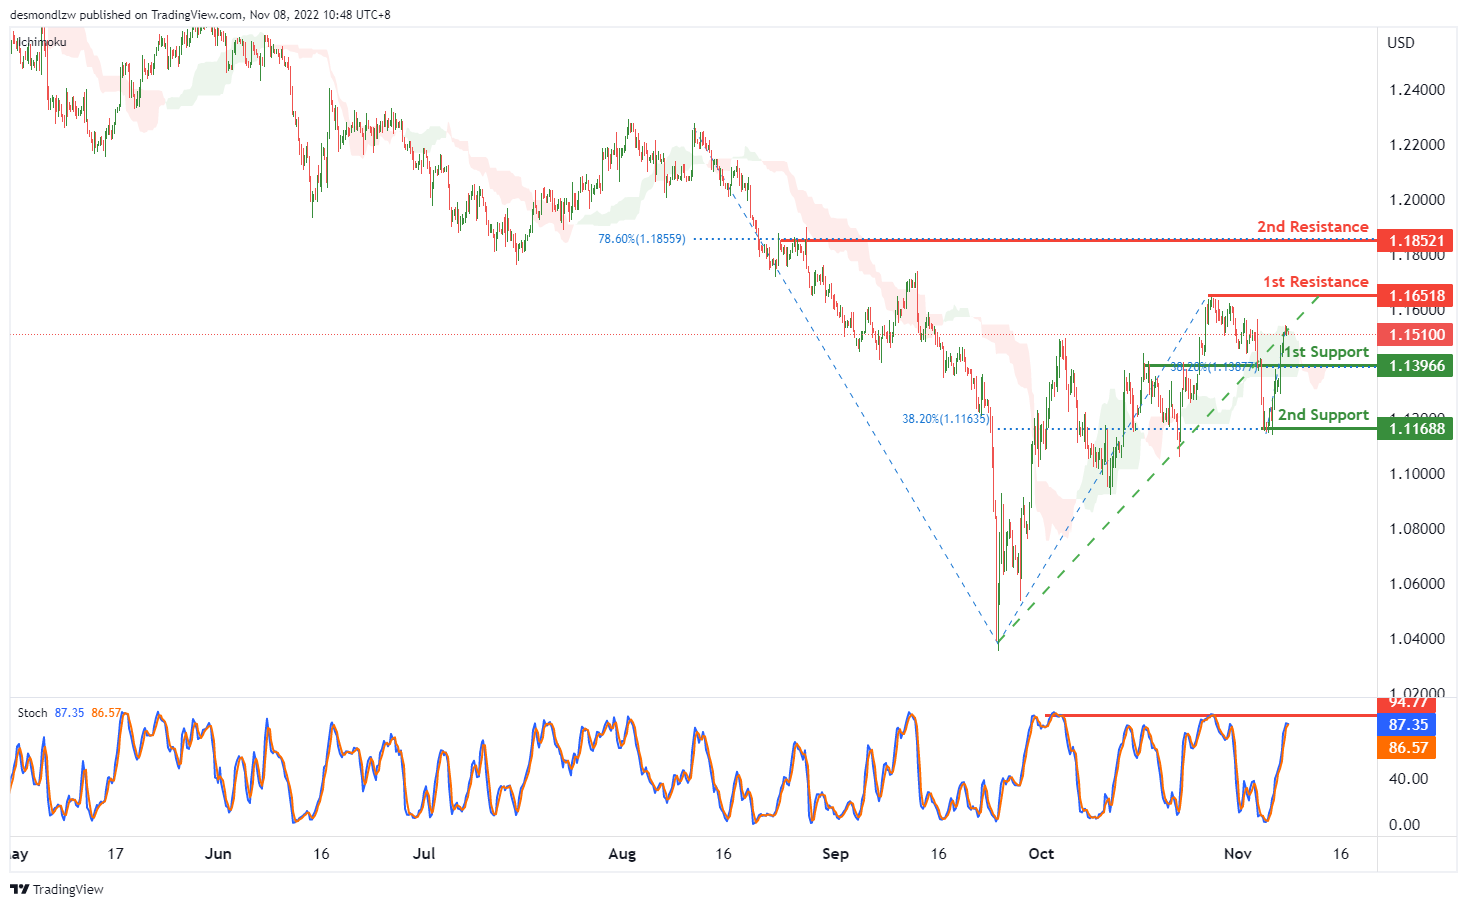
On the H4, price is crossing the ichimoku cloud and rising back to the ascending trendline, we have a bullish bias that the price may rise to test the 1st resistance at 1.16518, which is in line with the previous swing high to the 2nd resistance at 1.18521, where the 78.6% fibonacci retracement is. Alternatively, the price may drop to the 1st support at 1.13966, where the 38.2% fibonacci retracement is, if the 1st support is broken, the 2nd support is at 1.11688, which is in line with the previous swing low and 38.2% fibonacci retracement.
Areas of consideration:
- H4 1st resistance at 1.16518
- H4 2nd resistance at 1.18521
USD/CHF:
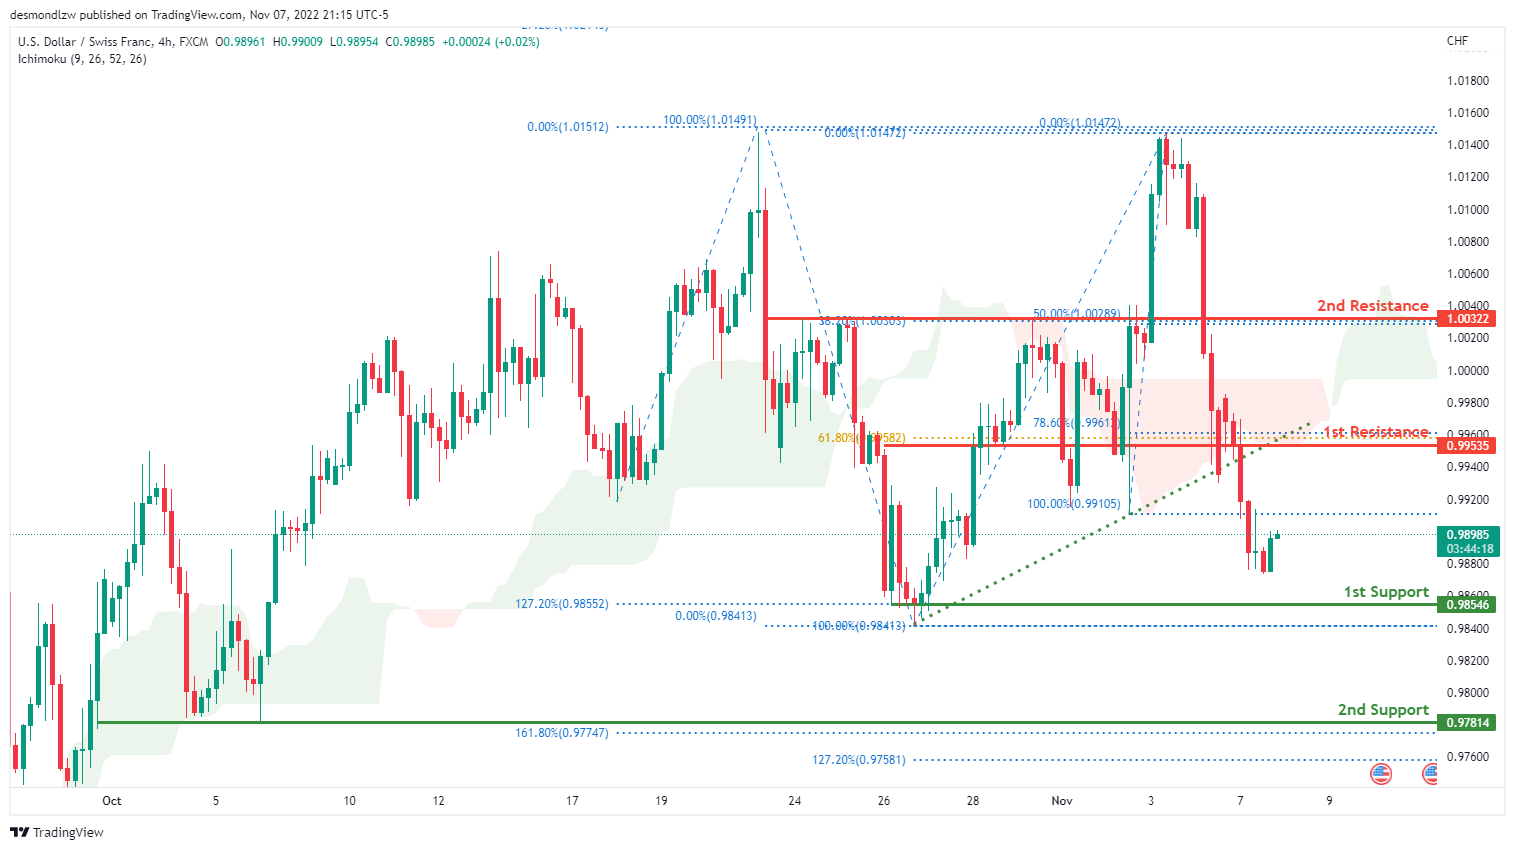
On the H4 chart, the overall bias for USDCHF is bearish. To add confluence to this, the price is below the Ichimoku cloud which indicates a bearish market. Overnight, price continued its bearish momentum downwards with price closing under the 1st resistance line at 0.99535 where the 61.8% and 78.6% Fibonacci lines are located . The price is currently trading at 0.99535 at the time of writing. If this bearish momentum continues, expect price to head towards the 1st support line at 0.98546, where the 127.2% Fibonacci extension line, 100% Fibonacci line and previous swing low are located. In an alternative scenario, price could head back up to retest the 1st resistance line.
Areas of consideration
- H4 1st support at 0.98546
- H4 1st resistance at 0.99535
XAU/USD (GOLD):
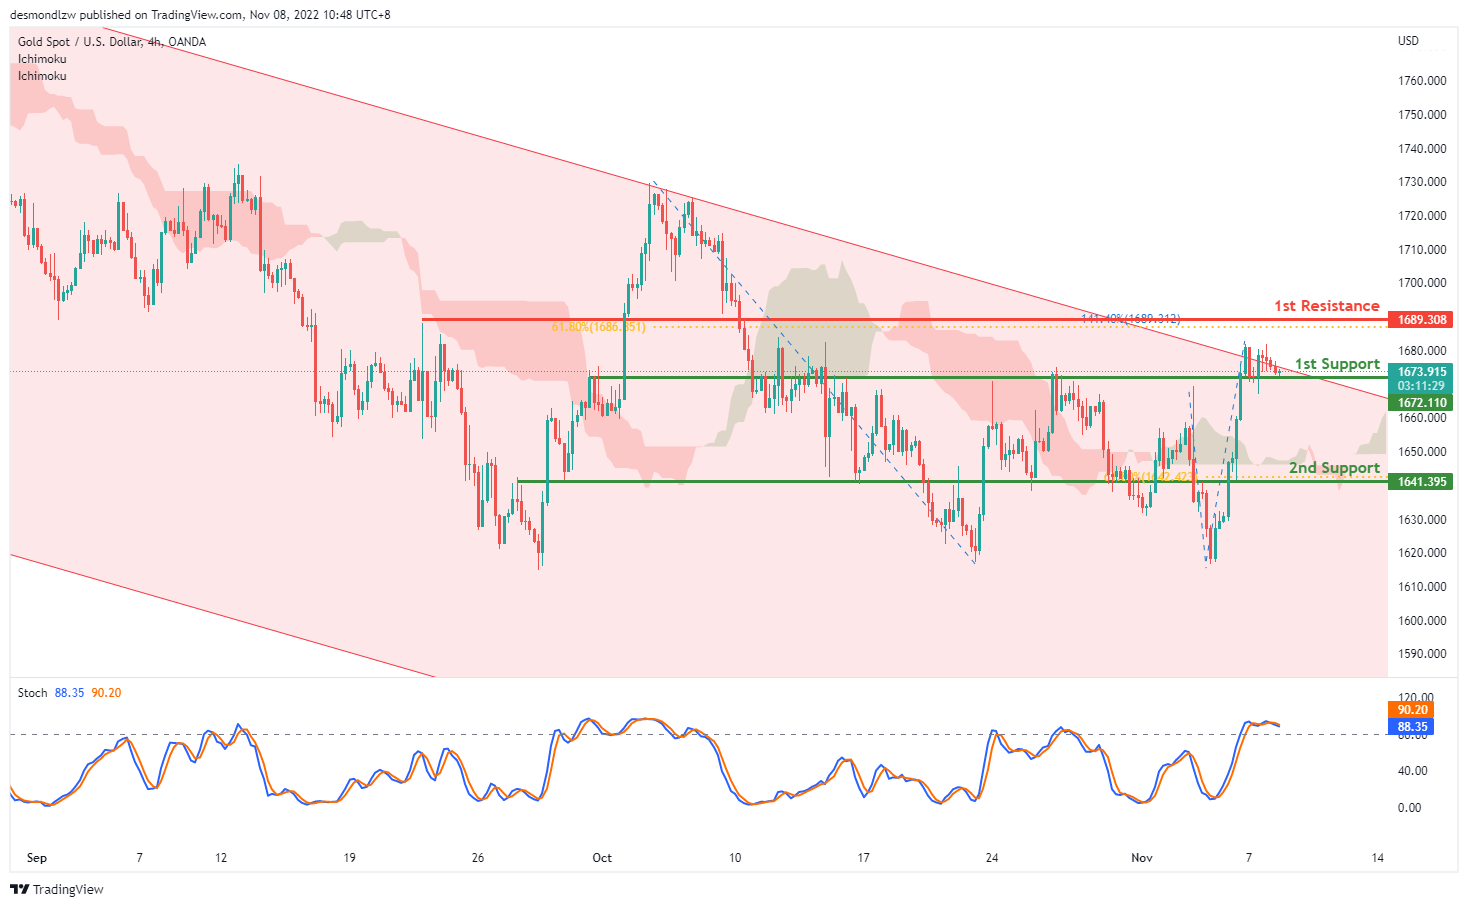
On H4, with the price dropping back to the descending channel and stoch is above 80, showing an overbought signal, we can expect the price to drop from the 1st support at 1672.110, which is in line with the previous swing high to the 2nd support at 1641.395, where the overlap support and 61.8% fibonacci retracement are. Alternatively, the price may rise to the 1st resistance at 1689.308, where the 61.8% fibonacci retracement and 141.4% fibonacci extension sit.
Areas of consideration:
- H4 time frame, 1st support at 1672.110
- H4 time frame, 2nd support at 1641.395
AUD/USD:
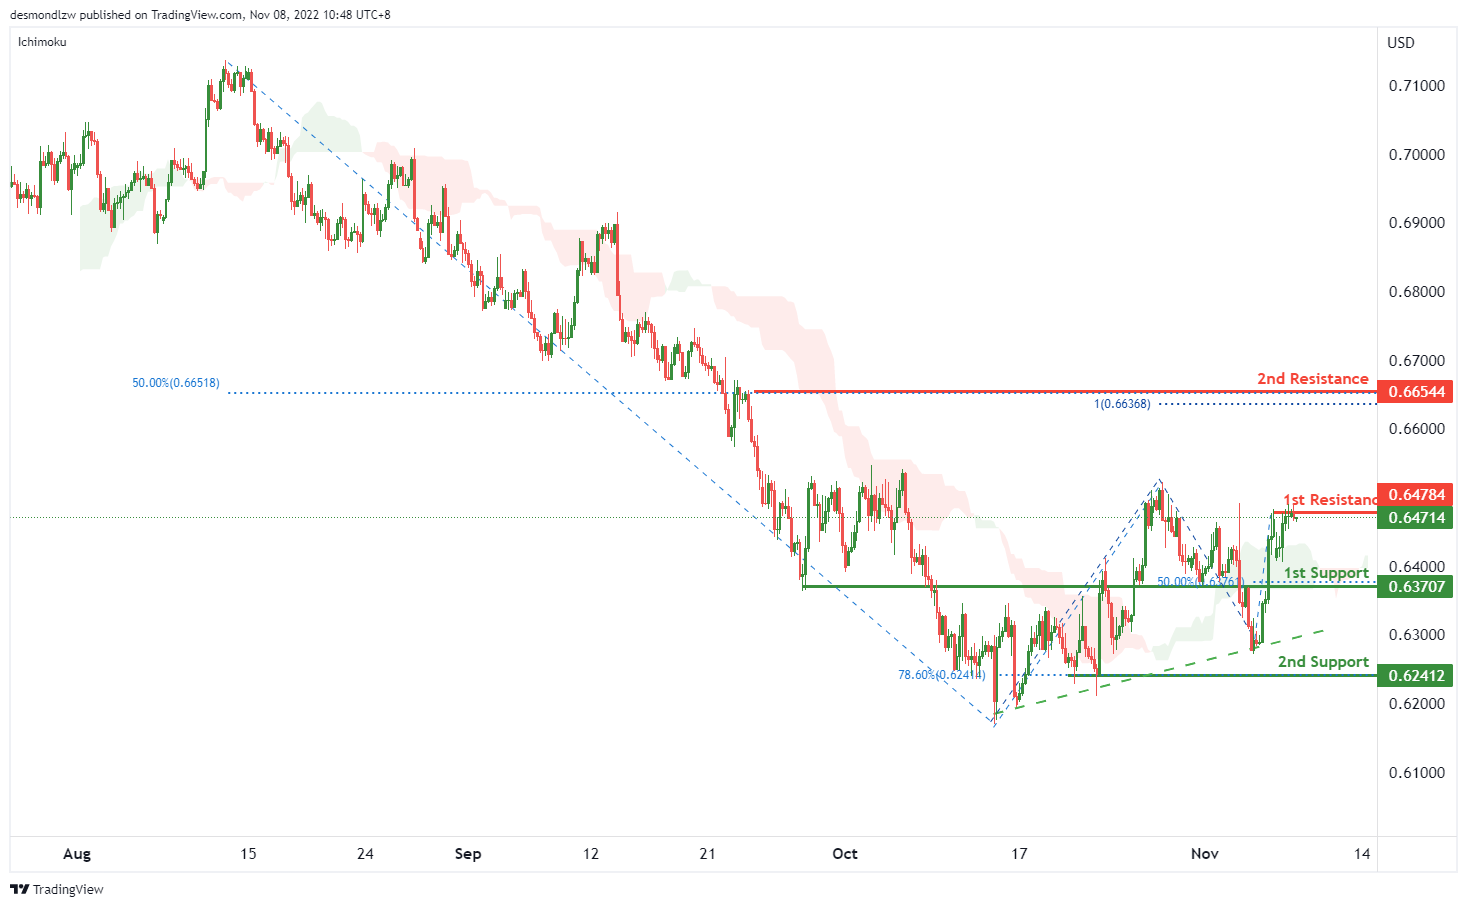
On the H4, with the price crossing the ichimoku cloud and moving above the ascending trendline, we can expect the price to break the 1st resistance at 0.64784, which is in line with the swing high. If the 1st resistance is broken, the 2nd resistance is at 0.66544, where the 100% fibonacci projection and 50% fibonacci retracement are. Alternatively, the price may drop from the 1st resistance to the 1st support at 0.63707, where the 50% fibonacci retracement and previous swing low are. If the 1st support is broken, the 2nd support is at 0.62414, where the 78.6% fibonacci retracement is.
Areas of consideration
- H4, 1st resistance at 0.64784
- H4, 2nd resistance at 0.66544
NZD/USD:
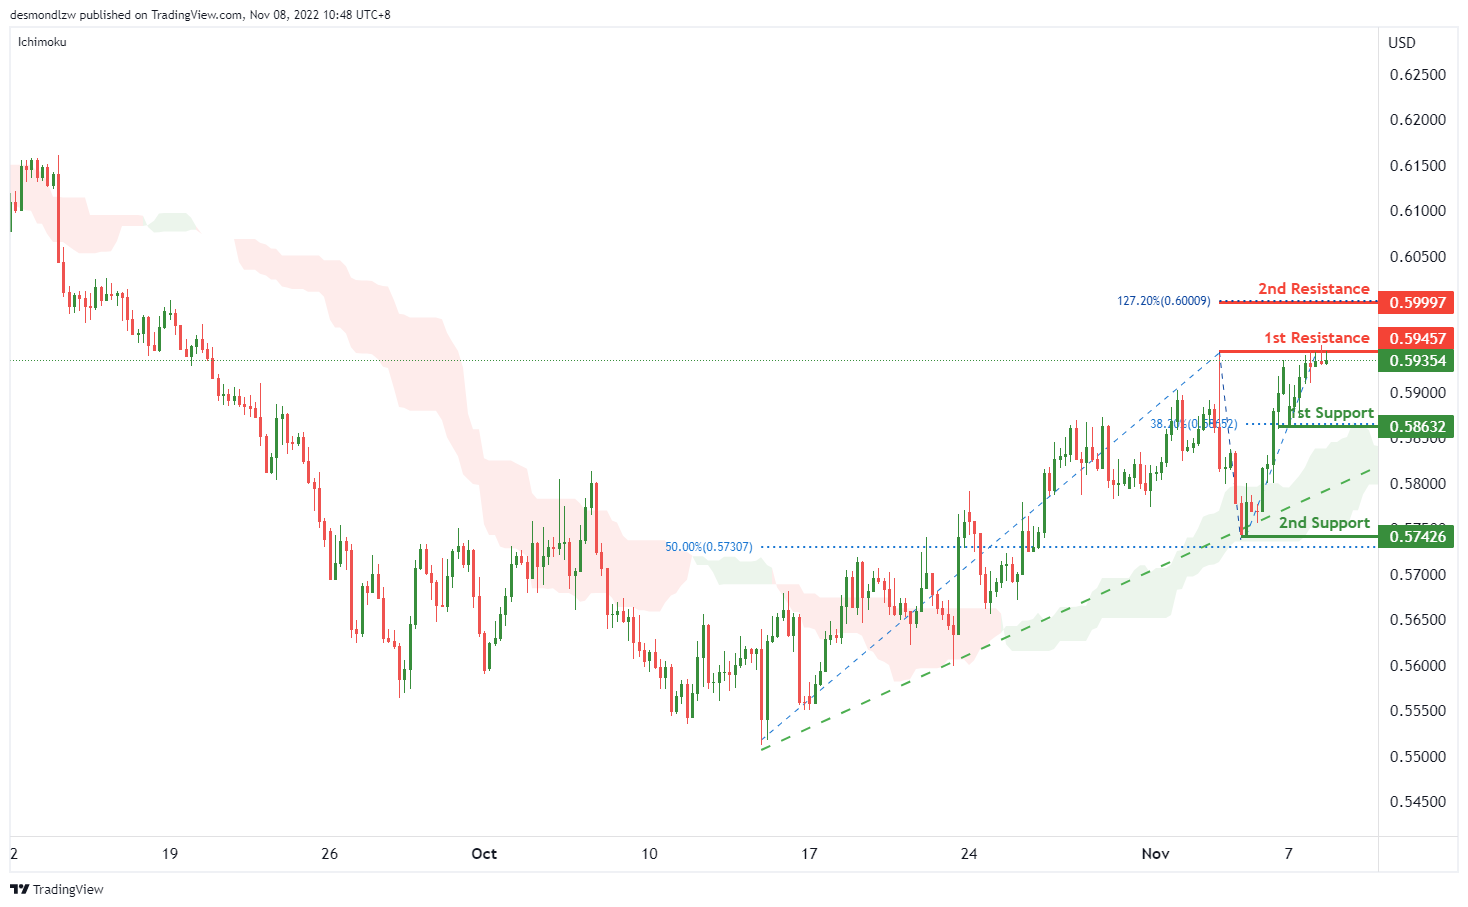
On the H4 chart, as the price is moving above ichimoku cloud and ascending trendline, the price may rise to the 1st resistance at 0.59320, which is in line with the swing highs. If the 1st resistance is broken, the 2nd resistance is at 0.59997, which is in line with the 127.2% fibonacci extension. Alternatively, the price may drop to the 1st support at 0.58632, which is in line with the swing low and 38.2% fibonacci retracement. If the 1st support is broken, the 2nd support is at 0.57426, which is in line with the 50% fibonacci retracement.
Areas of consideration:
- H4 time frame, 1st resistance at 0.59320
- H4 time frame, 2nd resistance at 0.59997
USD/CAD:
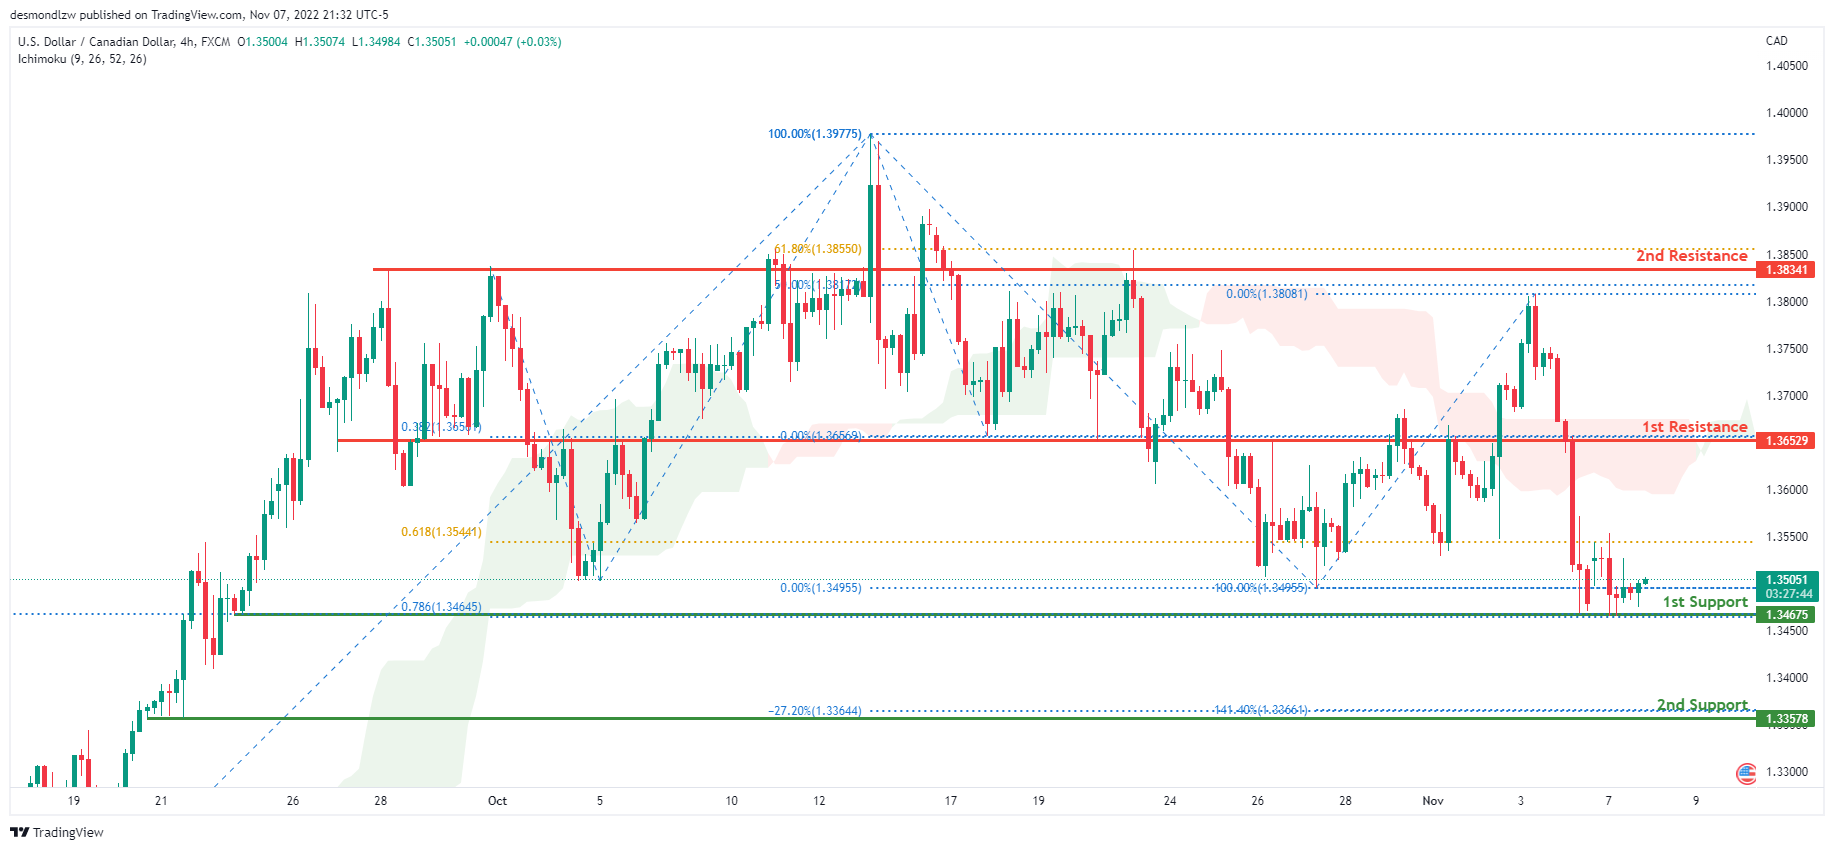
On the H4 chart, the overall bias for USDCAD is bearish. To add confluence to this, the price is below the Ichimoku cloud which indicates a bearish market. Overnight, the price continued to consolidate along the 1st support line. The price is currently trading at 1.35068 at the time of writing. If this bearish momentum continues, expect the price to head back down towards the 1st support line at 1.34675 where the 78.6% Fibonacci projection line and previous low is located. In an alternative scenario, price could head back up towards the 1st resistance line at 1.36529, where the 38.2% Fibonacci projection line is located.
Areas of consideration:
- H4 time frame, 1st resistance at 1.36529
- H4 time frame, 1st support at 1.34675
OIL:
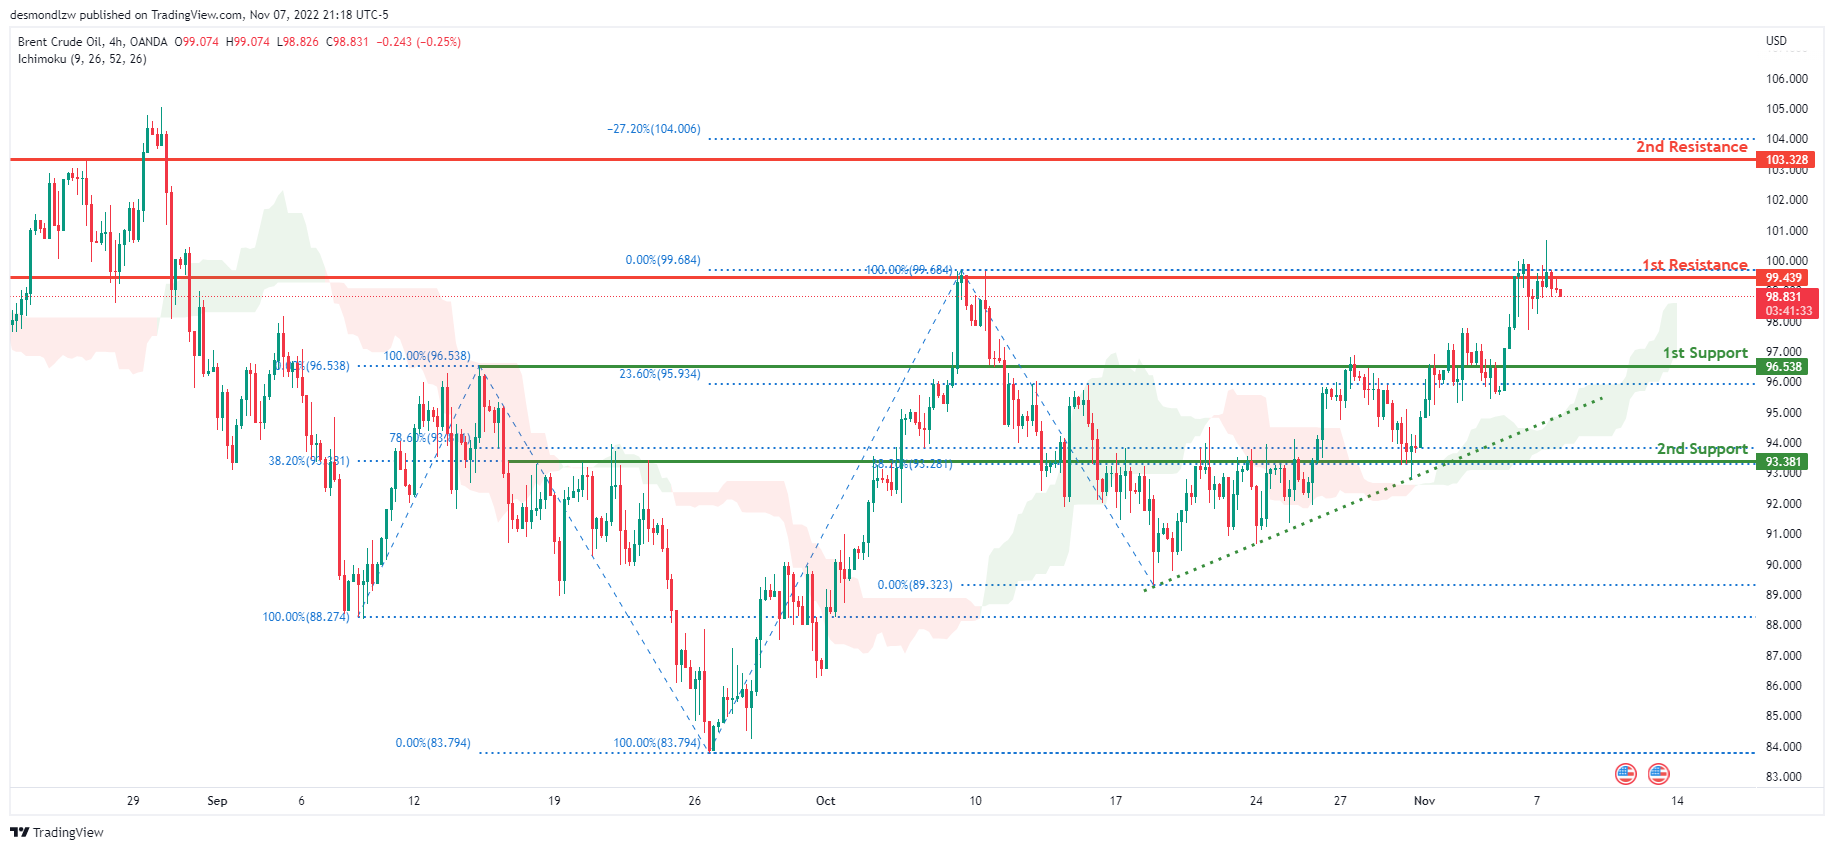
Looking at the H4 chart, the current overall bias for Oil is bullish. To add confluence to this, the price is above the Ichimoku cloud which indicates a bullish market. Overnight, price attempted to break through the 1st resistance line but eventually closed underneath it, continuing the consolidation. The price is currently trading at 98.846 at the time of writing. If this bullish momentum continues, expect price to possibly head back up towards the 1st resistance at 99.439 where previous swing high and 0% Fibonacci line is located. In an alternative scenario, price could head back down to the 1st support level at 96.538 where the 23.6% and 100% Fibonacci lines are located.
Areas of consideration:
- H4 time frame, 1st resistance at 99.439
- H4 time frame, 1st support at 96.538
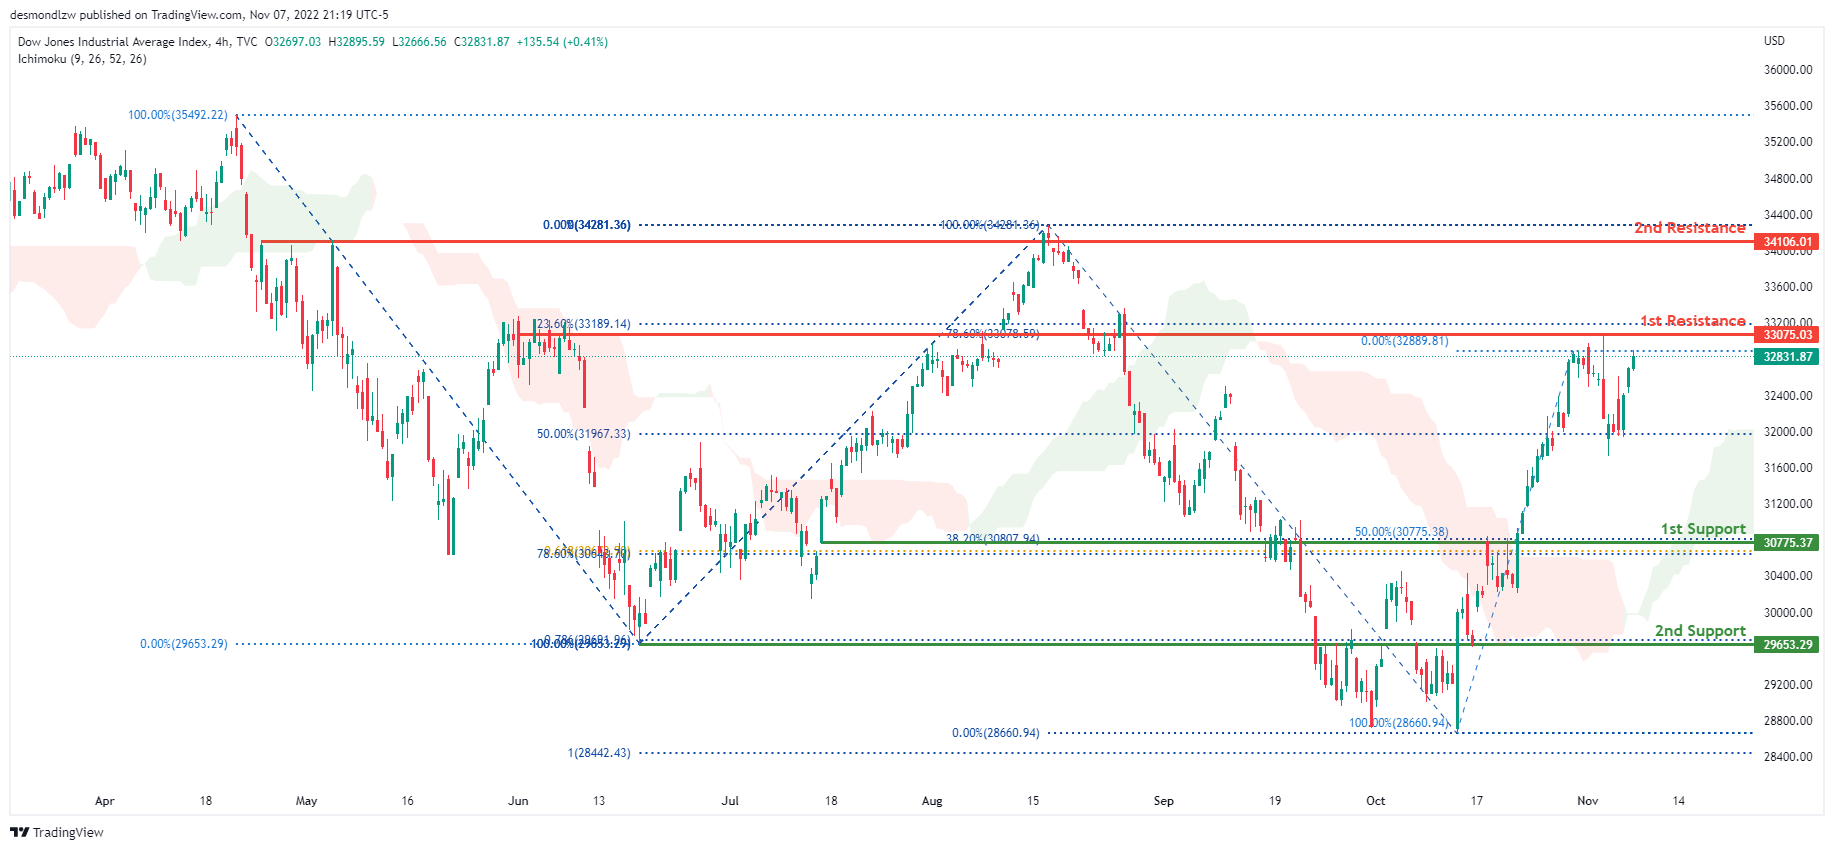
Dow Jones Industrial Average:
On the H4 chart, the overall bias for DJI is bullish. To add confluence to this, the price is above the Ichimoku cloud which indicates a bullish market. Overnight, price continued its bullish momentum upwards. The price is currently trading at 32831.87 at time of writing. If this bullish momentum continues, expect the price to possibly head towards the 1st resistance at 33272.34 where the 23.6% and 78.6% Fibonacci lines are located. In an alternative scenario, price could head towards the 1st support line at 30775.37, where the 38.2% and 50% Fibonacci lines are located.
Areas of consideration:
- H4 time frame, 1st support at 30775.37
- H4 time frame, 1st Resistance at 33272.34
DAX:
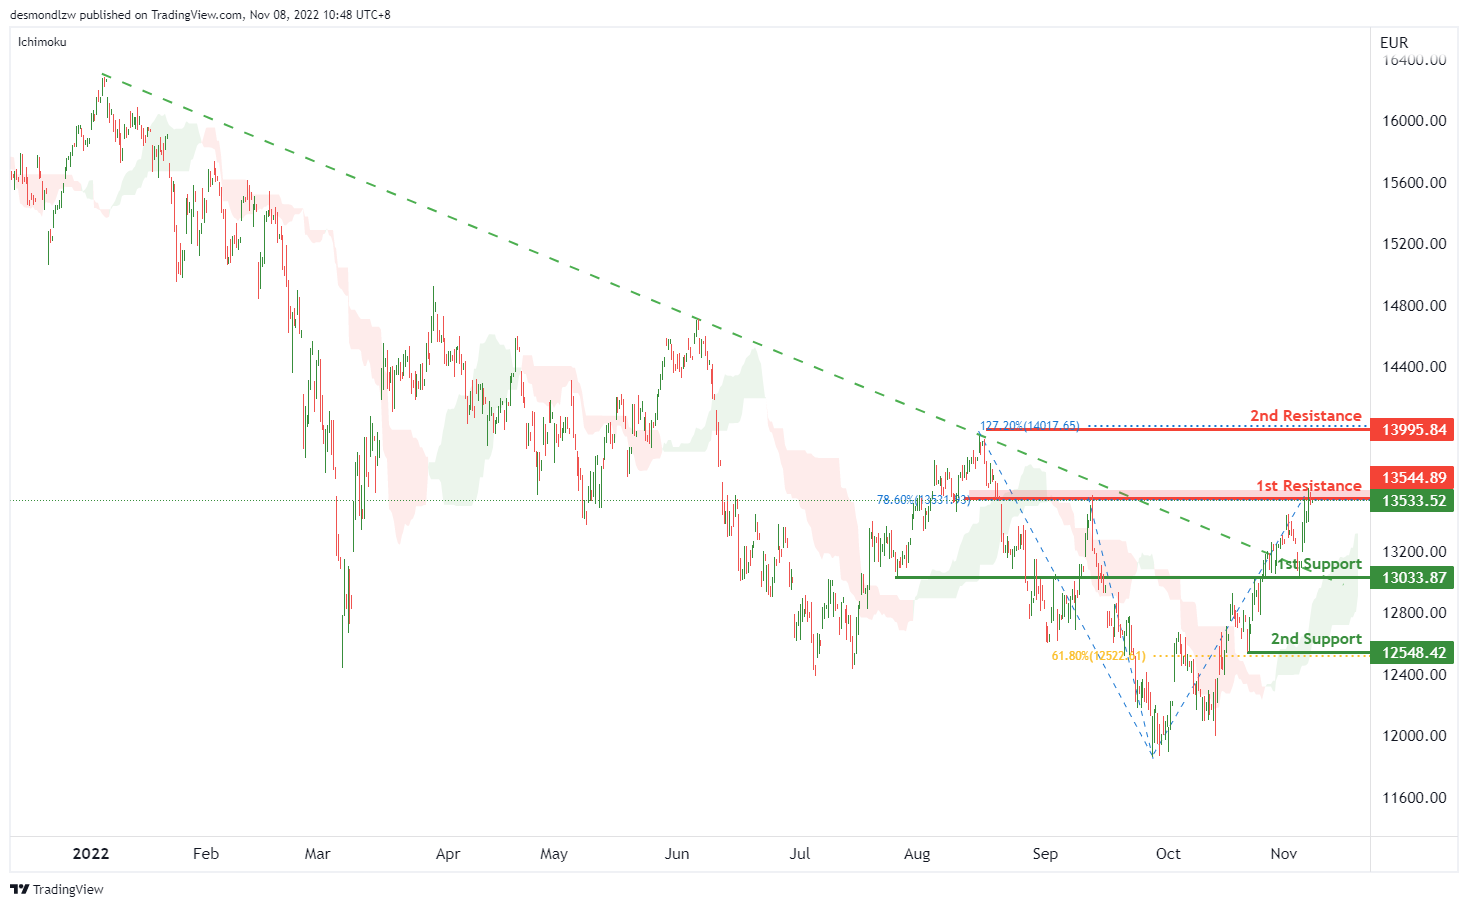
On the H4 chart, the price breaks a descending trendline. Expecting price to possibly continue this bullish momentum and break the 1st resistance at 13544.89, which is in line with the previous swing high and 78.6% fibonacci retracement. If the 1st resistance is broken, the 2nd resistance is at 13995.84, where 127.2% fibonacci extension sits. Alternatively, the price may drop to the 1st support at 13033.87, which is in line with the previous swing low, if the 1st support is broken, the 2nd support is at 12548.42, which is in line with the 61.8% fibonacci retracement.
Areas of consideration:
- H4 time frame, 1st resistance at 13544.89
- H4 time frame, 2nd resistance is at 13995.84
ETHUSD:
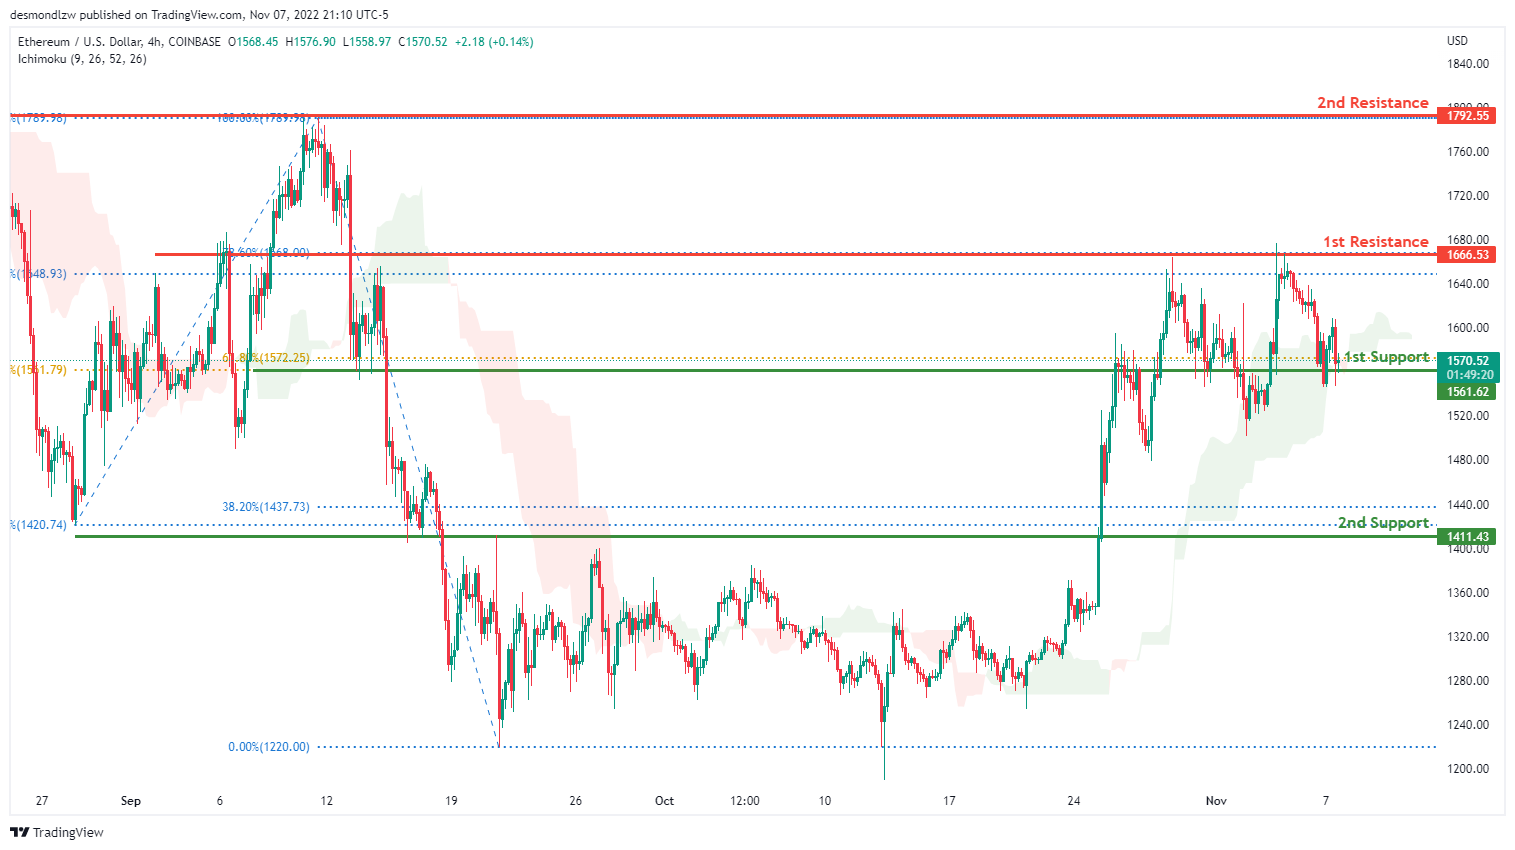
Looking at the H4 chart, the current overall bias for ETHUSD is bullish, with price currently within the green Ichimoku cloud. Overnight, price continued to consolidate along the 1st support line at 1561.62, where 2 of the 61.8% Fibonacci lines are located. The price is currently trading at 1570.63 at the time of writing. If this bullish momentum continues, expect the price to head towards the 1st resistance line at 1666.53, where the 78.6% and 38.2% Fibonacci lines are located. In an alternative scenario, price could break the 1st support line and head towards the 2nd support line at 1411.43, where the 38.2% and 100% Fibonacci lines are located.
Areas of consideration:
- H4 time frame, 1st resistance of 1666.53
- H4 time frame, 1st support at 1561.62
- H4 time frame, 2nd support at 1411.43
BTCUSD:
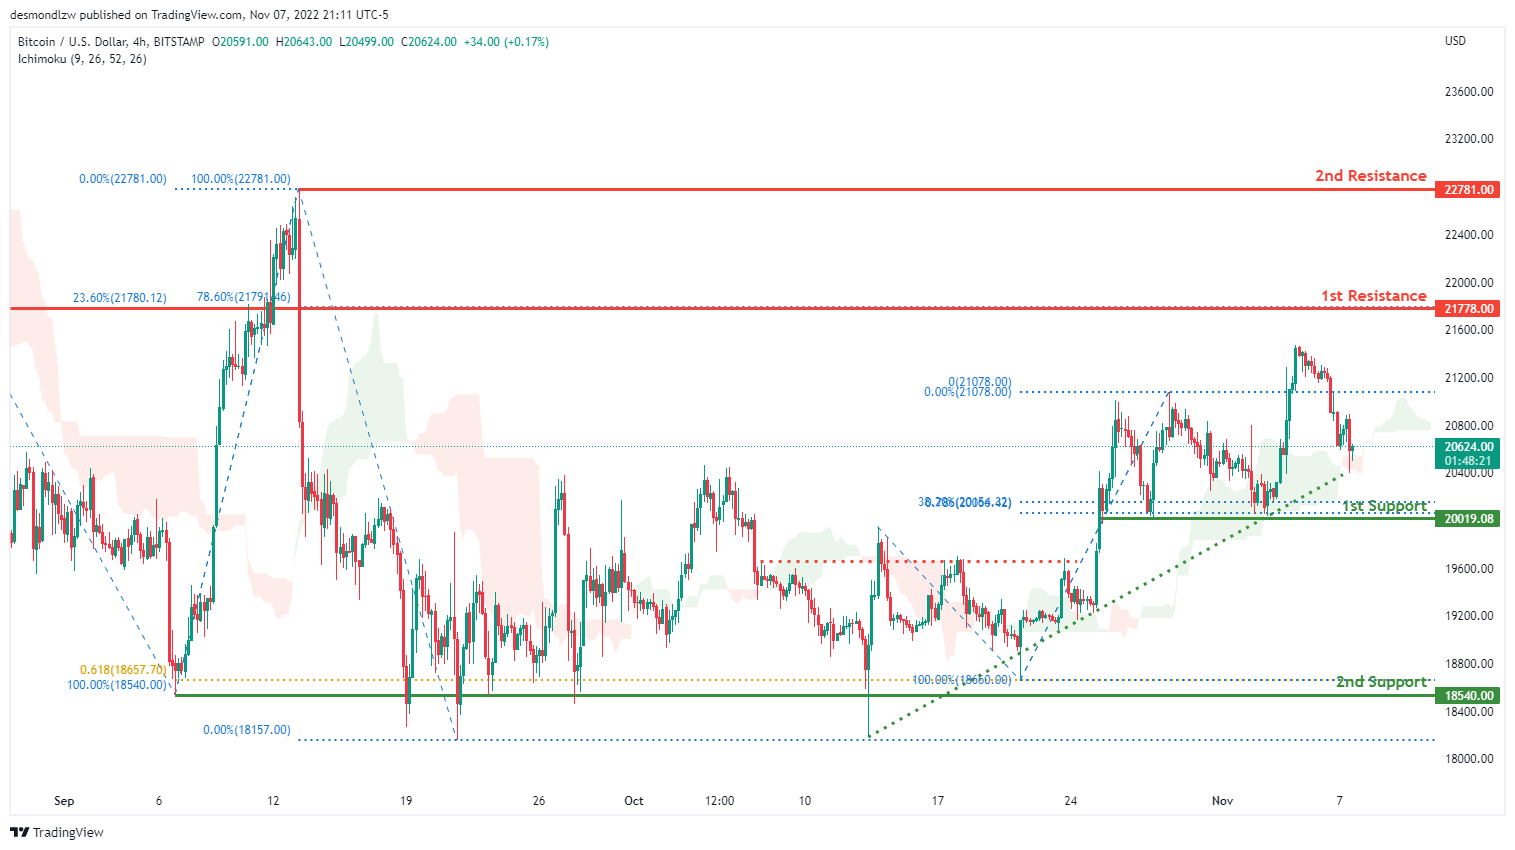
On the H4 chart, the overall bias for BTCUSD is bullish. To add confluence to this, the price is above the Ichimoku cloud which indicates a bullish market. Overnight, price continued its downwards bearish retracement towards the 1st support line. Price is currently trading at 20628.00 at time of writing. If this bullish momentum continues, expect the price to head towards the 1st resistance line at 21788.00 where the 78.6% and 23.6% Fibonacci lines are located. In an alternative scenario, price could continue its bearish retracement and head towards the 1st support line at 20019.08, where the 38.2% Fibonacci line and 78.6% Fibonacci projection line is located.
Areas of consideration:
- H4 time frame, 1st resistance 21778.00
- H4 time frame, 1st support at 20019.08
S&P 500:
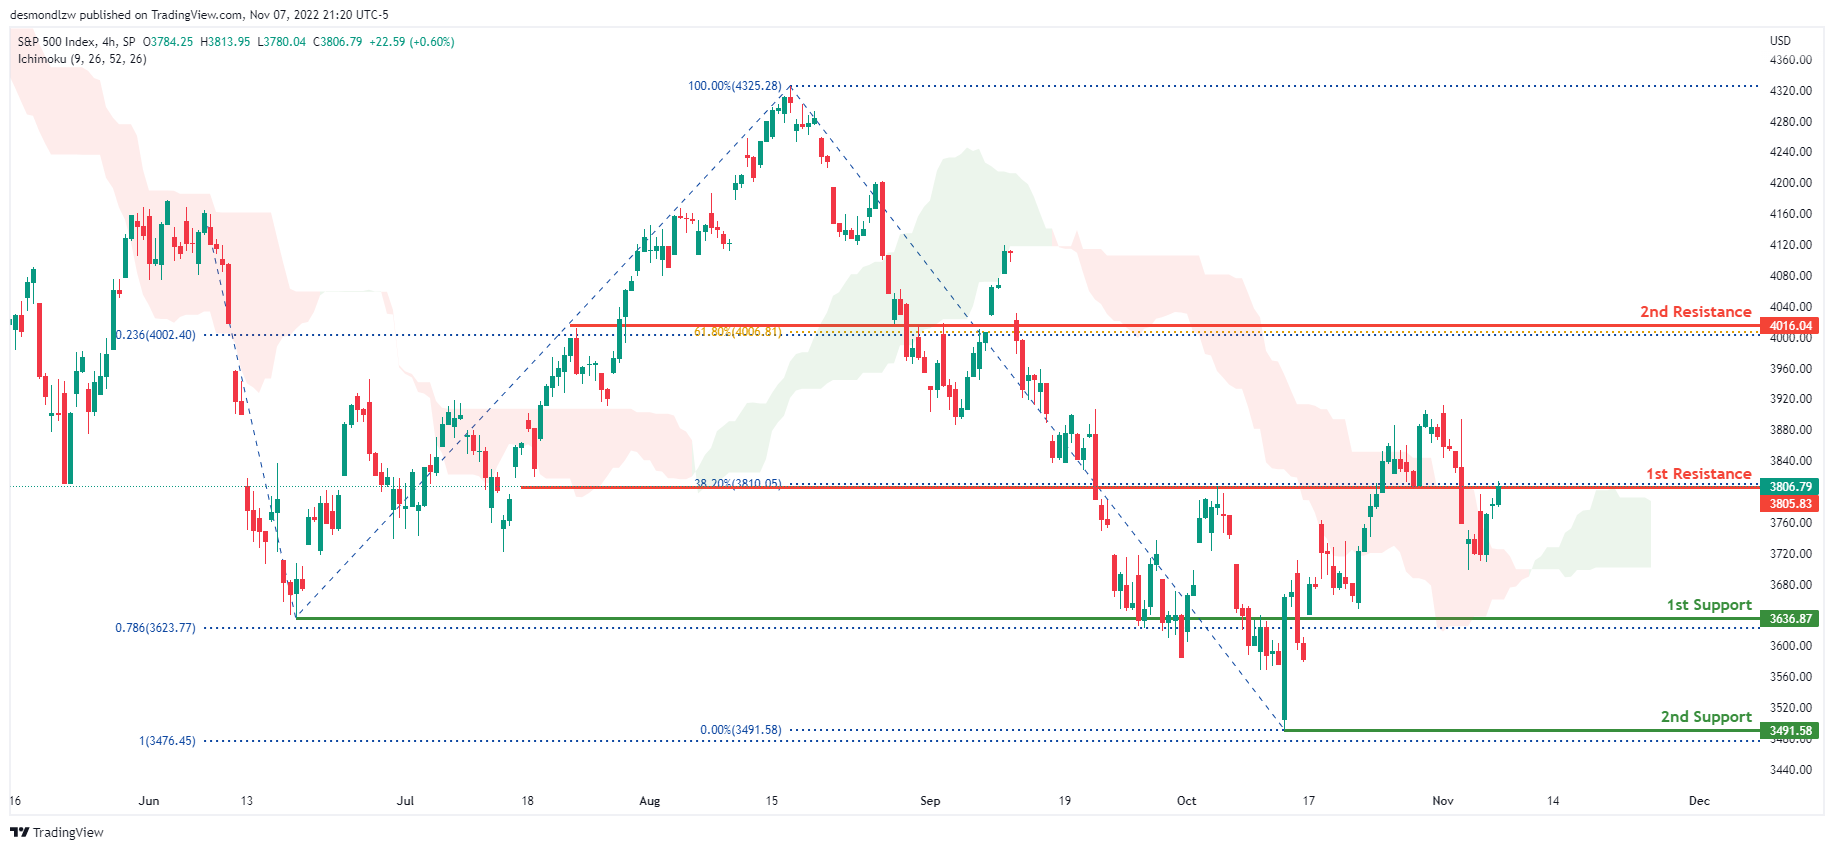
On the H4 chart, the overall bias for S&P500 is bullish with price currently crossing above the Ichimoku cloud. Overnight, price had bullish momentum with the price closing under the 1st resistance at 3805.83 where the 38.2% Fibonacci line is located. The price is currently trading at 3805.83 at time of writing. If bullish momentum continues, expect price to price could break the 1st resistance line and head towards the 2nd resistance line at 4016.04, where the 23.6% Fibonacci projection line and 61.8% Fibonacci line is located. In an alternative scenario, price could possibly head towards the 1st support at 3636.87 where the previous swing low and 78.6% Fibonacci projection line is located.
Areas of consideration:
- H4 time frame, 1st support at 3636.87
- H4 time frame, 1st resistance at 3805.83
- H4 time frame, 2nd resistance at 4016.04
GBP/USD Could Rally If It Clears This Hurdle
Key Highlights
- GBP/USD started a fresh increase above the 1.1350 resistance.
- It is facing a major bearish trend line with resistance near 1.1515 on the 4-hours chart.
- EUR/USD surged above 0.9900 and might continue to rise.
- Crude oil price might extend gains above the $94 and $95 resistance levels.
GBP/USD Technical Analysis
The British Pound remained well bid above the 1.1120 level against the US Dollar. GBP/USD started a fresh increase above the 1.1250 and 1.1350 resistance levels.
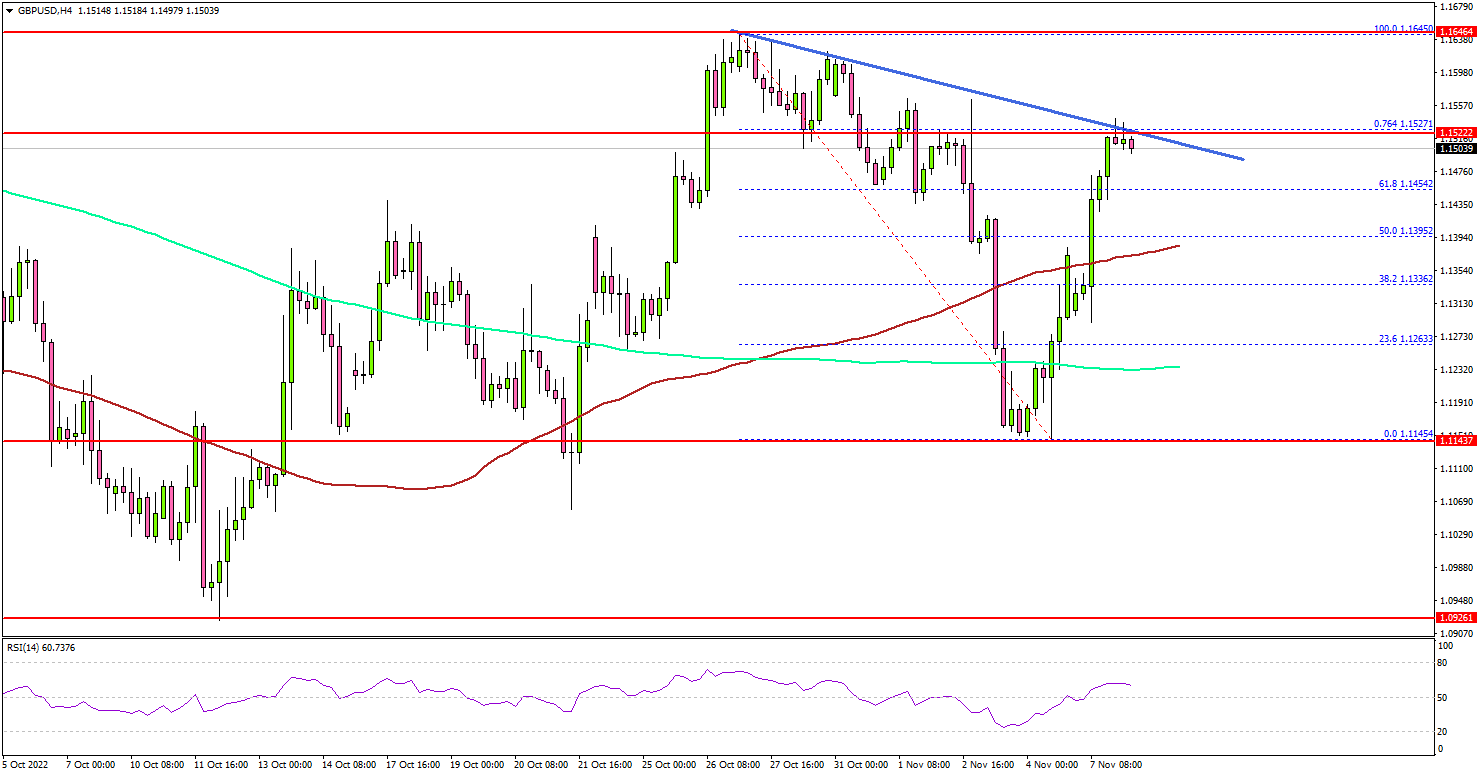
Looking at the 4-hours chart, the pair gained pace after it settled above the 1.1350 level. It even closed above the 1.1400 level, the 100 simple moving average (red, 4-hours) plus the 200 simple moving average (green, 4-hours).
The bulls pushed the pair above the 50% Fib retracement level of the downward move from the 1.1645 swing high to 1.1145 low. It is now facing resistance near the 1.1520 level.
There is also a major bearish trend line with resistance near 1.1515 on the same chart. It is near the 61.8% Fib retracement level of the downward move from the 1.1645 swing high to 1.1145 low.
The next major resistance may perhaps be near 1.1640. Any more gains could set the pace for a move towards the 1.1720 level, above which it could even test 1.1800.
An initial support is near the 1.1400 level and the 100 simple moving average (red, 4-hours). The next major support is near the 1.1350 zone. The main support sits at 1.1250 zone or the 200 simple moving average (green, 4-hours).
A close below the 1.1250 level and the 200 simple moving average (green, 4-hours) could increase selling pressure. In the stated case, it could decline towards the 1.0050 support.
Looking at EUR/USD, the pair also started a steady increase above the 0.9900 resistance and might continue to rise in the near term.
Economic Releases
- Euro Zone Retail Sales for Sep 2022 (YoY) - Forecast -1.3%, versus -2.0% previous.
- Euro Zone Retail Sales for Sep 2022 (MoM) - Forecast +0.3%, versus -0.3% previous.
Elliott Wave View: Oil (CL) Has Started New Leg Higher
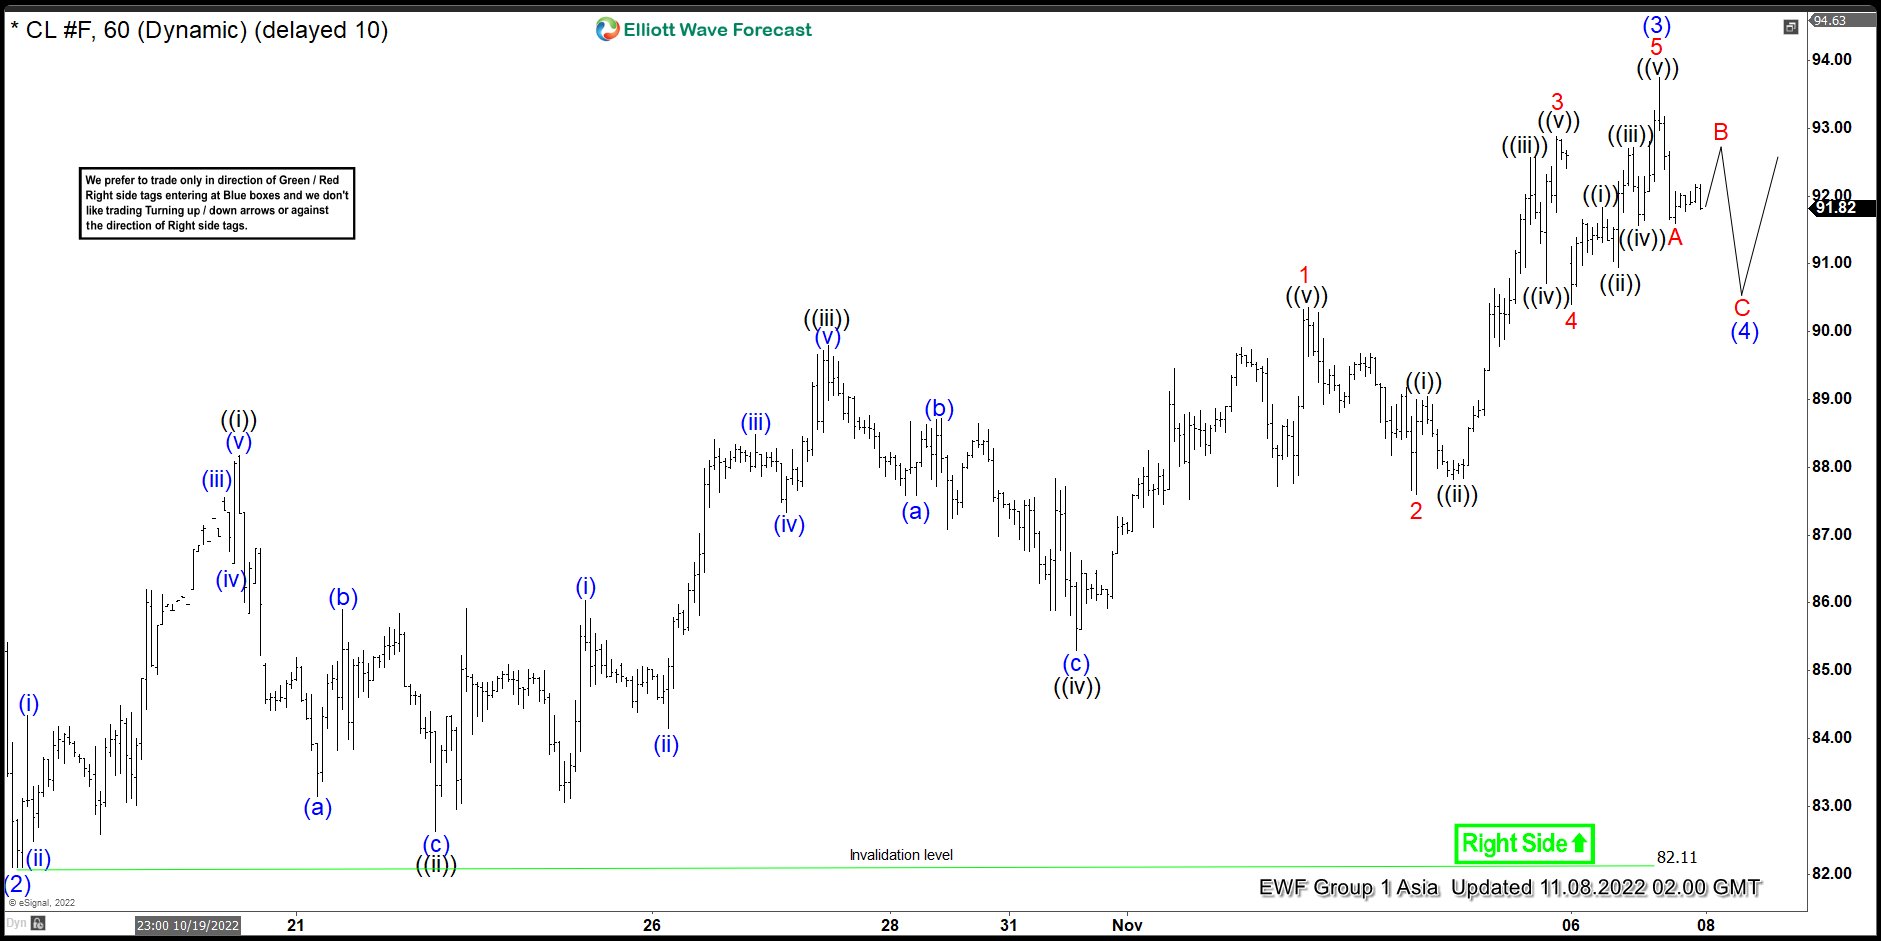
Short term Elliott Wave view in Oil suggests the rally from 9.26.2022 low is unfolding as a 5 waves diagonal. Up from 9.26.2022 low, wave (1) ended at 93.64 and pullback in wave (2) ended at 82.11. The rally then resumes and Oil has broken above wave (1) peak suggesting the next leg higher has started. It also shows a bullish sequence from 9.26.2022 low, favoring further upside.
Wave (3) higher ended at 93.74 with internal subdivision as 5 waves impulse Elliott Wave structure. Up from wave (2), wave 1 ended at 90.36 and pullback in wave 2 ended at 87.60. Wave 3 higher ended at 92.87, and pullback in wave 4 ended at 90.40. Final leg higher wave 5 ended at 93.74 and this also completed wave (3) in higher degree. Wave (4) pullback is now in progress to correct cycle from 10.18.2022 low before the rally resumes. Near term, as far as 10.18.2022 pivot at 82.11 stays intact, expect dips to find support in 3, 7, or 11 swing for more upside. Potential target higher is 100% – 161.8% Fibonacci extension from 9.26.2022 low which comes at 99.7 – 110.5.
Oil 60 Minutes Elliott Wave Chart