Sample Category Title
Another Whipsaw Day for the Yen
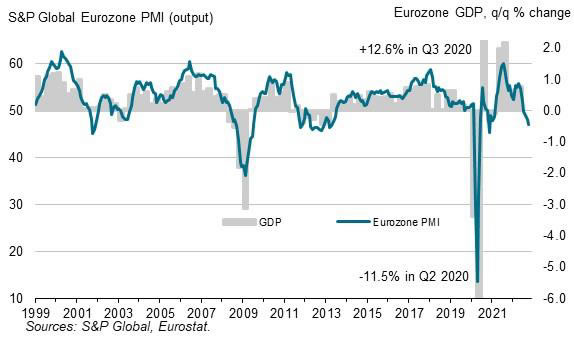
The Japanese yen is sharply lower today, as USD/JPY has climbed 1.2% and is trading at 149.41 in Europe.
The yen continues to exhibit strong swings for a second straight session. The yen started the week with sharp gains and jumped to 145.28, but the dollar has recovered and pushed the yen back above 149. This is a repeat of the whipshaw we saw on Friday, when the yen traded in a range of almost 600 points.
MOF apparently intervenes to boost yen
The wild price action is most likely a result of intervention by Japan’s Ministry of Finance (MOF), although Japanese authorities are staying mum. Prime Minister Kishida said today that the government would not tolerate excessive currency moves based on speculators, but this rhetoric is nothing new. The yen hit a new 32-year high of 151.95 on Friday, and the MoF may have decided to take off the gloves and has intervened for a second straight day.
Will the stealth intervention succeed in propping up the yen? The move did the job on Friday, with USD/JPY falling 1.7%, but the dollar has recovered most of those losses on Monday. The harsh reality is that the widening rate differential between Japan and the US will make unilataral intervention unlikely to succeed. The Fed continues to ramp up interest rates while the Bank of Japan zealously has capped rates on JGBs. This included an emergency bond-buying package last week to keep yields on 10-year bonds below 0.25%. The yen has plunged a staggering 22% against the dollar in 2022, and speculators are betting that the yen’s slide will continue.
The BoJ meets for a two-day meeting on Thursday and Friday. If the Bank maintains its dovish policy stance and refuses to provide the yen with a lifeline, the currency is likely to fall even further.
USD/JPY Technical
- USD/JPY faces resistance at 147.50 and 148.59
- There is support at 145.23 and 143.14
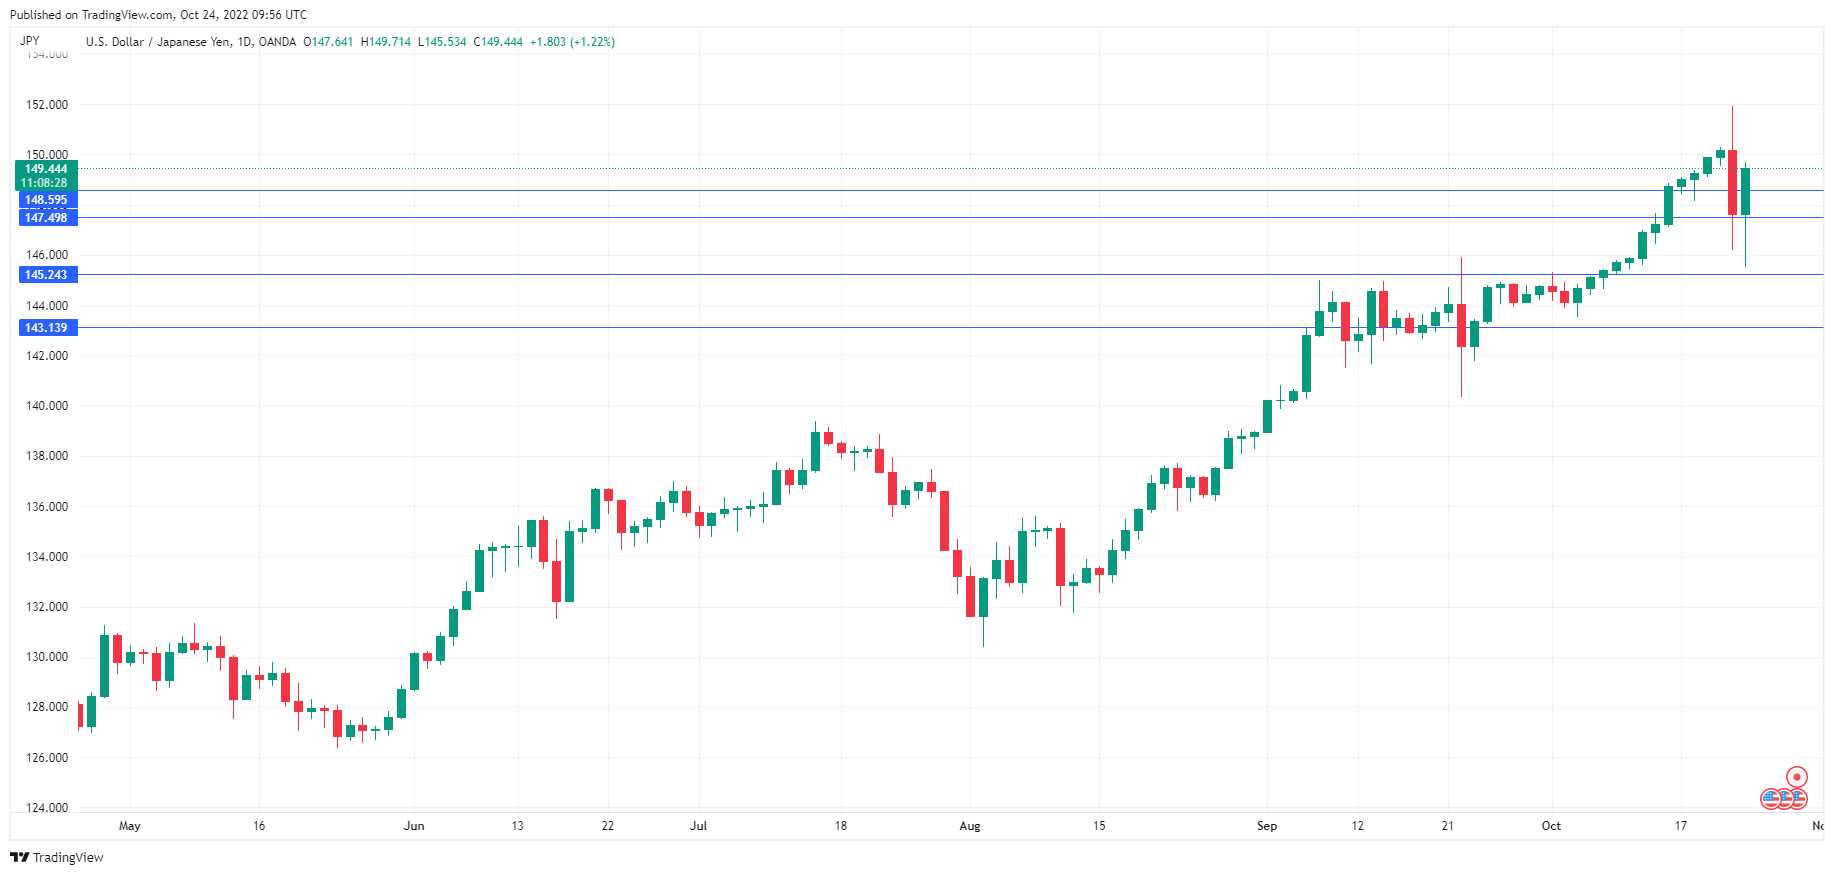
UK PMI manufacturing fell to 47.2, a worryingly deep UK recession
UK PMI Manufacturing dropped further from 48.4 to 45.8 in October, a 29-month low. PMI Services dropped from 50.0 to 47.5, a 21-month low. PMI Composite dropped from 49.1 to 47.2, a 21-month low.
Chris Williamson, Chief Business Economist at S&P Global Market Intelligence said: "October's flash PMI data showed the pace of economic decline gathering momentum after the recent political and financial market upheavals... GDP therefore looks certain to fall in the fourth quarter after a likely third quarter contraction, meaning the UK is in recession...
"The resulting elevated, albeit easing, price pressures look set to drive the Bank of England into further aggressive interest rate hikes. On top of the collapse in political stability, financial market stress and slump in confidence, these higher borrowing costs will add to speculation of a worryingly deep UK recession."
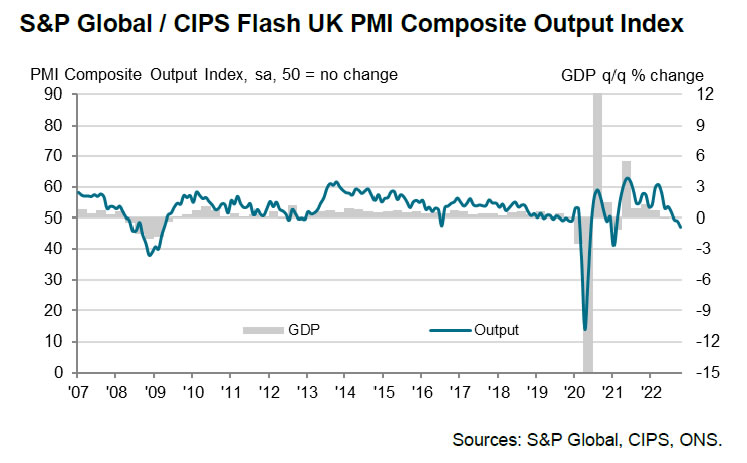
Eurozone PMI composite dropped to 47.1, economy to contract in Q4, risks on downside
Eurozone PMI Manufacturing dropped from 48.4 to 46.6 in October, a 29-month low. PMI Services dropped from 48.8 to 48.2, a 20-month low. PMI Composite dropped from 48.1 to 47.1, a 23-month low.
Chris Williamson, Chief Business Economist at S&P Global Market Intelligence said: "The eurozone economy looks set to contract in the fourth quarter given the steepening loss of output and deteriorating demand picture seen in October, adding to speculation that a recession is looking increasingly inevitable.
"While October's headline flash PMI is consistent with GDP falling at a modest rate of around 0.2%, demand is falling sharply and companies are increasingly growing worried over high inventories and weaker than expected sales, especially as winter approaches. The risks are therefore tilted towards the downturn accelerating towards the year-end."
EURUSD Tests 50-day SMA and Returns Lower Again
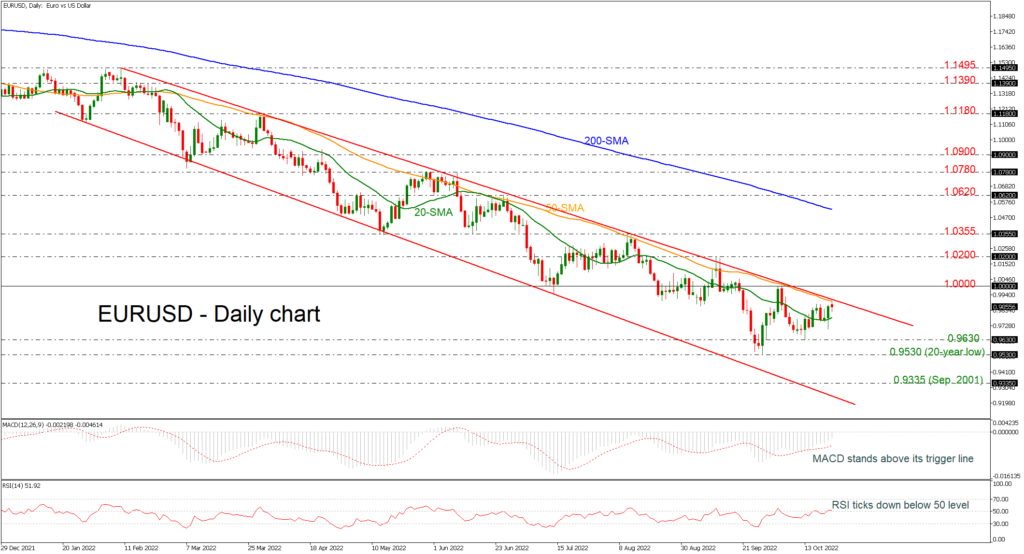
EURUSD stretched its upside movement towards the descending trend line and the 50-day simple moving average (SMA) near 0.9900 but is quickly returning those gains. The MACD is holding above its trigger and zero lines in the negative region, while the RSI is ticking slightly lower around the 50 level, confirming the recent downside momentum.
A pullback may meet immediate support around the 20-day SMA at 0.9785, while even lower the bears could try to overcome the 0.9630 barrier. Should the price retreat under that level, the 20-year low 0.9530 and the return line of the long-term downward sloping channel around the 0.9335 level could come under speculation.
In the positive scenario, the pair could improve above the 50-day SMA to challenge a stronger resistance around the parity level. The 1.0200 area and the 1.0355 zone remain the big highlights ahead of the 200-day SMA currently at 1.0520.
Meanwhile, in the medium-term picture, the situation seems to be getting more interesting as the 50-day SMA is also acting as strong resistance.
In brief, EURUSD is expected to pause the north-run in the short-term, while in the medium-term, buying interest could advance if the market confirms a climb above the parity level.
Gold’s Bearish Trend Falters, But Sellers Still in Play
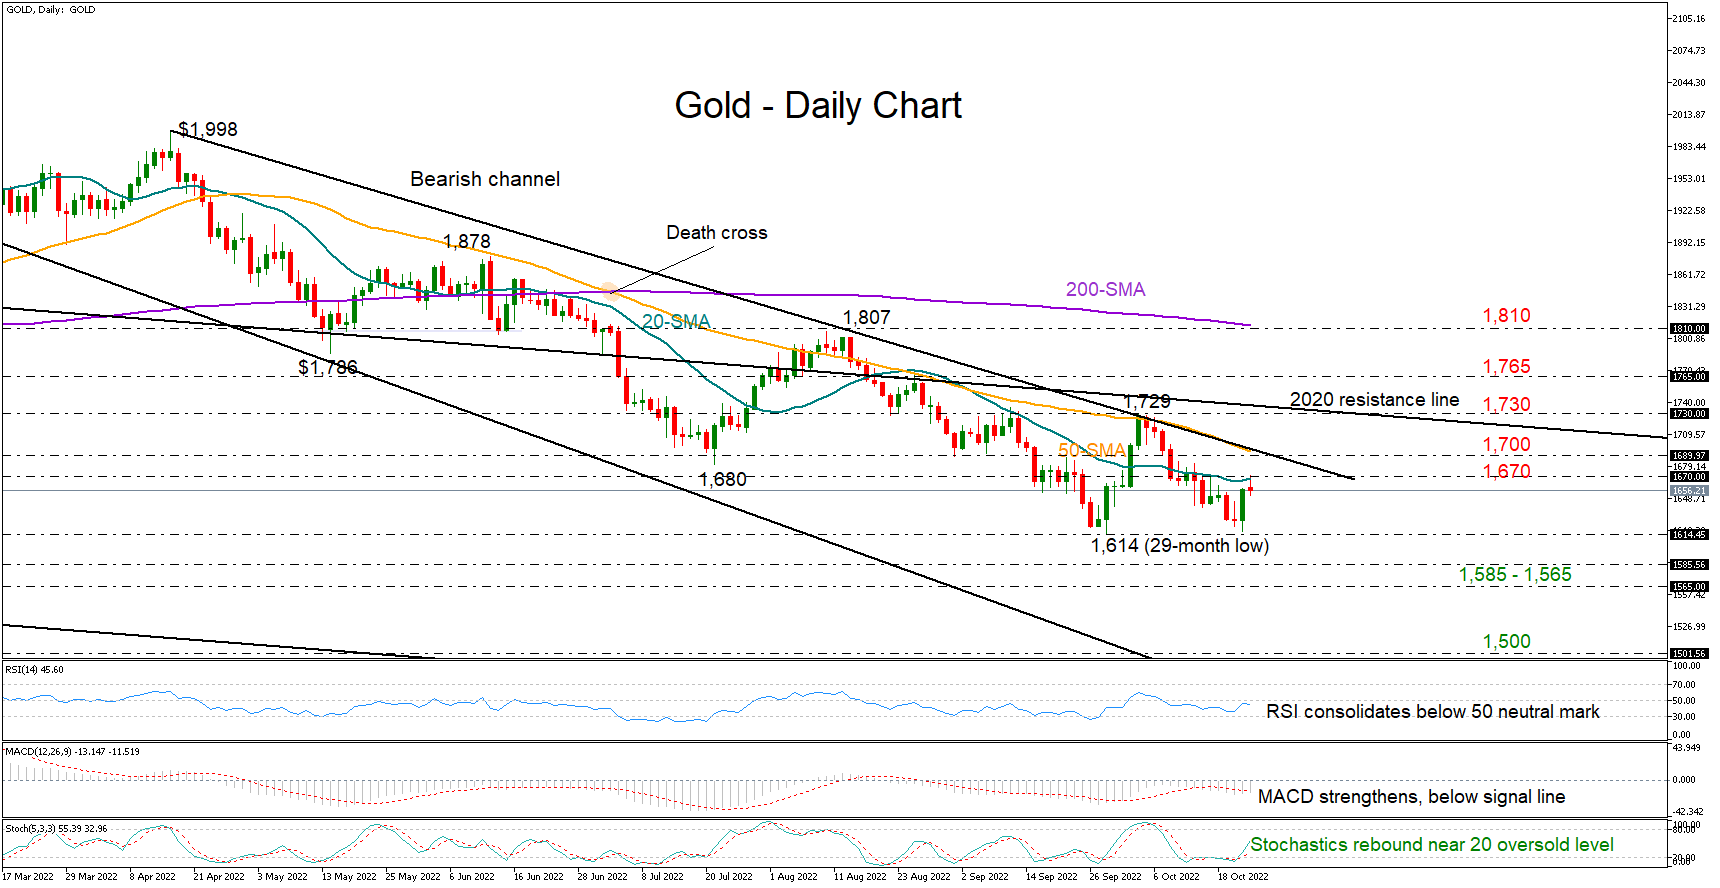
Gold stretched Friday’s upleg to an intra-day high of 1,670 before turning negative again below 1,660 on Monday.
In terms of market trend, the precious metal seems to be forming a bullish double bottom pattern around 1,614, though a durable extension above the 1,730 neckline is required to confirm it.
Encouragingly, the previous three candlesticks resembled a bullish doji setting, increasing hopes for an upside reversal too.
In the meantime, though, the technical oscillators suggest that the market may keep facing choppy trading as the RSI remains below its 50 neutral mark and the MACD hovers beneath its red signal line despite an attempt for an upside reversal.
The flattening 20-day simple moving average (SMA) at 1,670 has been curbing upside corrections for almost a week. Therefore, a close above it may help the price reach the surface of the bearish channel and the 50-day SMA around 1,700. If buyers push the price higher, the door will open for October’s high of 1,730, while higher, some consolidation could emerge around 1,765 before the focus shifts to the 200-day SMA at 1,810.
In the bearish scenario, where the 1,614 floor collapses, the price could chart a new lower low within the 1,585-1,565-zone taken from January-April 2020. The 1,500 psychological mark could come into view next.
In brief, although gold’s bearish trend is showing some signs of exhaustion, there are still a couple of key obstacles overhead which the price needs to tackle in order to upgrade its negative outlook.
USD/JPY Top? Reversal Confrimed by BoJ But Not by 10-yr US Yield, Yet
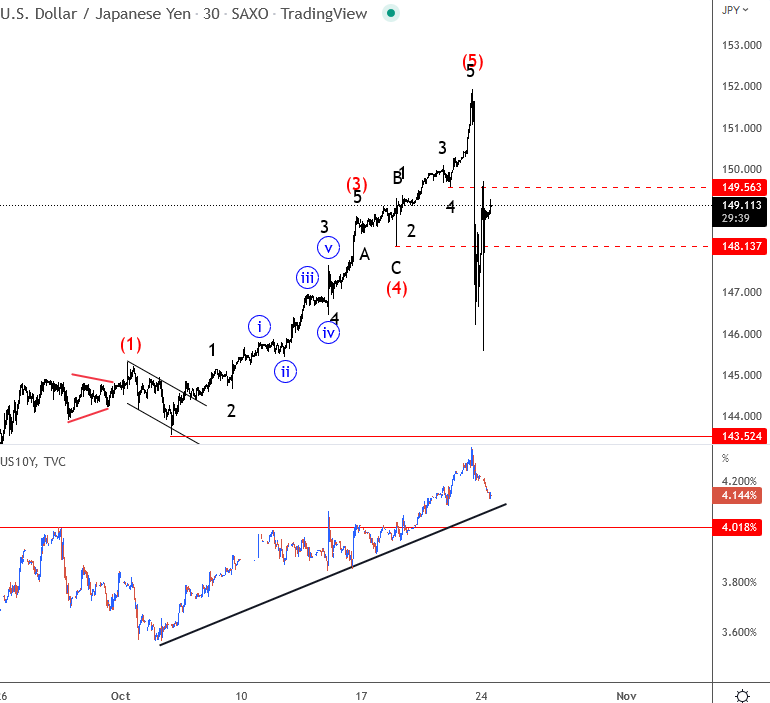
Markets finished last week in volatile fashion after a drop on USDJPY on speculation of BOJ intervention, which also had an impact on other markets. This JPY volatility has resumed today with another back and forht moves with 400 pips on USDJPY following Japan’s top currency diplomat Masato Kanda comments from clarifying whether they intervened in the market but reiterated that they will continue to take appropriate action against excessive, disorderly market moves. We see sharp drop on USDJPY after a completed five wave rise near 152. Notice that the drop is sharp, but not clear if that is a top. It may all depend on the upcoming direction on US yields, which so far turned nicely down, but cant say that uptrend is down when trendline still holds and yields trades above 4%.
GER 40 Bounces Higher
The Dax 40 bounces back as traders take profits ahead of another rate hike by the ECB. Sentiment has improved a bit after the bulls managed to push past 12670, prompting the opposite side to cover. The current phase of recovery will see whether there is enough follow-up interest in a sustained reversal. 12550 at the base of the breakout is a key support. A close above 12930 could pave the way for a rally back to 13200 then September’s high at 13500. A bearish breakout, however, would send the index back to 12320.
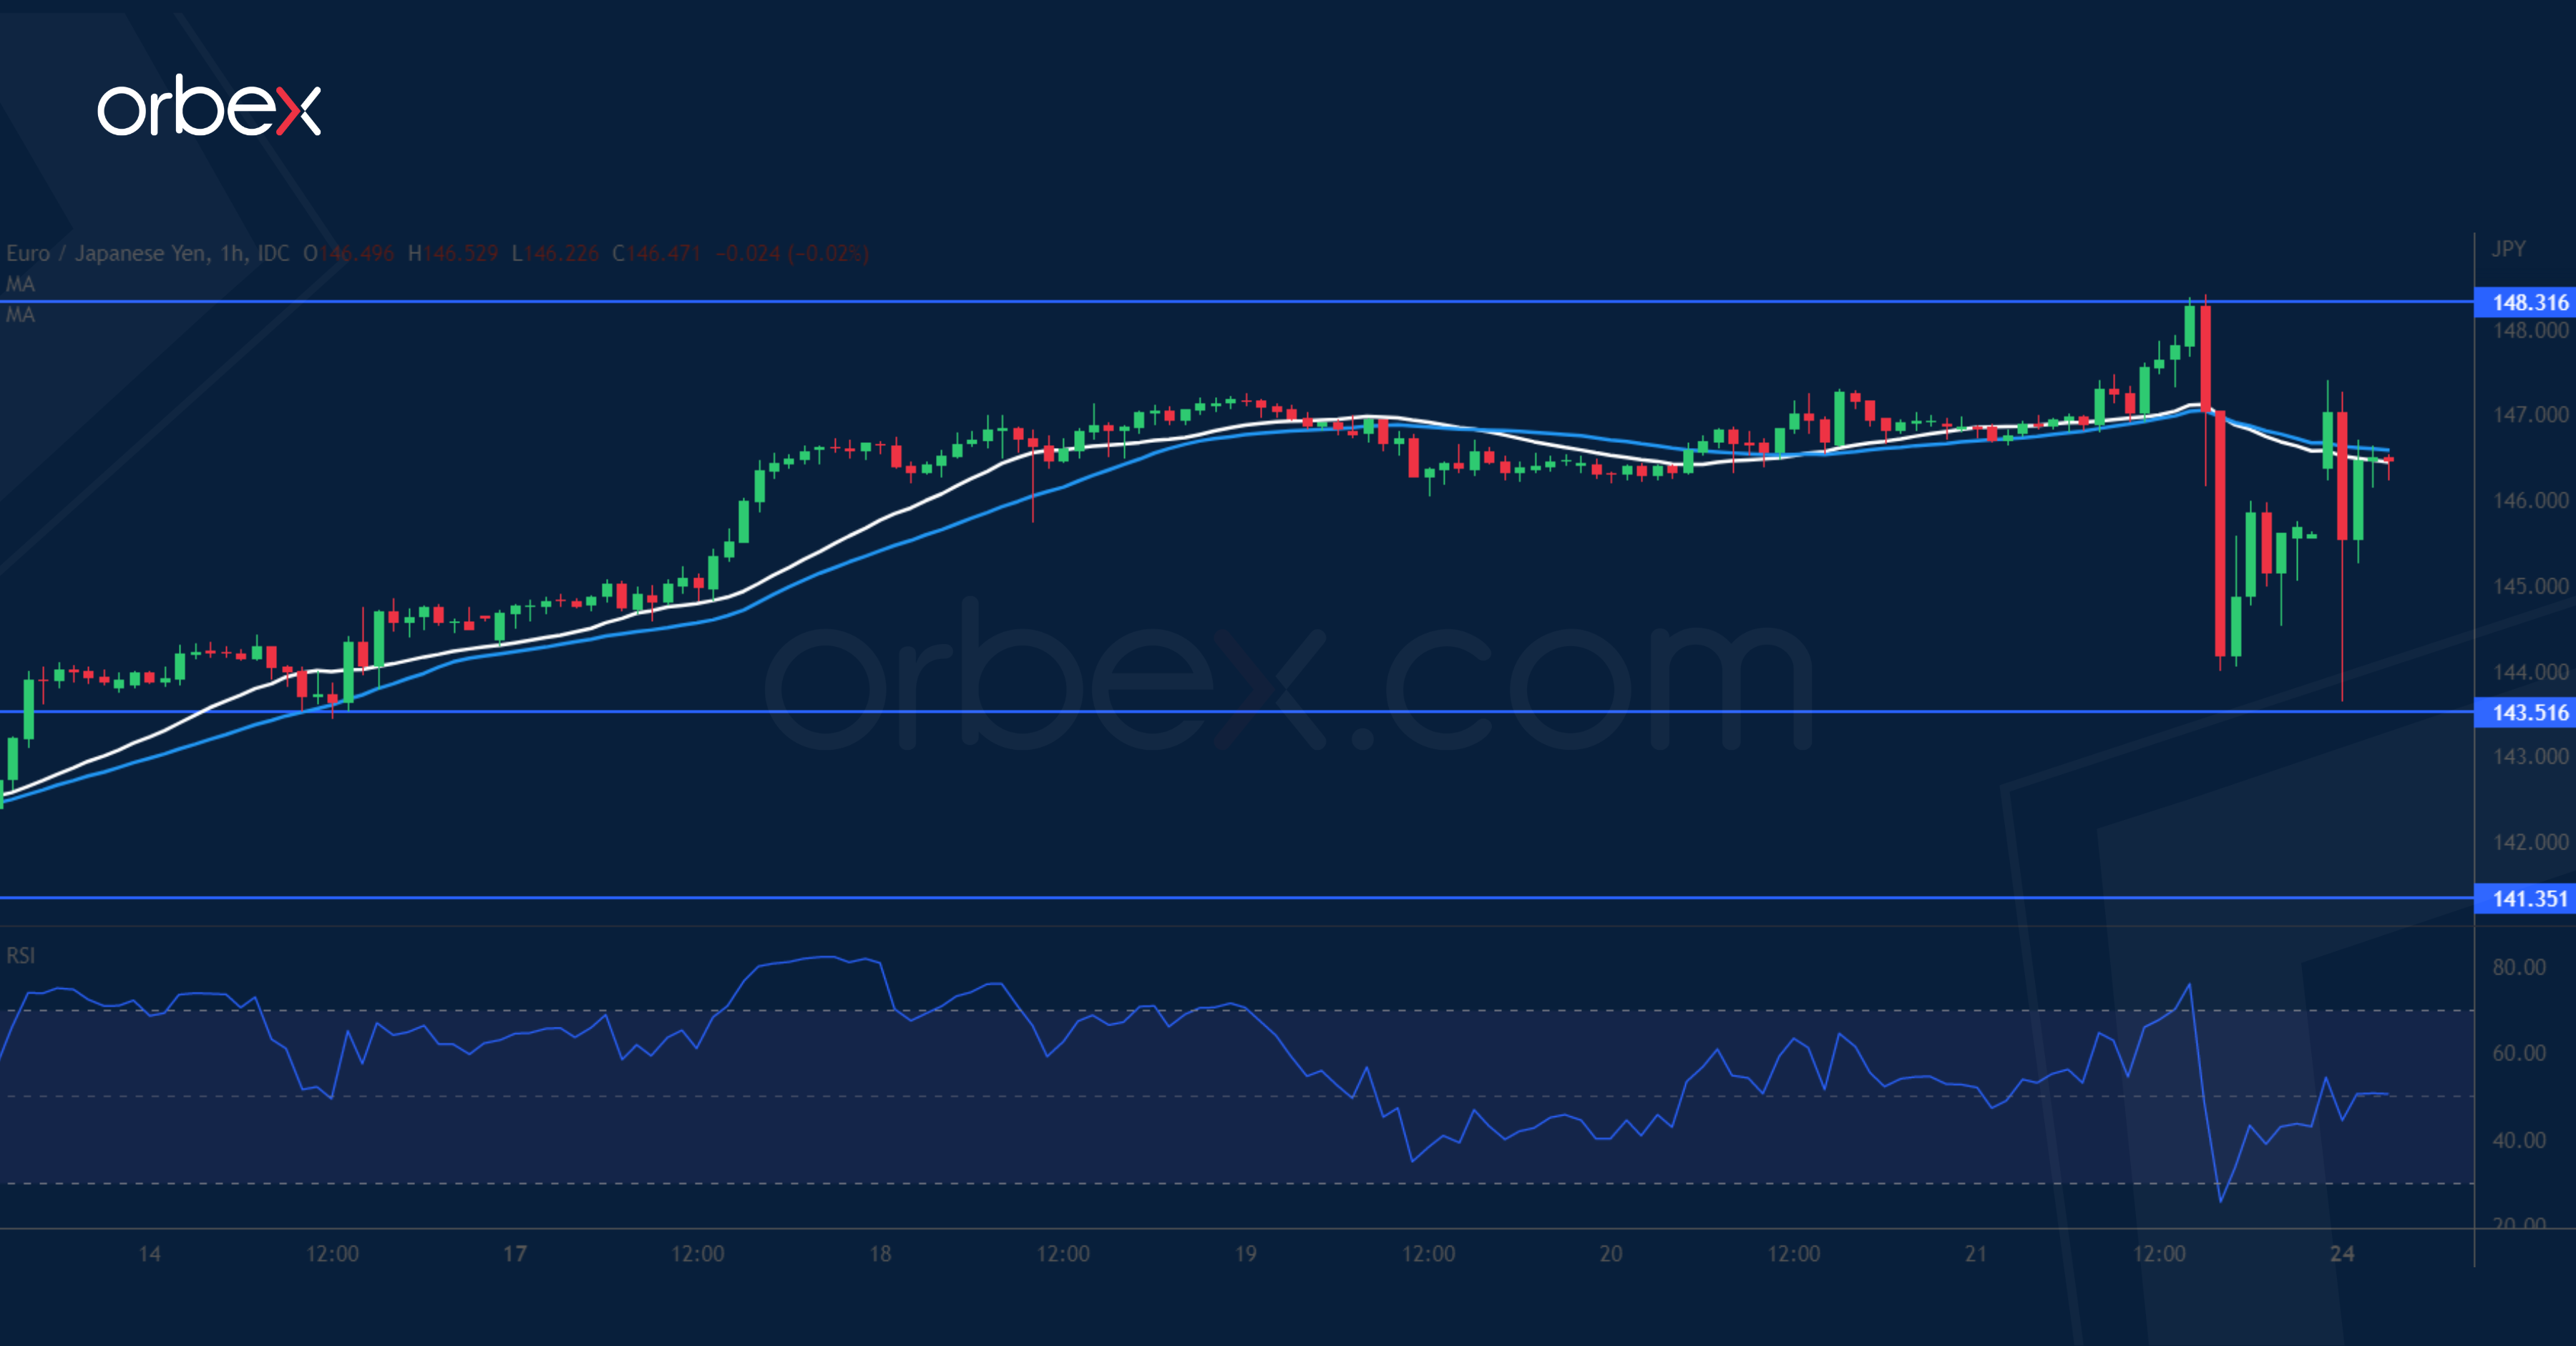
EUR/JPY Seeks Support
The yen surged after Japan intervened for the second time in a month. A fall below 146.70 forced some buyers to bail out but has barely dented the bullish bias. The overall rally had accelerated after it broke above September’s high at 145.00. A bullish MA cross on the daily chart is a sign of increasing momentum and buyers would rather see the pullback as an opportunity. 143.50 next to the 20-day moving average is a fresh support, and a close above 148.30 would carry the pair to December 2014’s high at 149.70.
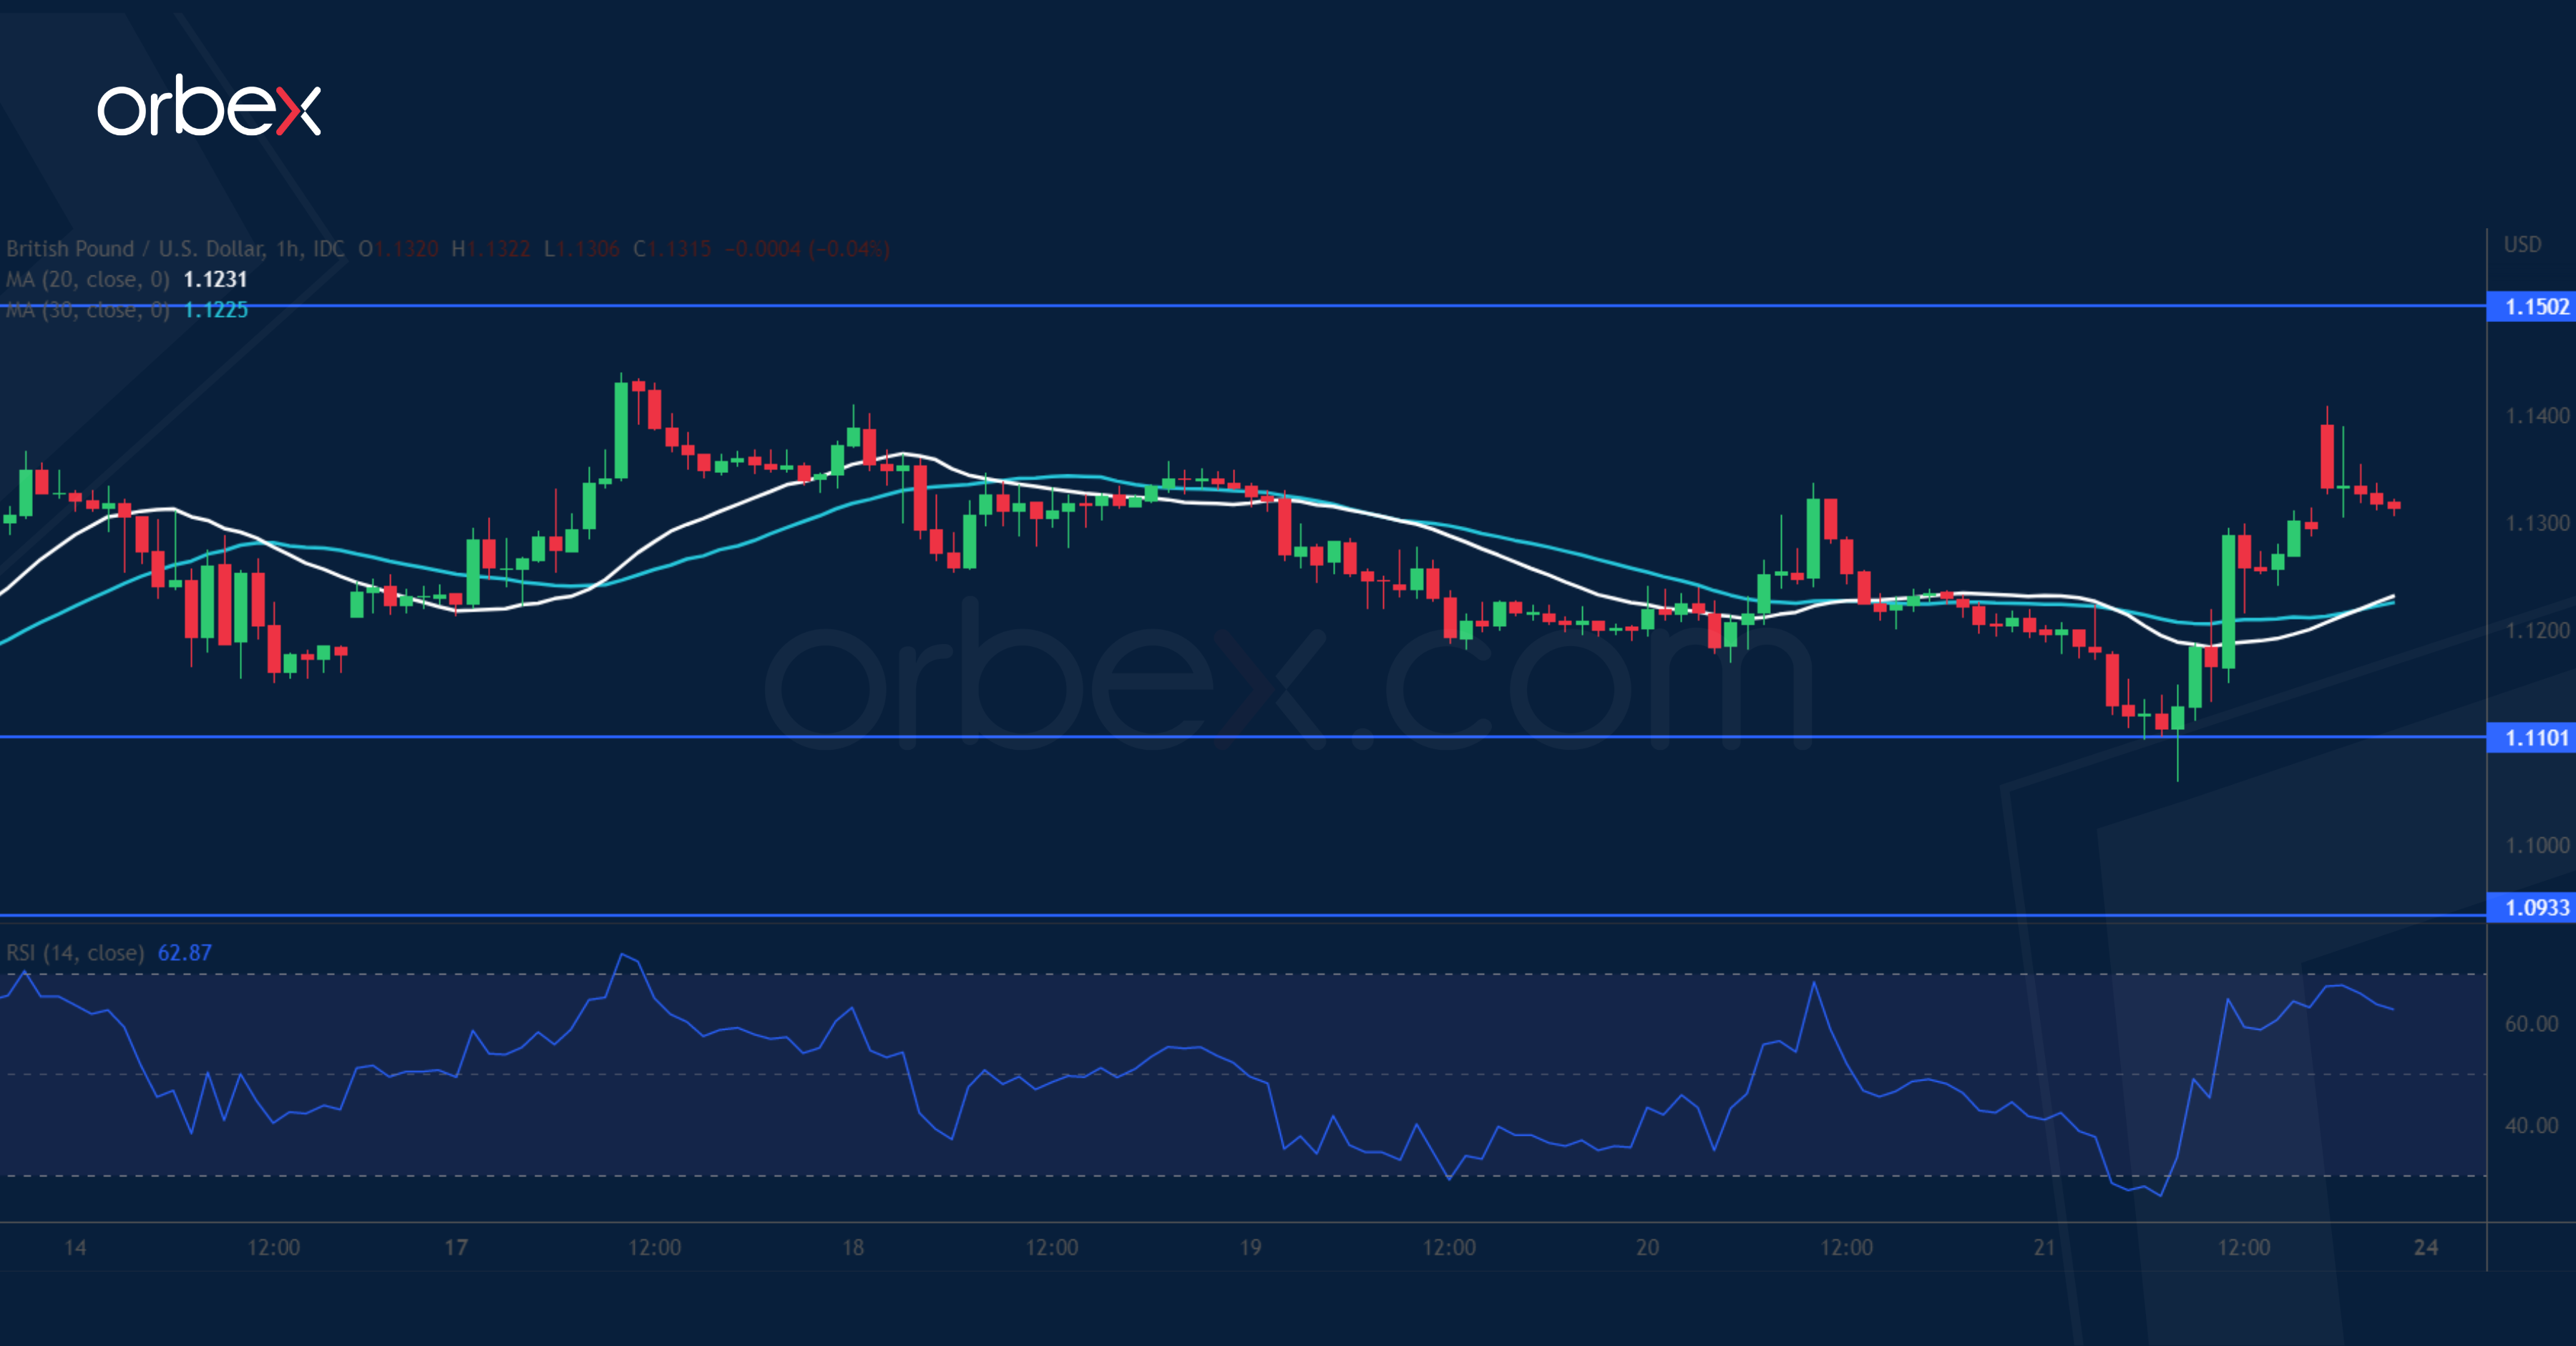
GBP/USD Finds Bids
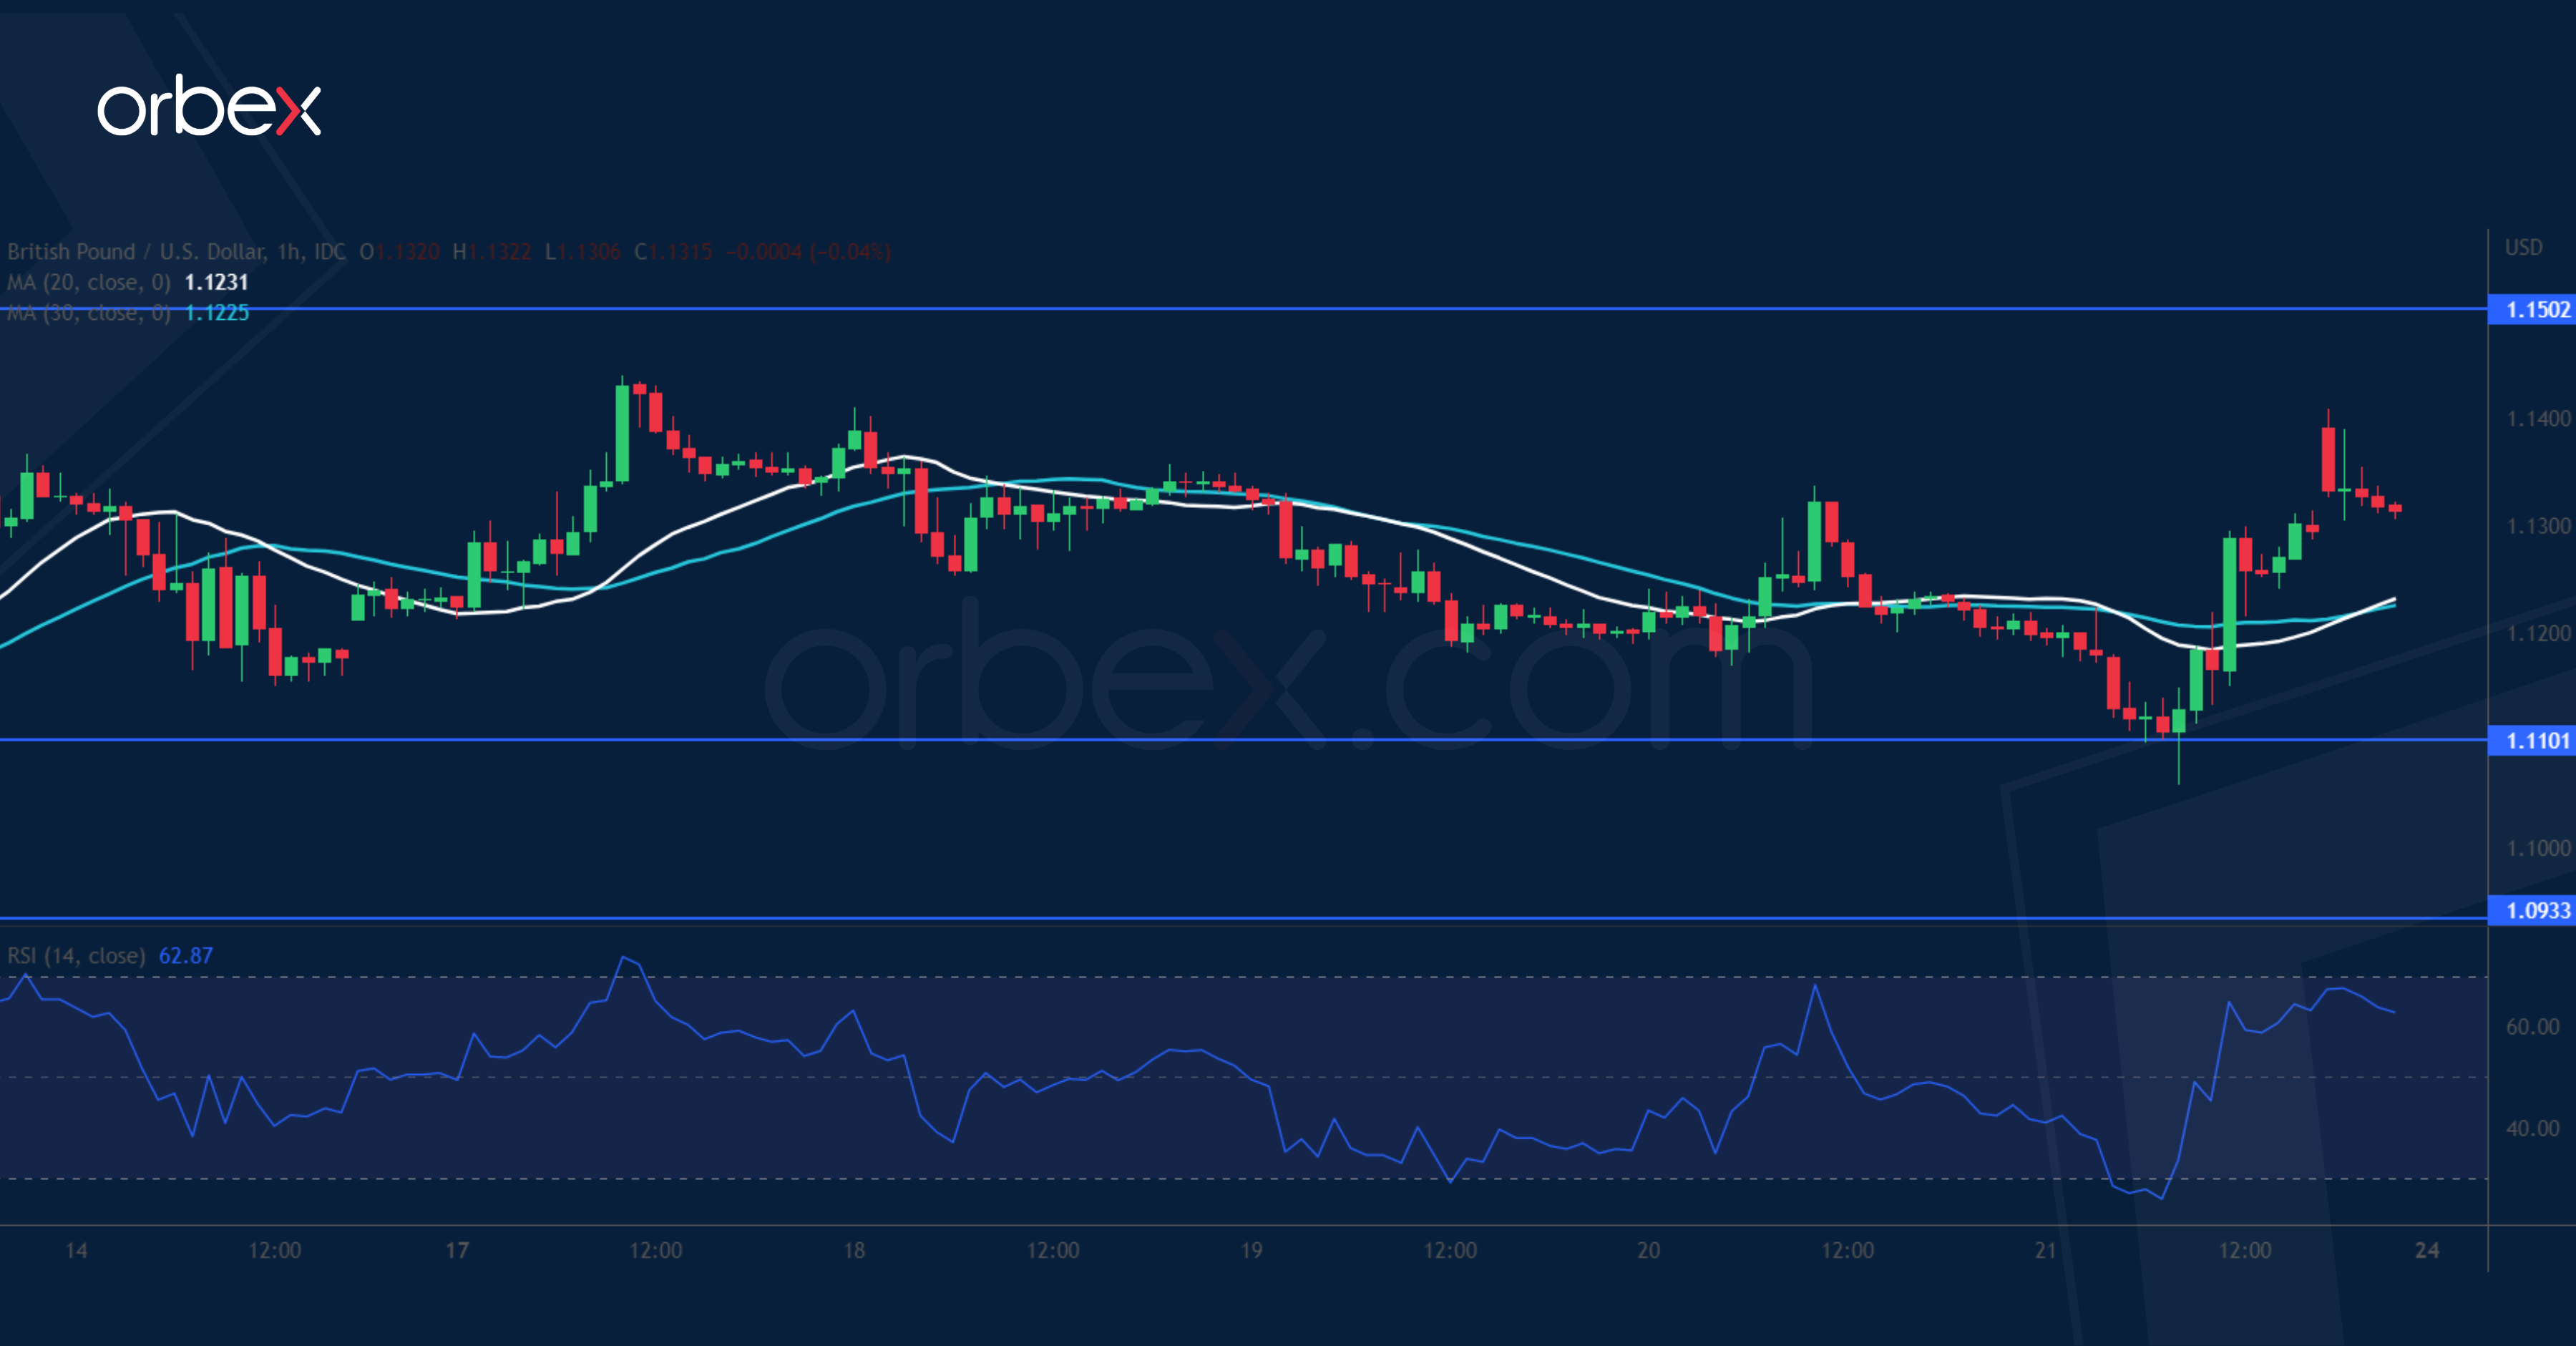
The US dollar softened after Treasury Secretary Yellen said inflation was not entrenched. After receding from the previous high at 1.1500, the pound found support at the base (1.1100) of the current rebound. This is a sign of solid interest in keeping Sterling afloat. An oversold RSI has attracted some bargain hunters. A break above 1.1500 would cause a short squeeze and raise short-term volatility. Then September’s high and a major daily resistance at 1.1710 could be in sight. A fall below 1.1100 may resume the downtrend.
Gold Price is Correcting Lower from the $1,670 High
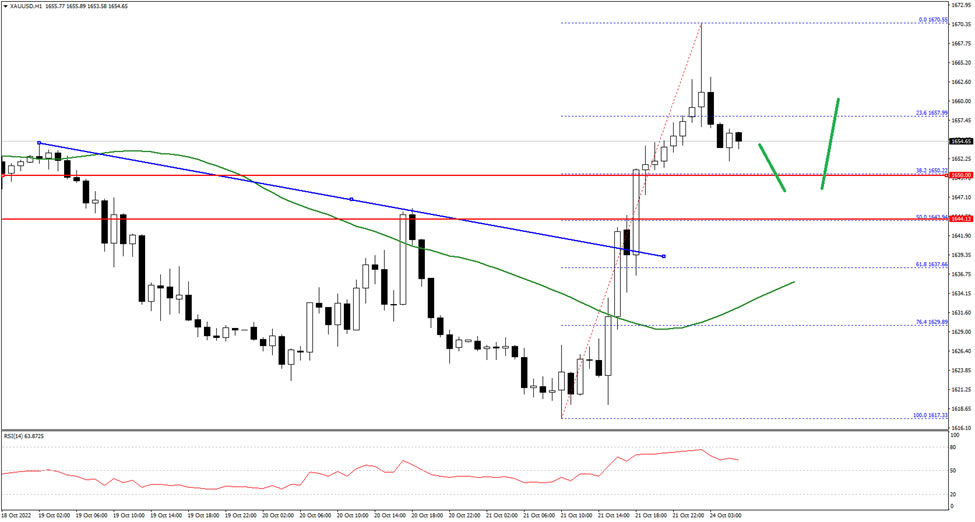
Gold price started a decent increase from the $1,620 zone against the US Dollar. The price gained strength and was able to clear the $1,640 resistance zone.
The pair even climbed above the $1,650 level and the 50 hourly simple moving average. A high was formed near $1,670 and the price is now correcting lower. On the downside, the price is holding the $1,650 support zone.
The next major support is near the $1,640 level, below which the price might decline towards the $1,625 support level in the near term. Any more losses might call for a test of $1,612 on FXOpen.
On the upside, the first major resistance is near the $1,665 level. The next main resistance could be near the $1,670 level, above which the price could start another steady increase towards the $1,700 level.