Sample Category Title
EUR/USD Resumes Higher after Hawkish ECB Last Week – Elliott Wave Analysis
USD resumes lower and EUR higher as speculators believe that ECB will follow the FED and sticks to hawkish policy despite the energy crisis and recession risk which has been highlighted by some ECB members as well. There is an impulsive activity on EURUSD pair with room for more upside but possibly after a pullback, ideally into open gap to be filled. US yields also not confirming USD strength for now, so I think USD will try to make something back first before weakness will resume. But generally speaking, I think that USD will be headed lower this week, especially when looking at strong stocks, metals, and crude oil. I will pay close attention to commodity pairs for more upside, but more about this in some of our next updates.

EURUSD Battles with 50-day SMA as Rebound Strengthens
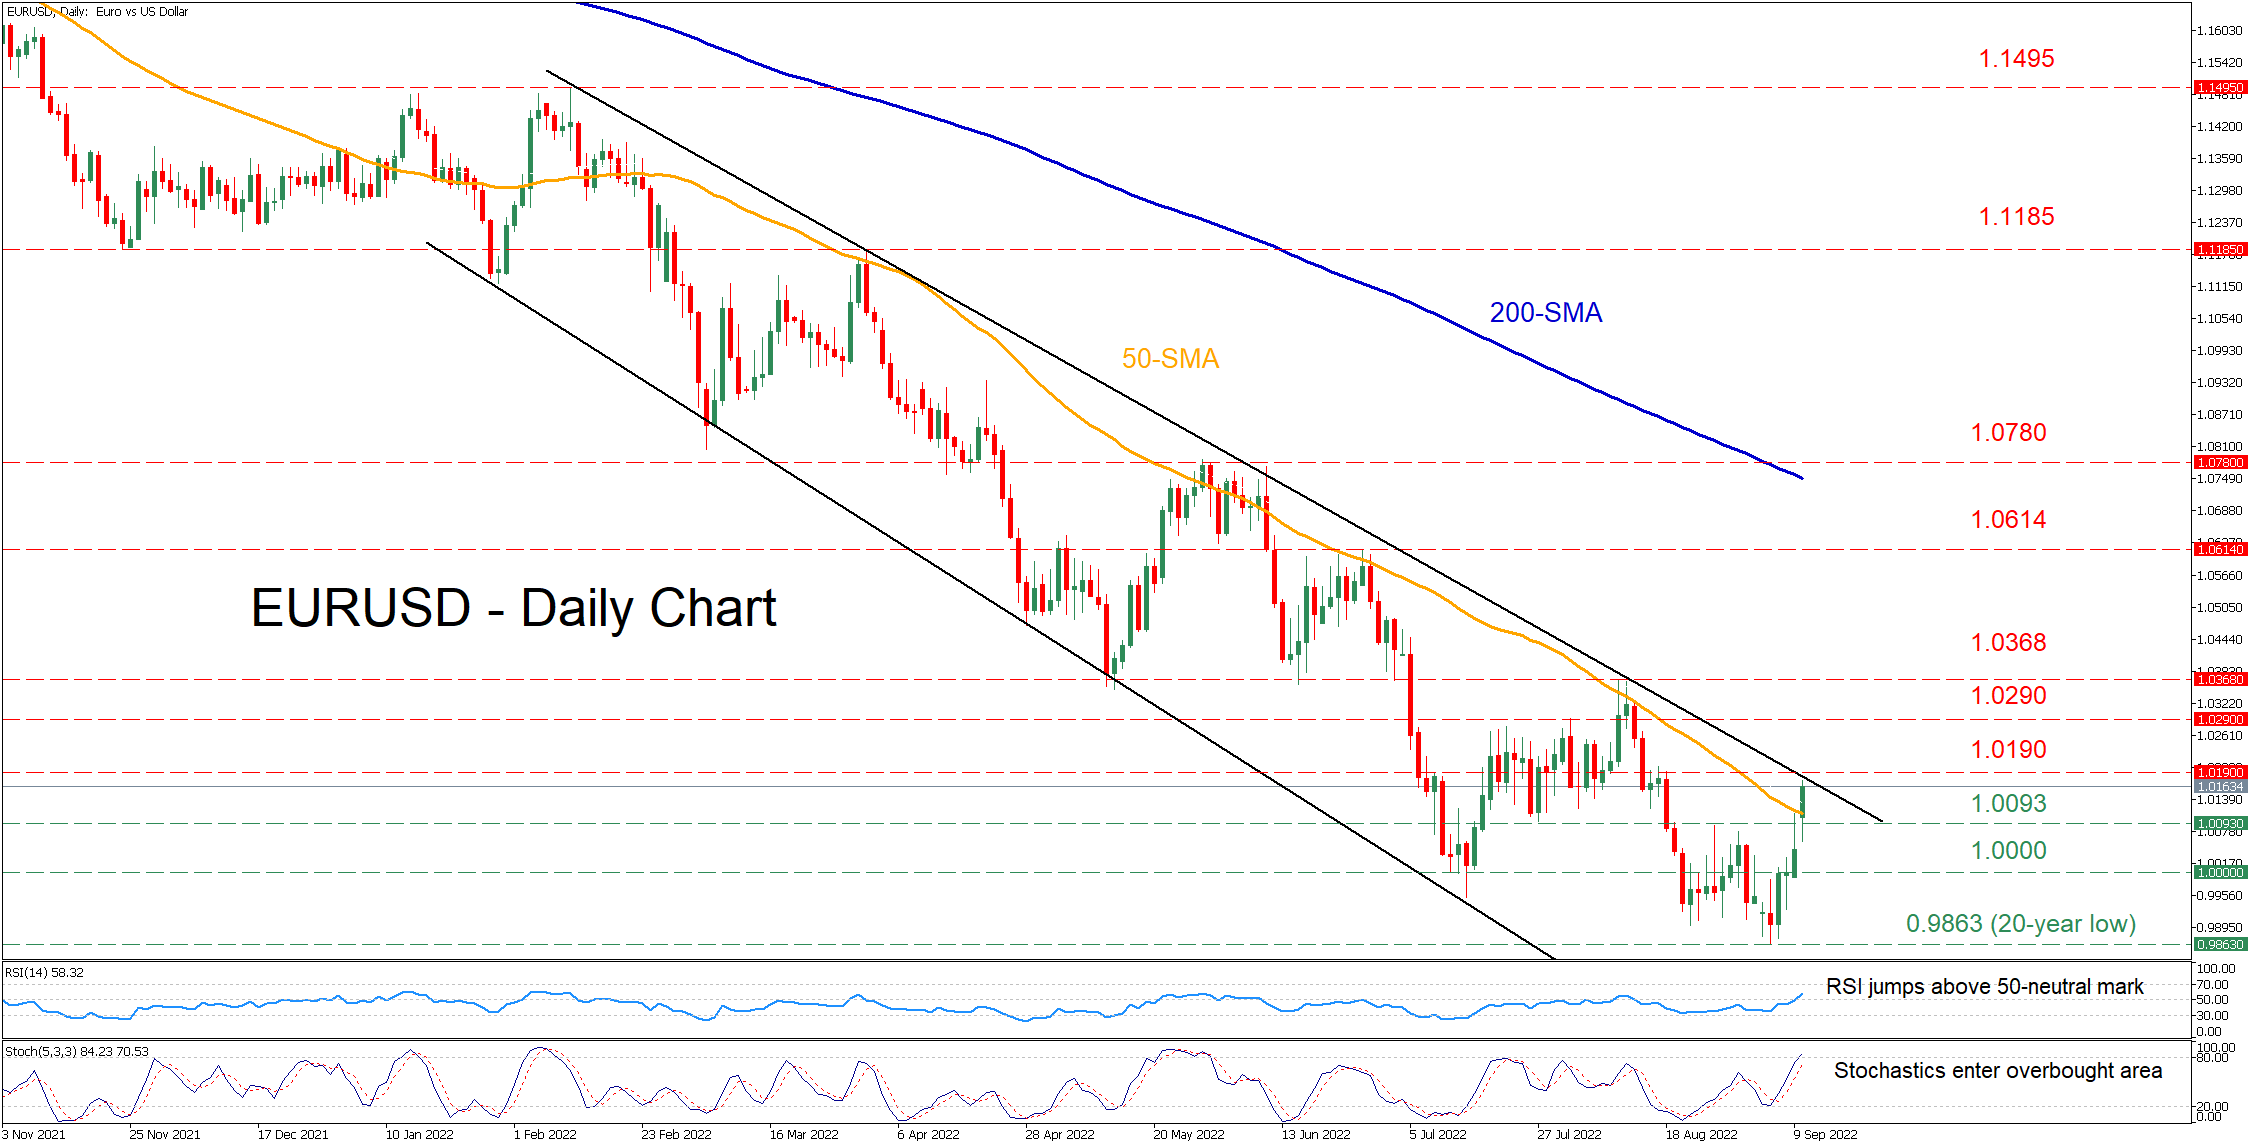
EURUSD has been losing ground since the beginning of the year, creating a clear structure of lower highs and lower lows within a descending channel. Nevertheless, after managing to find its feet at the 20-year low of 0.9863, the pair is pushing for some recovery, currently challenging the 50-day simple moving average (SMA).
The momentum indicators also suggest that bullish forces have gained the upper hand. Specifically, the RSI has jumped above its 50-neutral mark, while the stochastic oscillator is ascending into the overbought area.
Should buying pressures intensify and the price profoundly cross above its 50-day SMA, initial resistance could be encountered at the 1.019 hurdle, taken from the pair’s descending trendline. Conquering this barricade, the bulls could aim for 1.0290 before the July peak of 1.0368 comes under examination. Even higher, the 1.0614 resistance zone could prove to be a tough one for the pair to overcome.
On the flipside, bearish actions could send the price to test the recent resistance region of 1.0093. Sliding beneath that floor, the spotlight may turn to parity, which is considered a crucial psychological mark by markets. A violation of the latter could pave the way for the 20-year low of 0.9863.
In brief, EURUSD is attempting a rebound but the road to complete recovery remains long. Therefore, initial steps will be taken if the price clearly closes above its 50-day SMA.
US August CPI ahead of Fed Meeting
Tomorrow is likely to be one of the most important days for the markets this week, because we get some crucial data ahead of the FOMC meeting next week. To make matters more interesting, the Fed is already in its blackout period. Meaning officials are likely to not respond to the data, and provide some context on how it could affect the interest rate decision.
The market is pricing in a 75bps hike at the next meeting, based on expectations that inflation will remain high. But this opens the question of what could happen with the data that might change those expectations? Can the Fed be dissuaded from a "triple hike"?
What's driving the moves
The Fed is looking to restore what it calls "credibility", in order to "anchor" inflation expectations. This is because the economic theory that the Fed is following argues that prices fluctuate primarily based on whether market makers think prices will go up. It's the job of monetary policy, therefore, to "anchor" those expectations at a certain level. How? By ensuring that market makers believe that the Fed will do what it takes to get inflation back to that level. That belief is called the "credibility" of the bank. Which is why there is such a strong push by the Fed at the moment to communicate that interest rates are going to keep rising.
But the purpose is to get inflation to go down. So, if inflation has peaked, then it could be understood that inflation expectations are starting to get "anchored" and the Fed has retained its "credibility". Therefore, further aggressive hikes might not be needed. Since bond values are pricing in where the rates will be in a few months, when the Fed will start slowing the pace is the key to markets. If inflation comes down, it might signal that interest rates won't rise as fast, which could continue to weaken the dollar.
What's in the data
The headline number is what's going to get most of the media coverage, since that's what affects consumers most directly. Annualized August CPI Change is expected to slow down to 8.1% compared to 8.5% prior. That would be the second consecutive months of declines, and might start providing a more convincing case that inflation has peaked.
But the Fed cares more about the core inflation rate, which doesn't consider the variation in the cost of food and fuel. We have to remember that food prices have continued to rise, but fuel prices have been declining since June. WTI Crude, the benchmark for US fuel prices, fell below $90/bbl last month, continuing a lower trend due to slowing demand.
Potential Fed reaction
Core August annualized CPI is forecast to accelerate to 6.1% from 5.9% prior. This would bring it back up to a rate not seen since May, and be more than three times the Fed's target. With crude prices going down, a rise in core rate could imply a more systemic price problem. That would likely make the Fed even more eager to restore "credibility" by hiking rates.
If headline inflation falls, but core inflation increases, the Fed is likely to stick to its hiking path. But if core inflation were to unexpectedly come in below 5.9%, it would imply that the trend remains downwards since April, and could lead to a reevaluation of how many hikes we can expect by the end of the year.
US Dollar Index: The index May Have Started Forming a Bearish Trend
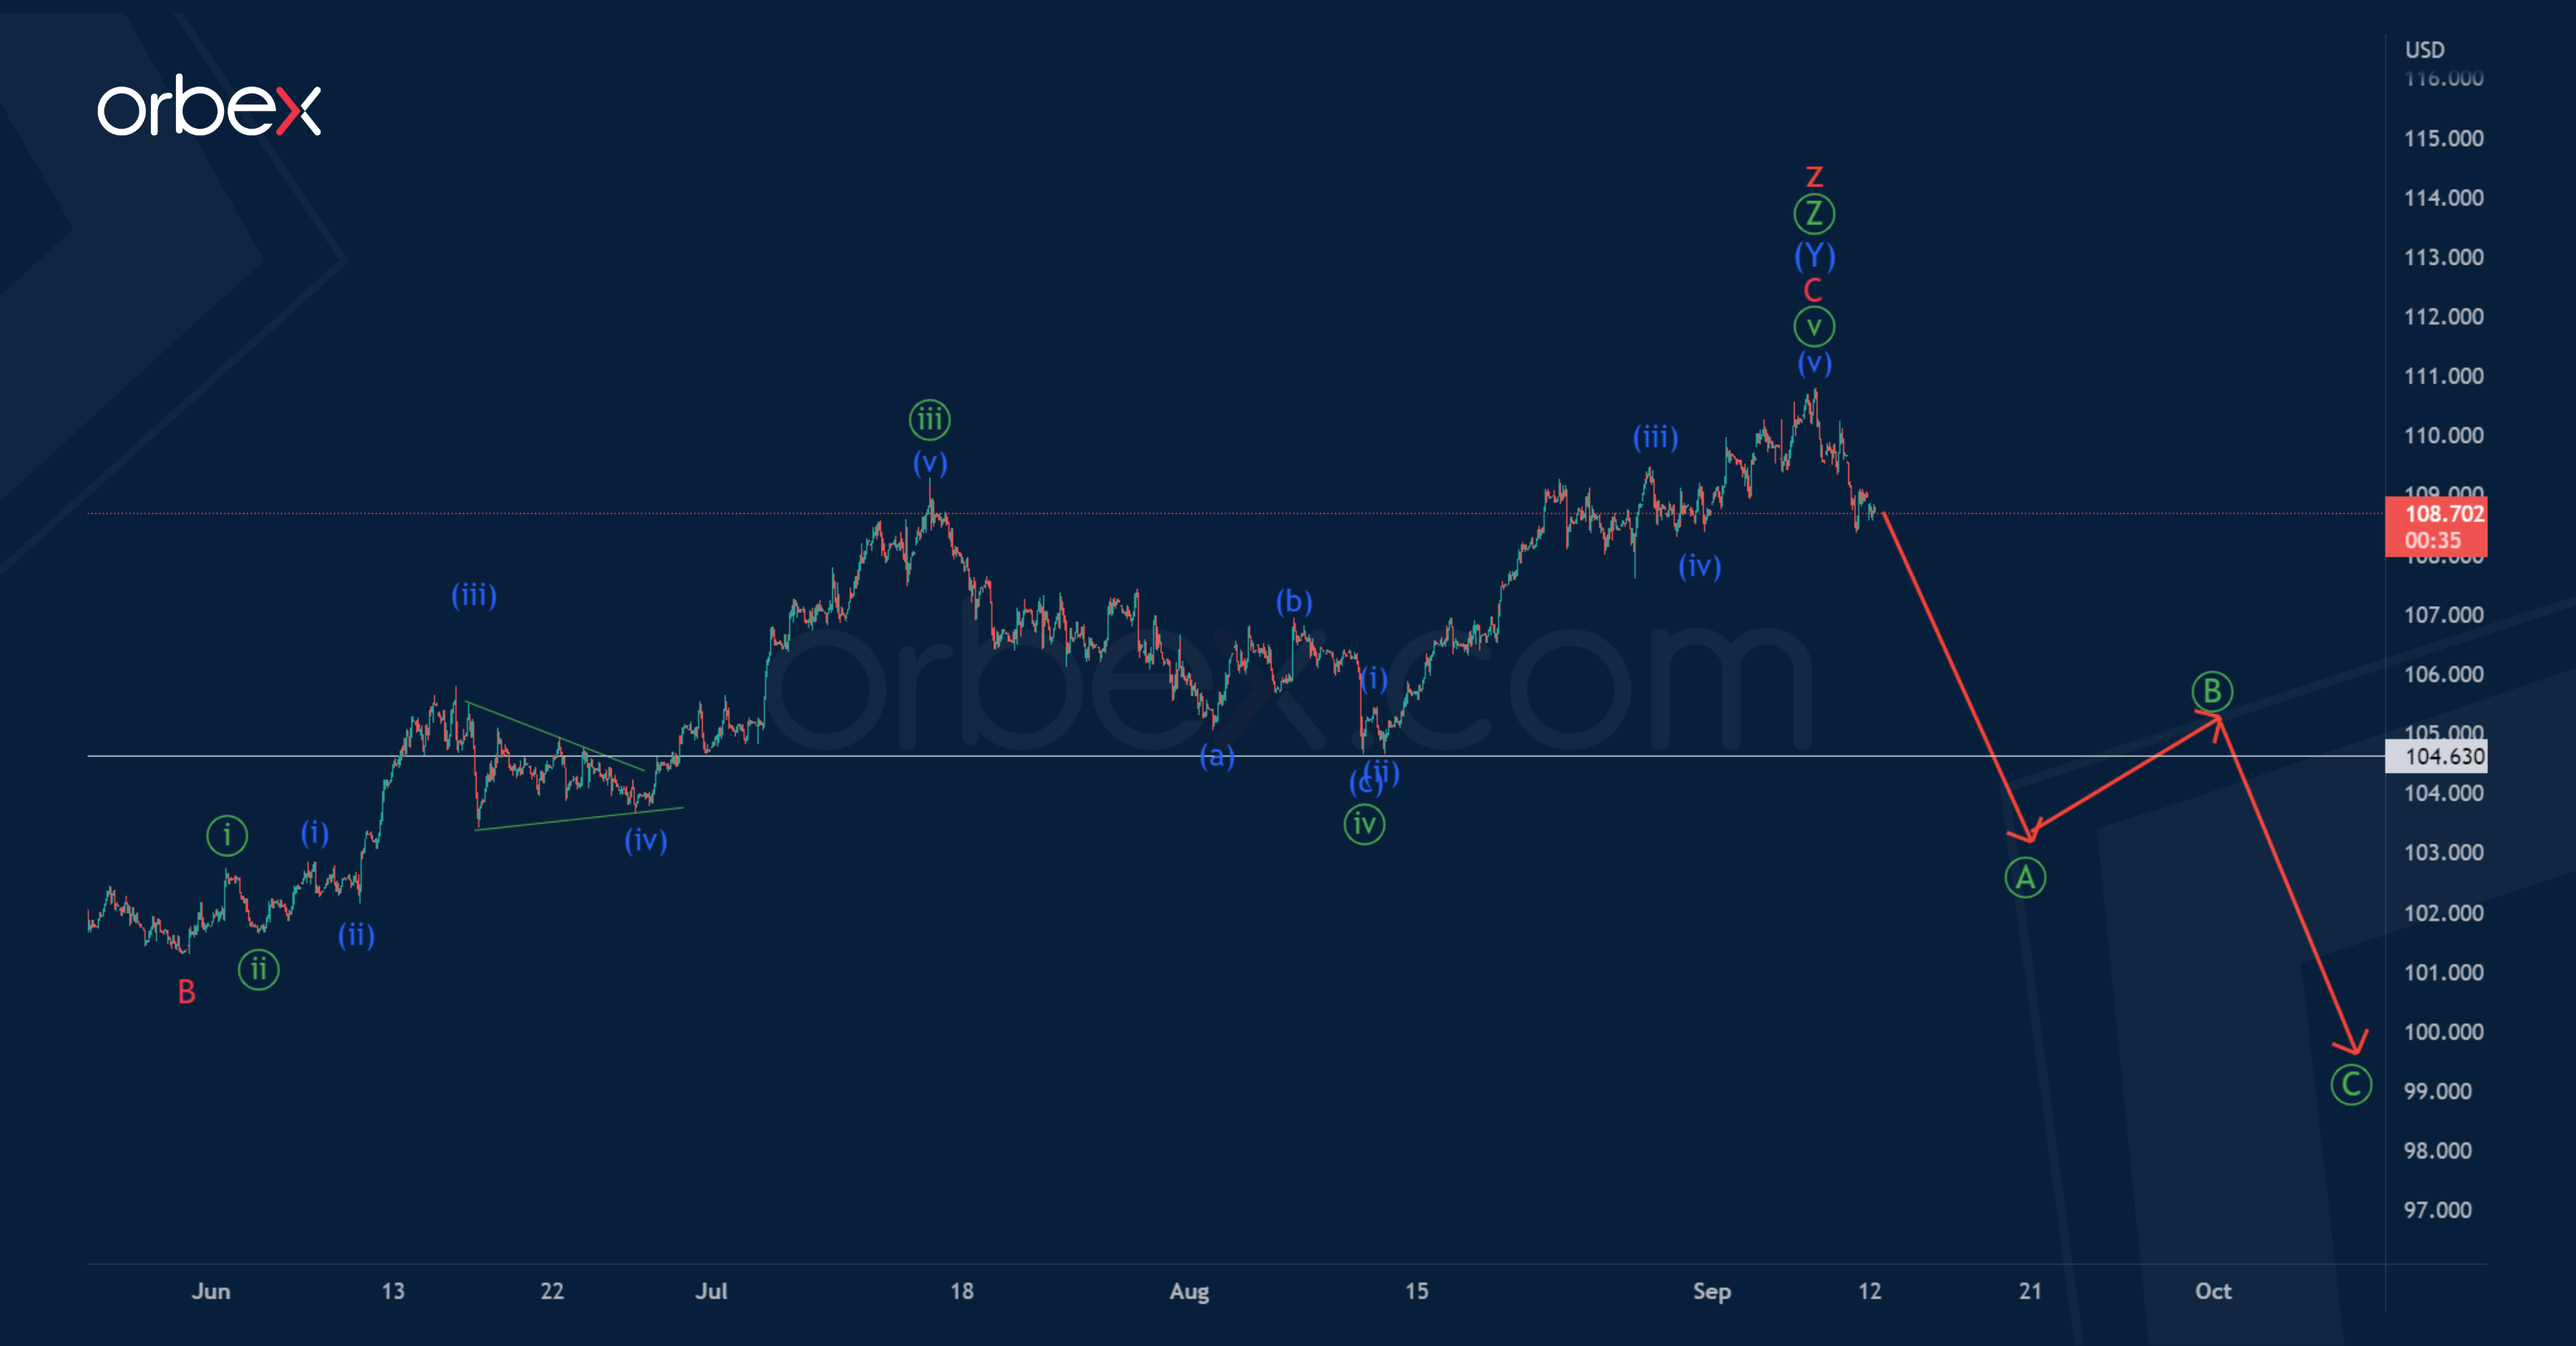
The current chart of the DXY index shows the completion of the global corrective trend, which took the form of a triple zigzag consisting of five main cycle waves w-x-y-x-z.
Thus, the market is currently at the stage of reversal, that is, if this hypothesis is confirmed, the formation of the initial part of a new bearish trend may begin.
It is assumed that the bears are starting to build the first impulse sub-wave of the potential standard zigzag Ⓐ-Ⓑ-Ⓒ. The end of the impulse Ⓐ is possible just below the minimum of 104.63, which is marked by a minute fourth correction.
An approximate scheme of possible future movement is shown on the chart.
Let's look at another option in which the formation of a cycle triple zigzag is not yet fully completed.
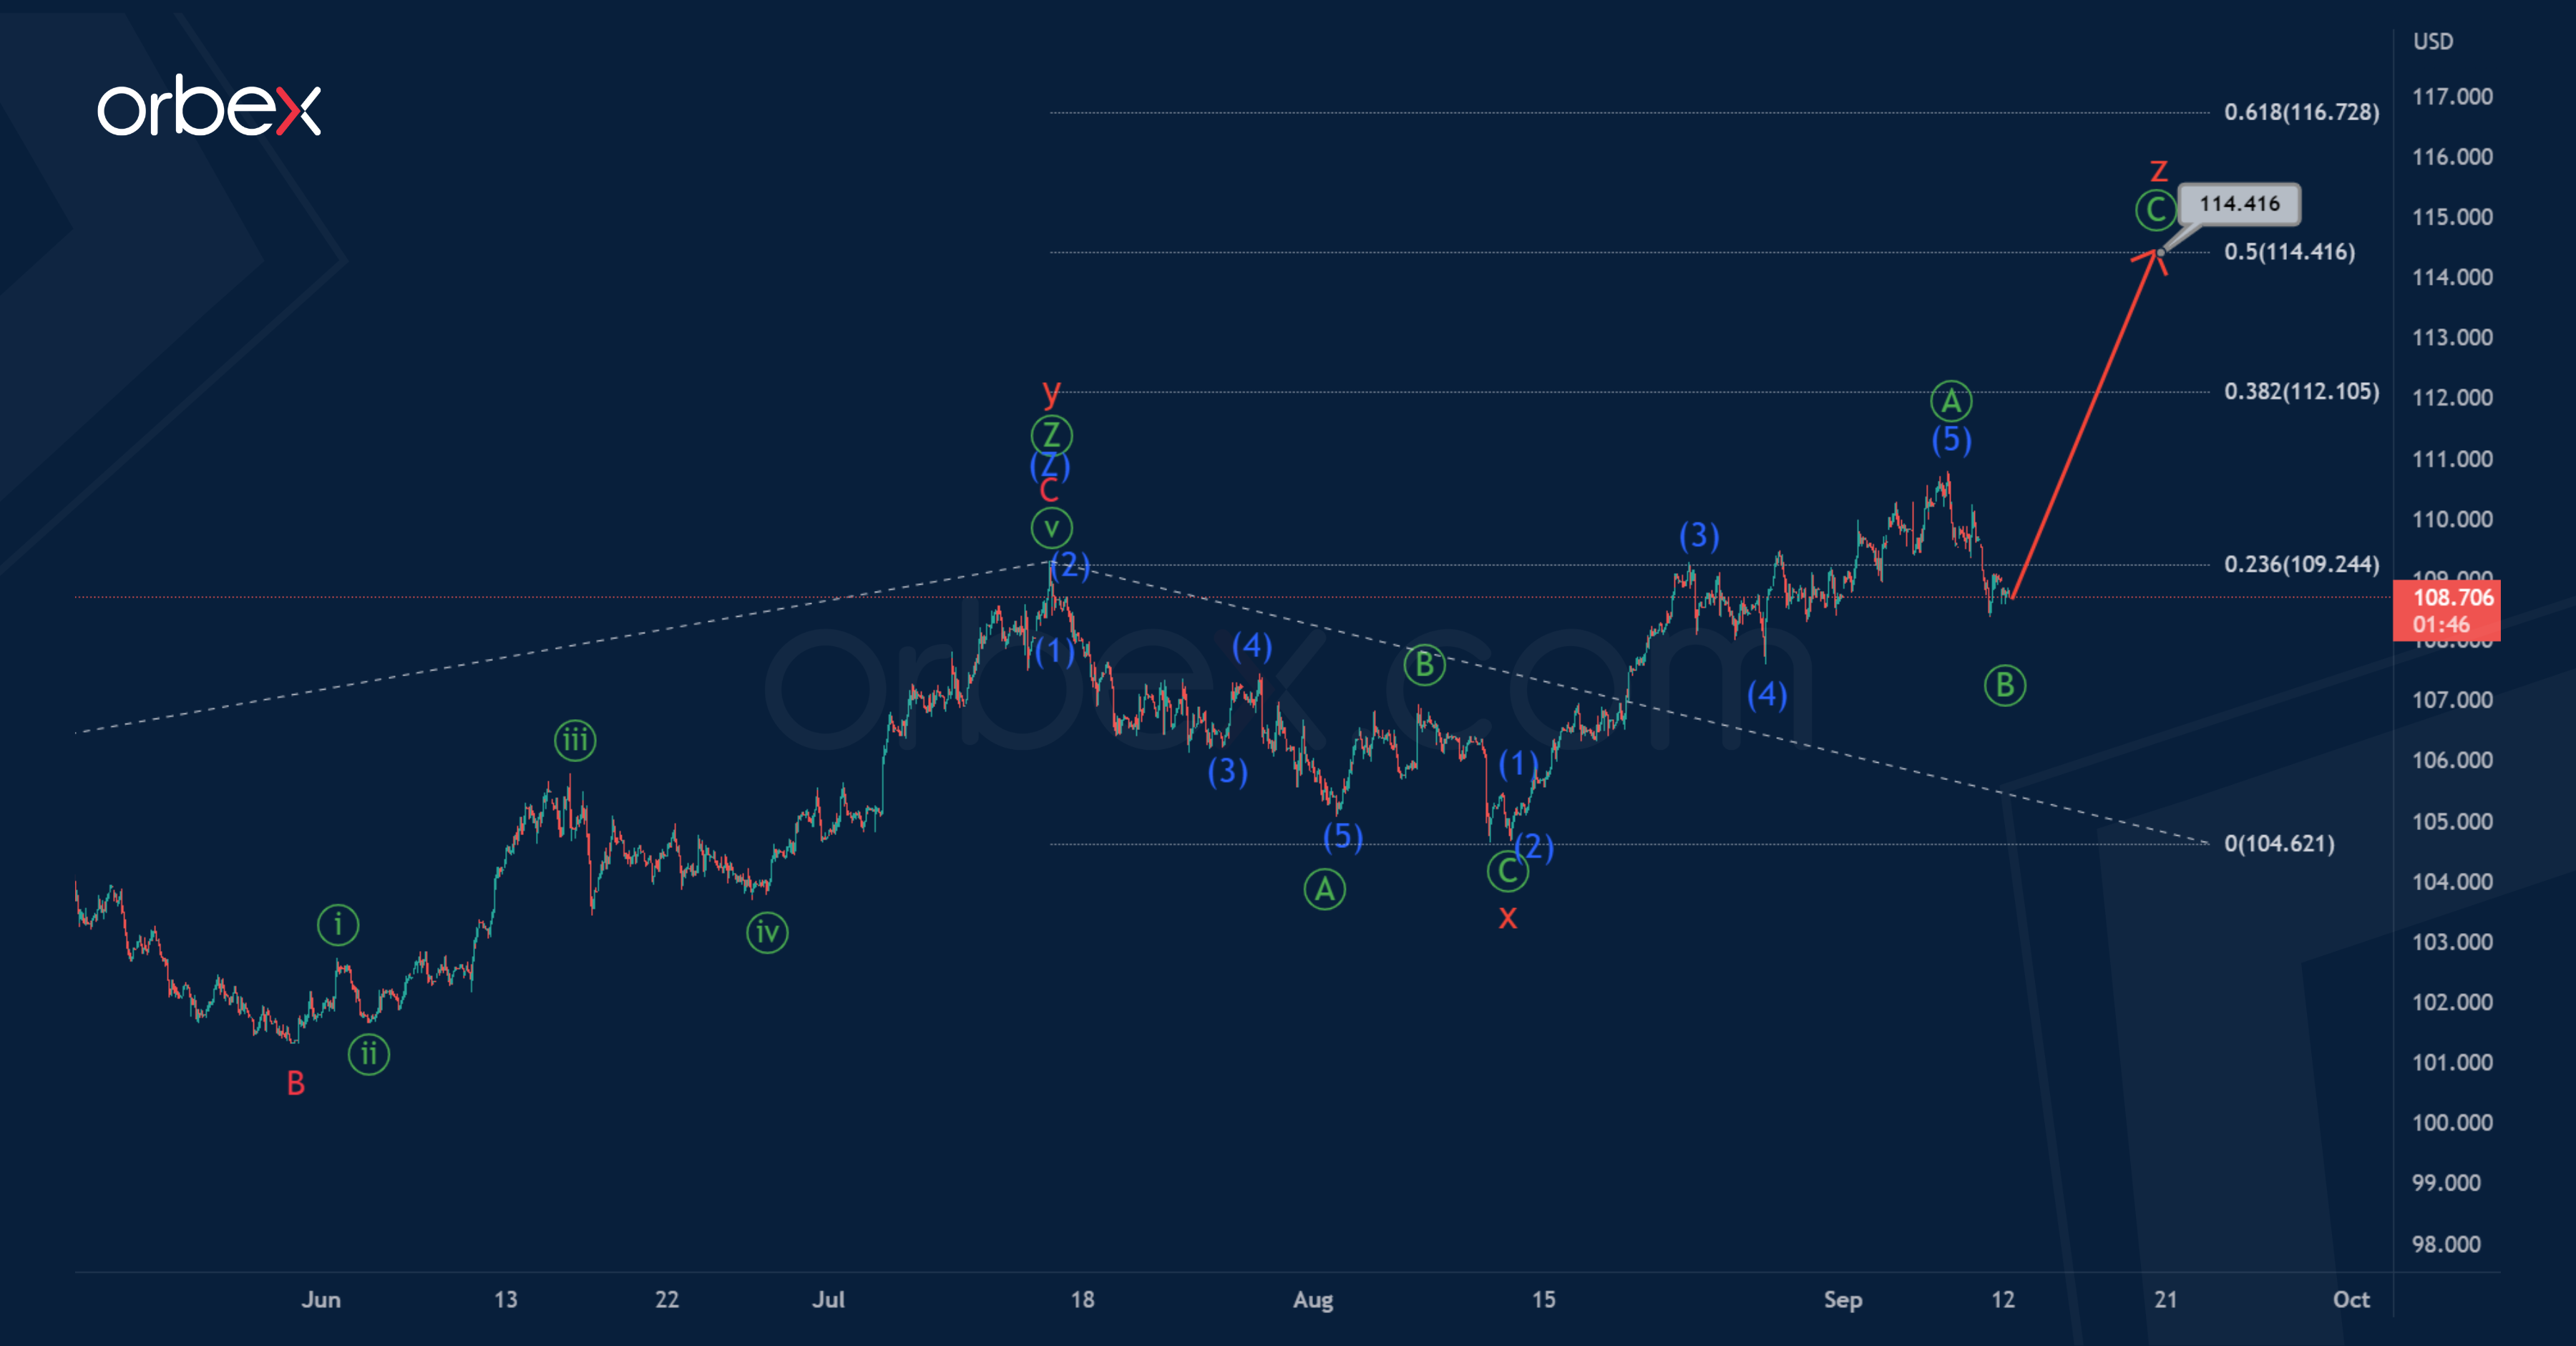
Most likely, the bearish cycle wave x was completed not so long ago, which took the form of a standard zigzag Ⓐ-Ⓑ-Ⓒ of the primary degree. After that, an upward impulse price movement began in the initial part of the wave z.
The wave z may take the form of a zigzag Ⓐ-Ⓑ-Ⓒ, where the first impulse and correction are already completed.
The entire z wave may complete its pattern near 114.41. At that level, it will be at the 50% Fibonacci extension of wave y.
Daily Technical Analysis
EUR/USD
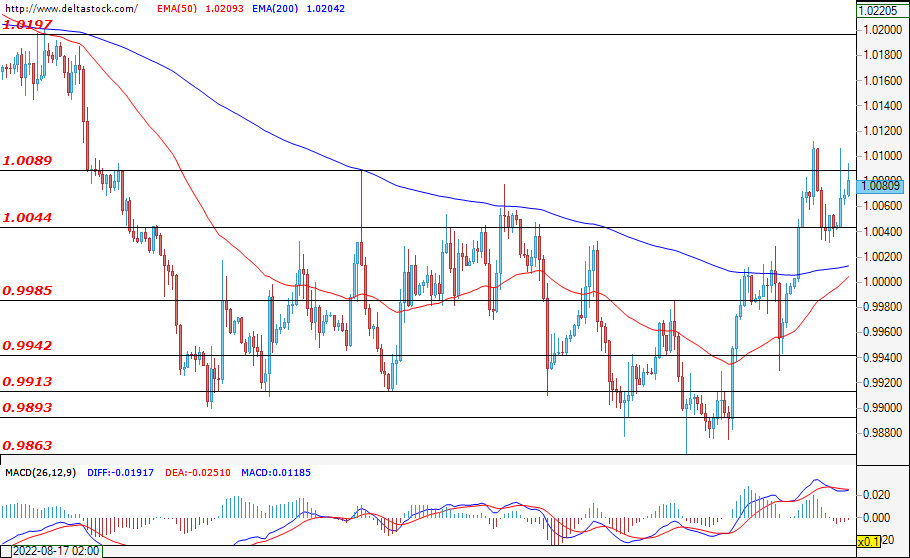
For the single European currency, the beginning of the week started rather positively. After the market opening, the rate tries to hold above 1.0088. The bulls' gains from last week could continue, but for that to happen, they would need to test the second resistance at 1.0197. The bears, on the other hand, will look to steer the pair back towards the support at 0.9985. The downtrend for the euro is probably not over yet, but for now, the positive momentum from the ECB interest rate hike seems to be fueling the rally.
USD/JPY
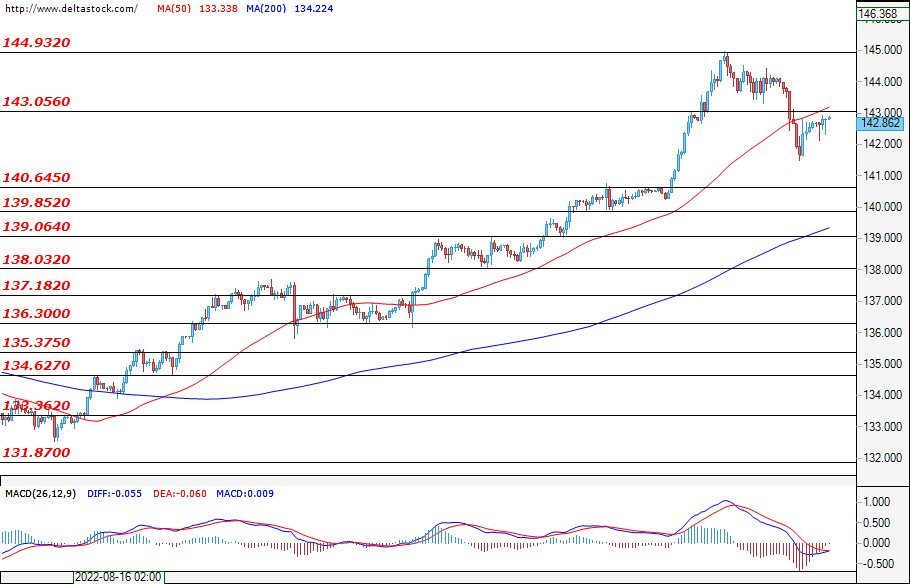
Over the past week, the yen managed to slow the dollar's record gains against it. The price has managed to hold below the resistance at 143.06 for now, but the corrective phase may be coming to an end if this level is overcome. In case the bears have decided to come back, they would try to test the support at 140.64.
GBP/USD
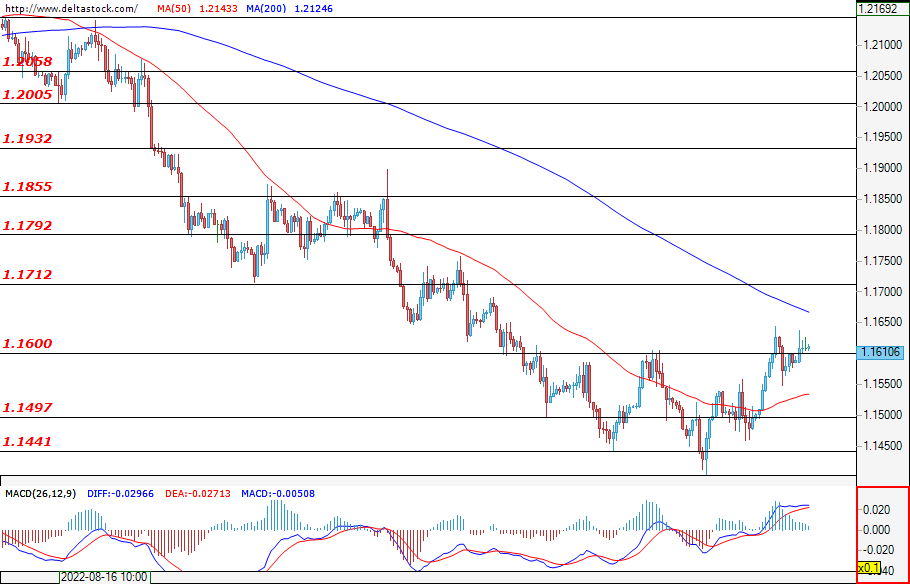
The beginning of the week started calmly for the currency pair and it managed to hold above the support at 1.1600. We are likely to see a range move and a retracement towards the resistance at 1.1497. A signal that the bulls may return for a longer period in the market would be a breach of the resistance at 1.1711. During the week, there will be important economic data for the pound, which could impact the exchange rate. The most important event is the decision of the Bank of England on the main interest rate on Wednesday at 15:00 EEST.
EUGERMANY40
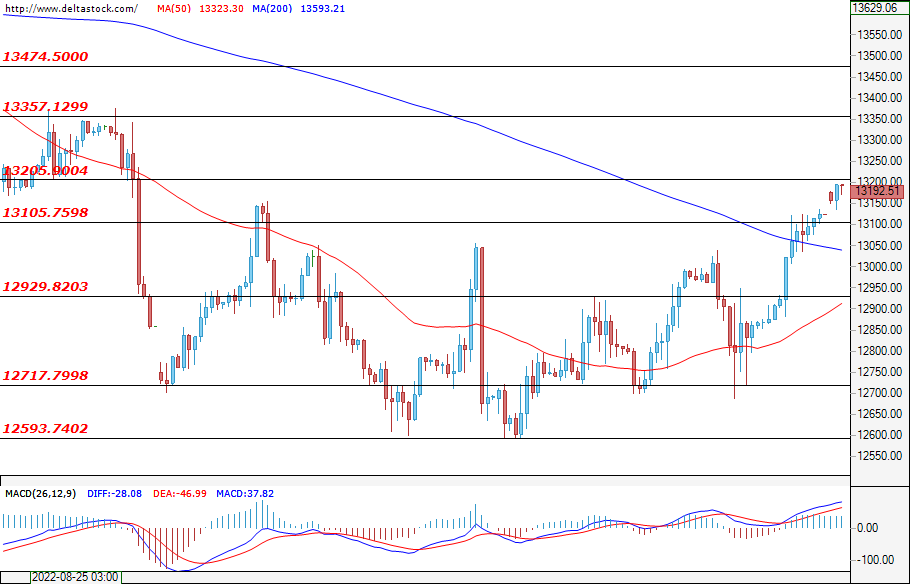
In the past week, the German index managed to overcome the resistance at 13105 and close above it. The positive sentiment is likely not over yet, but if the bears manage to break through the support at 12929, then we may see a deeper correction towards the 12717 level. However, if the resistance at 13205 is breached, there will likely be a more sustained comeback for the bulls, with their next target being the level at 13357.
US30
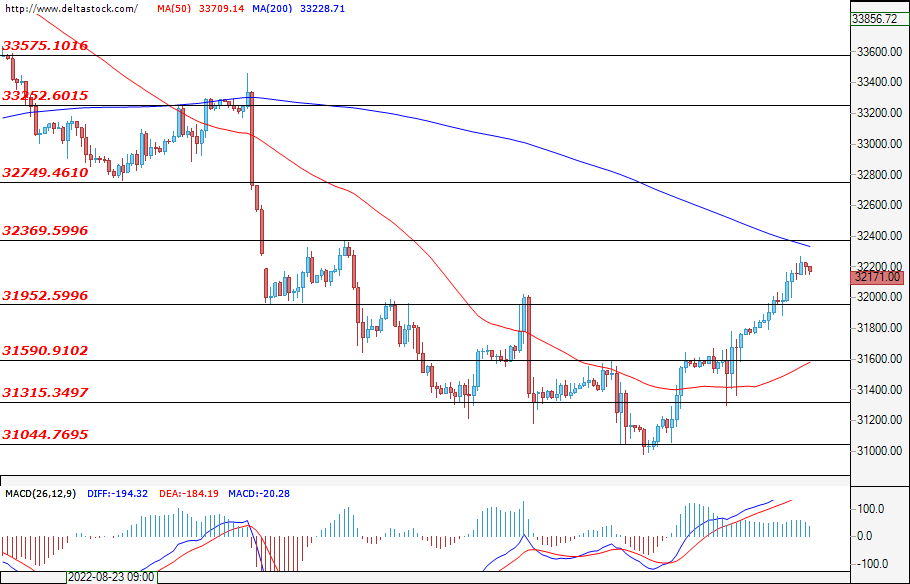
The past week was successful for the U.S. blue-chip index and it managed to overcome the important resistance at 31952. At the beginning of the new week, the bulls will probably have a new target – overcoming the level at 32369. However, we should not exclude the possibility of a correction and the chance that the bears could return to the market. This, however, could only happen if the support levels at 31590 and at 31315 are both breached.
EUR/JPY Daily Outlook
Daily Pivots: (S1) 142.38; (P) 143.55; (R1) 144.47; More....
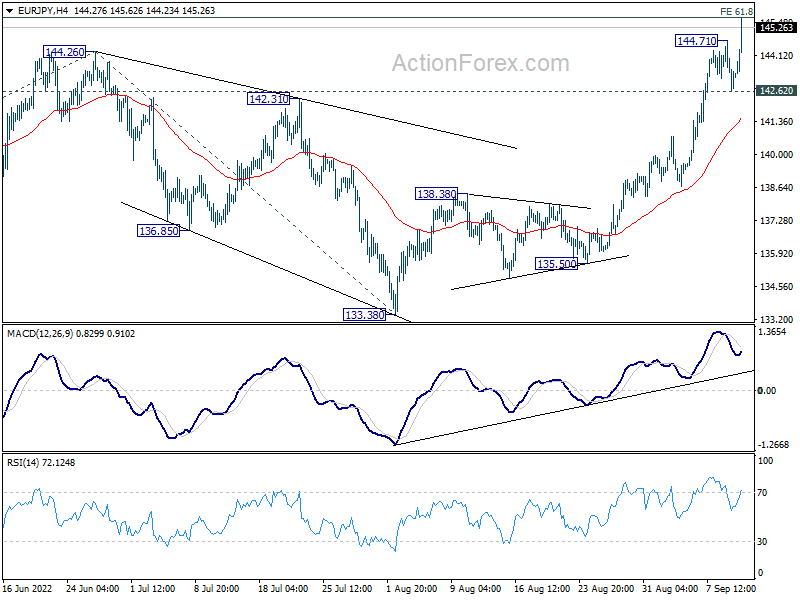
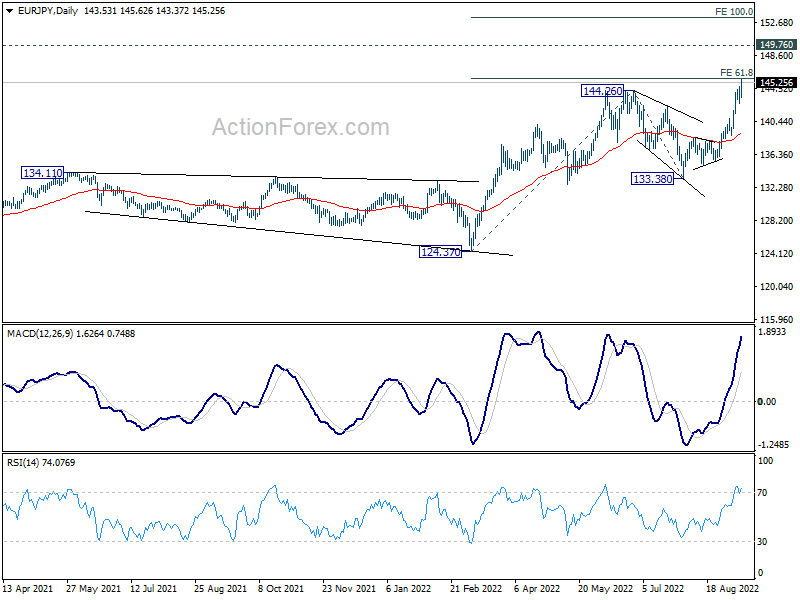
EUR/JPY's rally resumed after brief retreat and intraday bias is back on the upside. Decisive break of 61.8% projection of 124.37 to 144.26 from 133.38 at 145.67 will pave the way to 149.76 long term resistance, and then 100% projection at 153.27. On the downside, below 142.62 minor support will turn intraday bias neutral and bring consolidations, before staging another rally.
In the bigger picture, up trend from 114.42 (2020 low) is seen as the third leg of the pattern from 109.30 (2016 low). Next target is 149.76 (2015 high). For now, outlook will remain bullish as long as 133.38 support holds, even in case of deep pull back.
GBP/JPY Daily Outlook
Daily Pivots: (S1) 164.70; (P) 165.35; (R1) 166.51; More...
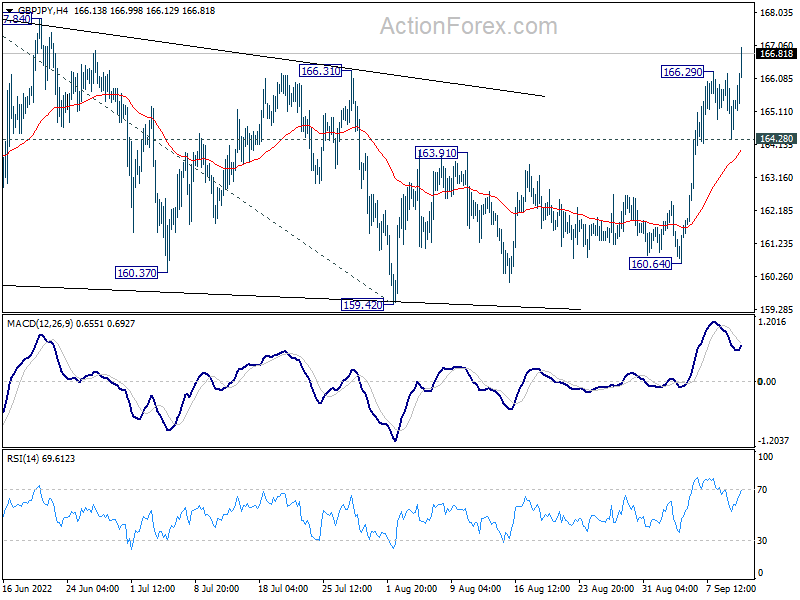
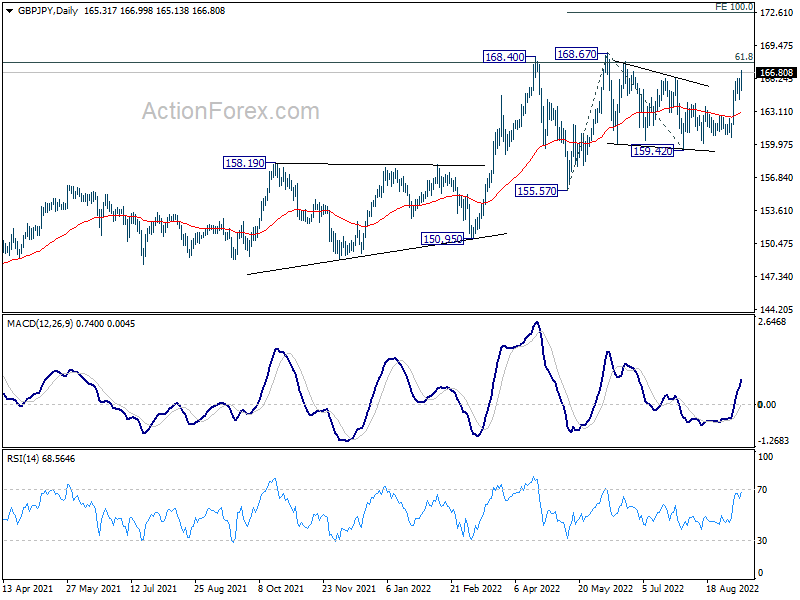
GBP/JPY's rally resumed after brief consolidations and intraday bias is back on the upside. The break of 166.31 resistance suggests that larger up trend is ready to resume. Further rise should be seen to retest 168.67 high first. Decisive break there will confirm and target 100% projection of 155.57 to 168.67 from 159.42 at 172.42. On the downside, below 164.28 minor support will mix up the outlook and turn bias neutral first.
In the bigger picture, up trend from 123.94 (2020 low) is still in progress. Sustained break of 61.8% retracement of 195.86 (2015 high) to 122.75 (2016 low) at 167.93 will be a long term bullish signal, and could pave the way back to 195.86 high. This will remain the favored case as long as 155.57 support holds, even in case of deep pull back.
EUR/GBP Daily Outlook
Daily Pivots: (S1) 0.8651; (P) 0.8679; (R1) 0.8698; More...
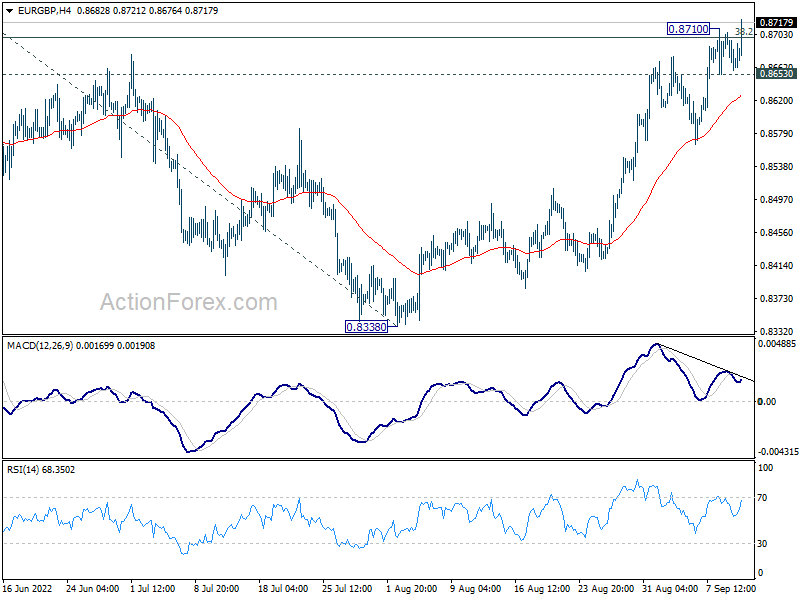
EUR/GBP's rally resumes after brief consolidations. the break of 0.8720 resistance also indicates resumption of whole rise from 0.8201. Intraday bias is back on the upside. Next target is 100% projection of 0.8201 to 0.8720 from 0.8338 at 0.8857. On the downside, break of 0.8653 minor support will mix up the outlook and turn intraday bias neutral first.
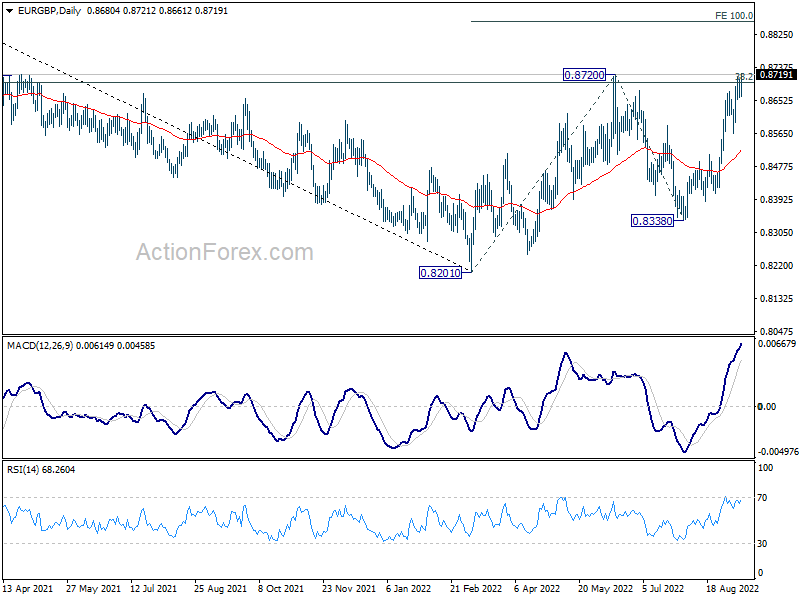
In the bigger picture, focus is back on 38.2% retracement of 0.9499 to 0.8201 at 0.8697. Sustained break there will argue that rise from 0.8201 is a medium term up trend, rather than a correction. Next target is 61.8% retracement at 0.9003. Rejection by 0.8697 again will maintain medium term bearishness, for extending the down trend from 0.9499 (2020 high) at a later stage.
EUR/AUD Daily Outlook
Daily Pivots: (S1) 1.4622; (P) 1.4720; (R1) 1.4773; More...
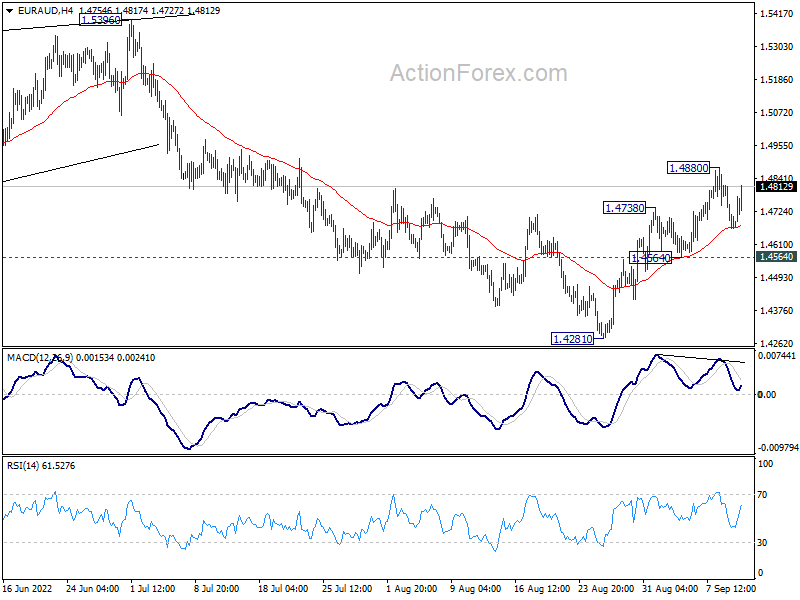
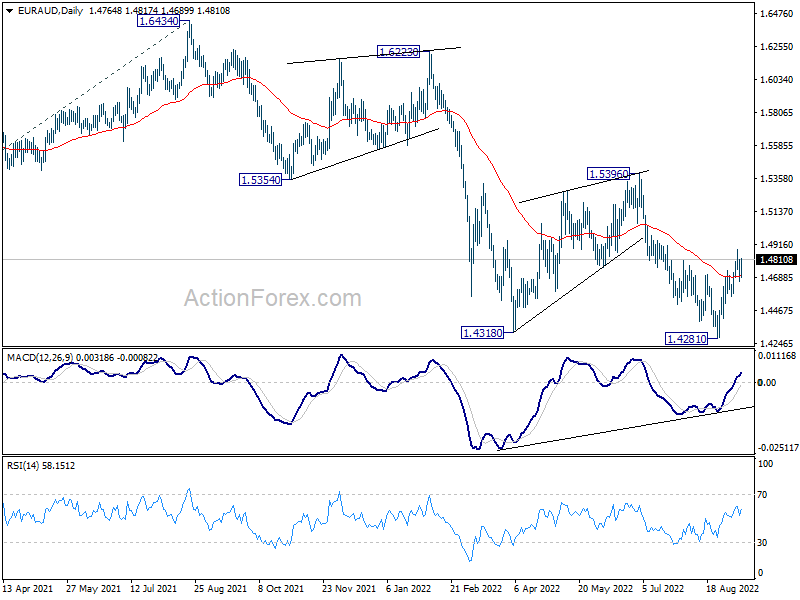
Intraday bias in EUR/AUD remains neutral for the moment. On the upside, above 1.4880 will resume the rebound from 1.4281 short term bottom, and target 1.5396 resistance. On the downside, however, break of 1.4564 minor support will turn bias back to the downside for retesting 1.4281 low.
In the bigger picture, down trend from 1.9799 is still in progress. Break of 1.4318 low will target 61.8% projection of 1.9799 to 1.5250 from 1.6434 at 1.3623, which is close to 1.3624 long term support (2017 low). This will remain the favored case now as long as 1.5396 resistance holds.
EUR/CHF Daily Outlook
Daily Pivots: (S1) 0.9613; (P) 0.9671; (R1) 0.9708; More....
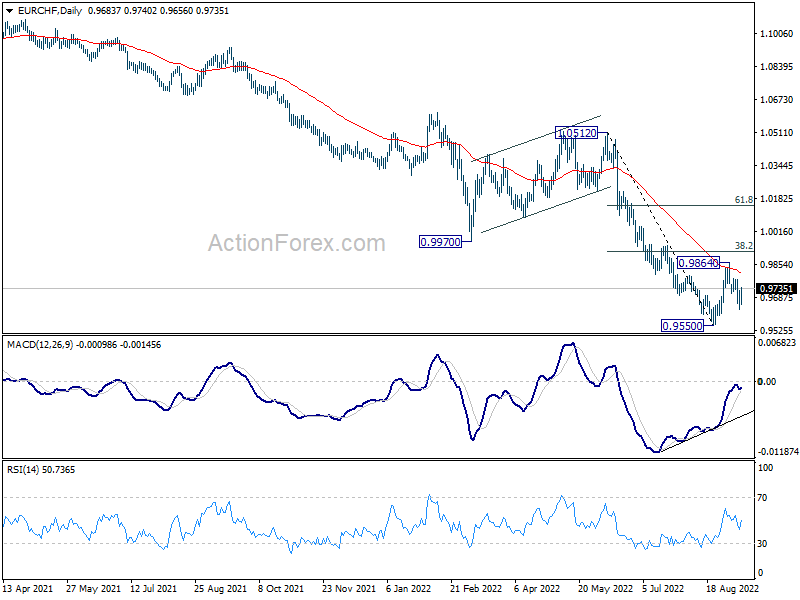
Intraday bias in EUR/CHF is turned neutral first with current recovery. Break of 0.9780 minor resistance will argue that corrective rebound from 0.9550 is resuming. Intraday bias will be back to the upside for 38.2% retracement of 1.0512 to 0.9550 at 0.9917. On the downside, below 0.9631 will bring retest of 0.9550 low. Firm break there will resume larger down trend.
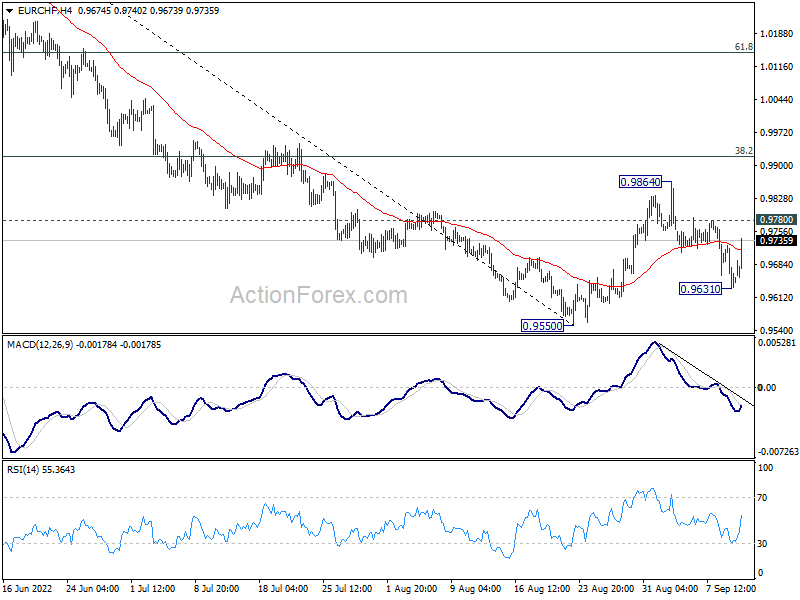
In the bigger picture, long term down trend from 1.2004 (2018 high) is still in progress. Next target is 138.2% projection of 1.2004 to 1.0505 to 1.1149 at 0.9033. On the upside, break of 0.9970 support turned resistance is needed to be the first sign of medium term bottoming. Otherwise, outlook will stay bearish in case of strong rebound.