

Sample Category Title
Hope of Soft US Inflation Fuels Equities
Japanese and Australian equities made a positive start to the week, after a bullish session on Friday. The US equities ended last week on quite a high note, after investors pulled more than $10 billion dollars from the US stock funds at the start of the month on hawkish Fed expectations.
The S&P500 jumped more than 1.50% to above its 50 and 100-day moving averages, and closed the week above the major 38.2% retracement on August to September pullback, which stands above the 4050 level, hinting that the index stepped into the bullish consolidation zone and that we could see further gains. Nasdaq, on the other hand, rallied more than 2% to its own 50-DMA, and came very close to the 38.2% retracement.
I believe that the latest market optimism could be explained by hope to see a second month of softening inflation in the US at this week’s CPI release. Due Tuesday, the US will reveal its latest CPI figure which is expected to have eased to 8.1% in August, from 8.5% printed a month earlier, and from the 9.1% peak printed the month before that. If the data is soft enough, or ideally softer than expected, the equities will likely continue pushing higher this week as well. If, however, the data is not as soft as expected, or worse, if we see a higher figure than last month’s read, then last week’s gains in equities will likely be quickly given back.
There are signs that inflation in the US may have further eased last month. We saw softer Chinese producer prices which generally explains a part of US inflation, softer rents, softer used car prices and softer gasoline! Therefore, those who are optimistic about the number to come, have reason to be optimistic about. Fingers crossed.
Fed expectations
What you have to remember this week, is that, a lot of Fed officials spoke last week. They all repeated that the Fed will continue hiking the rates until inflation is under control, and that pushed the probability of seeing a 75bp rate hike from the Fed at the September meeting to 90%. So there is not much left to be priced there. And whatever happens this week, we know that the Fed is willing to deliver another 75bp this month. So no one is playing on this month anymore. What matters is, what will happen after the FOMC’s September meeting. If the Fed hiked the interest rate by 75bp this month, the probability that it hikes by 50bp at next meeting is around 77% today. But that almost fully depends on inflation. So all eyes on tomorrow’s inflation.
The softer dollar
We saw a decent pullback in the US dollar index last Friday, following the 75bp hike from the ECB, and hint that they will be tightening fast in the coming months to tame inflation and stop the bleeding in euro, which is also partly responsible for soaring inflation in Europe. And remember, Japan is also feeling pressured by an abnormally strong US dollar. The dollar yen tested the scary 145 level last week, and Japanese are willing to intervene to stop the dollar from rallying more.
The EURUSD kicks off the week above parity but sees some important resistance near the 50-DMA, which stands a touch above the 1.0100 level. The 50-DMA is an important tech resistance, as it has been working well since last June. So clearing that level to the upside would be a big step for a medium-term euro recovery against the dollar.
In commodities, gold benefits from a broad-based pullback in US dollar, but gains remained capped near the $1730 last week. The 50-DMA, which stands a touch above the $1740 is also an important resistance to be cleared for the gold bulls. Otherwise, the recoveries are still seen as interesting opportunities to sell the top for those who continue swimming with the flow, which is a very clear downtrend building since March. Of course, the strong dollar is the major downside pressure on gold prices. And the end of the dollar rally could reverse losses in the yellow metal. But the dollar rally has been real sticky since more than a year, and even if we see a peak in each positive attempt, dollar finds more energy to make it higher.
Finally, crude oil is softish this morning. The barrel of American crude trades near the $85 per barrel as high energy prices hit the prospects of economic growth, and global demand. The fact that China maintains its zero covid fight, doesn’t help improve the bullish mood in oil. An overall bullish sentiment in equity markets could help oil consolidate gains, but strong resistance is seen near the $90 mark.
Energy Crisis, Ukraine and Sweden Election in Focus this Morning
Market movers today
There are no tier-1 global movers today but focus remains on developments in gas and electricity prices alongside developments in Ukraine (see more below).
Danish august CPI inflation is released. We expect the number to increase to 9.1% from 8.7% in July. The increase is driven by a continued pressure on core inflation and food prices in particular. Pushing higher is also the new quarterly rent registration, which will likely show an increased pressure for rent hikes. Lower electricity fees introduced over the summer reduces the consumer price by 4%, which pulls in the other direction. So does a 9% decline in fuel prices. It will be interesting to see if the very modest clothing sale over the summer was an indication of higher prices, or whether it corrects in August.
All eyes this week will be on US inflation on Tuesday, which is one of the last important data releases before the Fed will decide on a 75bp or 50bp hike at their meeting next week. Our call remains for a 75bp hike. US retail sales and the German ZEW index will also give further clues to the outlook for recession in the US and the euro area, respectively.
The 60 second overview
European energy crisis. On Friday EU energy ministers held an emergency meeting to discuss the evolving energy crisis in Europe. Five initiatives were discussed and the topics of power savings and marginal pricing in the energy market took centre stage.
Four of the five initiatives were endorsed by EU ministers including 1) electricity savings in peak hours, 2) a cap on excess revenues from cheap energy producers, 3) a "solidarity mechanism" to capture excess revenues from fossil fuel companies and finally 4) a liquidity state aid programme to aid utilities businesses. The fifth and final proposal to cap prices on Russian gas imports did not get enough support amid a broader support to extend natural gas price caps too all imports irrespective of geographical origin. However, some countries still oppose to price caps arguing it would only incentivise consumption possibly worsening the current inflation problem. Also price caps on all natural gas imports could deter LNG exporters from exporting to Europe. Legal text now has to be finalised this week.
War in Ukraine. Over the weekend, Ukraine launched a successful counter-offensive against Russia in the Kharkiv region. The north-eastern offensive followed a tactical disinformation campaign started by the Ukrainian army two weeks ago that they were launching an offensive in Kherson region, in the country's south. As it appears, the southern offensive was a trick and just as Russia was moving its troops to the south, Ukraine managed to catch the Russians off guard in northwest where Russian troops subsequently panicked and fled.
In less than five days, Ukraine has managed to retake more territory than the Russian army could occupy in four months. We think it is too early to call whether the conflict has reached a turning point. We still consider a frozen conflict as the main scenario in short term (3-12 months) but see three alternative scenarios: 1) With continued support from its Western allies Ukraine succeeds in pushing the Russian troops back behind the pre-war frontline in Donbass without any territorial concessions. 2) The two sides strike a peace deal entailing territorial concessions for Ukraine. 3) Russia steps up its use of brutal force as it strives not to lose face, marking an escalation. The scenarios could overlap and other in-between scenarios could also play out. We will discuss these nuances more in an upcoming briefer on the War in Ukraine.
UK. On Friday, the Bank of England announced that the upcoming Thursday monetary policy meeting is postponed by a week due to a period of national mourning following the death of Queen Elizabeth II. The Committee's decision will now be announced at 13pm CET on 22 September. This also means that sales of APF corporate bonds now will start one week later than previously announced, with the first operation to be held on Tuesday 27 September 2022.
Sweden election. Preliminary result of the Swedish general election 2022: The right-wing parties has a lead of 1 mandate (175) vs red-green (174) preliminary. The big winners are Sweden Democrats (yellow) and Social Democrats (light red). The bid losers are the Centre Party (dark green) and to some extent the Left (dark red). The Greens (light green) and the Liberals (light blue) stayed above the 4% threshold. The blue-yellow constellation will now probably start a negotiation process with the blue parties forming a government with the yellow giving support but being outside the government (despite is now the second biggest party). Sweden Democrats will however have a big impact on policies, most likely.
Equities: Equities finished last week on a strong footing with all regions and all sectors higher. No surprise to see the cyclical growth universe outperforming as risk sentiment recovering. VIX index lower for the third day in a row, finishing just south of 23. In US on Friday, Dow +1.2%, S&P 500 +1.5%, Nasdaq +2.1% and Russell 2000 +2.0%. The positive tone continuing in Asia this morning while European futures also indicate a green opening. US futures unchanged this morning.
FI: Last week was another dramatic week in the global financial markets with the ECB meeting as the highlight of the week. One of the big moves was in the Schatz ASW-spread that tightened some 25bp. The move was driven partly by the announcement from ECB that governments will get either the depo rate (at 75bp) or €str which are both well above 0%.
FX: Last week ended with value currencies in Europe such as NOK, SEK and EUR performing well while the USD was the big underperformer. EUR/USD is trading back close to 1.01, EUR/NOK has come down below 10.00 while EUR/SEK has broken through the long-tested 10.70 support level. USD/JPY has come off historical highs trading close to 143.
Credit: Credit markets ended the week on a slightly positive note as market participants continued to digest the 0.75% ECB rate hike. Overall on market level iTraxx Main was 5bp tighter while Xover was 24bp tighter.
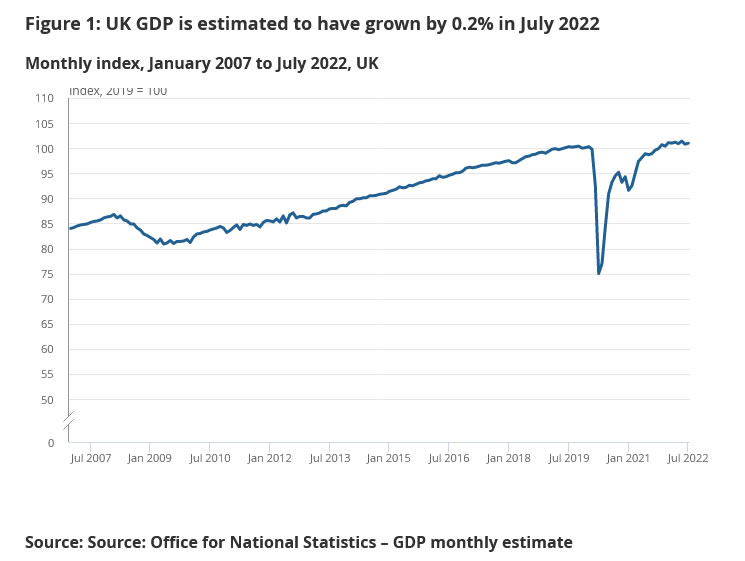
UK GDP grew 0.2% mom in July, services up but production and construction down
UK GDP grew 0.2% mom in July, below expectation of 0.3% mom. Services grew 0.4% mom. Production dropped -0.3% mom. Construction also contracted -0.8% mom. For the three months to July, GDP was flat compared with the previous three months.
Also released, industrial production came in at -0.3% mom, 1.1% yoy, versus expectation of 0.4% mom, 2.0% yoy. Manufacturing production was at 0.1% mom, 1.1% yoy, versus expectation of 0.6% yoy. Goods trade deficit narrowed from GBP -22.8B to GBP -19.4B, versus expectation of GBP -23.2B.
USD/JPY Daily Outlook
Daily Pivots: (S1) 141.34; (P) 142.73; (R1) 143.96; More...
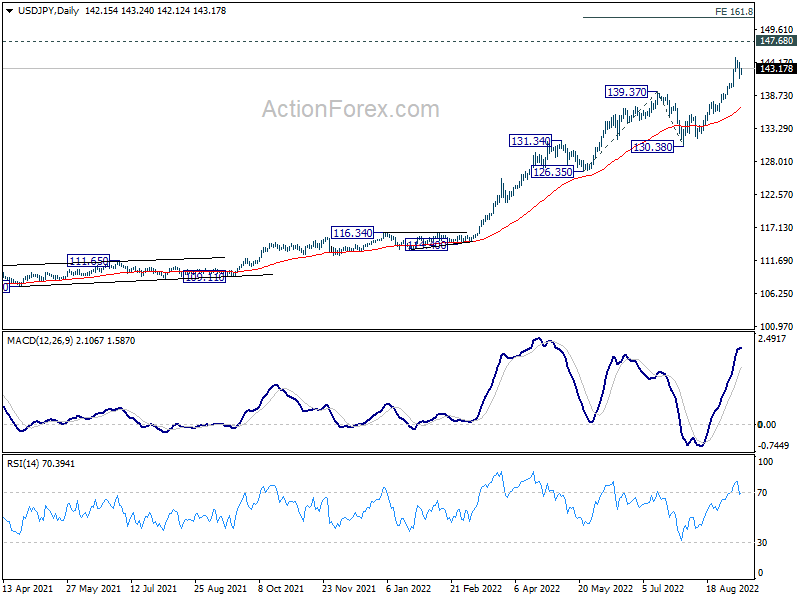
USD/JPY recovers mildly today but stays in range below 144.98. Intraday bias remains neutral and more consolidations could be seen. Downside of retreat should be contained by 139.37 resistance turned support. On the upside, break of 144.98 will resume larger up trend to 147.68 long term resistance. Break there will target 161.8% projection of 126.35 to 139.37 from 130.38 at 151.44 next.
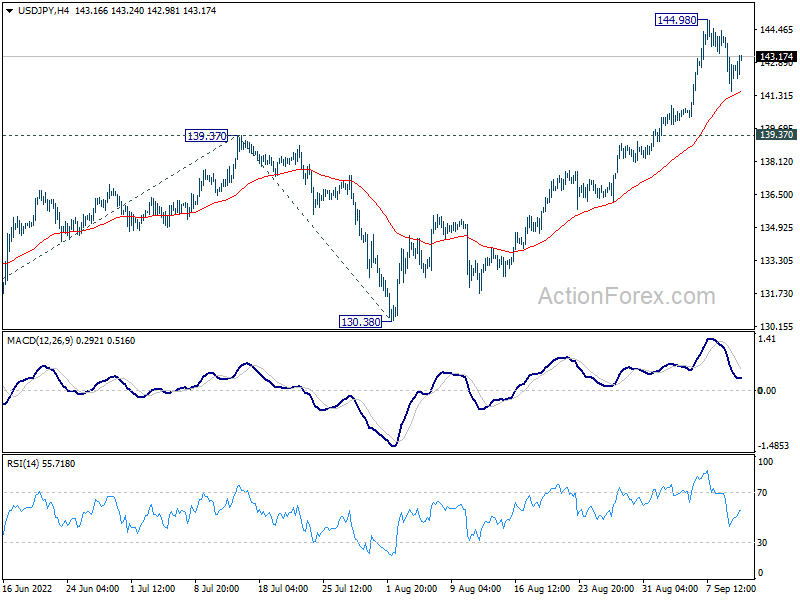
In the bigger picture, up trend from 101.18 is still in progress, as part of the whole up trend from 75.56 (2011 low). Further rise should be seen to 147.68 (1998 high). For now, break of 130.38 support is needed to be the first indication of medium term topping. Otherwise, outlook will stay bullish even in case of deep pull back.
Yen Softens Again in Quiet Market, US CPI and UK Data in Focus This Week
Markets are generally steady in Asian session today. European majors are firming up slightly but there is no clear follow through buying so far. On the other hand, Yen is losing ground while commodity currencies are also soft. Dollar is mixed in the middle. Focuses are back to economic data this week, with particular attention on inflation data from the US, as well as a wave of data from the UK.
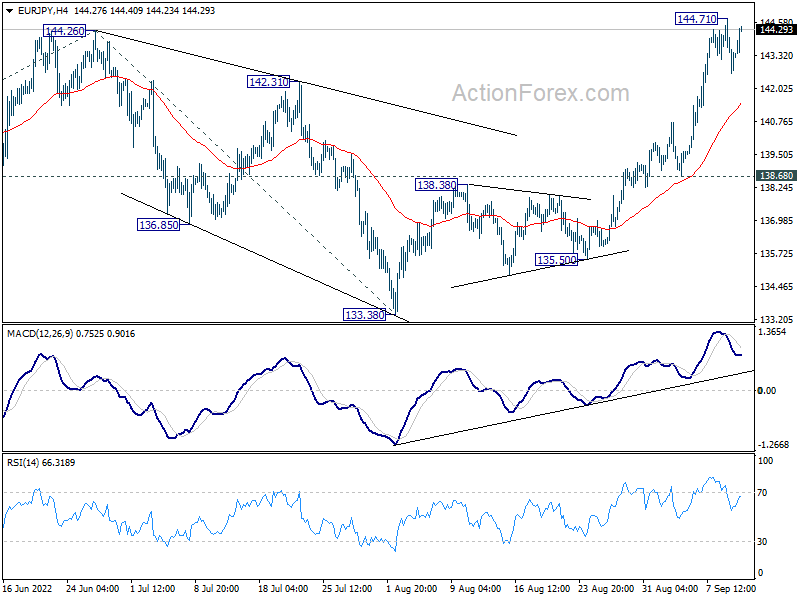
Technically, Yen might be ready to resume recent down trend. Break of 144.71 resistance in EUR/JPY will confirm resumption of recent rally. That could lead other Yen crosses higher. Corresponding break of 144.98 temporary top in USD/JPY would confirm the overall underlying momentum.
In Asia, at the time of writing, Nikkei is up 1.02%. Japan 10-year JGB yield is down -0.0002 at 0.251. Singapore Strait Times is up 0.33%. China and Hong Kong are on holiday.
Bundesbank Nagel: Further clear steps must follow if inflation stays the same
Bundesbank President Joachim Nagel said in a radio interview on Sunday that last week's 75bps hike was a "clear sign and if the inflation picture stays the same, further clear steps must follow."
He added that inflation may peak at more than 10% in December. "In the course of 2023, the inflation picture is likely to weaken somewhat," he said. Still, the rate "is likely to be at a far-too-high level of over 6%."
While there "currently are some indications that the economy could stagnate or even contract in the second half of 2022 and that this trend could continue into next year, any recession may be shallow," Nagel added.
"In the end, stable prices are much more important for medium-term, long-term growth, for a good outlook for the euro area," he said. "We may need to overcome a dry spell, but for now at least it looks like this dry spell and the decline in economic output will not be severe."
ECB Elderson: Very important that inflation expectations not become unanchored
ECB Executive Board member Frank Elderson told Dutch television, "it's very important that the expectations that the people have on how the inflation will develop in the medium to long term will not become unanchored."
"It is vital that people and companies or actors in the economy in general maintain their trust that we as the ECB will reach our of target of 2 per cent inflation," Elderson said.
Economic data from US and UK to rock the markets
Attention is back to economic data this week. CPI from US will be a major focus, along with retail sales. A wave of data from the UK will also be published including GDP, production, CPI, employment and retail sales. These data will provide much food for thoughts for Fed and BoE before their meeting next week, and could rock the markets.
Other data to be watched include Germany ZEW economic sentiment; Australia employment and business confidence, as well as China industrial production, retail sales and fixed asset investment.
Here are some highlights for the week:
- Monday: UK GDP, production, trade balance.
- Tuesday: Japan BSI manufacturing, PPI; Australia NAB business confidence; Germany CPI final, ZEW economic sentiment; UK employment; Swiss PPI; US CPI.
- Wednesday: New Zealand current account; Japan machine orders; UK CPI, PPI; Eurozone industrial production; Canada manufacturing sales; US PPI.
- Thursday: New Zealand GDP; Japan trade balance, tertiary industry index; Australia employment; Eurozone trade balance; US retail sales, Empire state manufacturing, Philly Fed manufacturing, jobless claims, import prices, industrial production, business inventories.
- Friday: New Zealand BusinessNZ manufacturing index; China industrial production, retail sales, fixed asset investment; UK retail sales; Italy trade balance; Eurozone CPI final; Canada housing starts, wholesale sales; US U of Michigan consumer sentiment.
USD/JPY Daily Outlook
Daily Pivots: (S1) 141.34; (P) 142.73; (R1) 143.96; More...
USD/JPY recovers mildly today but stays in range below 144.98. Intraday bias remains neutral and more consolidations could be seen. Downside of retreat should be contained by 139.37 resistance turned support. On the upside, break of 144.98 will resume larger up trend to 147.68 long term resistance. Break there will target 161.8% projection of 126.35 to 139.37 from 130.38 at 151.44 next.
In the bigger picture, up trend from 101.18 is still in progress, as part of the whole up trend from 75.56 (2011 low). Further rise should be seen to 147.68 (1998 high). For now, break of 130.38 support is needed to be the first indication of medium term topping. Otherwise, outlook will stay bullish even in case of deep pull back.
Economic Indicators Update
| GMT | Ccy | Events | Actual | Forecast | Previous | Revised |
|---|---|---|---|---|---|---|
| 06:00 | JPY | Machine Tool Orders Y/Y Aug | 5.50% | |||
| 06:00 | GBP | GDP M/M Jul | 0.30% | -0.60% | ||
| 06:00 | GBP | Industrial Production M/M Jul | 0.40% | -0.90% | ||
| 06:00 | GBP | Industrial Production Y/Y Jul | 2.00% | 2.40% | ||
| 06:00 | GBP | Manufacturing Production M/M Jul | 0.60% | -1.60% | ||
| 06:00 | GBP | Manufacturing Production Y/Y Jul | 1.70% | 1.30% | ||
| 06:00 | GBP | Index of Services 3M/3M Jul | -0.80% | -0.40% | ||
| 06:00 | GBP | Goods Trade Balance (GBP) Jul | -23.2B | -22.8B | ||
| 08:00 | EUR | Italy Industrial Output M/M Jul | 0.00% | -2.10% | ||
| 13:00 | GBP | NIESR GDP Estimate Aug | 0.00% |
Technical Outlook and Review
USD/JPY:
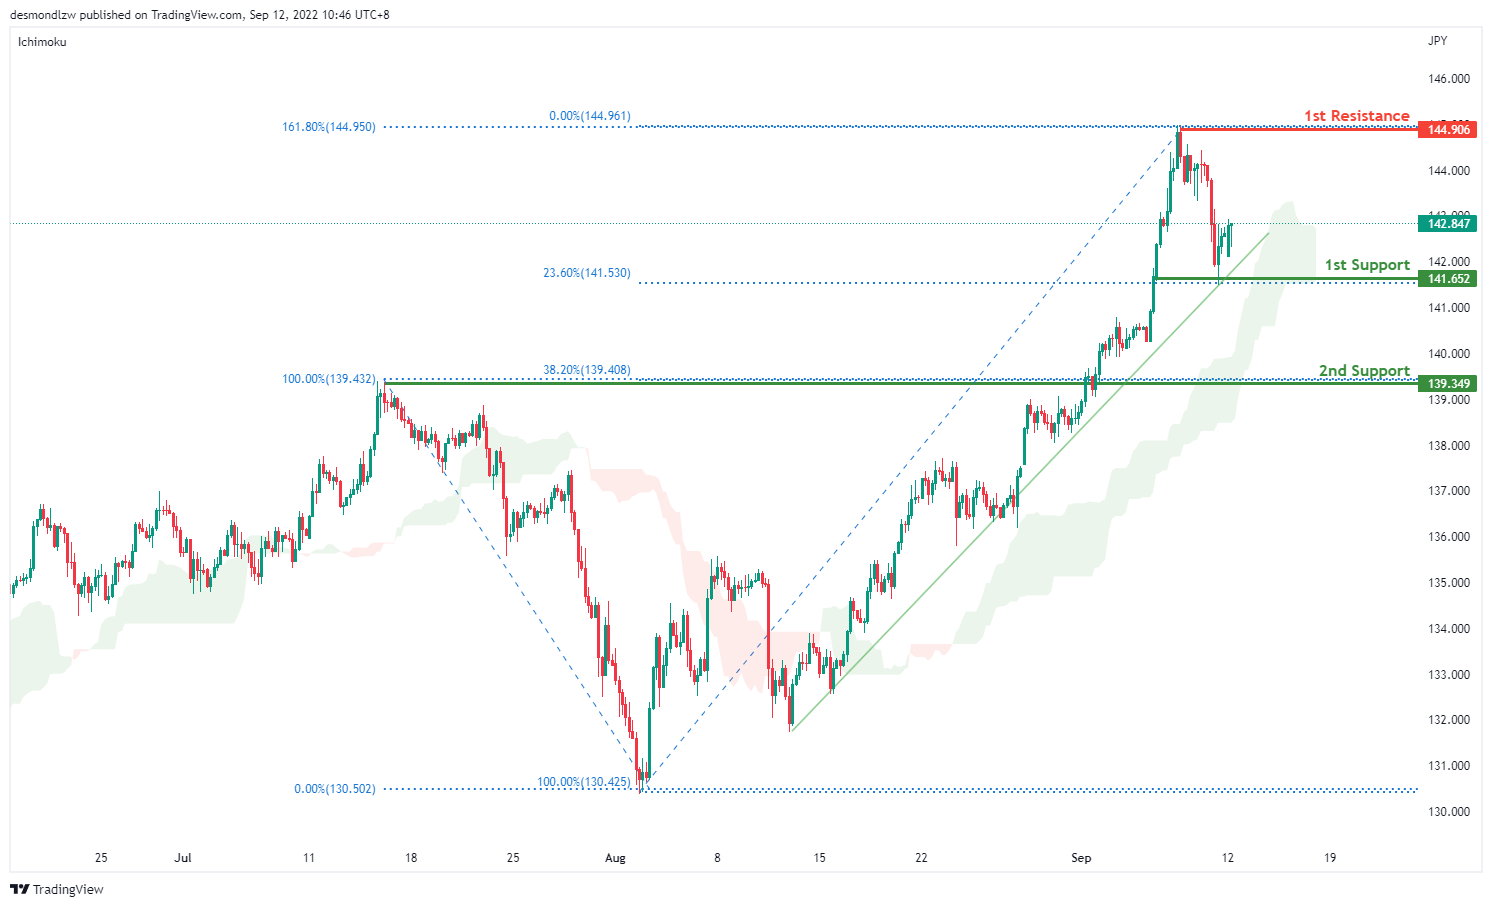
On the H4 chart, price is still respecting the ascending channel. We are bullish bias- Price is currently testing the first support at 141.652 where the 23.6% retracement sits. Bearish momentum might bring price to the second support at 139.349 where the 38.2% retracement and overlapping support sits. Alternatively, price might continue with the bullish momentum to bring price to first resistance at 144.906 first where the 161.8% extension sits.
Areas of consideration:
- H4 time frame, 1st resistance at 144.906
- H4 time frame, 1st support at 141.652
DXY:
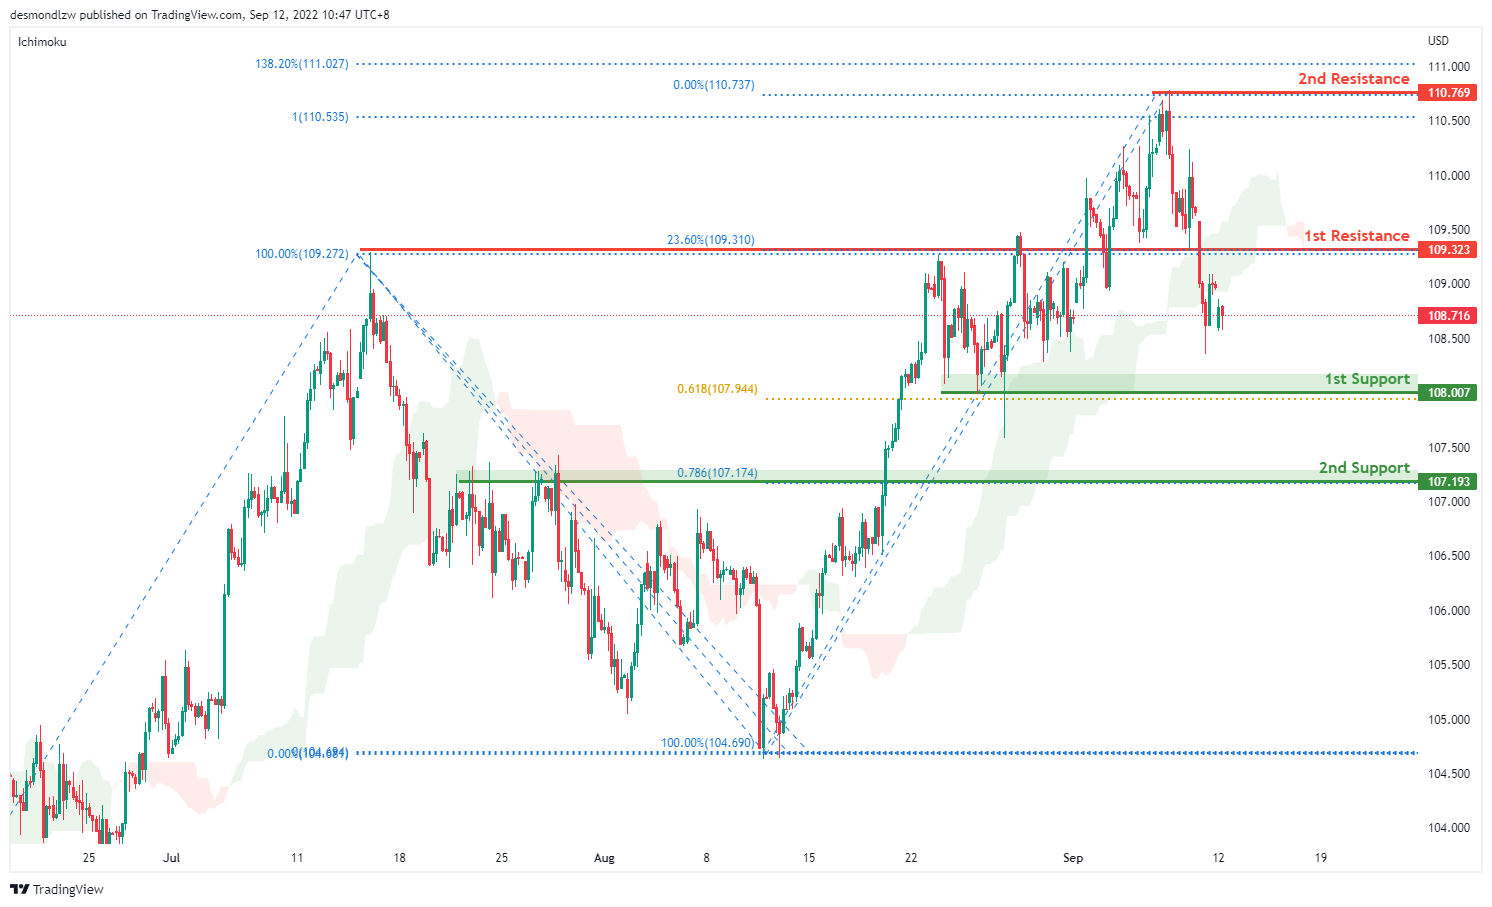
On the H4, prices have broken the ascending trend, we are bearish bias. Price has pulled back and is moving to test the first support at 107.995 where the 61.8% projection and previous swing low sits. If bearish momentum continues, it should bring price to the second support at 107.193 where the 78.6% projection sits. Alternatively, if price reverses from the first support, it should test first resistance at 109.323 where the 23.6% retracement sits and subsequently the second resistance at 110.769 where the previous swing high sits.
Areas of consideration:
- H4 time frame, 1st resistance at 109.323
- H4 time frame, 1st support at 108.007
EUR/USD:
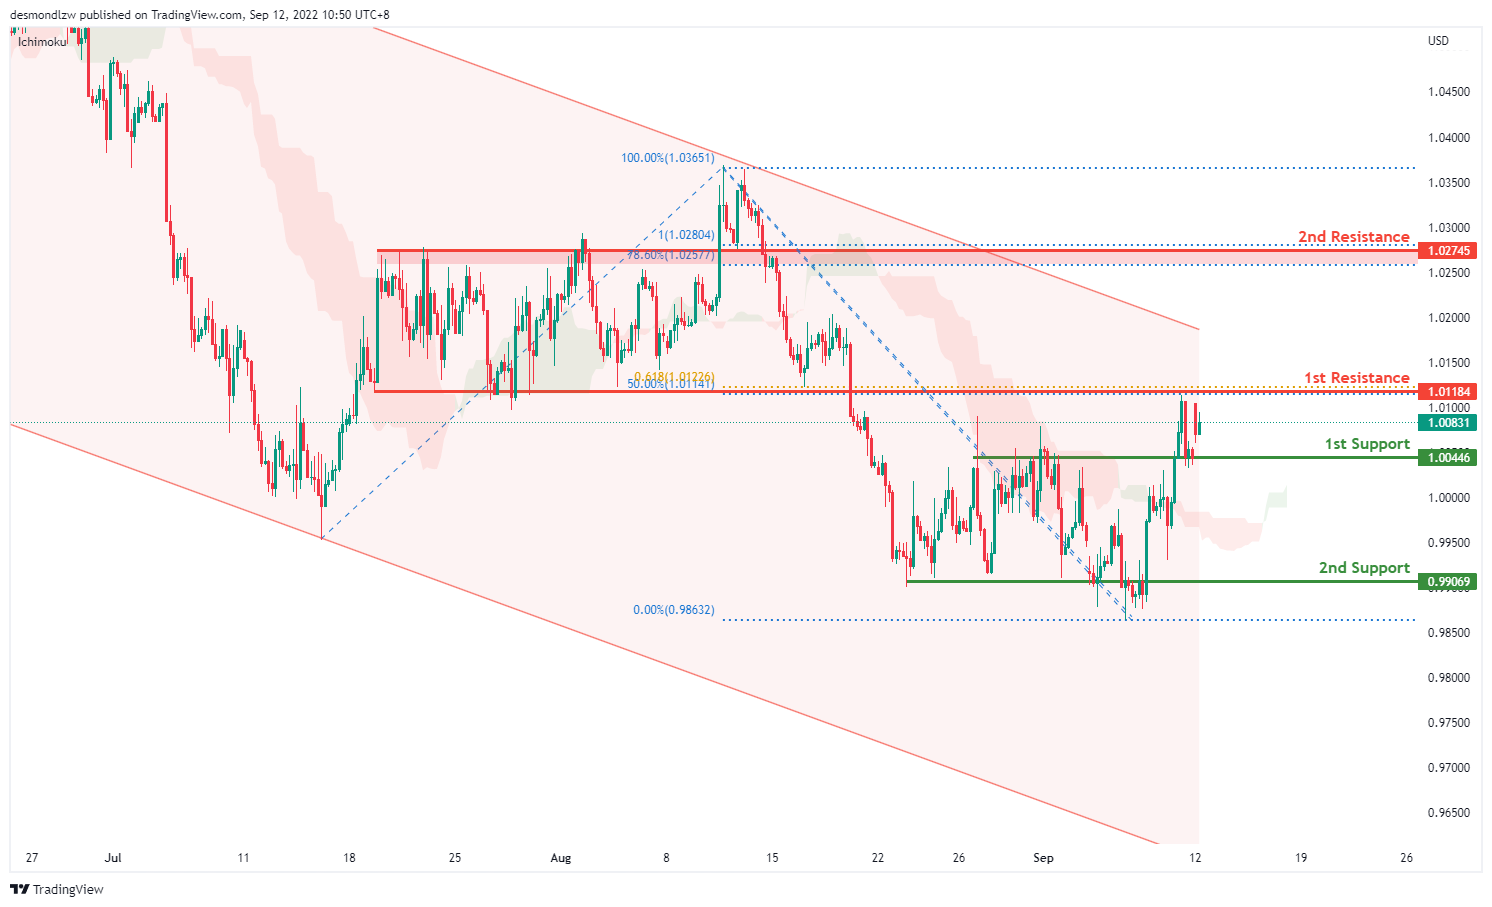
On the H4, price is moving in an ascending manner signalling bullish momentum – we are bullish bias. Price seems like it’s testing the first resistance at 1.0118 where the 50% retracement and 61.8% projection sits. If bullish momentum continues, it should bring price to the second resistance at 1.0274 where the 78.6% retracement and 100% projection sits. Alternatively, if price pulls back, it should test the first support at 1.0044 levels where the overlapping support sits then the second support at 0.9906 where the previous swing low sits.
Areas of consideration :
- H4 1st resistance at 1.0118
- H4 1st support at 0.9906
GBP/USD:
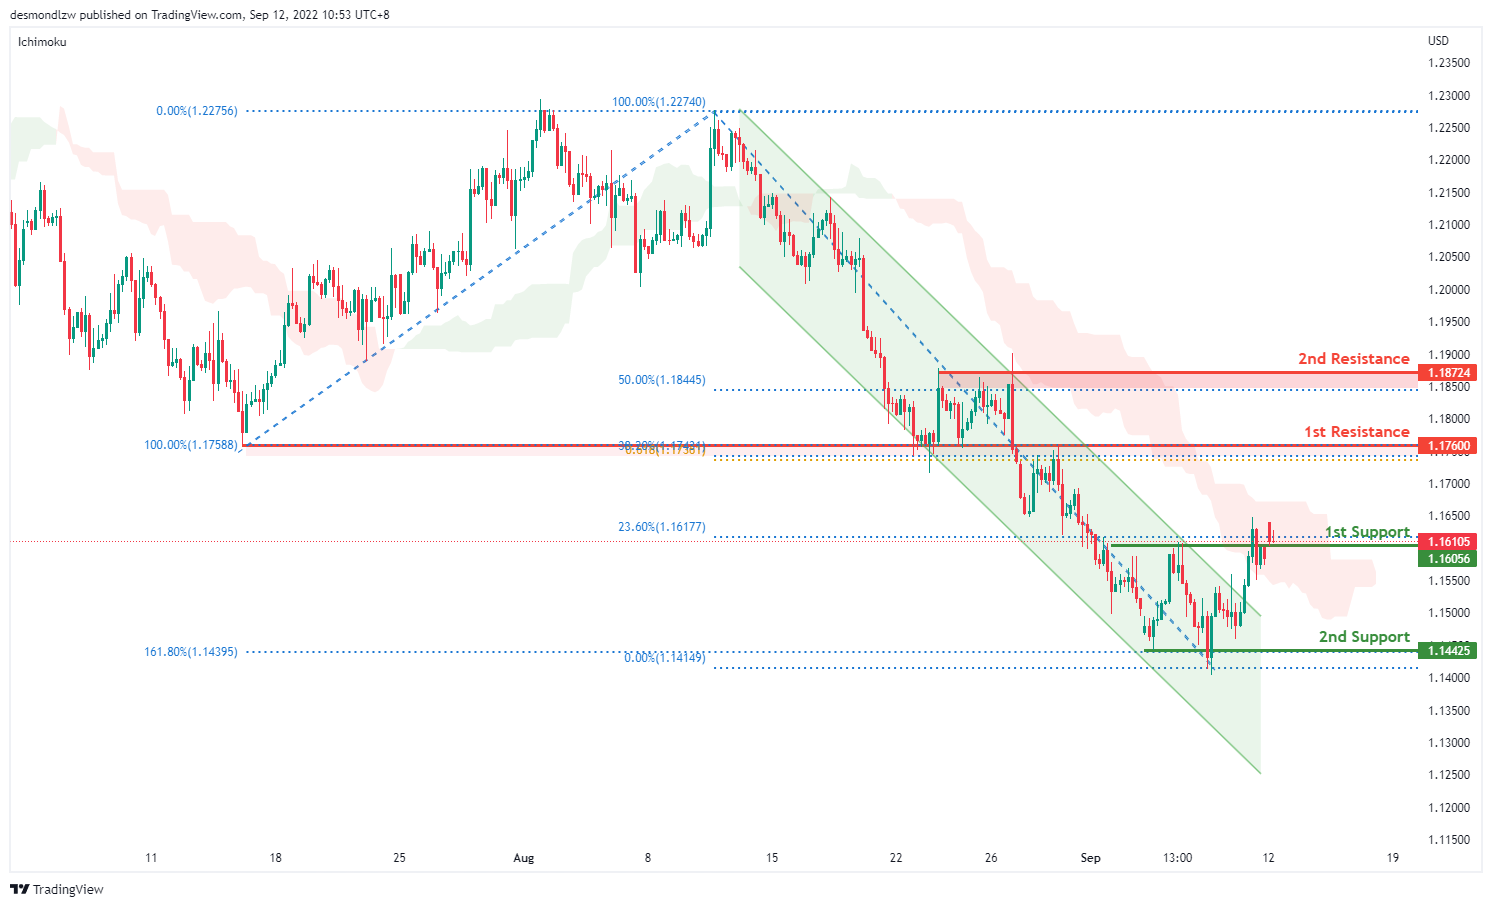
On the H4, prices have broken the descending channel and are moving in a bullish momentum- we are bullish biassed. Prices seem to be moving toward the first resistance at 1.1760 where the 38.2% retracement and 61.8% projection sits. If bullish momentum continues, it should bring prices to the second resistance at 1.1872 levels where the 50% retracement sits. Alternatively, if it fails to break the first resistance, it might look to test the first support at 1.1604 where the 23.6% retracement and overlapping support sits then the second support at 1.1442 where the 161.8% extension sits
Areas of consideration:
- H4 1st resistance at 1.1760
- H4 1st support at 1.1442
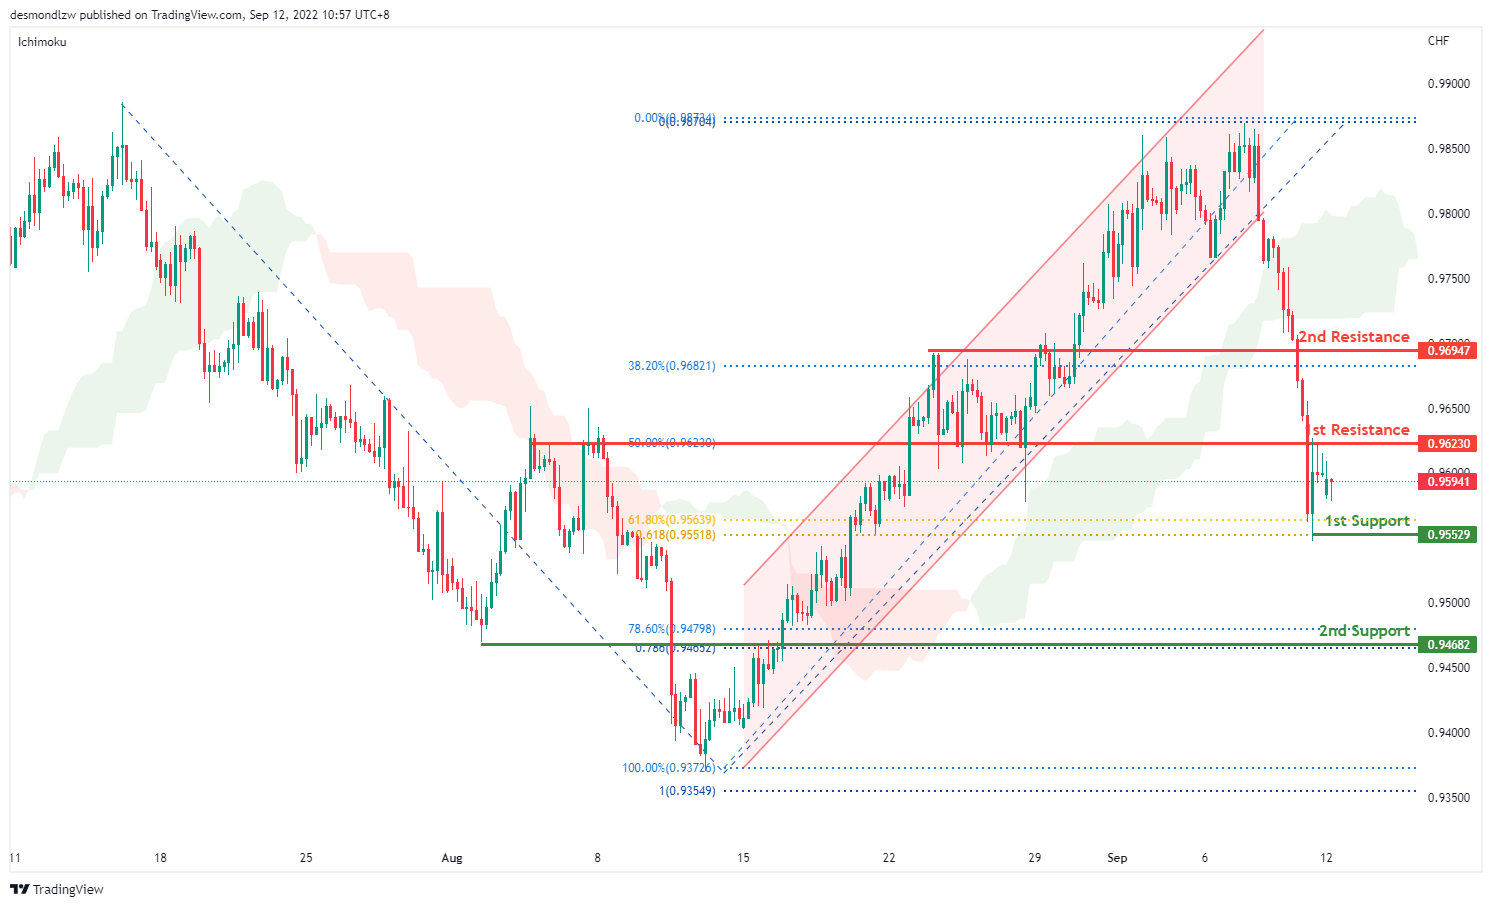
USD/CHF:
On the H4, prices have broken the ascending channel and we are currently bearish bias. Price is moving toward the first support around the 0.9552 levels where the 61.8% retracement and 61.8% projection sits. If bearish momentum continues, it should bring prices to the second support at 0.9468 levels where the 78.6% projection and 78.6% retracement sits. Alternatively, price could pull back to test the first resistance at 0.9623 where the overlapping resistance and 50% retracement sit and then second resistance at 0.9694 where the 38.2% retracement sits
Areas of consideration
- H4 1st support at 0.9552
- H4 1st resistance at 0.9623
XAU/USD (GOLD):
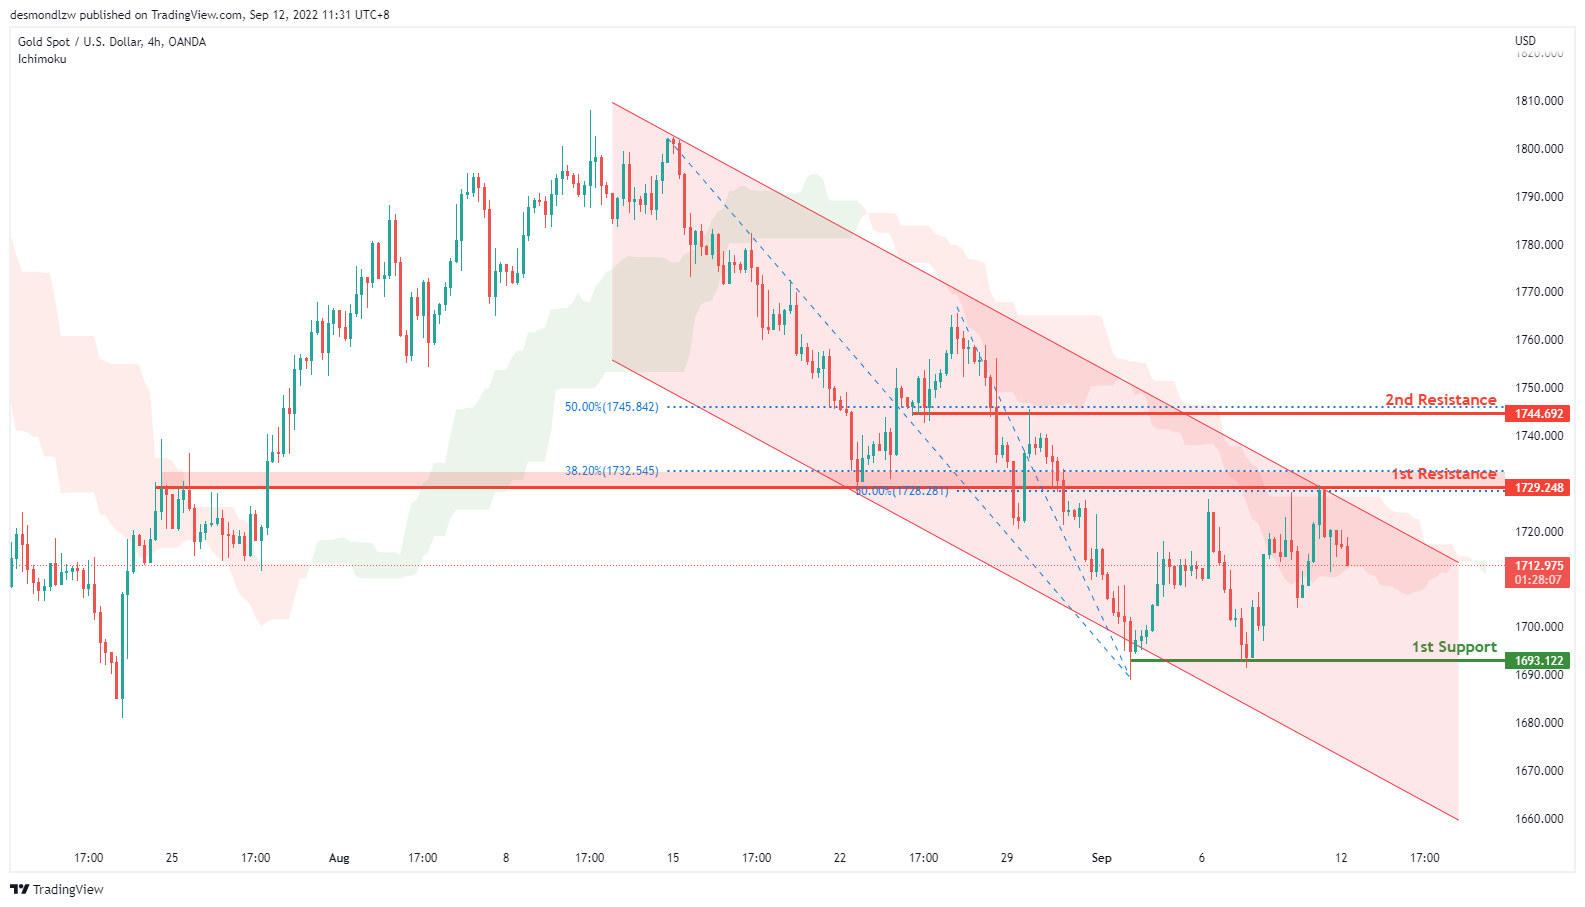
On the H4, with the price moving within the descending channel below ichimoku cloud, and dropping from the 1st resistance, we have a bearish bias that the price may drop to the 1st support at 1693.122, which is in line with the swing lows. Alternatively, the price may retest the 1st resistance at 1729.248, which is in line with the overlap resistance, 50 % and 38% fibonacci retracement. If the price can break the 1st resistance, the 2nd resistance could be at 1744.692, where the 50% fibonacci retracement and overlap resistance are.
Areas of consideration:
- H4 time frame, 1st resistance at 1729.248
- H4 time frame, 1st support at 1693.122
AUD/USD:
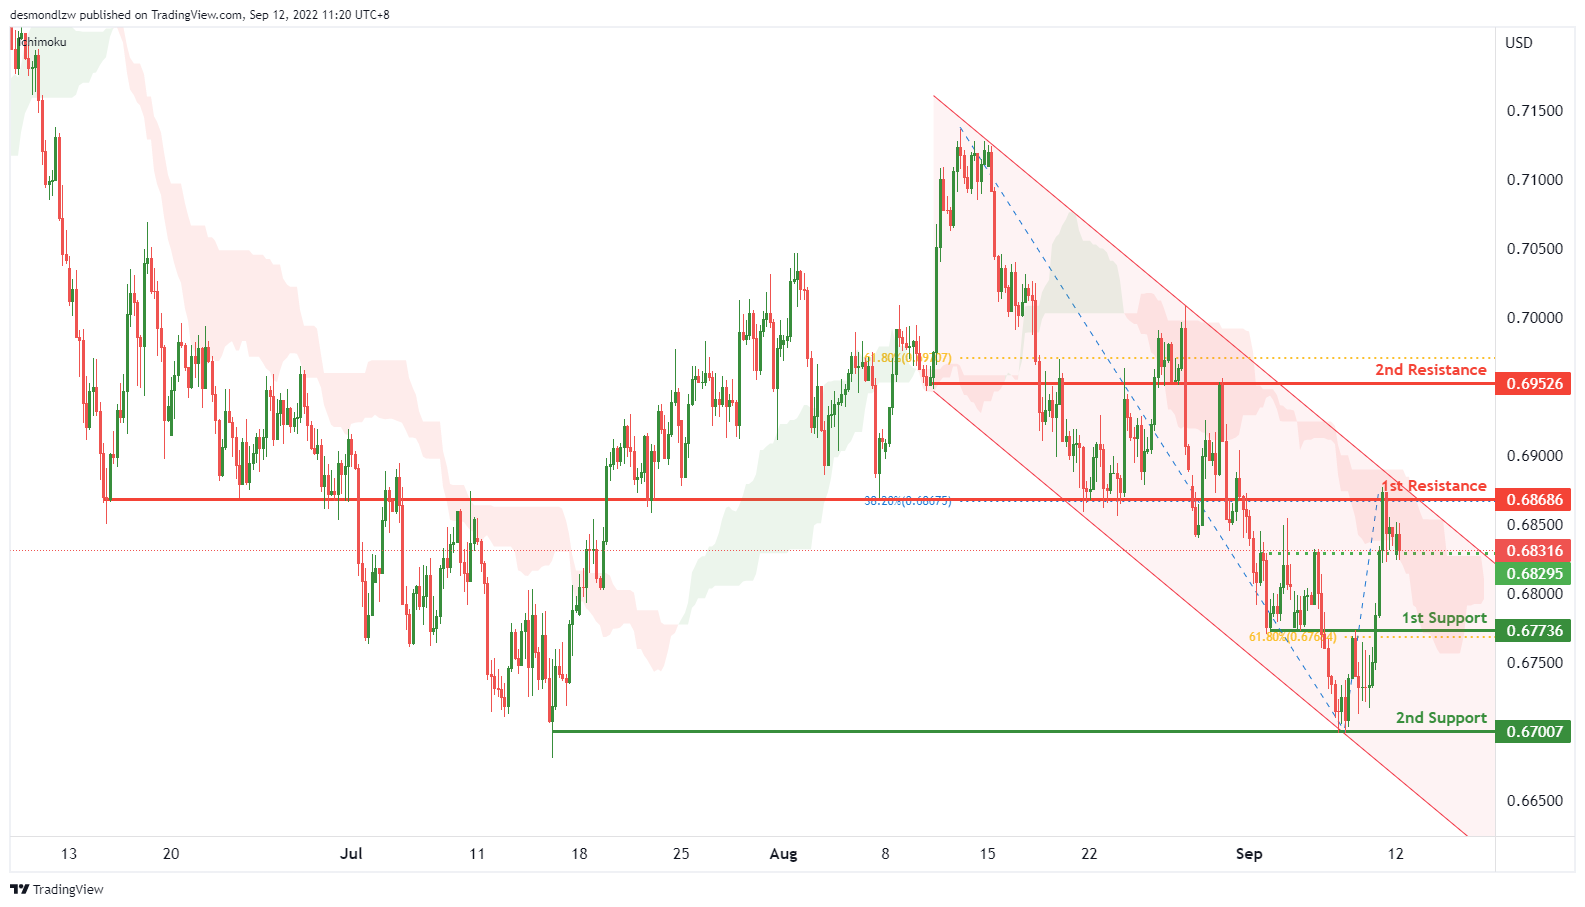
On the H4, with the price moving within the descending channel and below ichimoku cloud, we have a bearish bias that the price may drop to the 1st support at 0.67736, which is in line with the 61.8% fibonacci retracement and overlap support. If the price can break the 1st support, the 2nd support could be at 0.67007, where the swing lows are. Alternatively, the price may continue the pullback trend, break the descending channel and then rise to the 1st resistance at 0.68686, where the overlap resistance is. If the 1st resistance is broken, the 2nd resistance could be at 0.69526, where the overlap resistance and 61.8% fibonacci retracement are.
Areas of consideration
- H4 1st support at 0.67736
- H4 2nd support at 0.67007
NZD/USD:
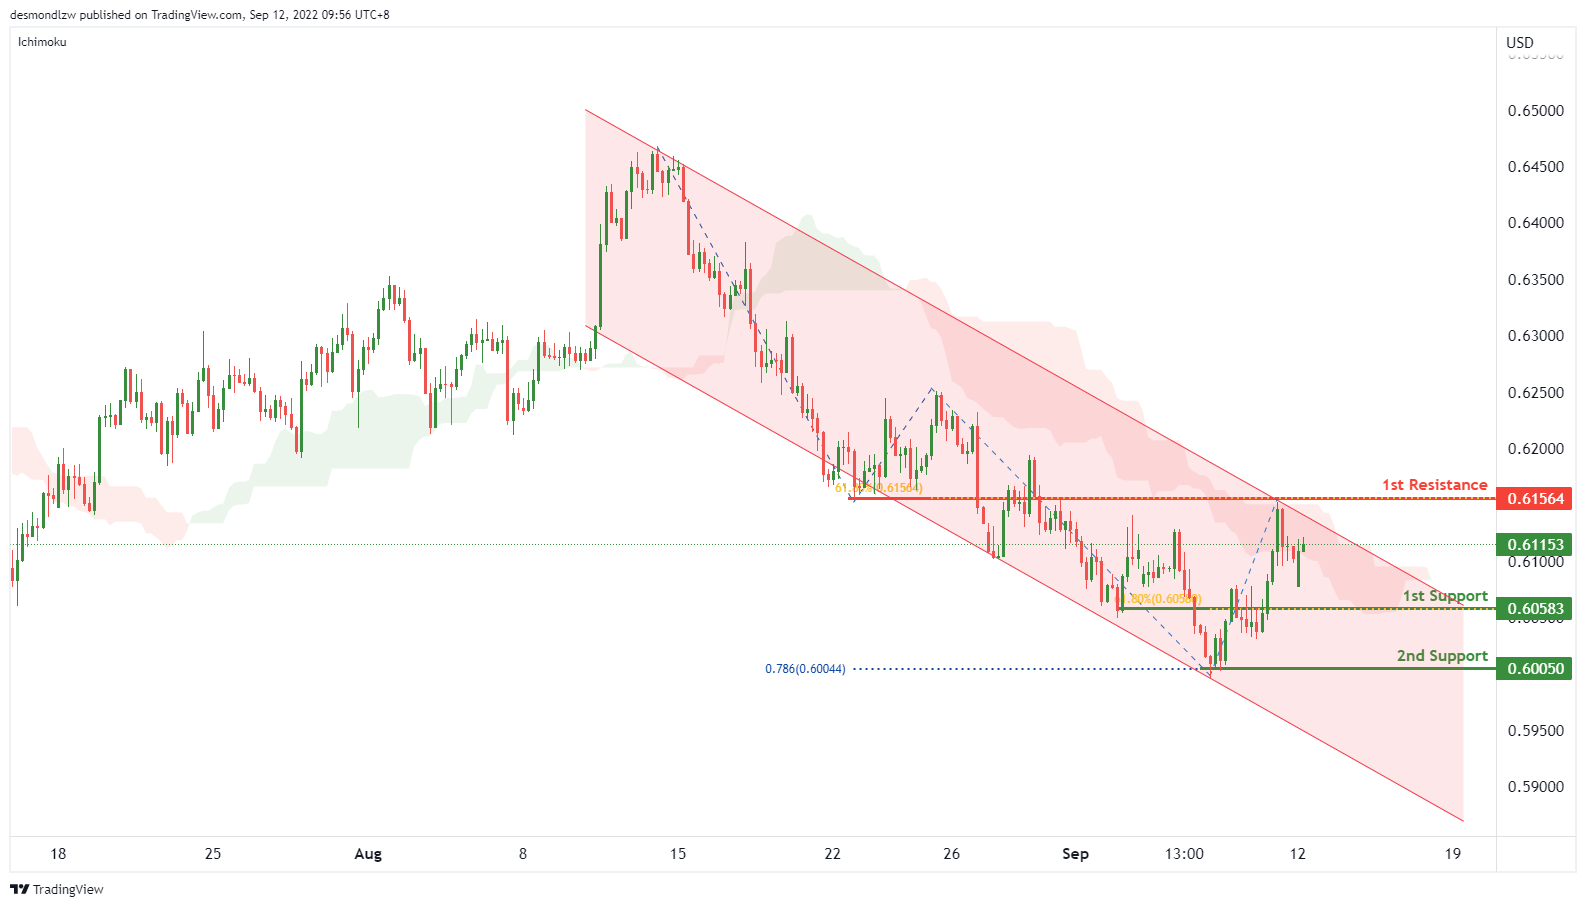
On the H4, with price moving within the descending channel and below ichimoku cloud, we have a bearish bias that the price may drop to the 1st support at 0.60583, where the 61.8% fibonacci retracement and previous swing low are. If the price can break this level, the next support level could be at 0.60050, where the 78.6% fibonacci projection and swing low are. Alternatively, the price may break the descending channel and rise to the 1st resistance at 0.61564, which is in line with the overlap resistance and 61.8% fibonacci retracement.
Areas of consideration:
- H4 time frame, 1st support at 0.60583
- H4 time frame,2nd support at 0.60050
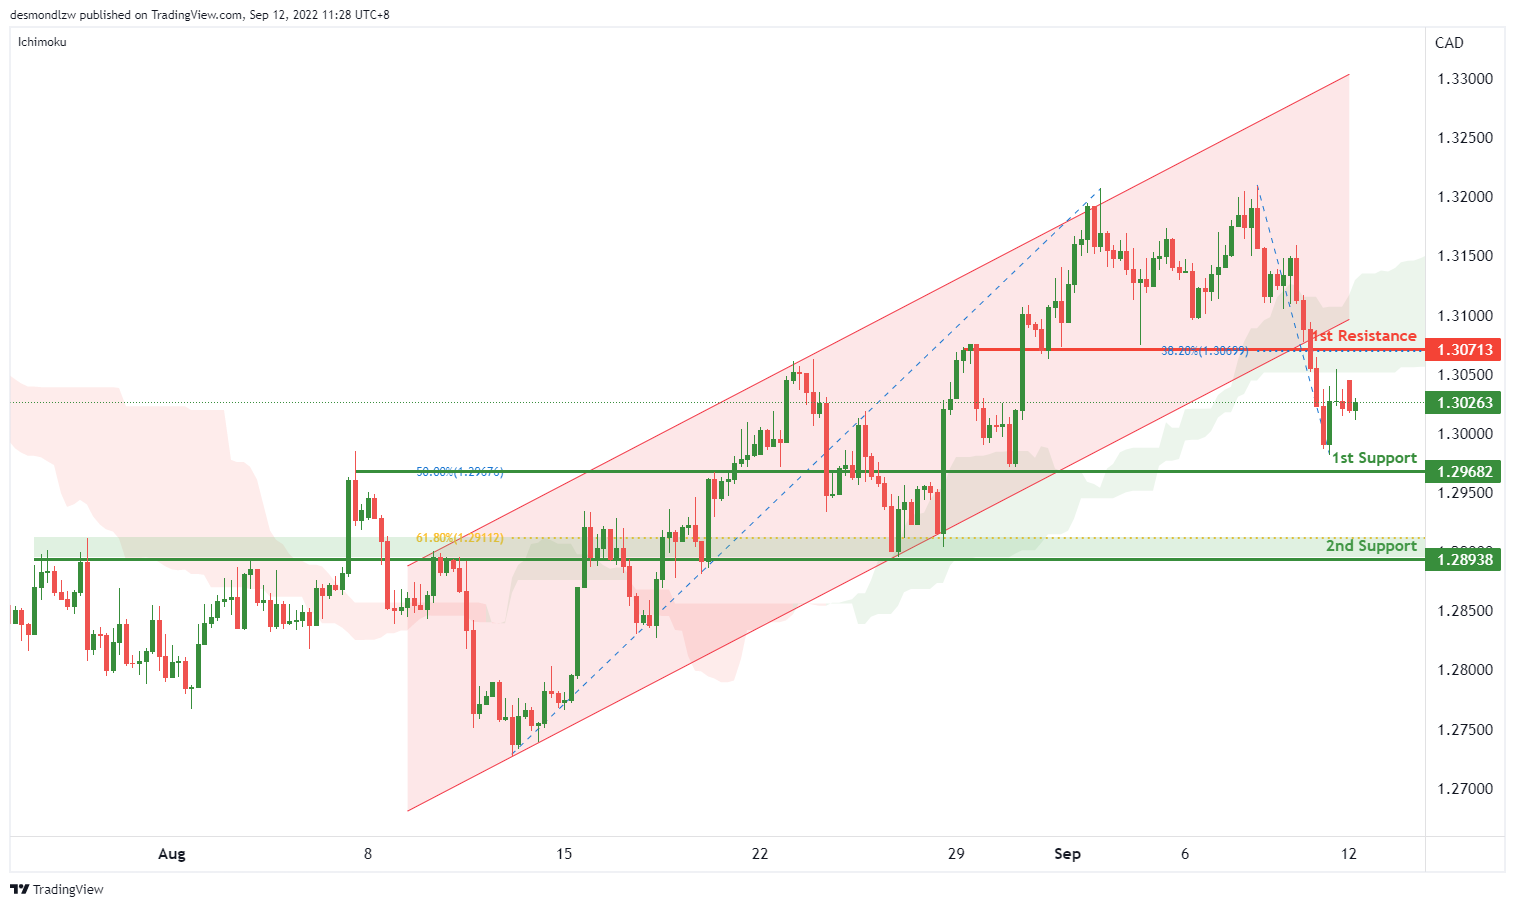
USD/CAD:
On the H4, with the price breaking the ascending channel, below the ichimoku cloud, and there’s a possible “double top” pattern, we have a bearish bias that the price may drop to the 1st support at 1.29682, which is in line with the overlap support and 50% fibonacci retracement. If the 1st support is broken, the 2nd support could be at 1.28938, where the overlap support and 61.8% fibonacci retracement are. Alternatively, the price may rise to the 1st resistance at 1.30713, where the “neckline” of the “double top” pattern and 38.2% fibonacci retracement are.
Areas of consideration:
- H4 time frame, 1st support at 1.29682
- H4 time frame, 2nd support at 1.28938
OIL:
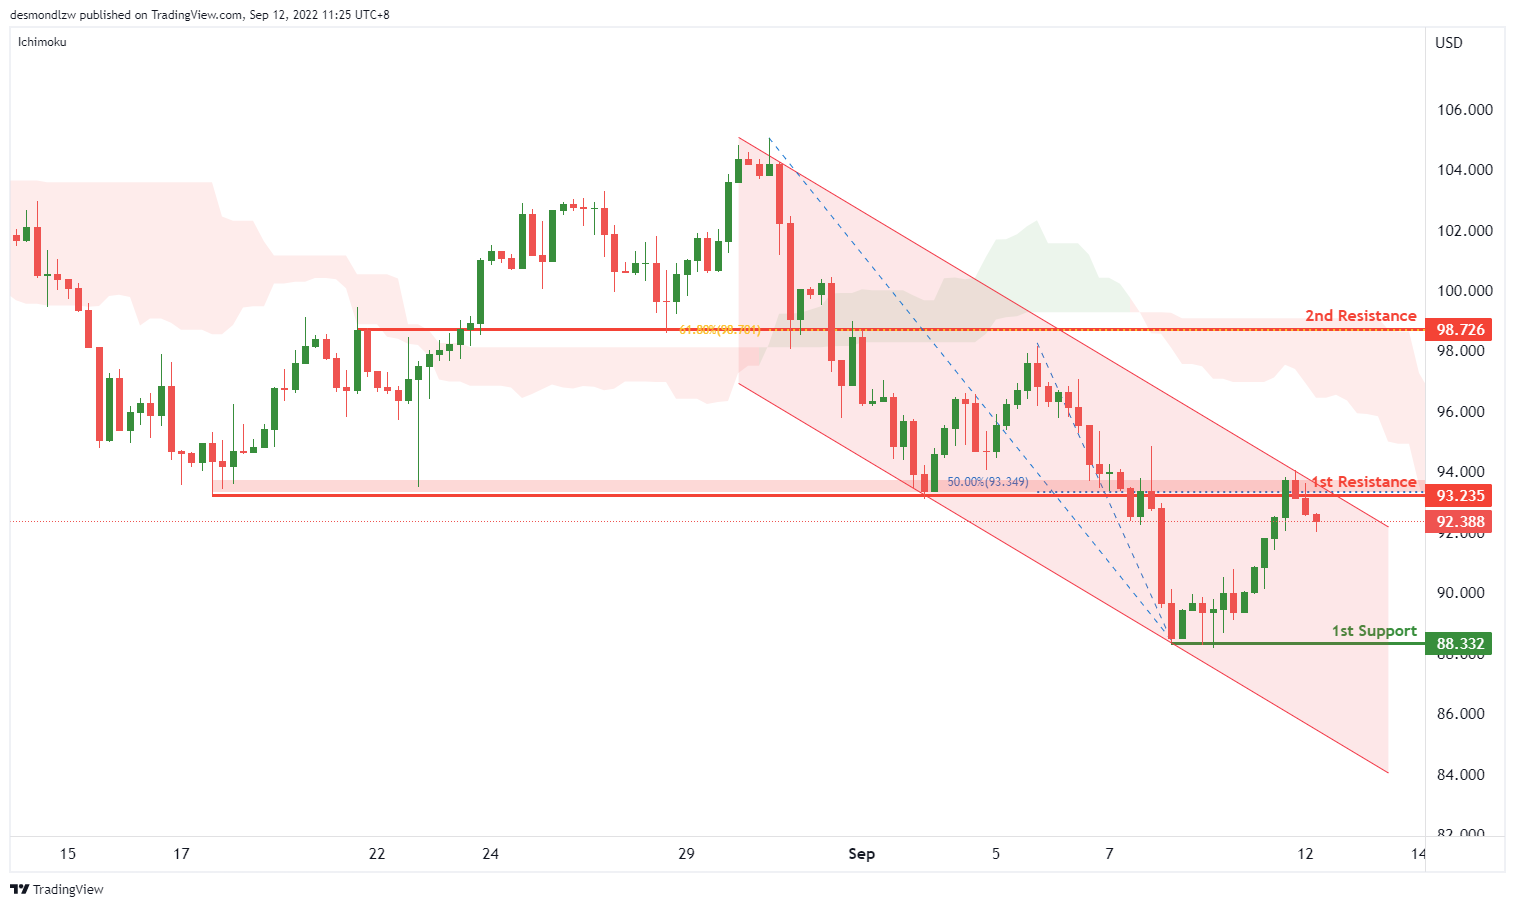
On the H4, with price below ichimoku cloud and within the descending channel, we have a bearish bias that the price may drop to the 1st support at 88.332, where the 78.6% fibonacci projection and swing low are. Alternatively, the price may retest the 1st resistance at 93.235, where the overlap resistance and 50% fibonacci retracement are. If the price can break this resistance level, the next resistance level could be at 98.726, which is in line with 61.8% fibonacci retracement and overlap resistance.
Areas of consideration:
- H4 time frame, 1st resistance at 93.235
- H4 time frame, 1st support at 88.332
Dow Jones Industrial Average:
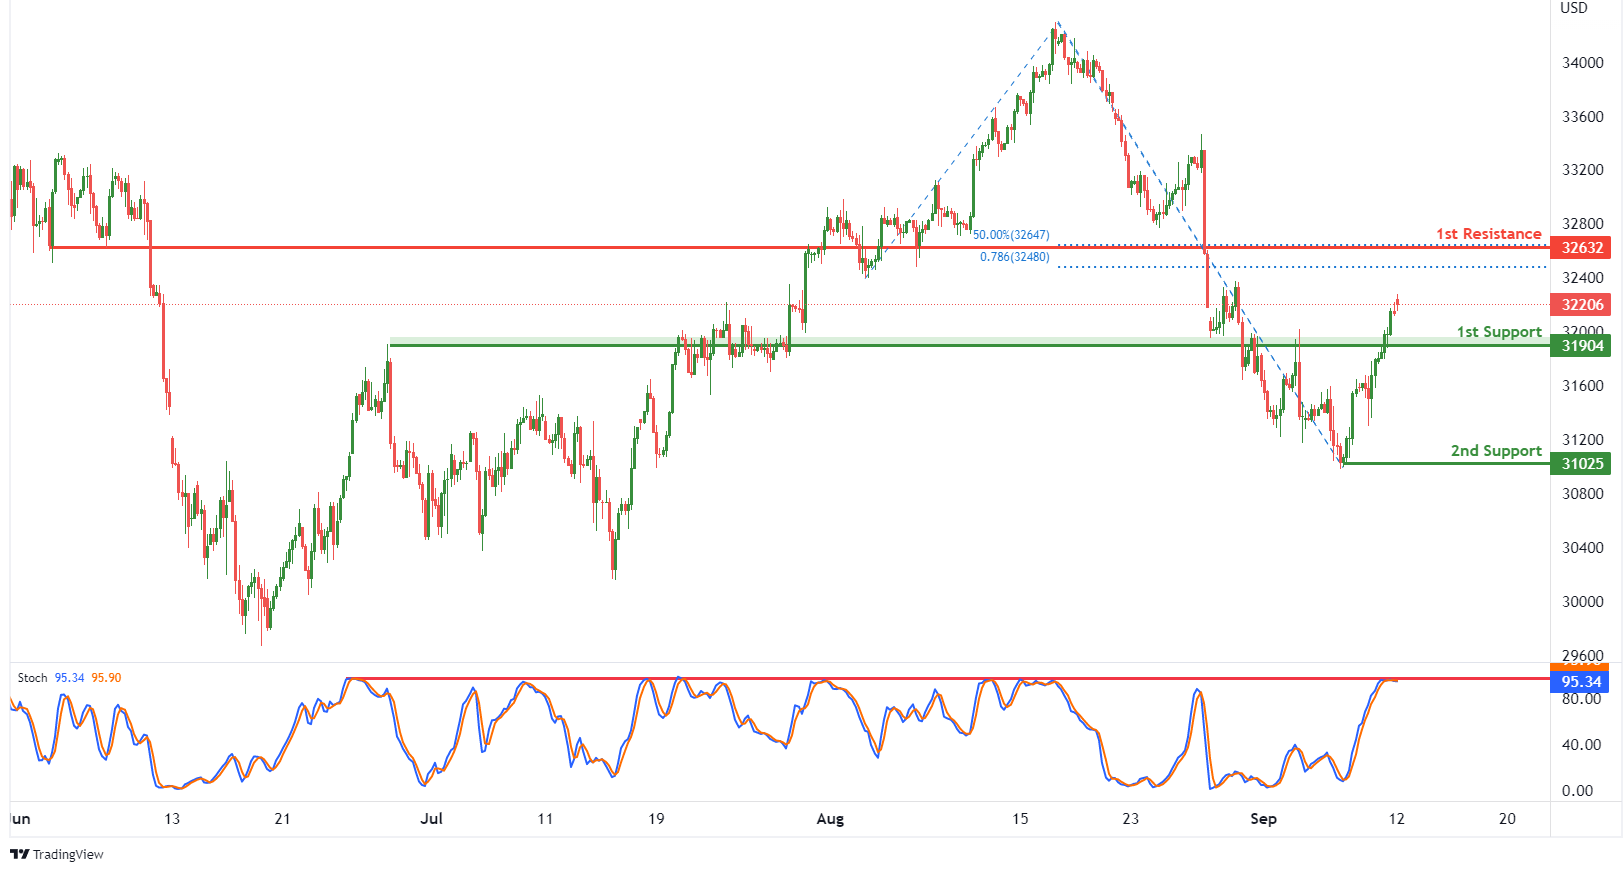
On the H4, with price expected to reverse off the stochastic resistance, we have a bearish bias that price will drop to 1st support at 31904 where the pullback support is. Once there is downside confirmation that price has broken 1st support structure, we would expect bearish momentum to carry price to 2nd support at 31025 where the swing low support is. Alternatively, price could rise to 1st resistance at 32632 where the pullback resistance, 50% fibonacci retracement and 78.6% fibonacci projection are.
Areas of consideration:
- H4 time frame, 1st resistance of 32632
- H4 time frame, 1st support at 31904
DAX:
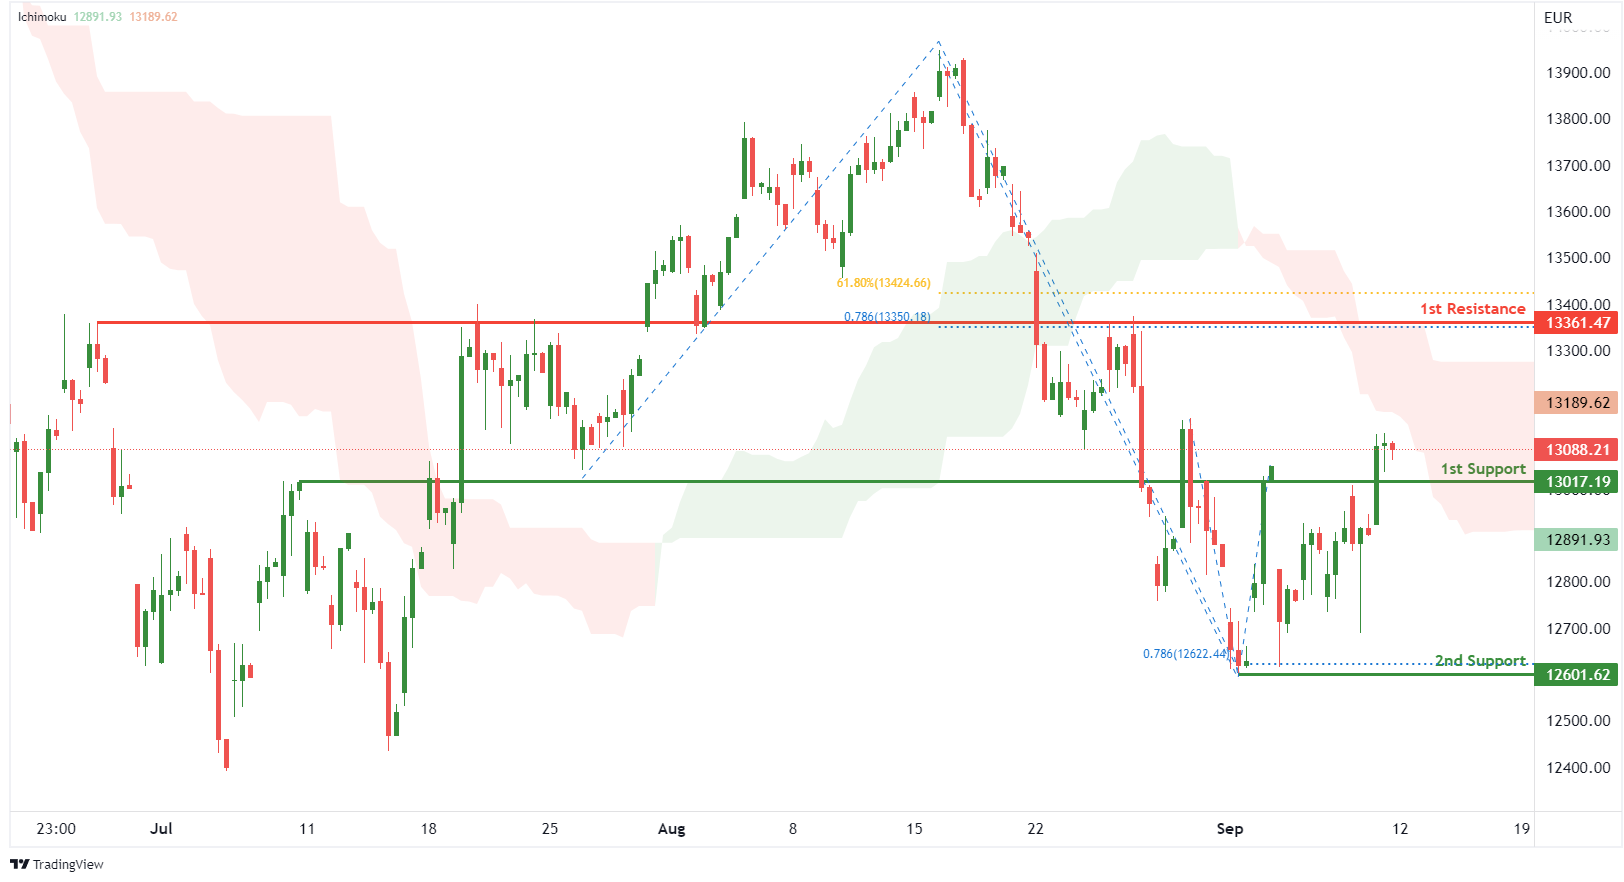
On the H4, with price moving below the ichimoku indicator, we have a bearish bias that price will drop to 1st support at 13017.19 where the pullback support is. Once there is downside confirmation that price has broken 1st support structure, we would expect bearish momentum to carry price to 2nd support at 12601.62 where the swing low support and 78.6% fibonacci projection are. Alternatively, price could rise to 1st resistance at 13361.47 where the overlap resistance, 61.8% fibonacci retracement and 78.6% fibonacci projection are.
Areas of consideration:
- H4 time frame, 1st resistance of 13361.47
- H4 time frame, 1st support at 13017.19
ETHUSD:
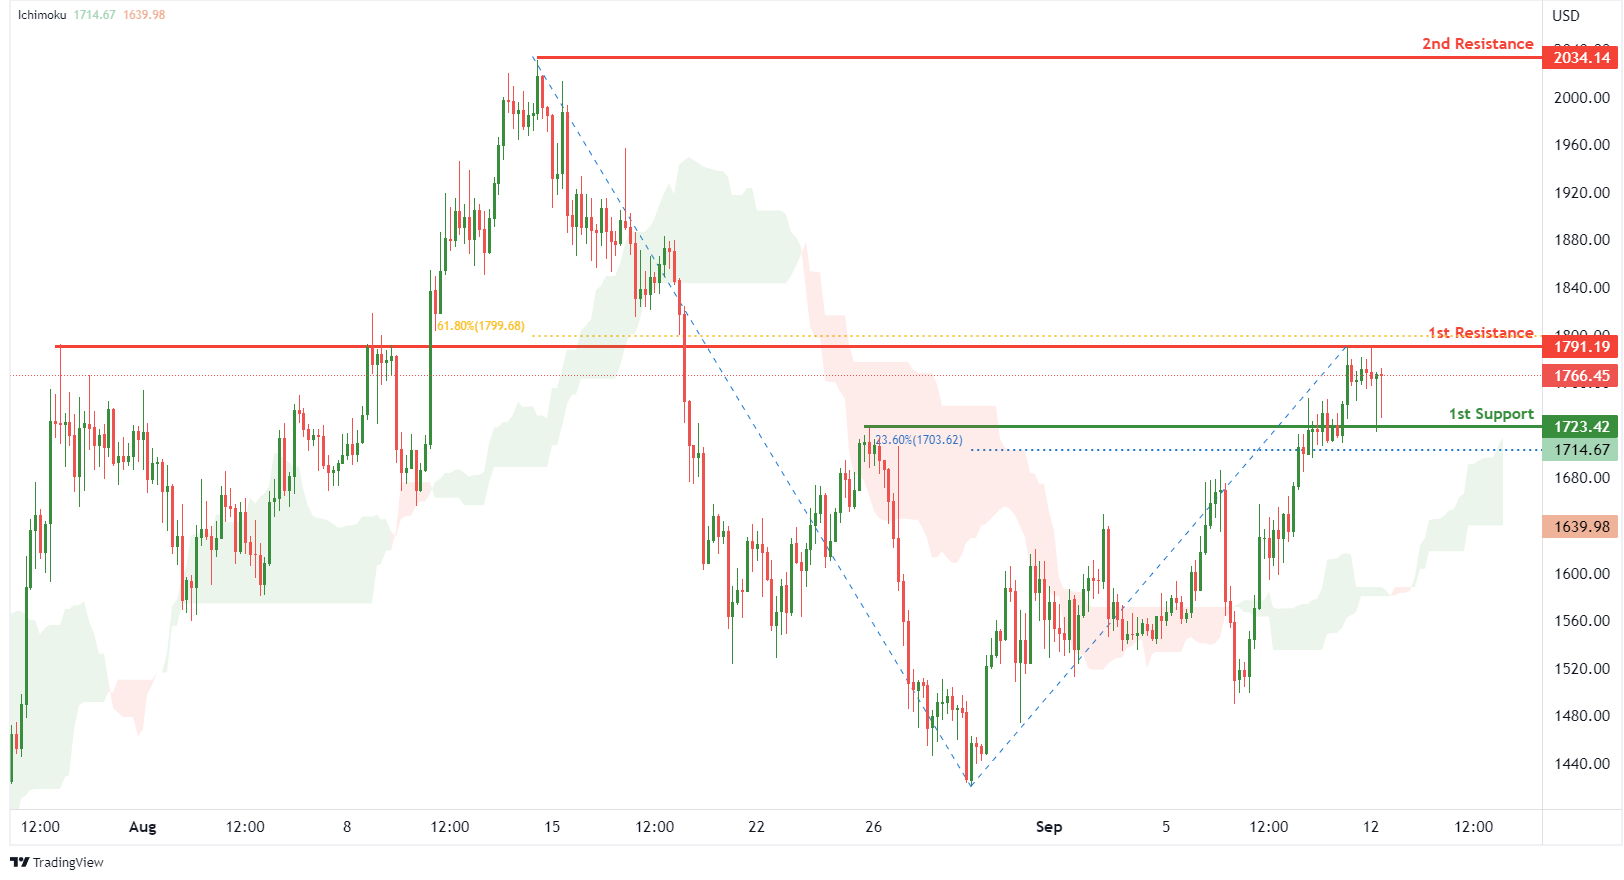
On the H4, with price moving above the ichimoku indicator, we have a bullish bias that price will rise to 1st resistance at 1791.19 where the overlap resistance and 61.8% fibonacci retracement are. Once there is upside confirmation that price has broken 1st resistance structure, we would expect bullish momentum to carry price to 2nd resistance at 2034.14 where the swing high resistance is. Alternatively, price could drop to 1st support at 1723.42 where the pullback support and 23.6% fibonacci retracement are.
Areas of consideration:
- H4 time frame, 1st resistance of 1791.19
- H4 time frame, 1st support at 1723.42
BTCUSD:
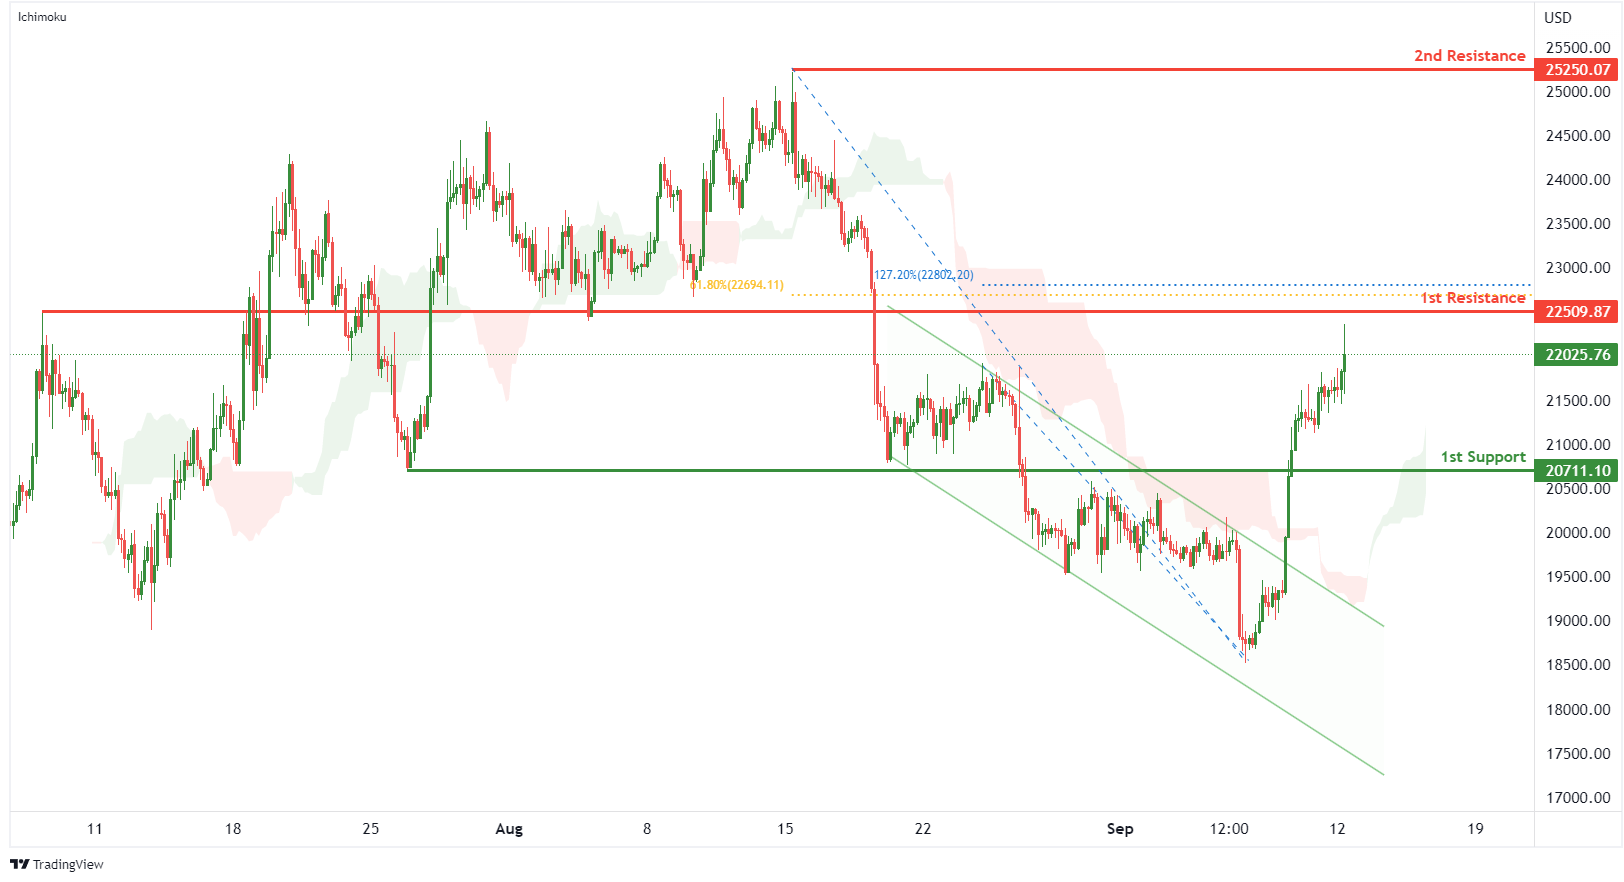
On the H4, with price breaking out of a descending channel and moving above the ichimoku indicator, we have a bullish bias that price will rise to 1st resistance at 22509.87 where the pullback resistance, 61.8% fibonacci retracement and 127.2% fibonacci extension are. Once there is upside confirmation that price has broken 1st resistance structure, we would expect bullish momentum to carry price to 2nd resistance at 25250.07 where the swing high resistance is. Alternatively, price could drop to 1st support at 20711.10 where the pullback support is.
Areas of consideration:
- H4 time frame, 1st resistance of 22509.87
- H4 time frame, 1st support at 20711.10
S&P 500:
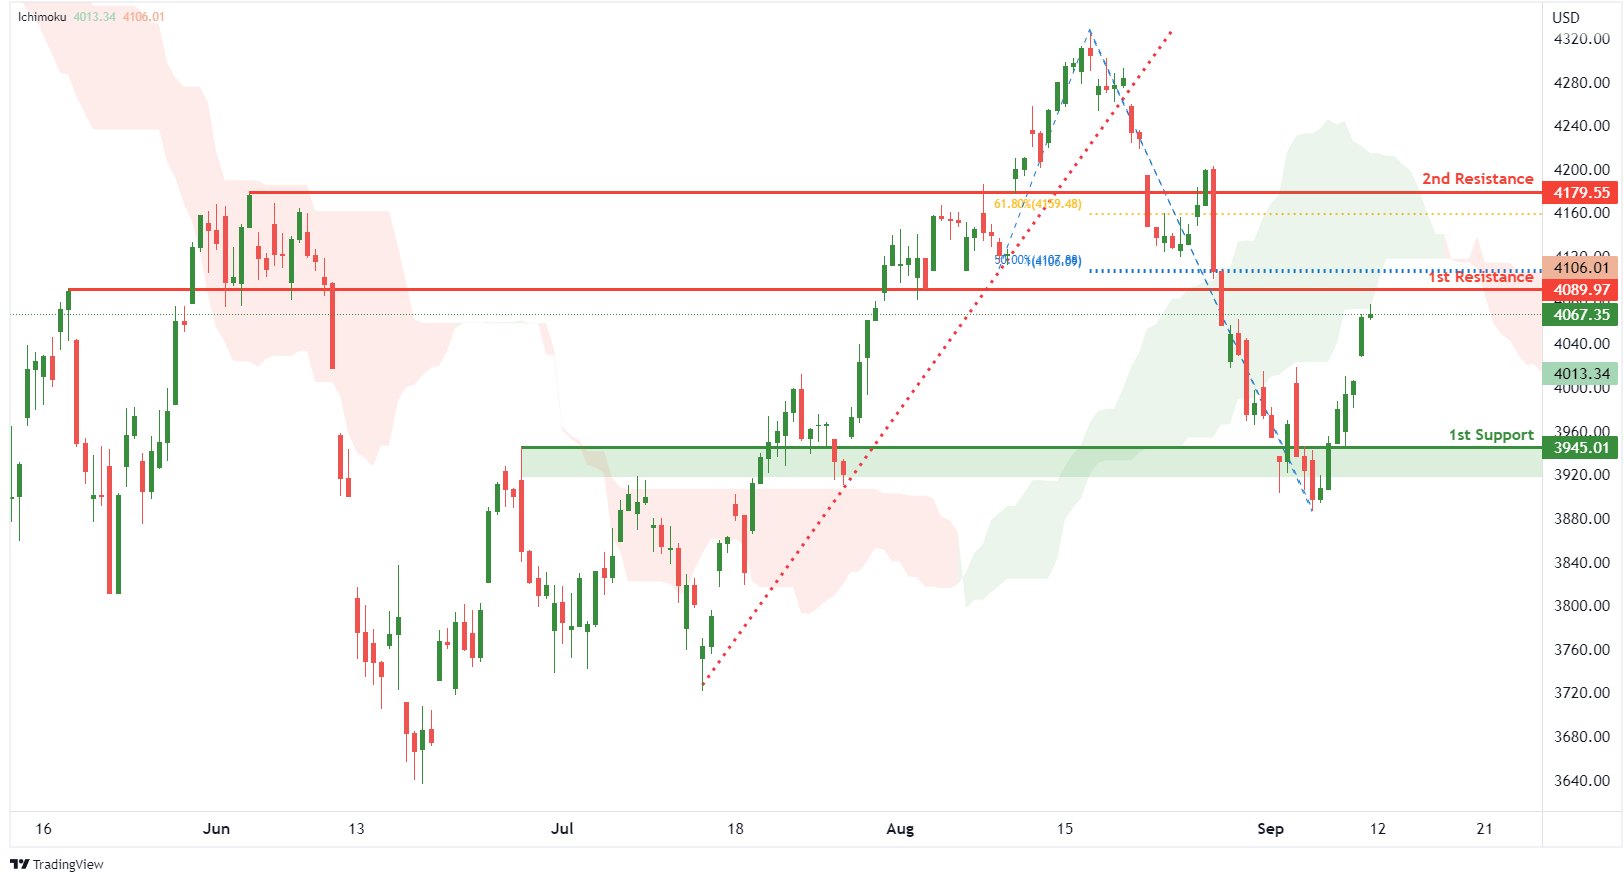
On the H4, with prices breaking out of the ascending trendline and moving below the ichimoku indicator, we have a bearish bias that the price will drop from 1st resistance at 4089.97 where the pullback resistance, 50% fibonacci retracement and 100% fibonacci projection are to the 1st support at 3945.01 where the pullback support is. Alternatively, price could break 1st resistance structure and rise to 2nd resistance at 4179.55 where the pullback resistance and 61.8% fibonacci retracement are.
Areas of consideration:
- H4 time frame, 1st resistance of 4089.97
- H4 time frame, 1st support at 3945.01
Forex and Cryptocurrencies Forecast
EUR/USD: Two Events of the Week
The past week was marked by two significant events. First, the EUR/USD pair updated its 20-year low on Tuesday, September 06 once again, falling to 0.9863. And then the European Central Bank raised its key interest rate for the first time in its history by 75 basis points (bp) to 1.25% on Thursday, September 08, accompanying this act with very hawkish comments.
We must say that both events did not come as a surprise to the market and, on the whole, were in line with the forecasts that we voiced in the previous review. The pair's rebound to the upside following the ECB's decision was not surprising either. Having risen by about 250 points, it peaked at 1.0113 on September 9. This was followed by a correction to the north, and the pair finished at 1.0045
Despite such a hawkish move, the ECB is still far from the US Fed: the current rate on the dollar is 2.50%, which is exactly twice as high as on the euro. But this is not all. If the September meeting of the European regulator has already passed, its American counterpart still has it ahead. And if the Fed's FOMC (Federal Open Market Committee) raises the rate on September 21 once again, the dollar will go even further into the lead. And the probability of such a step is close to 100%.
It is still difficult to predict what both Central Banks will do next month, October. But there is a feeling that the ECB may, at least for a while, lower its hawkish attitude to understand how the rate hike has affected inflation and the state of the economy. The factor of the energy crisis in Europe, caused by anti-Russian sanctions, is still playing against the euro. However, the leadership of the European Union is taking active steps to reduce energy dependence on Russia on the eve of winter. And judging by the fact that the Eurozone GDP growth published on September 7 turned out to be higher than both the previous value and the forecast (4.1% versus 3.9%), stagflation may be avoided.
At the time of writing this review, on the evening of Friday, September 09, the votes of the experts are distributed as follows. 55% of analysts stand for the fact that EUR/USD will continue to move south in the near future, 30% vote for its growth and the strengthening of the euro, the remaining 15% predict a side trend along Pivot Point 1.0000. The readings of indicators on D1 do not give any certainty. Among trend indicators, the ratio of forces is 50% to 50%. Among the oscillators, there is a slight advantage on the green side, 50%, 35% are on the red side, and 15% are colored in neutral gray.
The main trading range of the last three weeks was within 0.9900-1.0050. Taking into account breakdowns in both directions, it is somewhat wider, 0.9863-1.0113. The next strong support after the 0.9860 zone is located around 0.9685. The resistance levels and targets of the bulls look like this: 1.0130, then 1.0254, the next target area is 1.0370-1.0470.
There will be quite a lot of important events in the coming week. Consumer Price Indices (CPI) in Germany and the US will be published on Tuesday, September 13. CPI is an indicator of consumer inflation and reflects changes in the level of prices for groups of goods and services in August. The September ZEW Economic Sentiment Index in Germany will be released the same day. Another batch of economic statistics will arrive on Wednesday, September 14 and Thursday, September 15 in the form of the Producer Price Index (PPI) and data on retail sales and unemployment in the US. We are waiting for the publication of the Eurozone CPI, as well as the US University of Michigan Consumer Confidence Index, at the end of the working week, on Friday, September 16.
GBP/USD: British Pound's Anti Record
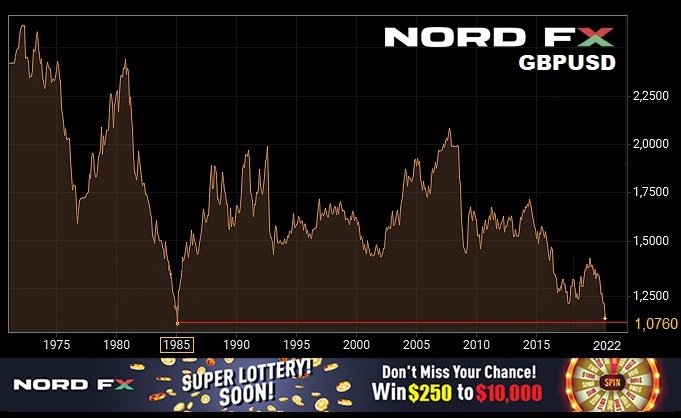
We titled our previous review of GBP/USD "On the Way to a 37-Year Low". Recall that the lows of March 2020 (1.1409-1.1415) were at the same time the lows for the last 37 years. And now, this offensive forecast for the British currency came true: the pair reached a local bottom at around 1.1404 on September 07, breaking the 2020 anti-record. Then the euro, strengthening against the dollar, pulled up other currencies, including the pound. As a result, GBP/USD rose to 1.1647, and the five-day period closed at 1.1585.
An important event on August 7 was the hearing of the UK Inflation Report and the speeches by members of the Monetary Policy Committee, headed by the head of the Bank of England, Andrew Bailey. As predicted, officials reaffirmed their commitment to tightening monetary policy (QT). Their statements strengthened the market's expectations that the regulator could raise the rate from 1.75% to 2.50% at its September meeting. This meeting was originally scheduled for next Thursday. However, due to mourning for Queen Elizabeth II, it was postponed for a week and will take place on September 22, after the US Federal Reserve makes its decision on the rate.
If the forecast for a growth in the interest rate on the pound comes true, this will create an even greater burden on the UK economy, which already causes serious concerns. The UK is already amid a recession and inflation will hit 14% this year, according to the British Chamber of Commerce (BCC). And according to Goldman Sachs, it could reach 22% by the end of 2023, which will provoke a protracted economic downturn and a contraction of the economy by more than 3.5%. British energy regulator Ofgem has already announced that average annual electricity bills for UK households will rise by 80% from October. And according to the Financial Times, the number of fuel-poor households will more than double in January to 12 million.
Of course, investors are very worried about whether the new prime minister, Liz Truss, will be able to cope with the deplorable situation in which the country's economy has found itself. Having failed to fully recover from Brexit and the COVID-19 pandemic, the United Kingdom has faced unprecedented inflation, a decline in the population's ability to pay and a catastrophic collapse of the national currency.
The median forecast for the coming week looks fairly neutral. A third of analysts side with the bulls, another third side with the bears, and another third have taken a neutral position. The indicator readings on D1 are mostly colored red. Among the trend indicators, the ratio is 70% to 30% in favor of the red ones. For oscillators, 65% point south and 35% point east. No oscillators are pointing north.
As for the bulls, they will meet resistance in the zones and at the levels of 1.1600, 1.1650, 1.1720, 1.1800, 1.1865-1.1900, 1.2000, 1.2050-1.2075, 1.2160-1.2200. The nearest support, apart from the 1.1475-1.1510 zone, is the September 07 low 1.1404. One can only guess to what levels the pair can fall further. Given the increased volatility, it is probably not worth focusing on either round values, or Fibonacci levels, or any figures of graphical analysis.
With regard to the economic statistics of the United Kingdom, data on GDP and output should arrive on Monday, September 12, that on the level of wages and unemployment in the country will be published on Tuesday, September 13. The Consumer Price Index (CPI) will be published on Wednesday, September 14, and retail sales in the UK will be known on Friday, September 16. The source of all this data is the Office for National Statistics, so the schedule for their publication is subject to change due to mourning for Elizabeth II.
USD/JPY: Astronaut Pair
USD/JPY rose to a high of 140.79 on September 2, thus reaching a 24-year high. Most analysts were waiting for another rise and taking new heights from the past week. This is exactly what happened: the pair soared to the level of 144.985 on Wednesday, September 07. The last chord of the week sounded a bit lower, at 142.65.
Describing the cause of what happened is quite simple using Copy Paste on the keyboard, it is enough to take any of our reviews over the past couple of years. That's what we're doing right now. So, the reason is the same: the divergence between the monetary policies of the Bank of Japan (BOJ) and other major Central Banks, primarily the US Federal Reserve. Unlike the American hawks, the Japanese regulator still intends to pursue an ultra-soft policy, which is aimed at stimulating the national economy through quantitative easing (QE) and a negative interest rate (-0.1%). This divergence is a key factor for the further weakening of the yen and the growth of USD/JPY. And the situation will not change until BOJ raises the rate.
And why should the Japanese Central Bank raise it? The published data on the country's GDP (Q2) look quite good: the indicator rose from 0.5% to 0.9%, while the forecast was 0.7%. Of course, inflation in Japan has exceeded the 2% target, which is bad. But this is almost nothing compared to inflation in the US, the Eurozone or the UK. So there is no need to worry too much here. So Japanese Finance Minister Shunichi Suzuki said that price increases will be extinguished not by tightening monetary policy, but, on the contrary, by injecting 5.5 billion yen from the budget reserve. In addition, the minister said that he is "closely monitoring the movement of the exchange rate", that "it is important that it moves steadily" and that "abrupt movements of the currency are undesirable."
Haruhiko Kuroda, Governor of the Bank of Japan, said almost the same thing, word for word, on Friday, September 09, after his meeting with Prime Minister Fumio Kishida. His main theses are as follows: "I discussed the foreign exchange market with Kishida", "Fast movements in the exchange rate are undesirable", "We will closely monitor the movement of exchange rates."
We do not know what is so positive in the words of these high officials, but, as the media write, thanks to them the yen received support, and now 45% of experts vote for its further strengthening. Another 45% remain neutral, and only 10% are waiting for further growth of USD/JPY. The indicators on D1 have an absolute advantage on the side of the greens. Among oscillators there are 100% of them, among trend indicators - 90%, and only 10% on the side of the reds.
The nearest resistance is 143.75. The bulls' task No.1 is to renew the high of September 07 and gain a foothold above 145.00. Back in the spring, when analyzing the rate of the pair's rise, we made a forecast according to which it could reach a peak of 150.00 in September. And it looks like it's starting to come true. Supports for the pair are located at the levels and in the zones 142.00, 140.60, 140.00, 138.35-139.05, 137.50, 135.60-136.00, 134.40, 132.80, 131.70.
No important events in the economic life of Japan are expected this week.
CRYPTOCURRENCIES: Main Week of the Calendar
Last week was marked by another wave of sales. The bitcoin rate approached the June 19 low ($17,600), falling to $18,543 on September 7. At the same time, Ethereum fell below $1,500, an important support/resistance level, and recorded a local bottom at $1,488. This dynamic is primarily due to the hawkish rhetoric of the Fed and, as a result, the strengthening of the US currency. However, later, against the background of the ECB meeting, both coins won back their losses in full, and even seriously increased in quotes. At the time of writing this review, on Friday evening, September 9, they are trading as follows: BTC/USD at $21.275, ETH/USD at $1,715. The total capitalization of the crypto market has risen slightly above the psychologically important level of $1 trillion and is $1.042 trillion ($0.976 trillion a week ago). The Crypto Fear & Greed Index has fallen by another 3 points in seven days from 25 to 22 and is in the Extreme Fear zone.
According to the TradingView service, the ratio of ethereum to bitcoin has grown to its highest values for 2022. It was fixed at 0.0843 in the afternoon of September 06. The last time such a level was noted was in December 2021. 1 BTC is worth about 12.4 ETH at current values.
The ETH community has linked the growth of this indicator to the upcoming network merger. Many users have been talking for almost a year now that a revolution will happen in this tandem sooner or later. Then ethereum will overtake bitcoin in terms of capitalization and value. Recall that the update of the ethereum network is scheduled for the period from September 13 to 20. This merge is likely to be the most important event of 2022 in the cryptocurrency industry. This is because it will bring several key changes to how the network works. The main ones are a 99.99% reduction in energy consumption and a decrease in the emission of the ETH coin.
According to a number of experts, if the transition to the Ethereum 2.0 network and the implementation of the Proof-of-Stake mechanism go as planned, this altcoin can rise sharply in price and pull the entire market up with it, primarily its main competitor, bitcoin. But that's if everything goes smoothly and according to plan. Or maybe not. So, it became known on Wednesday, September 07 that the ethereum network encountered a problem after the Bellatrix update. The blockchain is seeing a noticeable spike in "number of missed blocks," the frequency with which the network fails to process blocks of transactions scheduled for validation. This figure has increased by about 1700%. Before the update, it was about 0.5%, and after the Bellatrix it rose to 9%.
CoinShares Chief Strategy Officer Meltem Demirors believes that investors are ignoring the general situation in the market, amid the hype around the transition of ETH to the PoS mechanism. And that, despite the benefits of the merger for the ethereum network itself, it is not certain that this event will attract significant investment capital: "While there is significant enthusiasm in the crypto community for a merger that can rapidly reduce supply and increase demand, the reality is more prosaic: investors are concerned about rates and macro indicators. I believe that significant amounts of new capital are unlikely to enter ETH. There are certain risks that need to be played out in the market because the merger has been used as an excuse to buy on the rumor and sell on the news. How will these risks be played out? Most likely on the institutional side or through trading, but through options rather than outright purchases of the asset."
Experts of u.today portal also remind about macro statistics. They note that September 13 could be an important date, not only because of the merger of the ethereum networks. There is one more factor. As we wrote above, fresh data from the US Consumer Price Index (CPI) will be published on the same day. According to analysts, this information will help investors understand what is happening with the inflation rate in the country and will directly affect the financial markets, including cryptocurrency. If the network update does not cause problems with volatility, liquidity and security, and the CPI shows a decrease in inflation, then a bullish momentum can be predicted, otherwise the crypto market will continue to fall.
Glassnode allowed BTC to fall further to support around $17,000. The specialists do not rule out such a wave of capitulation due to an increase in the proportion of "unprofitable" coins at the disposal of speculators (who traded in the previous 155 days). It rose to 96% (3.11 million BTC out of 3.24 million BTC). The situation was aggravated by the suspension of the bearish rally from June 19 to August 15. The rise in the price to $25,000 and its subsequent fall in just a few days transferred half of the speculators' coin reserves to the category of "unprofitable".
In the short term, it is the stress testing of speculators that will determine the disposition in the market, since most of the on-chain activity was carried out by them. Three such episodes in the current downtrend had led earlier to sales with a short planning horizon and the subsequent formation of a local bottom.
Analyst Kevin Swenson agrees with Glassnode's alarming outlook. He issued a warning about a possible downward movement of bitcoin as well. The US dollar soared to its highest level in 20 years, while bitcoin fell below the diagonal support that kept the asset afloat from its June lows of $17,600, Swanson said. Swanson admits further bearish scenario for bitcoin as the DXY dollar index is still in a strong uptrend.
Another expert, Naeem Aslam, believes that the fall will not be to the level of $18,000 or $15,000, but much lower, to about $12,000.
Cryptoanalyst Nicholas Merten does not rule out either that bitcoin will soon collapse to a strong support level in the range of $12,000-14,000. He made this forecast based on the net unrealized profit and loss (NUPL), which shows the state of the positions of BTC holders. (When NUPL is above 0, most investors are in the black. If below 0, then more investors suffer losses).
At the same time, Merten believes that the BTC movement can be unpredictable since the asset has never been traded during a period of tightening monetary policy and raising interest rates. He also doubts the imminent return to quantitative easing (QE) by the US Federal Reserve, as it was in the past. "I would like to note," the expert writes, "that there has never been a 50% recession, almost depressive correction or a bearish stock market in all 10 years during which BTC has been liquidly traded on exchanges, . There were typical bear markets around 20%, and then the Fed came to the rescue and saved the day. But the Fed cannot do the same now. If you print money and try to save the day, you can seriously exacerbate the problem of inflation."
And some positive at the end of the review. Despite the fall in the capitalization of the crypto market and the bankruptcy of a number of large projects, the bitcoin hash rate is close to its historical maximum. The situation seems inconsistent with the fall of the main cryptocurrency by more than 70% from the maximum, and the collapse of the shares of public mining companies. However, miners continue to introduce new capacities. Analysts attribute this to the optimism of some companies and the readiness for market turbulence of others. If we add to this the Glassnode data, which observes an increase in the number of coins at the disposal of hodlers, then we can hope that the crypto winter will still be followed by spring.
ECB Elderson: Very important that inflation expectations not become unanchored
ECB Executive Board member Frank Elderson told Dutch television, "it's very important that the expectations that the people have on how the inflation will develop in the medium to long term will not become unanchored."
"It is vital that people and companies or actors in the economy in general maintain their trust that we as the ECB will reach our of target of 2 per cent inflation," Elderson said.
Bundesbank Nagel: Further clear steps must follow if inflation stays the same
Bundesbank President Joachim Nagel said in a radio interview on Sunday that last week's 75bps hike was a "clear sign and if the inflation picture stays the same, further clear steps must follow."
He added that inflation may peak at more than 10% in December. "In the course of 2023, the inflation picture is likely to weaken somewhat," he said. Still, the rate "is likely to be at a far-too-high level of over 6%."
While there "currently are some indications that the economy could stagnate or even contract in the second half of 2022 and that this trend could continue into next year, any recession may be shallow," Nagel added.
"In the end, stable prices are much more important for medium-term, long-term growth, for a good outlook for the euro area," he said. "We may need to overcome a dry spell, but for now at least it looks like this dry spell and the decline in economic output will not be severe."
EUR/USD: Recovery Faces Hurdle, Dollar Dips
Key Highlights
- EUR/USD started an upside correction above the 1.0000 level.
- It broke a key bearish trend line at 0.9985 on the 4-hours chart.
- GBP/USD is attempting a recovery wave from the 1.1400 zone.
- USD/JPY corrected lower after trading to a new multi-year high at 144.99.
EUR/USD Technical Analysis
The Euro started a decent recovery wave from the 0.9864 low against the US Dollar. EUR/USD cleared the 0.9920 and 0.9950 resistance levels to move into a short-term positive zone.
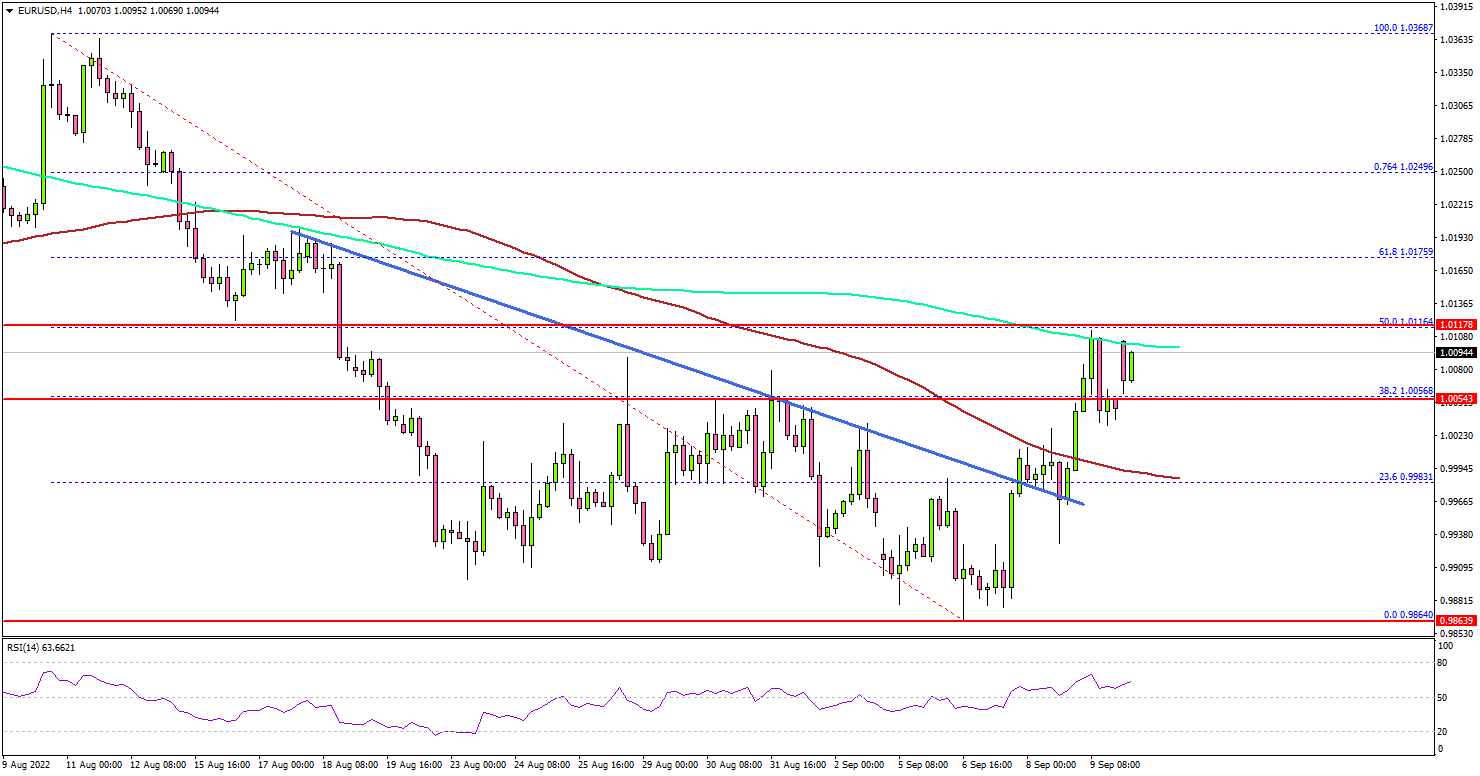
Looking at the 4-hours chart, the pair was able to clear the 1.0000 resistance zone and a key bearish trend line at 0.9985. The bulls pushed the pair above the 23.6% Fib retracement level of the downward move from the 1.0368 swing high to 0.9864 low.
It is now trading above the 1.0050 level and the 100 simple moving average (red, 4-hours), but it is still below the 200 simple moving average (green, 4-hours).
The pair is now facing resistance near the 1.0120 zone and the 200 simple moving average (green, 4-hours). The 50% Fib retracement level of the downward move from the 1.0368 swing high to 0.9864 low is also acting as a resistance.
If the bulls remain in action, the pair could even clear the 1.0120 resistance. The next major resistance is near 1.0175, above which the pair may perhaps rise towards the 1.0220 level. The main hurdle sits near the 1.0350level.
If there is a fresh decline, the pair might find bids near the 1.0000 level. A downside break below the 1.0000 support might increase selling pressure. The next major support is near the 0.9950 level, below which the pair could even test the 0.9880 level. Any more losses might send USD/JPY towards the 0.9850 support.
Looking at GBP/USD, the pair found support near the 1.1400 zone and recently started an upside correction towards the 1.1600 zone.
Economic Releases
- UK Industrial Production for July 2022 (MoM) - Forecast +0.4%, versus -0.9% previous.
- UK Manufacturing Production for July 2022 (MoM) - Forecast +0.6%, versus -1.6% previous.