

Sample Category Title
Sunset Market Commentary
Markets
The dollar again took center stage at the start of the new week. After correcting lower last Friday, the greenback continued to trade on the back foot today. It coincided with a better risk mood in general with equities advancing 0.7% in the US and almost 2% in Europe. Some attributed it to the advances made by the Ukrainian army. We also suspect some anticipation on Wednesday’s State of the Union by EC president Von der Leyen during which ad hoc and structural measures to address the energy crisis will be announced (cf. infra). Gas prices in any case fell again, dropping below €200/MWh. Whatever the reason, the greenback is losing ground against most peers. Trade-weighted, it extends losses to the 108(.3) big figure that also serves as support. EUR/USD surged right at the European open. We spot an autonomous euro move next to general dollar weakness. It was built on Buba’s Nagel hawkish comments over the weekend. ECB’s Schnabel later reinforced that message. EUR/USD briefly escaped the downward trend channel in place since the start of the year and hit 1.02 before paring gains. The pair is currently changing hands at 1.011 USD/JPY stabilizes at 142.48 while EUR/JPY is on track for the highest close since 2015 around 144.5. The Swedish krone outperforms today. The currency gains to EUR/SEK 10.63 after yesterday’s parliamentary elections ushered in a shift to the right. Preliminary results aren’t due until Wednesday, but with 95% of the votes counted, the rightwing opposition bloc is set to gain the slimmest edge of 175 seats of the 349 up for grabs. Sterling came under pressure after disappointing industrial production numbers early this morning. EUR/GBP went for a test of the 0.8721 resistance level (June ‘22/April ‘21 high) but was unable to push through, triggering some return action lower. The duo is hovering around opening levels of 0.867. UK markets have a lot of additional data to digest later this week, including the labor market report, inflation data and retail sales. Core bonds are better bid despite the aggressive ECB and Fed talk late last week and over the weekend. It suggests that currently enough central bank hawkishness has been priced in. US yield changes range from -1.1 bps (30y) to -3.9 bps (5y) as markets go into tomorrow’s widely watched CPI release (August). Bunds marginally outperform. Yields drop 2.4-5 bps with the belly of the curve (5y, 10y) receiving the best bids.
News Headlines
Monthly Czech inflation dynamics slowed from 1.3% M/M in July to 0.4% M/M in August with the Y/Y-comparison slightly decelerating from 17.5% to 17.2%. The headline data hide a stronger underlying, broad-based inflationary trend as a 9.8% M/M decline in transport prices (mainly fuel) blurred the picture. Prices of overall goods in total went up by 0.2% M/M and prices of services by 0.8% M/M. Markets believe that the Czech National Bank will use today’s inflation print to keep its side-lined approach for the time being. Czech swap rates decline by 30 to 40 bps across the curve. Czech money markets almost completely priced out the possibility of a 25 bps rate hike at the September 29 CNB-meeting. CNB governor Michl said after the inflation release that it was below the CNB’s internal forecast (17.7%) which could imply a lower inflation peak than feared. He labelled them as “finally some good news”. CNB vice-governor Mora, part of the hawkish minority in the CNB, still believes that some more tightening is needed. EUR/CZK holds relatively stable around 24.60 with the CNB still intervening to prevent a further, unwarranted, weakening.
Bloomberg reports about a draft plan by the European Commission following last week’s inconclusive summit by EU energy ministers to help tackle the energy crisis. It includes an exceptional and temporary contribution on companies in oil, gas, coal and refinery industries based on their taxable surplus profits in the fiscal year 2022. It will also propose two targets on power demand reduction: an objective to cut overall consumption and a mandatory goal on lowering demand during selected peak hours. The plan would also cap excessive revenue of companies producing power from sources other than gas through a limit on the price of electricity generated from technologies such as renewables, lignite or nuclear energy.
US Inflation Could Slow Again in August But Not Enough to Appease the Fed
The latest CPI inflation data will be scrutinized on Tuesday (12:30 GMT) as it will be the last before the Fed’s September policy meeting. Last month’s report offered the first hope in months that price pressures have started to abate, but Fed policymakers were quick to dash expectations that this would equate to an immediate shift in policy towards a more dovish path. Another consideration for the Fed will be Thursday’s retail sales figures as the series of rate hikes have yet to significantly dampen consumer spending. The US dollar has gotten off to a softer start to the week ahead of the data, amid speculation that September’s rate rise will be the last three-quarter point move.
Inflation seems to be on the way down
There was widespread relief when America’s consumer price index stood flat in July, marking the slowest monthly change since May 2020 when the economy was just coming out of lockdown. On a year-on-year basis, CPI rose by 8.5%, slowing from June’s four-decade peak of 9.1%. Much of the slowdown was attributed to the drop in gasoline prices that came on the back of the decline in crude oil prices during the summer. However, prices either fell or grew at a weaker-than-expected rate in other categories too, in an encouraging sign that inflation may finally be peaking on a broader level.
Fed wants to see more evidence
Not so fast, says the Fed. Far from even acknowledging that the inflation picture could now be at a turning point, policymakers have been unequivocal in their message that they need to see several months of moderating price pressures before easing up on rate hikes. Even then, interest rates would be held steady rather than cut until inflation is on a clear path towards the Fed’s 2% target.
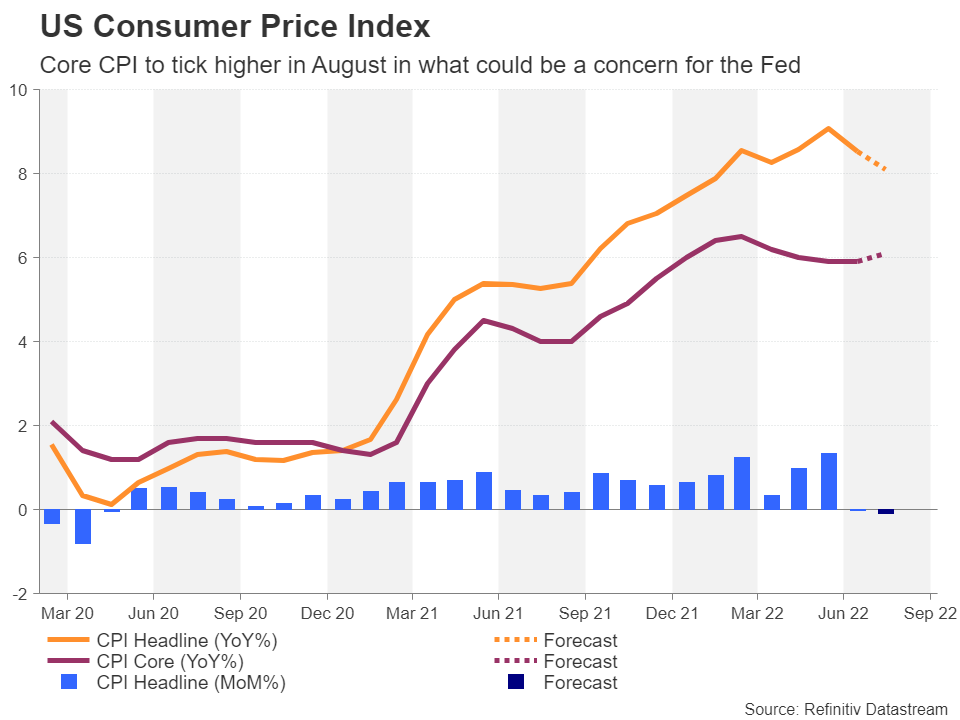
They may be right. Whilst the headline rate of CPI is expected to have fallen by 0.1% month-on-month in August, pulling the yearly print further down to 8.1%, the core measure is projected to have headed in the wrong direction. When stripping out the effects of food and energy prices, CPI is forecast to have accelerated from 5.9% to 6.1% y/y in August. On a monthly basis, core CPI is expected to have increased by 0.3%, the same pace as in the prior month.
Consumption boom may have run out of steam
Looking at the forecasts for the upcoming retail sales numbers, there could be cause for concern about consumers finally feeling the squeeze from skyrocketing prices. Retail sales are expected to show no growth for the second straight month in August, having risen at each month this year prior to July.
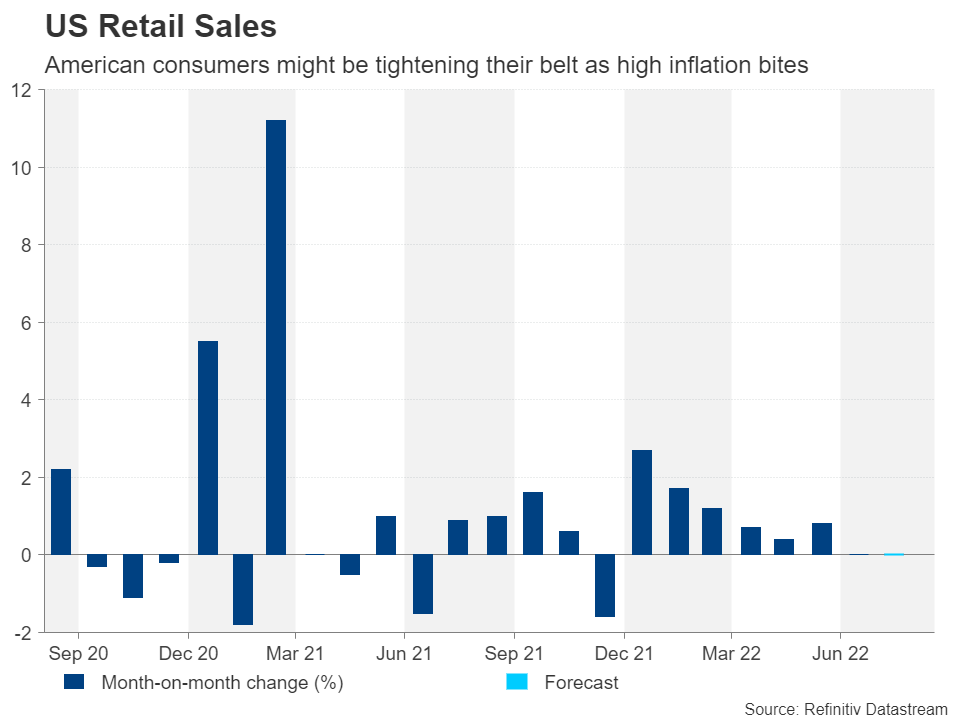
But again, this isn’t likely to be a deal-breaker for the Fed just yet. In fact, reducing consumption and cooling the hot labour market are exactly what policymakers want to achieve right now as this would help in their drive to ease inflationary pressures. The jobs market in particular is far too tight still. Add to that the disappointment that financial conditions haven’t tightened substantially enough despite all the hawkish language, there can be few doubts that the Fed means it when it says the job is not done yet.
Has the dollar lost its shine?
Market odds of a 75-basis-point rate hike in September have subsequently gone up to around 90%, but investors are already anticipating that the Fed will slow down after that. This may not be good news for the dollar, which has retreated from more than two-decade highs, both against the Japanese yen and against a basket of currencies.
Dollar/yen reached a 24-year high of just under 145 last week and this level is likely to again act as resistance in any renewed upward attempt as it coincides with the 161.8% Fibonacci extension of the July-August downleg. But even if that hurdle is cleared, the road to the critical 150 level will be difficult as the high of 147.63 from 1998 and the 200% Fibonacci of 148.39 stand in the way.
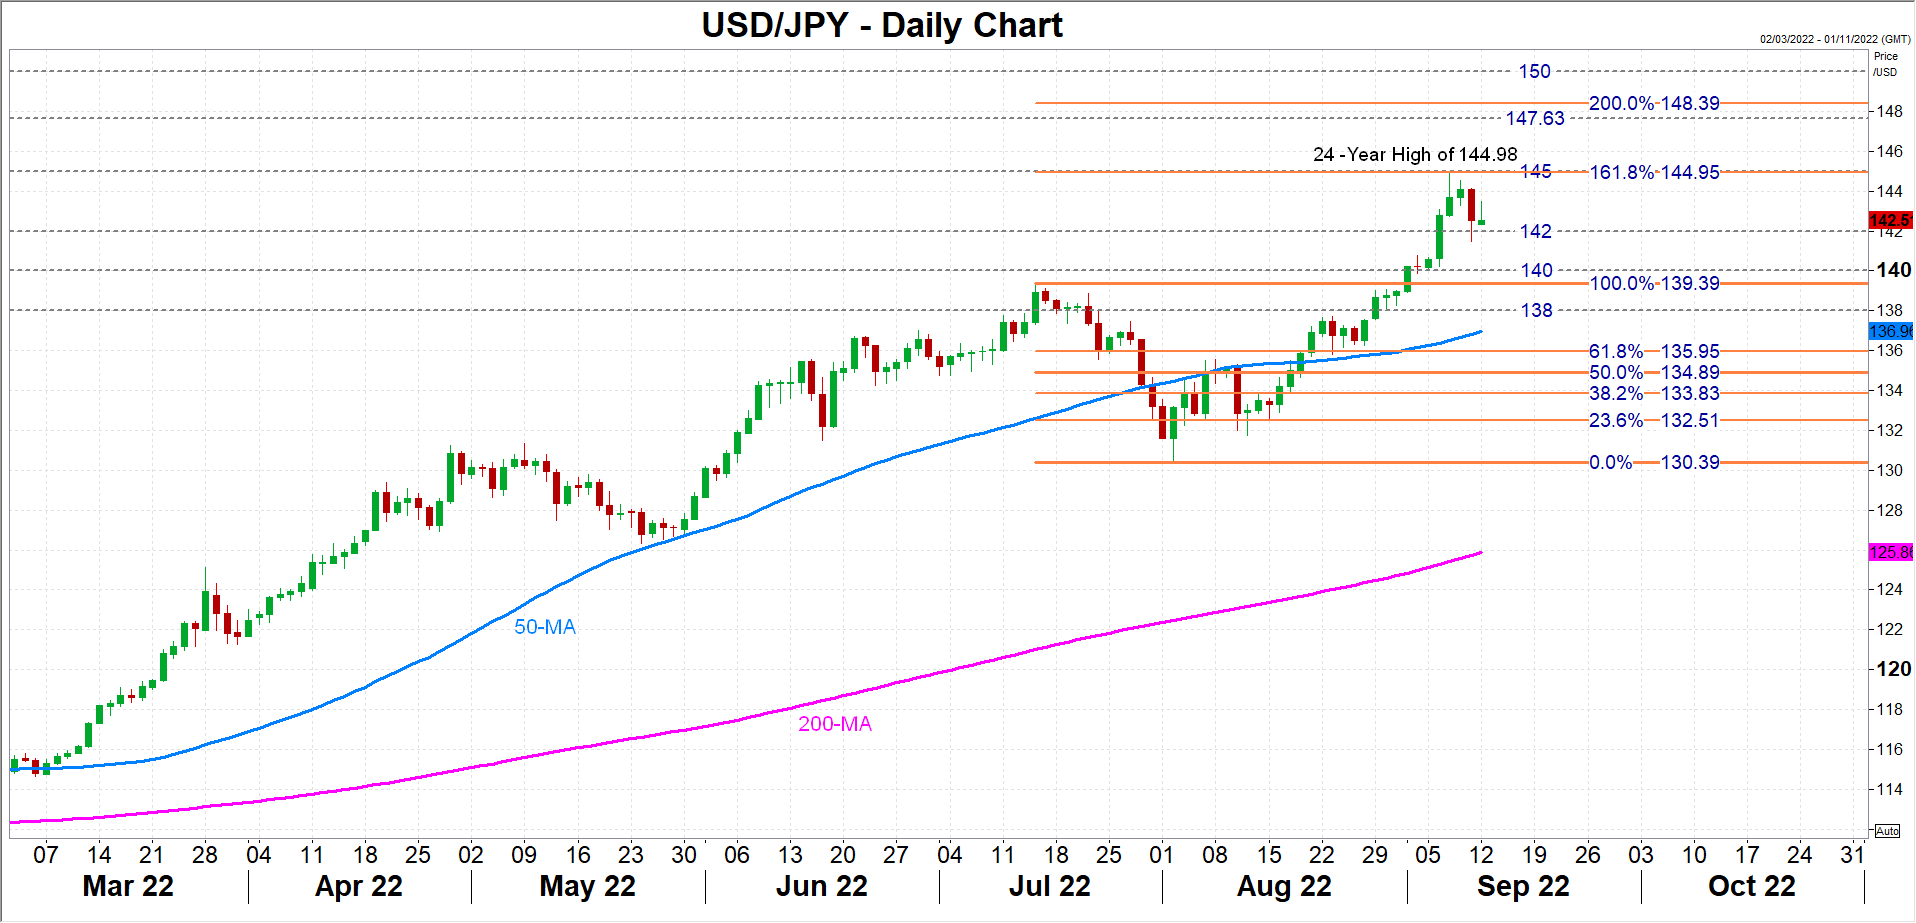
To the downside, the obstacles are similarly crowded, with the 142 and 140 being the nearest support areas.
All eyes on the next FOMC decision
If the August inflation report turns out to be surprisingly soft again, it’s bound to keep the greenback in consolidative mode, at least until the next FOMC decision due on September 21. Against other currencies such as the euro, the dollar could even deepen its pullback.
However, the real test will be what Chair Powell signals about the future pace of rate increases next week, whether he will confirm the market belief that the Fed will go into lower gear after September. So although it’s unlikely that the CPI data will have much bearing on the size of the September rate hike, another soft report could persuade Powell & Co. to consider toning down their hawkish rhetoric.
USDJPY Corrects Lower But Stays in Broader Uptrend
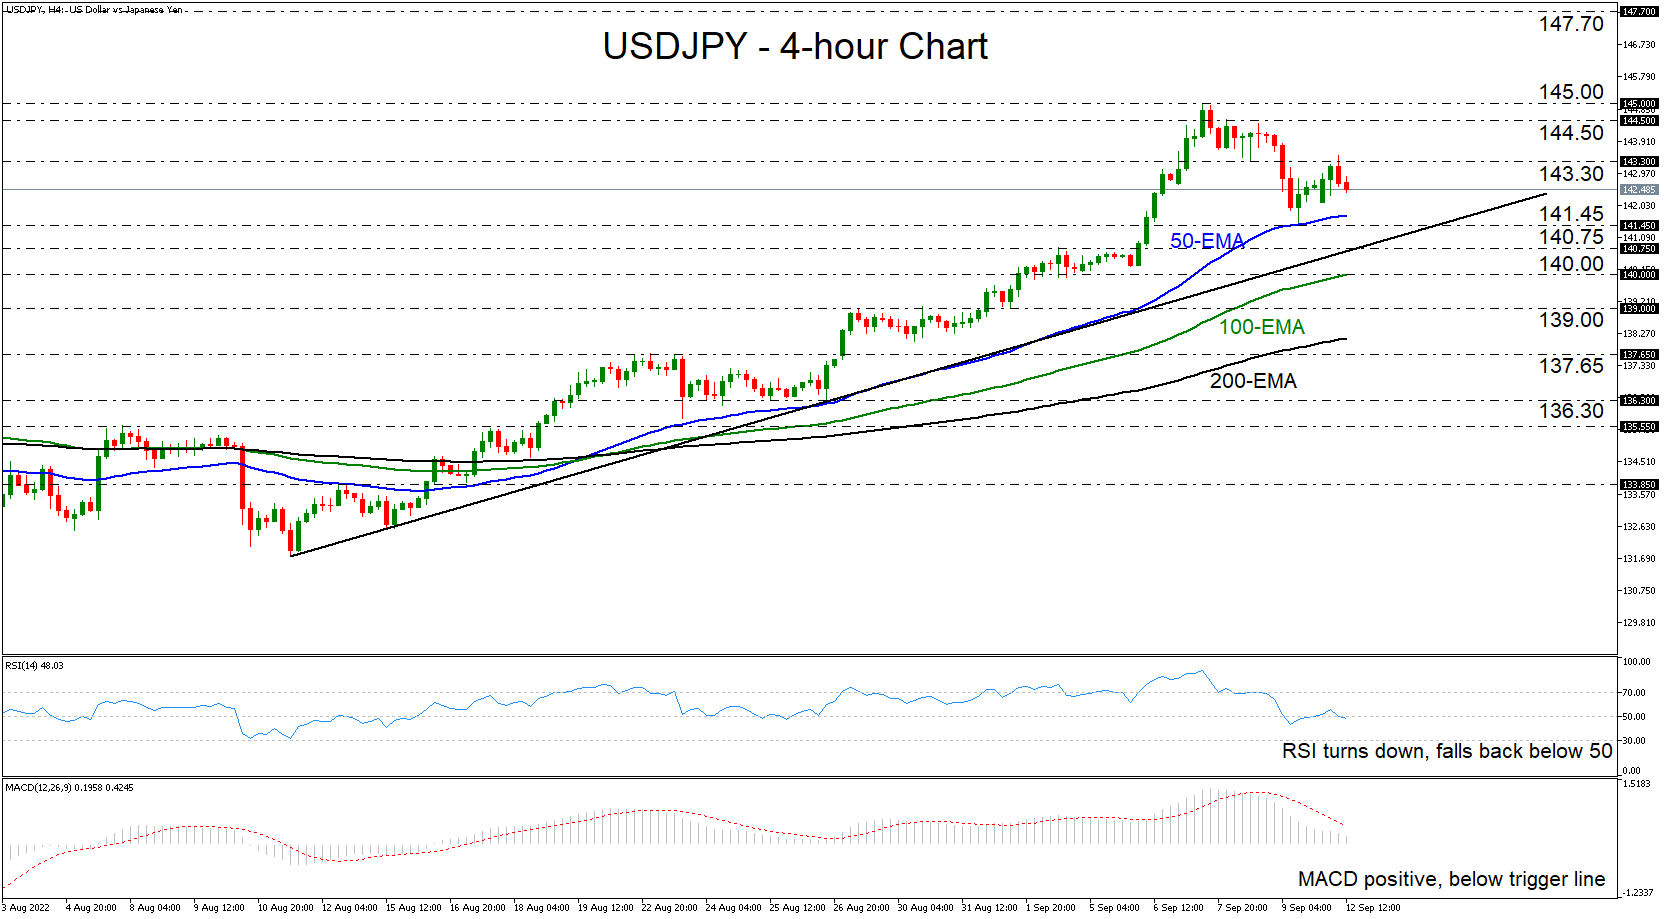
USDJPY traded higher today, after hitting support at 141.45. However, the recovery remained limited slightly above the 143.30 level, marked by the inside swing low of September 8. Despite the pair being in a corrective phase since September 7, when it hit 145.00, it is still trading above all the plotted moving averages and the uptrend line drawn from the low of August 11, which keeps the bigger picture positive.
The RSI and the MACD support the notion for some further retreat before the next leg north. The former turned down and just dipped its toe below the equilibrium 50 line, while the MACD, although slightly positive, lies below its trigger line.
The retreat may continue for a while more and the bulls may take charge from near the 141.45 area or the uptrend line. If so, a potential rebound could allow another test near the 144.50 or 145.00 zones, marked by the highs of September 8 and 7 respectively. A break higher would confirm a new 24-year high and may carry larger bullish implications, perhaps paving the way towards the peak of August 1998 at 147.70.
Flipping the coin, the picture could start darkening upon a dip below the round figure of 140.00, hit as a resistance on September 2. Such a dip may confirm the break below the upside line and initially aim for the 139.00 zone, marked by the inside swing highs of August 29 and 30. If that zone doesn’t hold either, its break may set the stage for extensions towards the inside swing highs of August 22 and 23, at around 137.65.
All in all, USDJPY has been in a corrective phase since September 7, but the price structure still points to a bigger uptrend. On that account, the chances of the bulls taking the reins again and aiming for a new 24-year high may be more than decent.
Gold Forms a Reversal
Gold dynamic reverses smoothly on the daily charts, setting up a double-bottom formation.
Gold is forming a local uptrend after touching the lows near $1680 at the very beginning of the month. The daily charts show that the area near $1700 attracts buyers.
Notably, the trend reversal in gold occurred a couple of days earlier than in the currency market. This ability to swim against the current indicates solid underneath demand.
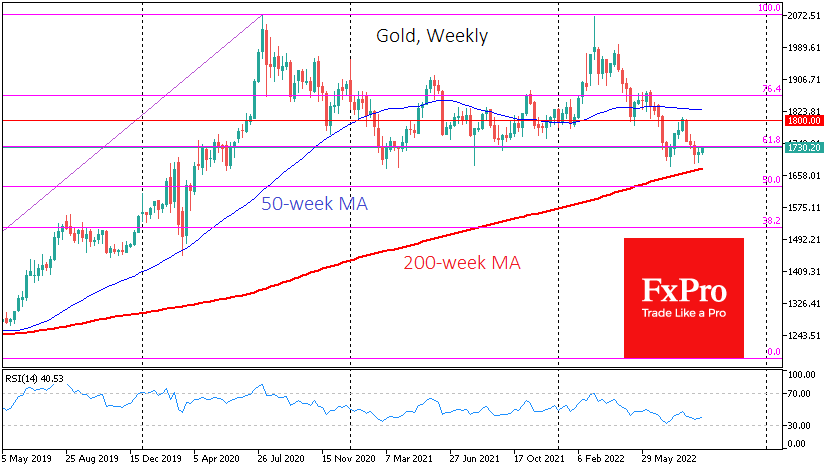
Steady buying in gold broke the trend near the same levels as in July. At the same time, the RSI index in the daily charts set higher lows than two months ago. This divergence between the index and the price signals that the sell-off intensity is diminishing. At the same time, the index came out of the oversold zone, further indicating that the bulls are taking the local initiative.
However, so far, we see a local tug of war. Gold needs to overcome several markers to talk about a more global trend change.
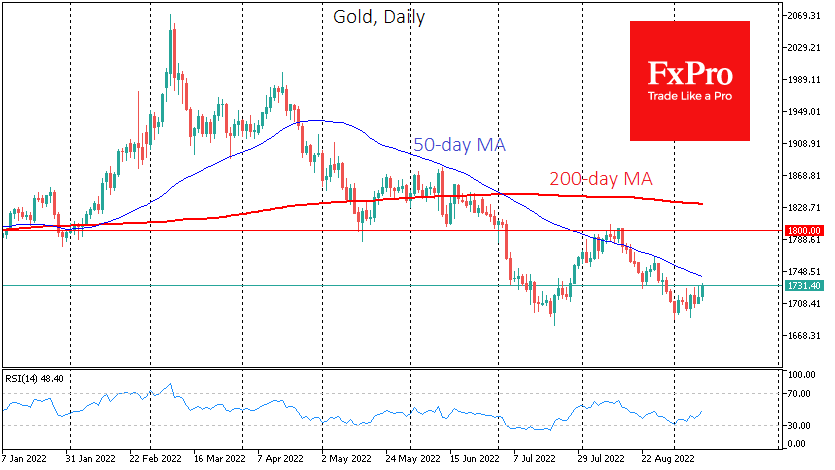
The first test of gold’s bullish reversal would be in the cross of the 50-day moving average near the $1740 area. Since April, bears got the upper hand after the price nears this line, so now we are looking at how the price will behave there.
Silver, the gold’s little sister, gained more than 3.5% on Monday and got well above its 50-day average. This is an additional bullish indicator of a reversal in market sentiment.
Should the bulls succeed locally, the next significant hurdle will be $1800, a psychologically significant round level and a local August peak. A consolidation above this level would confirm the formation of a “double bottom” and the completion of the downward momentum. In this case, the gold will open the road towards $1920-1970.
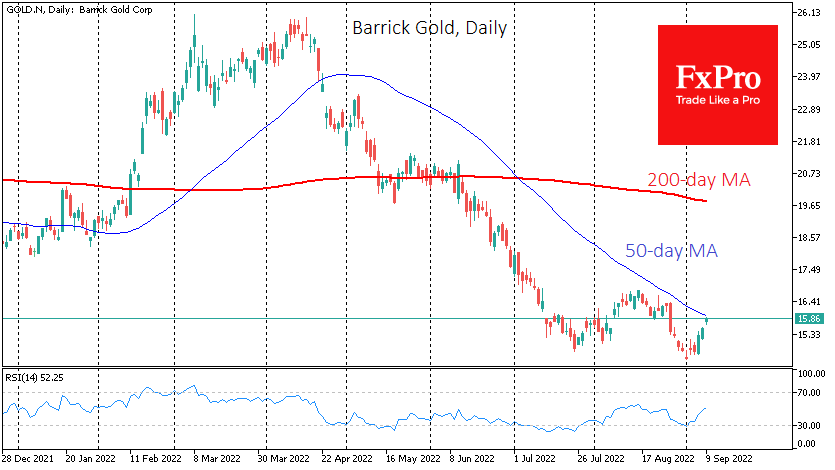
Outside the chart analysis, seasonality is also on the side of the gold, as the long-term trend reversal is in progress during August-September. Separately, we note the increase in trading volumes and impressive growth in equities in the sector. Barrick Gold shares added more than 9% to their lows at the start of September, while the smaller gold producer ETF has gained 10.5% over the same time frame.
Euro Climbs to 3-Week High
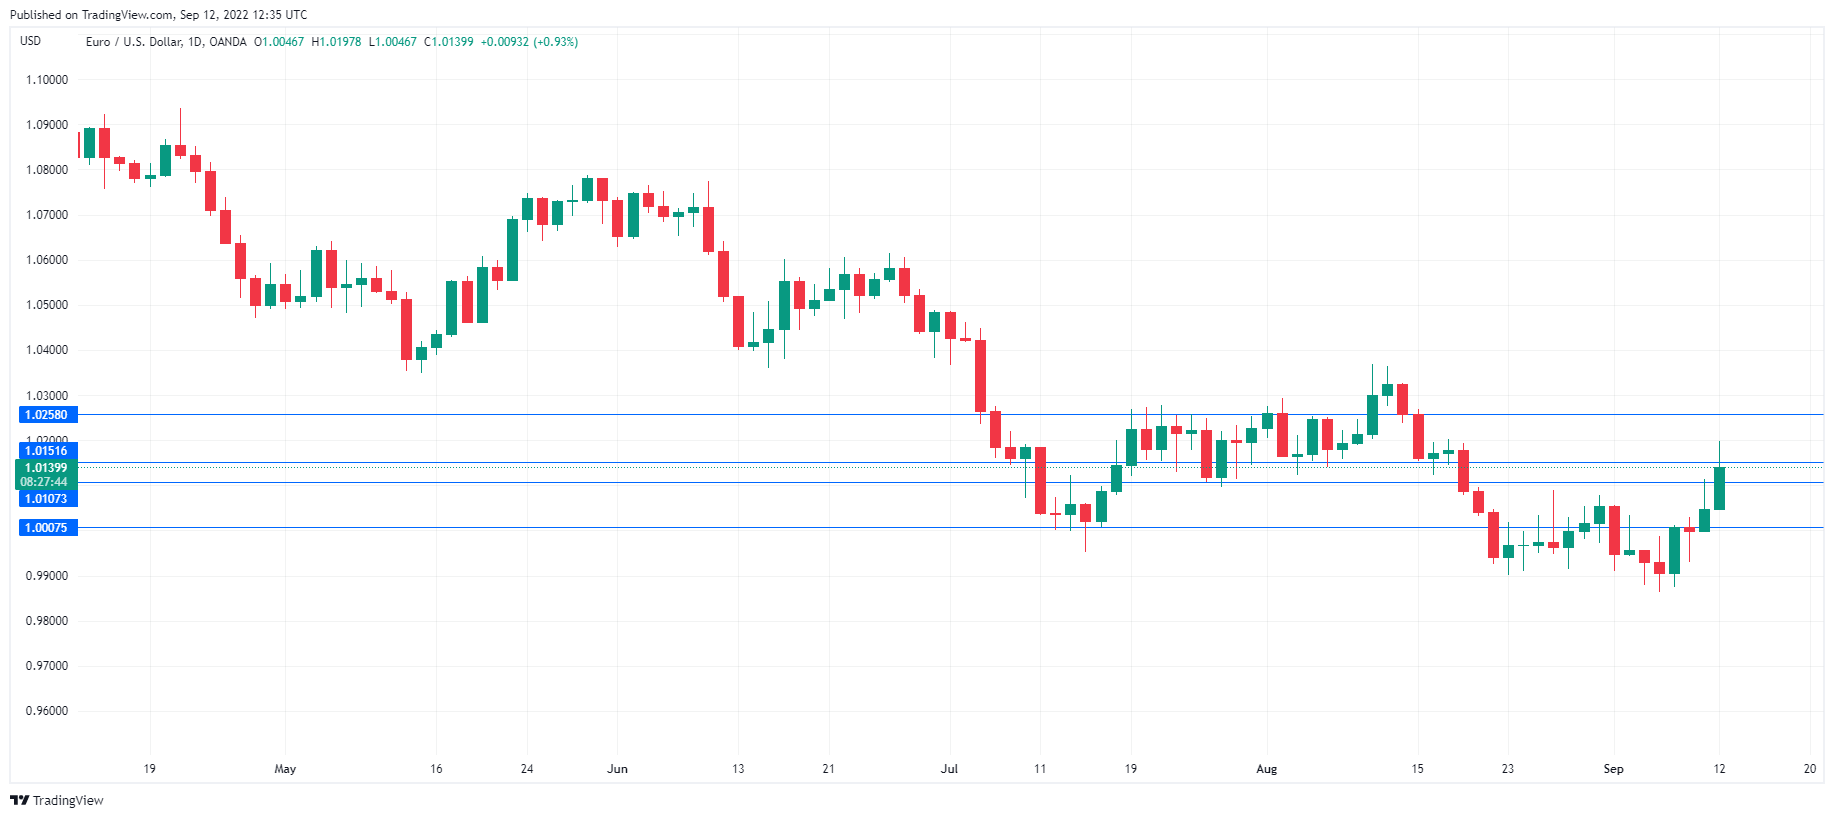
The euro is red hot, having gained close to 2% in just two days. EUR/USD is trading at 1.0144, up 0.97% on the day.
ECB gives euro boost
The ECB showed last week that its hawkishness was not limited to words, as the central bank delivered a massive 0.75% rate hike, for only the second time in its history. The markets are paying attention, and the move has triggered an impressive rally by the euro. The ECB sent a powerful message that it is committed to curbing inflation by raising rates, even at the risk of a recession. President Christine Lagarde said at the meeting that she expected three or four more hikes, and the markets have priced in 0.50% increases at the October and December meetings.
The economic outlook in the eurozone remains grim, with PMIs pointing to weakness in manufacturing and business activity. Russia has shut down the Nord Stream 1 pipeline which supplies gas to Germany, raising fears that the eurozone countries could face an energy shortage this winter. It should not come as a surprise that confidence levels are weak. The ZEW Economic Sentiment index remains mired in a deep freeze, and slowed to -60.0 in July, down from -55.5 in September.
Has US inflation peaked? We’ll get a look at US CPI for August, with the markets expecting inflation to fall to 8.1%, down from 8.5% in July. Following the unexpected drop in July’s inflation release, market exuberance that the Fed would make a U-turn on its aggressive tightening sent the equity markets up and the US dollar sharply. The Fed has remained consistent with its stance and the markets appear to have internalized that the tightening cycle has some more room to run. The markets have priced in a 75 basis point hike at the meeting on September 21st. Tuesday’s inflation report will be doubly important, as it marks the final economic release before tomorrow’s meeting. If inflation hits 8.1% or higher, it would likely cement a 75bp move by the Federal Reserve.
EUR/USD Technical
- EUR/USD has support at 1.0107 and 1.0008
- There is resistance at 1.0152 and 1.0257
USD/JPY Mid-Day Outlook
Daily Pivots: (S1) 141.34; (P) 142.73; (R1) 143.96; More...
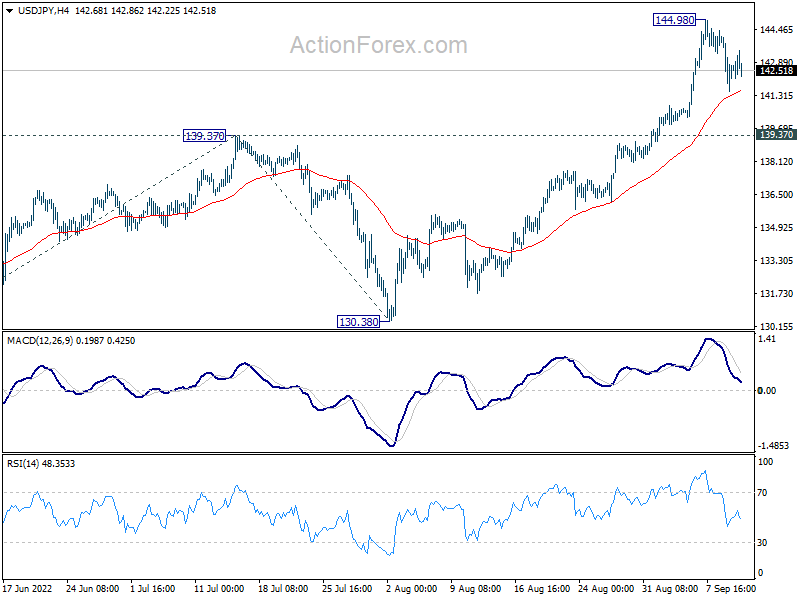
Intraday bias in USD/JPY stays neutral as consolidation from 144.98 is extending. Downside of retreat should be contained by 139.37 resistance turned support. On the upside, break of 144.98 will resume larger up trend to 147.68 long term resistance. Break there will target 161.8% projection of 126.35 to 139.37 from 130.38 at 151.44 next.
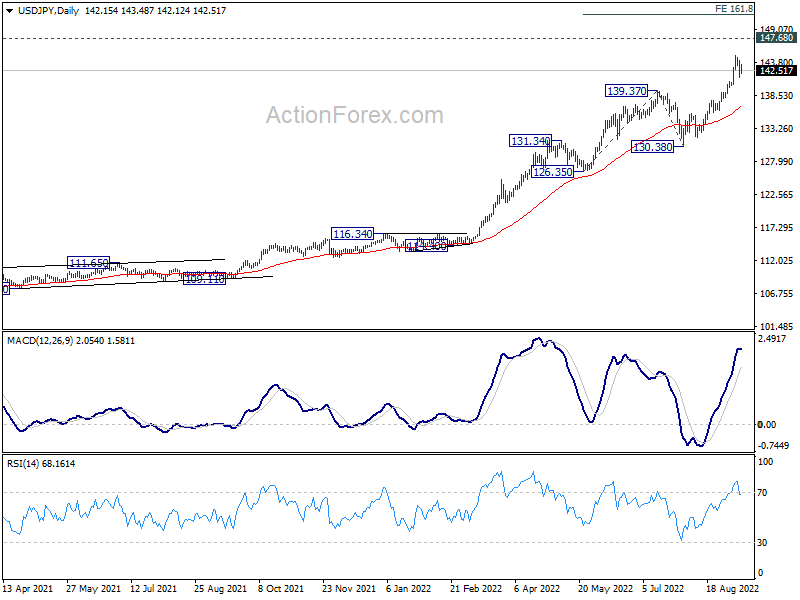
In the bigger picture, up trend from 101.18 is still in progress, as part of the whole up trend from 75.56 (2011 low). Further rise should be seen to 147.68 (1998 high). For now, break of 130.38 support is needed to be the first indication of medium term topping. Otherwise, outlook will stay bullish even in case of deep pull back.
USD/CHF Mid-Day Outlook
Daily Pivots: (S1) 0.9528; (P) 0.9621; (R1) 0.9694; More...
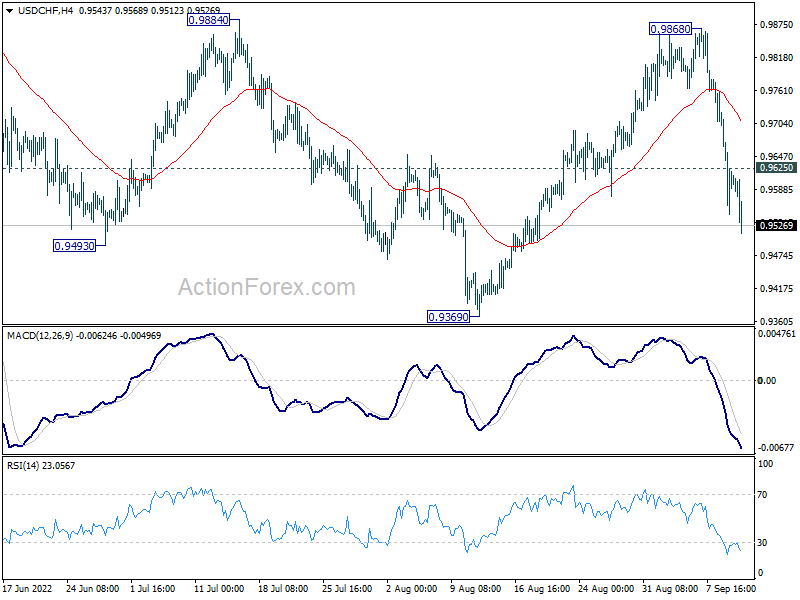
USD/CHF's fall from 0.9868, as a leg inside the correction pattern from 1.0063, is still in progress. Intraday bias stays on the downside for 0.9369 support next. On the upside above 0.9625 minor resistance will turn intraday bias neutral first.
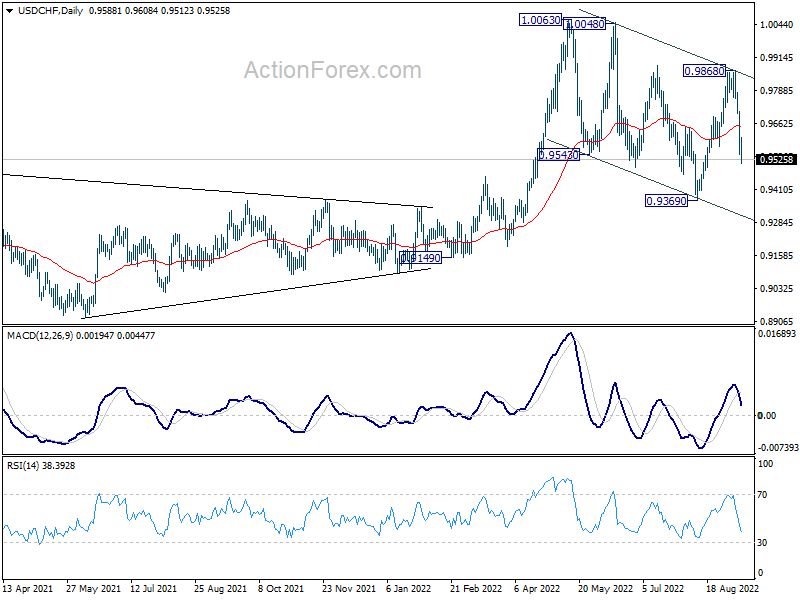
In the bigger picture, current development suggests that up trend from 0.8756 (2021 low) is still in progress. Sustained break of 1.0063 will target 100% projection of 0.9149 to 1.0063 from 0.9369 at 1.0283, and then 1.0342 (2016 high). For now, this will remain the favored case as long as 0.9369 support holds, even in case of deep pull back.
GBP/USD Mid-Day Outlook
Daily Pivots: (S1) 1.1509; (P) 1.1578; (R1) 1.1659; More...
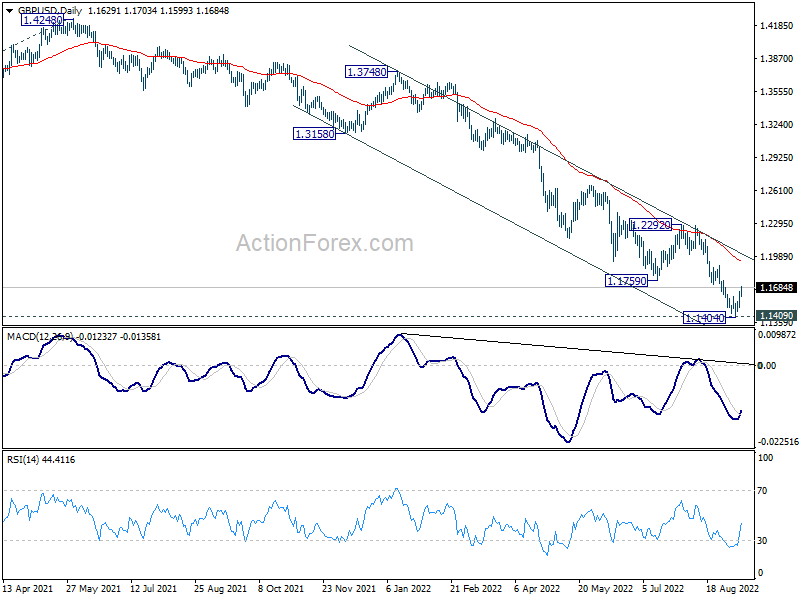
Intraday bias in GBP/USD remains mildly on the upside as rebound from 1.1404 short term bottom is extending. Further rise would be seen to 55 day EMA (now at 1.1942). On the downside, below 1.1550 minor support will turn bias back to the downside. Decisive break of 1.1409 will resume larger down trend.
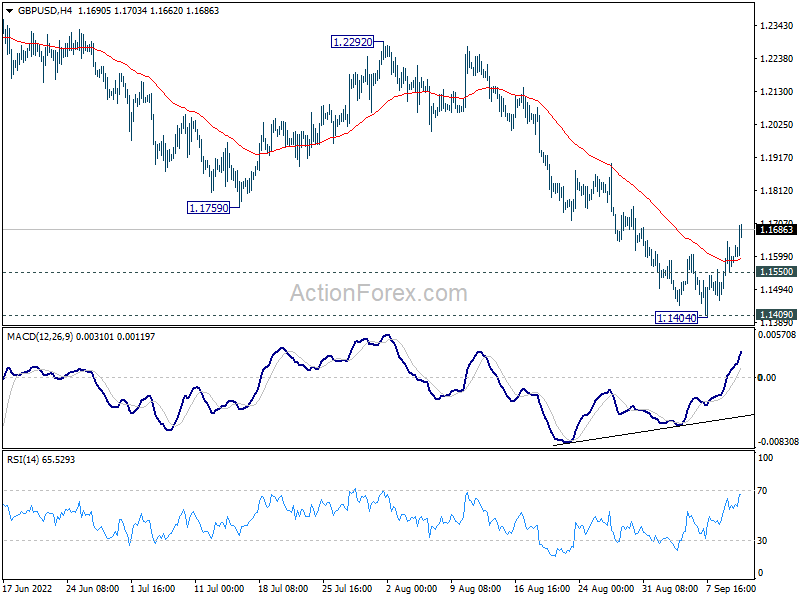
In the bigger picture, based on current momentum, fall from 1.4248 (2018 high) is probably resuming long term down trend from 2.1161 (2007 high). Sustained break of 1.1409 will target 61.8% projection of 1.7190 (2014 high) to 1.1409 (2020 low) from 1.4248 (2021 high) at 1.0675. This will remain the favored case for now as long as 1.2292 resistance holds.
EUR/USD Mid-Day Outlook
Daily Pivots: (S1) 0.9991; (P) 1.0052; (R1) 1.0108; More...
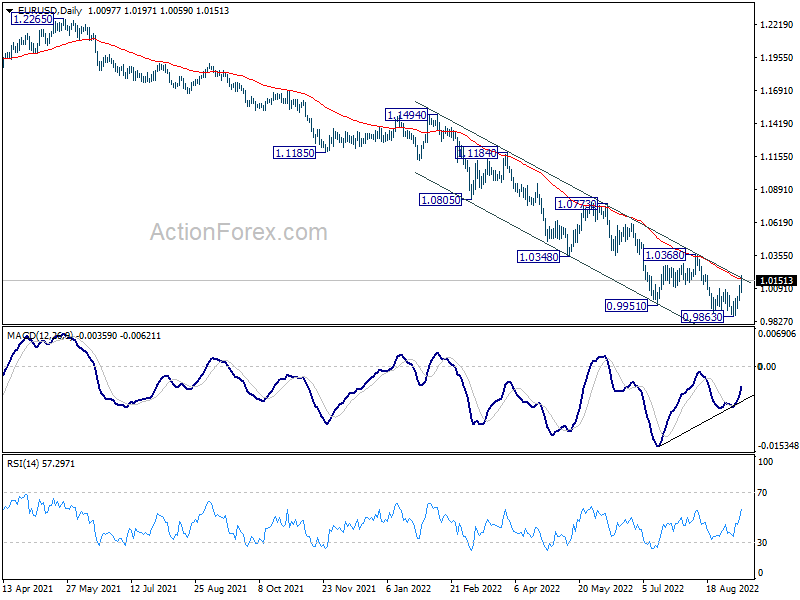
Intraday bias in EUR/USD remains on the upside as rebound from 0.9863 is extending. Sustained trading above 55 day EMA (now at 1.0169) raise the chance of larger trend reversal, and target 1.0368 resistance. On the downside, below 1.0031 minor support will turn bias back to the downside for retesting 0.9863 low.
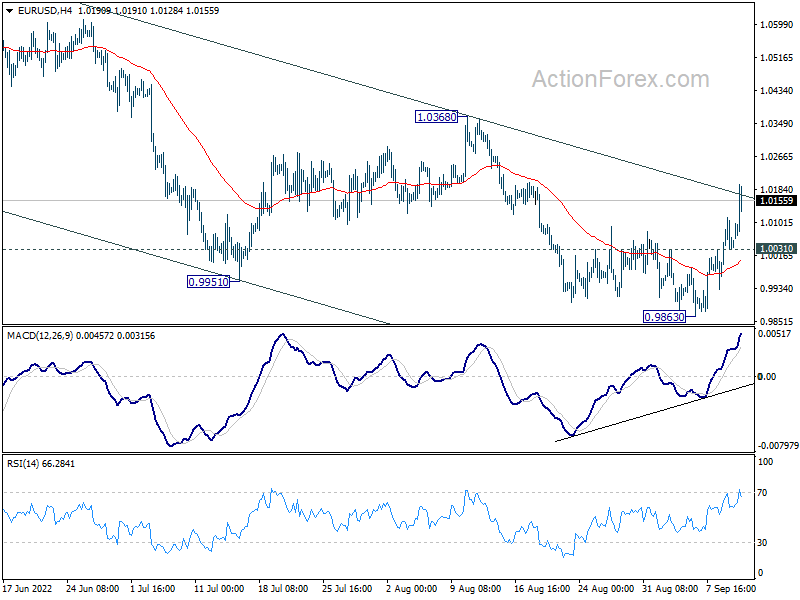
In the bigger picture, down trend from 1.6039 (2008 high) is still in progress. Next target is 100% projection of 1.3993 to 1.0339 from 1.2348 at 0.8694. In any case, outlook will stay bearish as long as 1.0368 resistance holds, in case of strong rebound. However, firm break of 1.0368 will confirm medium term bottom at 0.9863 already.
Euro Leads Sterling and Swiss Franc Higher, Gold Reversing
Euro leads Sterling and Swiss Franc higher today, and stays firm so far. The common currency was apparently lifted by hawkish comments from ECB official over the weekend. Sterling shrugs off slightly worse than expected GDP and production data. Dollar and Yen are currently the weakest ones. Commodity currencies are mixed for now, with Canadian as the softer one.
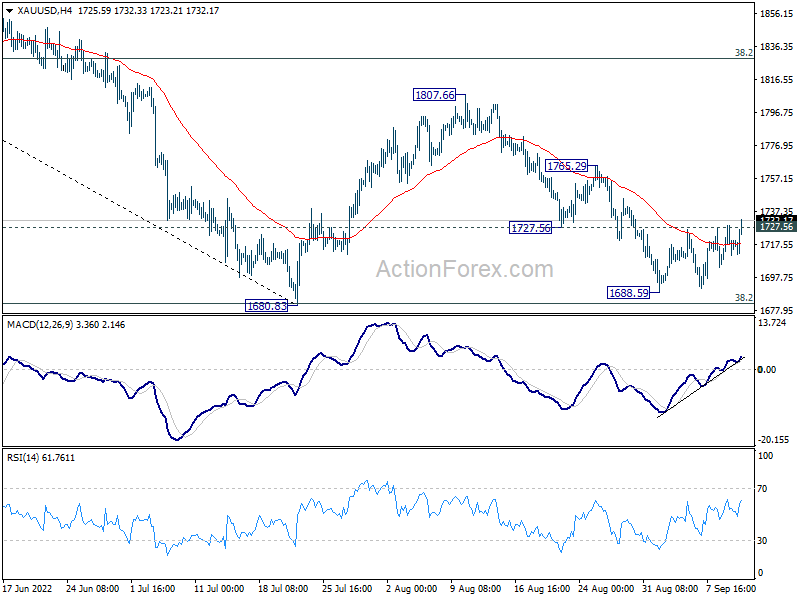
Technically, Gold's break of 1727.56 support turned resistance suggests that fall from 1807.66 has completed at 1688.59. That came after defending 1680 long term support cluster. Rise from 1688.59 could either be the third leg of the pattern from 1680.83, or part of an up trend. In either case, further rise is now in favor to 1765.29 resistance first. Break will affirm near term bullishness and target 38.2% retracement of 2070.06 to 1680.83 at 1825.51.
In Europe, at the time of writing, FTSE is up 1.31%. DAX is up 1.65%. CAC is up 1.33%. Germany 10-year yield is down -0.0459 at 1.655. Earlier in Asia, Nikkei rose 1.16%. Japan 10-year JGB yield rose 0.0001 to 0.251. Singapore Strait Times rose 0.36%. Hong Kong and China were on holiday.
UK GDP grew 0.2% mom in July, services up but production and construction down
UK GDP grew 0.2% mom in July, below expectation of 0.3% mom. Services grew 0.4% mom. Production dropped -0.3% mom. Construction also contracted -0.8% mom. For the three months to July, GDP was flat compared with the previous three months.
Also released, industrial production came in at -0.3% mom, 1.1% yoy, versus expectation of 0.4% mom, 2.0% yoy. Manufacturing production was at 0.1% mom, 1.1% yoy, versus expectation of 0.6% yoy. Goods trade deficit narrowed from GBP -22.8B to GBP -19.4B, versus expectation of GBP -23.2B.
NIESR: UK GDP to contract -0.1% in Q3, remains in recession
NIESR projects UK GDP to contract -0.1% in Q3, with growth slowing as inflation maintains its drag on consumer demand and confidence.
"GDP grew by 0.2 per cent in July following the large fall of 0.6 per cent in June. This was stronger than we had expected and was driven by a rise in services, particularly consumer-facing services, with production and construction continuing to fall. That said, GDP in the three months to July was flat relative to the previous three months and we think the UK economy remains in recession." Stephen Millard Deputy Director for Macroeconomic Modelling and Forecasting, NIESR.
EUR/USD Mid-Day Outlook
Daily Pivots: (S1) 0.9991; (P) 1.0052; (R1) 1.0108; More...
Intraday bias in EUR/USD remains on the upside as rebound from 0.9863 is extending. Sustained trading above 55 day EMA (now at 1.0169) raise the chance of larger trend reversal, and target 1.0368 resistance. On the downside, below 1.0031 minor support will turn bias back to the downside for retesting 0.9863 low.
In the bigger picture, down trend from 1.6039 (2008 high) is still in progress. Next target is 100% projection of 1.3993 to 1.0339 from 1.2348 at 0.8694. In any case, outlook will stay bearish as long as 1.0368 resistance holds, in case of strong rebound. However, firm break of 1.0368 will confirm medium term bottom at 0.9863 already.
Economic Indicators Update
| GMT | Ccy | Events | Actual | Forecast | Previous | Revised |
|---|---|---|---|---|---|---|
| 06:00 | JPY | Machine Tool Orders Y/Y Aug | 10.70% | 5.50% | ||
| 06:00 | GBP | GDP M/M Jul | 0.20% | 0.30% | -0.60% | |
| 06:00 | GBP | Industrial Production M/M Jul | -0.30% | 0.40% | -0.90% | |
| 06:00 | GBP | Industrial Production Y/Y Jul | 1.10% | 2.00% | 2.40% | |
| 06:00 | GBP | Manufacturing Production M/M Jul | 0.10% | 0.60% | -1.60% | |
| 06:00 | GBP | Manufacturing Production Y/Y Jul | 1.10% | 1.70% | 1.30% | |
| 06:00 | GBP | Index of Services 3M/3M Jul | -0.20% | -0.80% | -0.40% | |
| 06:00 | GBP | Goods Trade Balance (GBP) Jul | -19.4B | -23.2B | -22.8B | |
| 08:00 | EUR | Italy Industrial Output M/M Jul | 0.40% | 0.00% | -2.10% | -2.00% |
| 10:22 | GBP | NIESR GDP Estimate Aug | -0.30% | 0.00% |