Sample Category Title
EUR/GBP Daily Outlook
Daily Pivots: (S1) 0.8636; (P) 0.8679; (R1) 0.8708; More...
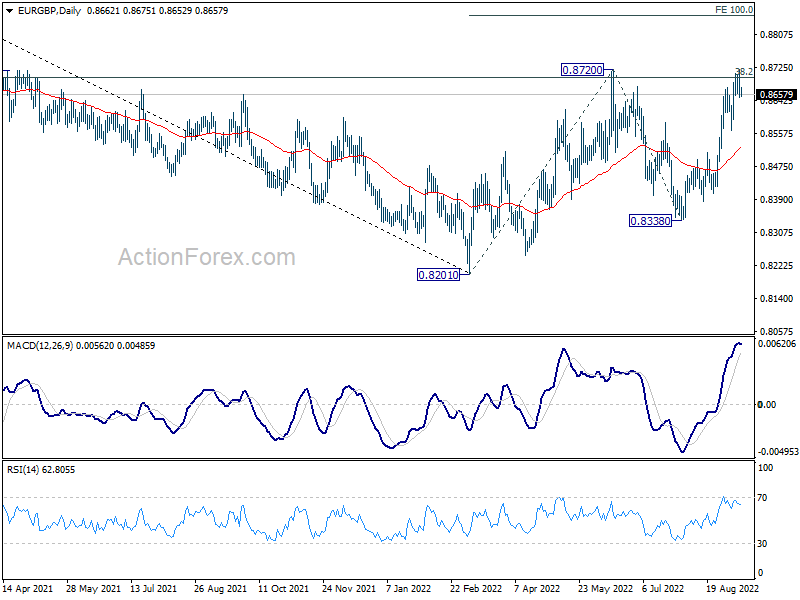
EUR/GBP retreated quickly after edging higher to 0.8721, and intraday bias is turned neutral first. On the upside, firm break of 0.8720 resistance will indicate resumption of whole rise from 0.8201. Intraday bias will be back on the upside for 100% projection of 0.8201 to 0.8720 from 0.8338 at 0.8857. On the downside, however, break of 0.8565 support will indicate rejection by 0.8720 and turn bias back to the downside.
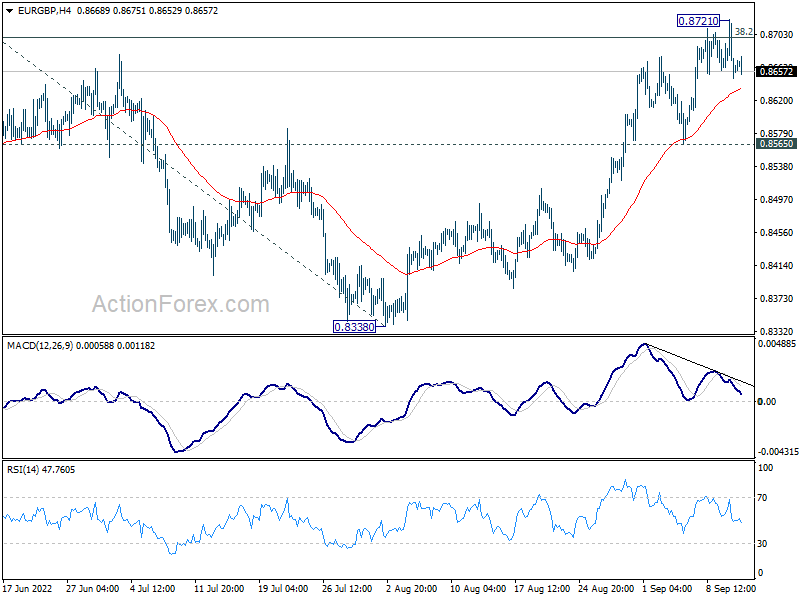
In the bigger picture, focus is back on 38.2% retracement of 0.9499 to 0.8201 at 0.8697. Sustained break there will argue that rise from 0.8201 is a medium term up trend, rather than a correction. Next target is 61.8% retracement at 0.9003. Rejection by 0.8697 again will maintain medium term bearishness, for extending the down trend from 0.9499 (2020 high) at a later stage.
EUR/AUD Daily Outlook
Daily Pivots: (S1) 1.4653; (P) 1.4737; (R1) 1.4782; More...
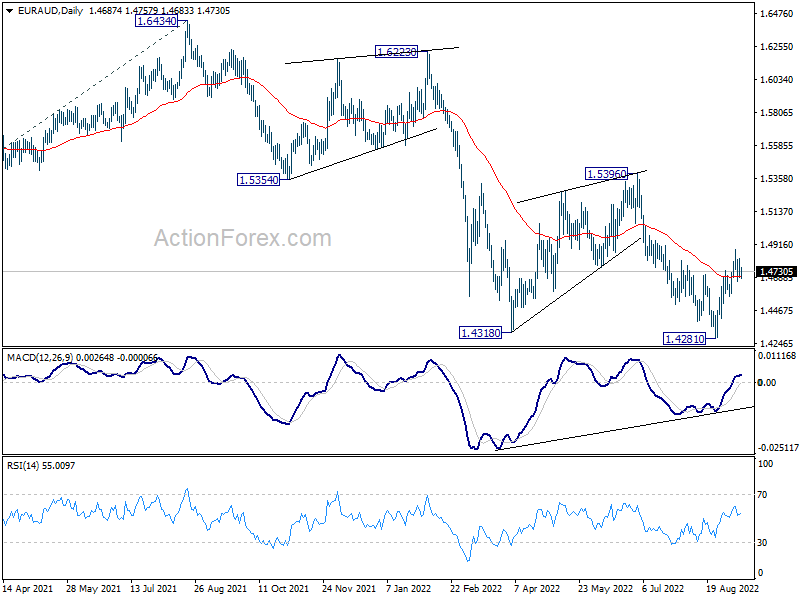
Intraday bias in EUR/AUD stays neutral and outlook is unchanged. On the upside, above 1.4880 will resume the rebound from 1.4281 short term bottom, and target 1.5396 resistance. On the downside, however, break of 1.4564 minor support will turn bias back to the downside for retesting 1.4281 low.
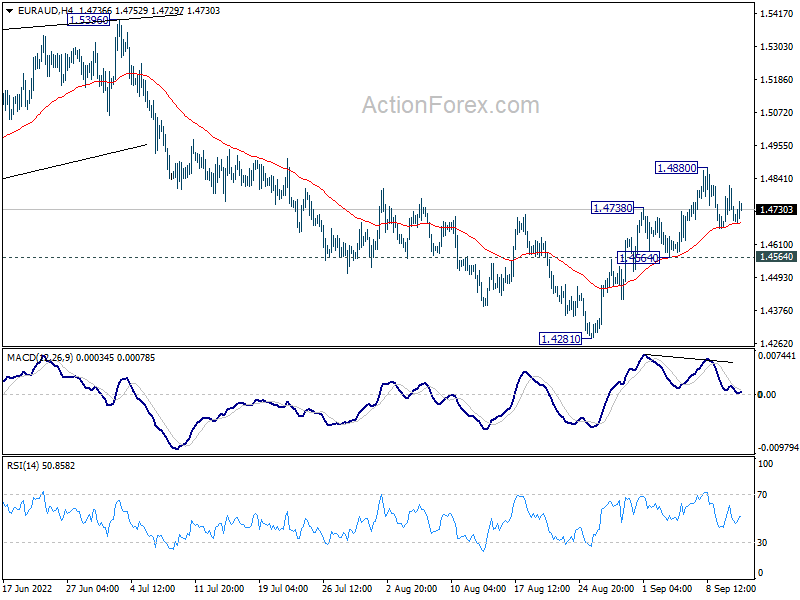
In the bigger picture, down trend from 1.9799 is still in progress. Break of 1.4318 low will target 61.8% projection of 1.9799 to 1.5250 from 1.6434 at 1.3623, which is close to 1.3624 long term support (2017 low). This will remain the favored case now as long as 1.5396 resistance holds.
EUR/CHF Daily Outlook
Daily Pivots: (S1) 0.9611; (P) 0.9679; (R1) 0.9722; More....
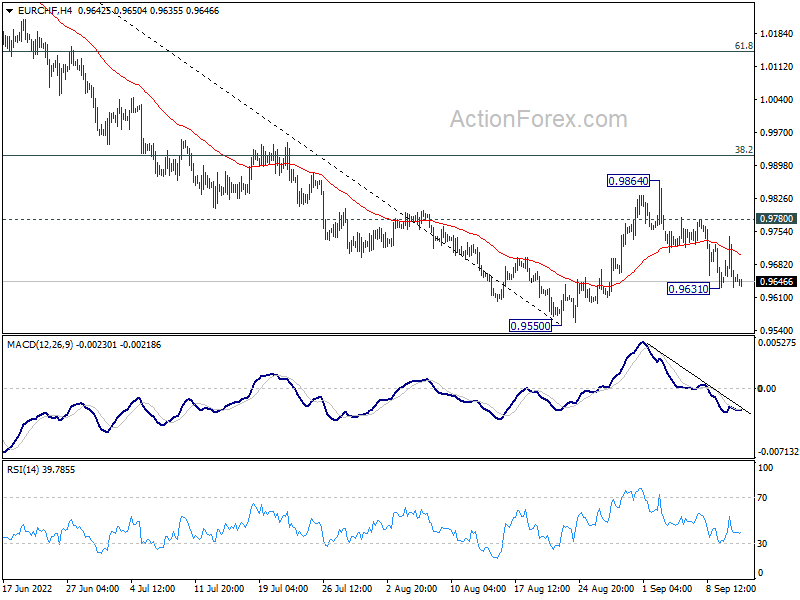
Intraday bias in EUR/CHF remains neutral for the moment. On the downside, below 0.9631 will bring retest of 0.9550 low. Firm break there will resume larger down trend. On the upside, break of 0.9780 minor resistance will argue that corrective rebound from 0.9550 is resuming. Intraday bias will be back to the upside for 38.2% retracement of 1.0512 to 0.9550 at 0.9917.
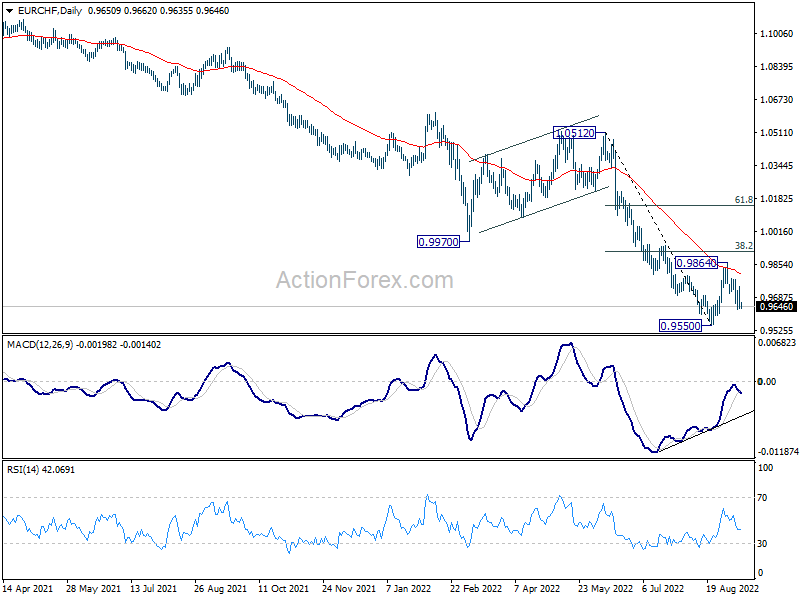
In the bigger picture, long term down trend from 1.2004 (2018 high) is still in progress. Next target is 138.2% projection of 1.2004 to 1.0505 to 1.1149 at 0.9033. On the upside, break of 0.9970 support turned resistance is needed to be the first sign of medium term bottoming. Otherwise, outlook will stay bearish in case of strong rebound.
USD/CAD Daily Outlook
Daily Pivots: (S1) 1.2949; (P) 1.2999; (R1) 1.3035; More...
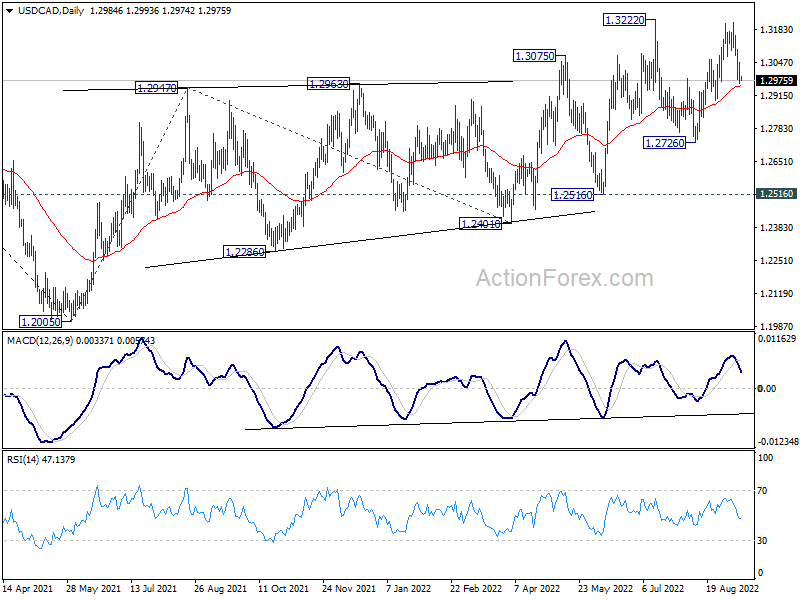
Intraday bias in USD/CAD stays neutral with focus on 1.2971 support. Firm break there will argue that corrective pattern from 1.3222 is extending with another falling leg. Deeper decline would be seen back to 1.2726 support. On the upside, decisive break of 1.3222 will resume larger up trend from 1.2005.
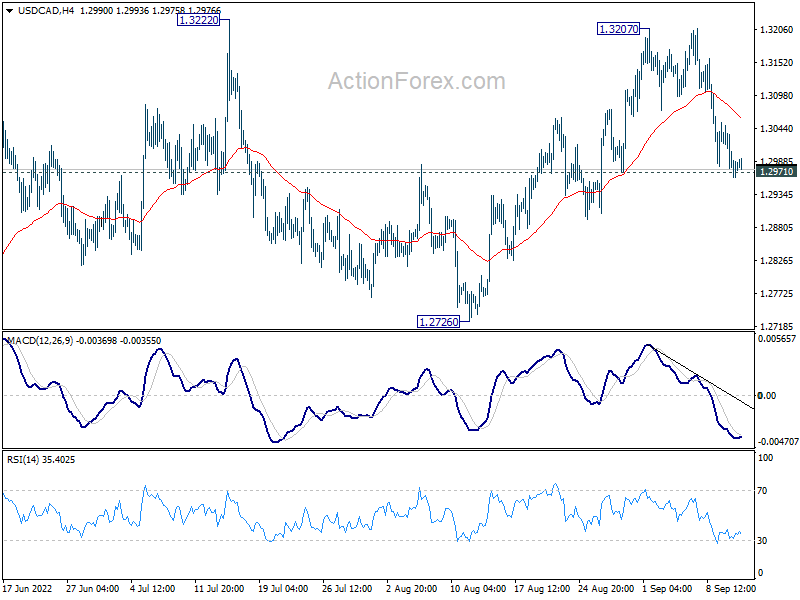
In the bigger picture, down trend from 1.4667 (2020 high) should have completed at 1.2005, after defending 1.2061 long term cluster support. Rise from there should target 61.8% retracement of 1.4667 to 1.2005 (2021 low) at 1.3650. This will remain the favored case now as long as 1.2516 support holds.
AUD/USD Daily Report
Daily Pivots: (S1) 0.6843; (P) 0.6871; (R1) 0.6919; More...
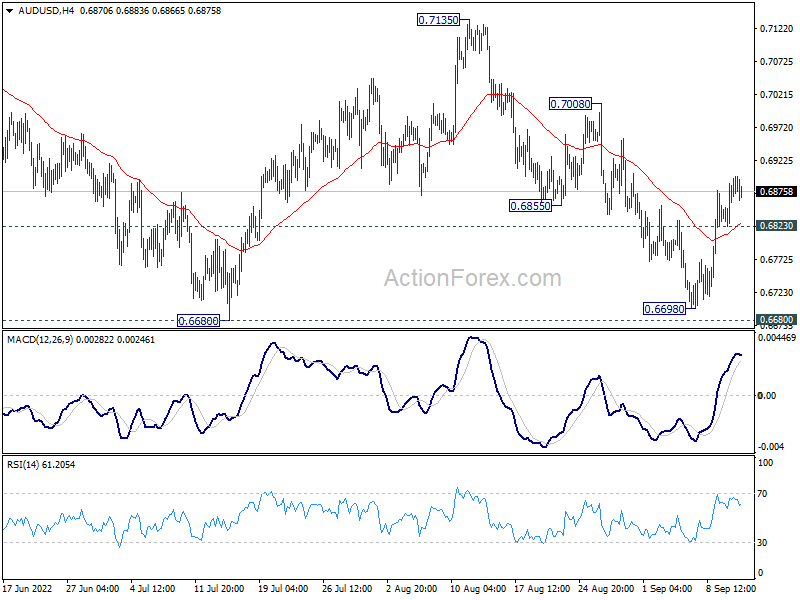
Intraday bias in AUD/USD remains mildly on the upside as rebound from 0.6698 is in progress. Sustained break of 55 day EMA (now at 0.6915). Sustained break there will target 0.7135 resistance next. On the downside, below 0.6823 minor support will turn intraday bias neutral first. Further break of 0.6680 low will will resume larger down trend.
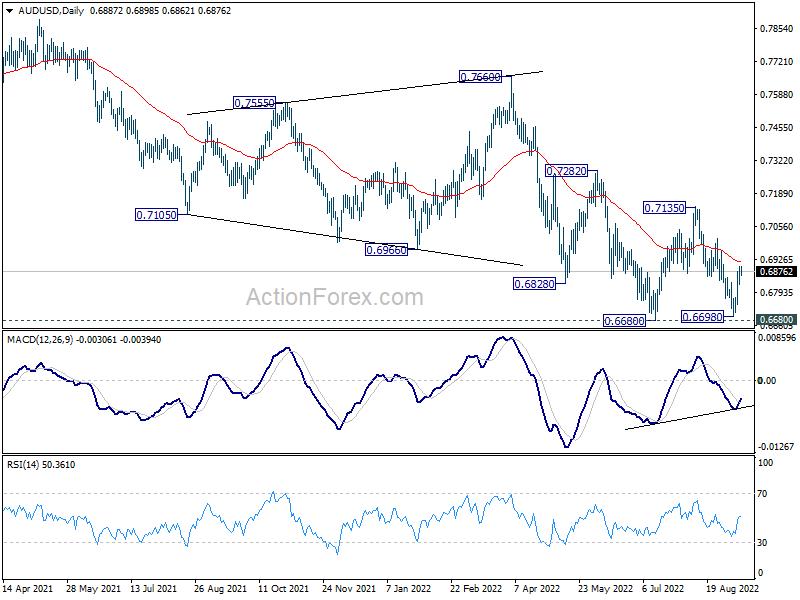
In the bigger picture, price actions from 0.8006 (2021 high) is seen more as a corrective pattern to rise from 0.5506 (2020 low). Or it could also be a bearish impulsive move. In either case, outlook will remain bearish as long as 0.7135 resistance holds. Next target is 61.8% retracement of 0.5506 to 0.8006 at 0.6461.
USD/JPY Daily Outlook
Daily Pivots: (S1) 142.13; (P) 142.81; (R1) 143.52; More...
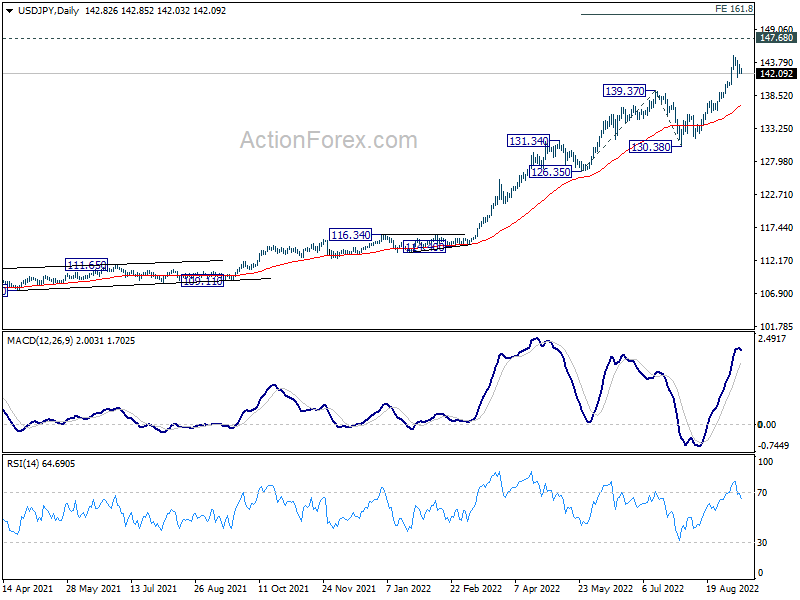
USD/JPY's consolidation from 144.98 is still extending and intraday bias stays neutral for the moment. Downside of retreat should be contained by 139.37 resistance turned support. On the upside, break of 144.98 will resume larger up trend to 147.68 long term resistance. Break there will target 161.8% projection of 126.35 to 139.37 from 130.38 at 151.44 next.
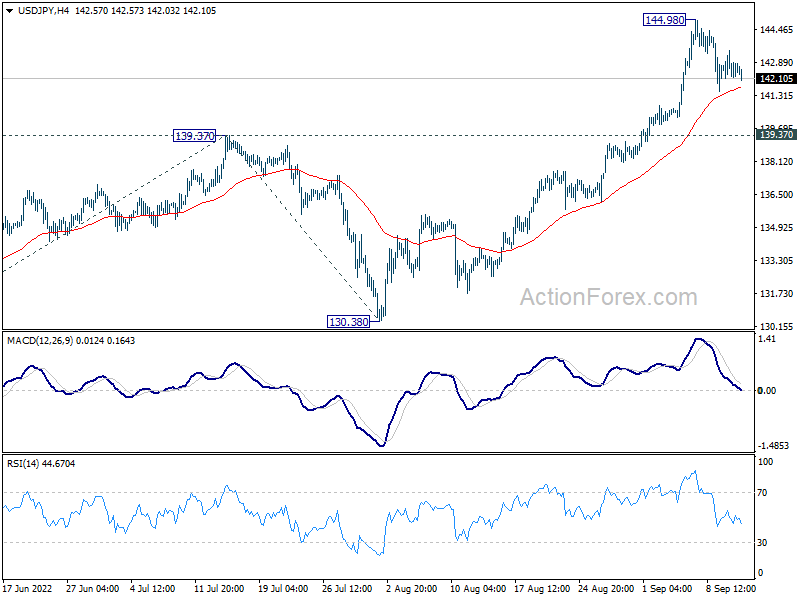
In the bigger picture, up trend from 101.18 is still in progress, as part of the whole up trend from 75.56 (2011 low). Further rise should be seen to 147.68 (1998 high). For now, break of 130.38 support is needed to be the first indication of medium term topping. Otherwise, outlook will stay bullish even in case of deep pull back.
USD/CHF Daily Outlook
Daily Pivots: (S1) 0.9495; (P) 0.9553; (R1) 0.9596; More...
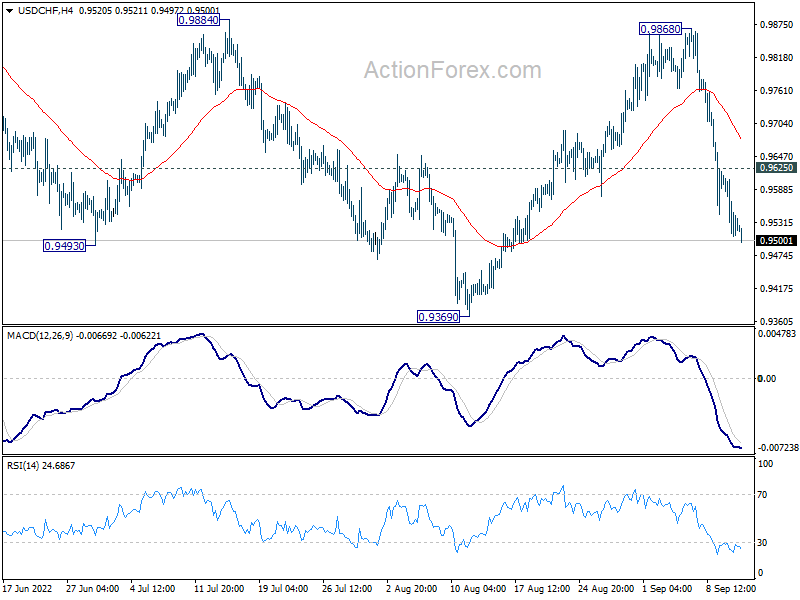
Intraday bias in USD/CHF remains on the downside for the moment. Decline from 0.9868 is seen as a leg in the corrective pattern from 1.0063. Deeper fall would be seen towards 0.9369 support. On the upside above 0.9625 minor resistance will turn intraday bias neutral first.
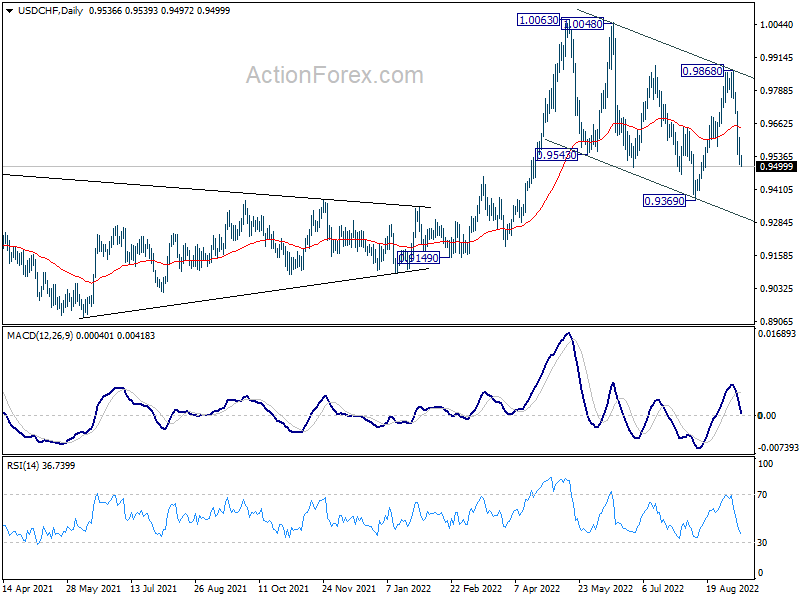
In the bigger picture, current development suggests that up trend from 0.8756 (2021 low) is still in progress. Sustained break of 1.0063 will target 100% projection of 0.9149 to 1.0063 from 0.9369 at 1.0283, and then 1.0342 (2016 high). For now, this will remain the favored case as long as 0.9369 support holds, even in case of deep pull back.
EUR/USD Daily Outlook
Daily Pivots: (S1) 1.0055; (P) 1.0127; (R1) 1.0193; More...
EUR/USD's rebound from 0.9863 is still in progress and intraday bias stays on the upside. Sustained trading above 55 day EMA (now at 1.0169) raise the chance of larger trend reversal, and target 1.0368 resistance. On the downside, below 1.0031 minor support will turn bias back to the downside for retesting 0.9863 low.
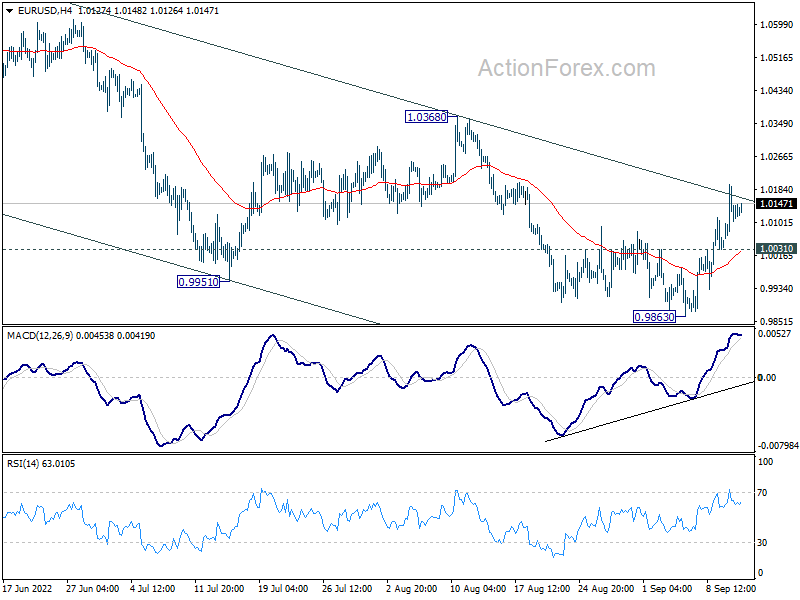
In the bigger picture, down trend from 1.6039 (2008 high) is still in progress. Next target is 100% projection of 1.3993 to 1.0339 from 1.2348 at 0.8694. In any case, outlook will stay bearish as long as 1.0368 resistance holds, in case of strong rebound. However, firm break of 1.0368 will confirm medium term bottom at 0.9863 already.
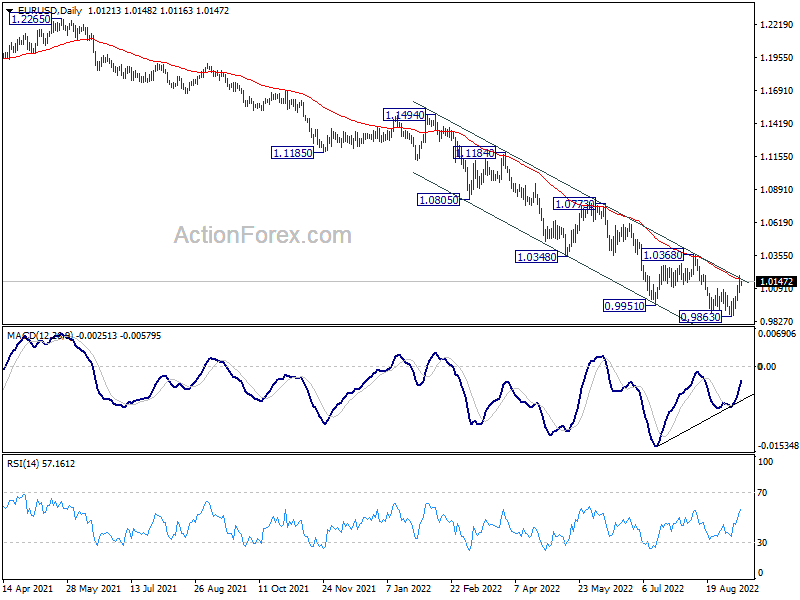
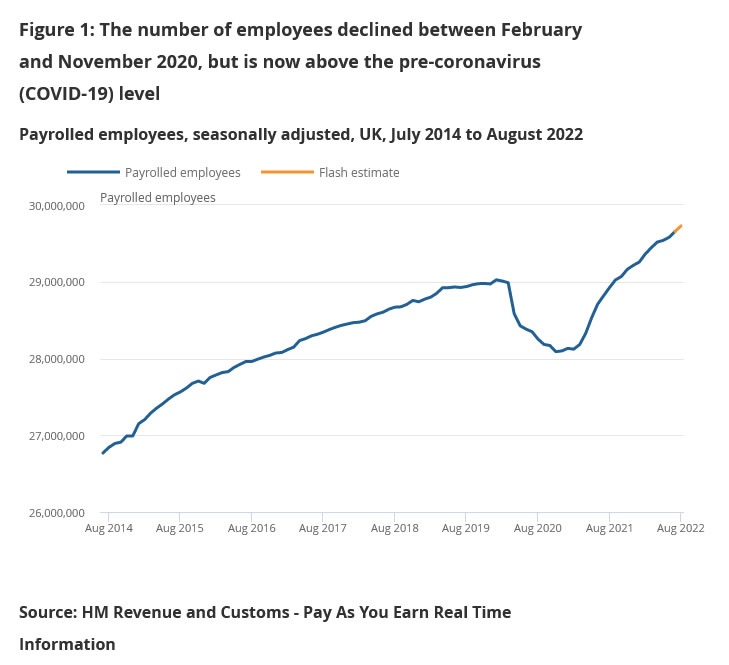
UK payrolled employment rose 71k in Aug, unemployment rate down to 3.6% in Jul
UK payrolled employment rose 71k or 0.2% mom in August. Comparing with the same month a year ago, payrolled employees rose 803k to 2.8% yoy. Monthly pay rose 6.5% yoy. Claimant count rose 6.3k, versus expectation of -9.2k decline.
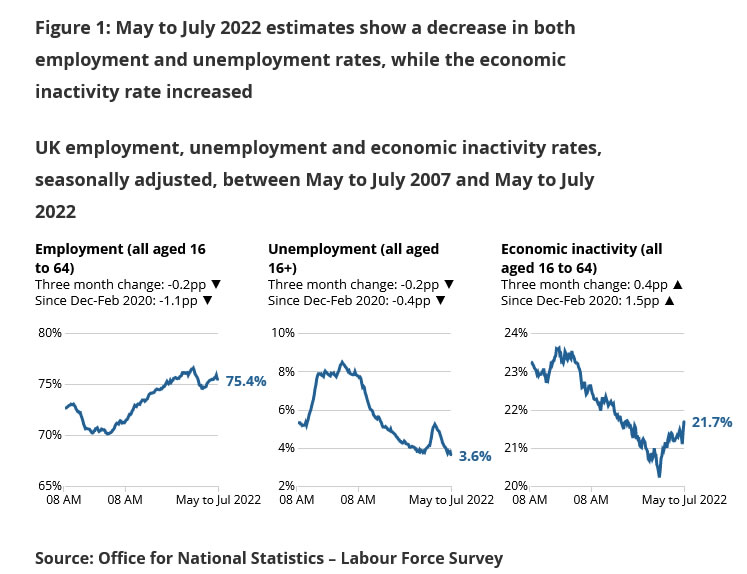
Unemployment rate dropped from 3.8% to 3.6% in the three months to July. Employment rate was estimated at 75.4% while economic inactivity rate was estimated at 21.7%. Average earnings including bonus rose 5.5% 3moy, versus expectation of 5.2%. Average earnings excluding bonus rose 5.2% 3moy, versus expectation of 5.0% 3moy.
Technical Outlook and Review
USD/JPY:
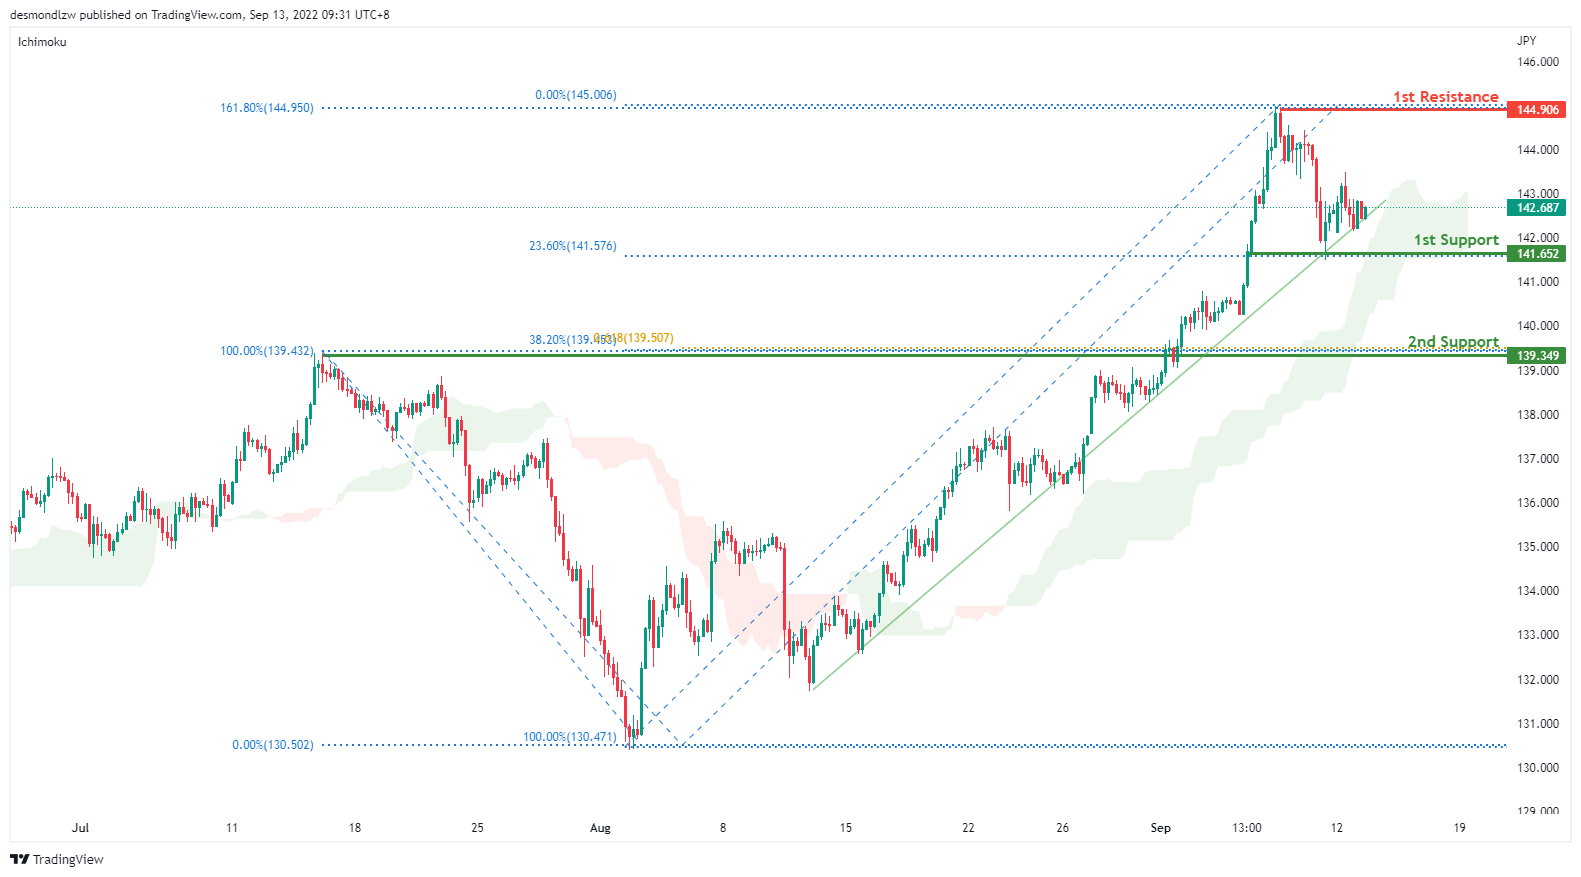
On the H4 chart, price is still respecting the ascending channel. We are still bullish bias- Price is currently testing along the trend line. If price continues with the bullish momentum, it should bring price to first resistance at 144.906 first where the 161.8% extension sits. Alternatively it could pull back to the first support at 141.652 where the 23.6% retracement sits then to the second support at 139.349 where the 38.2% retracement and overlapping support sits.
Areas of consideration:
- H4 time frame, 1st resistance at 144.906
- H4 time frame, 1st support at 141.652
DXY:
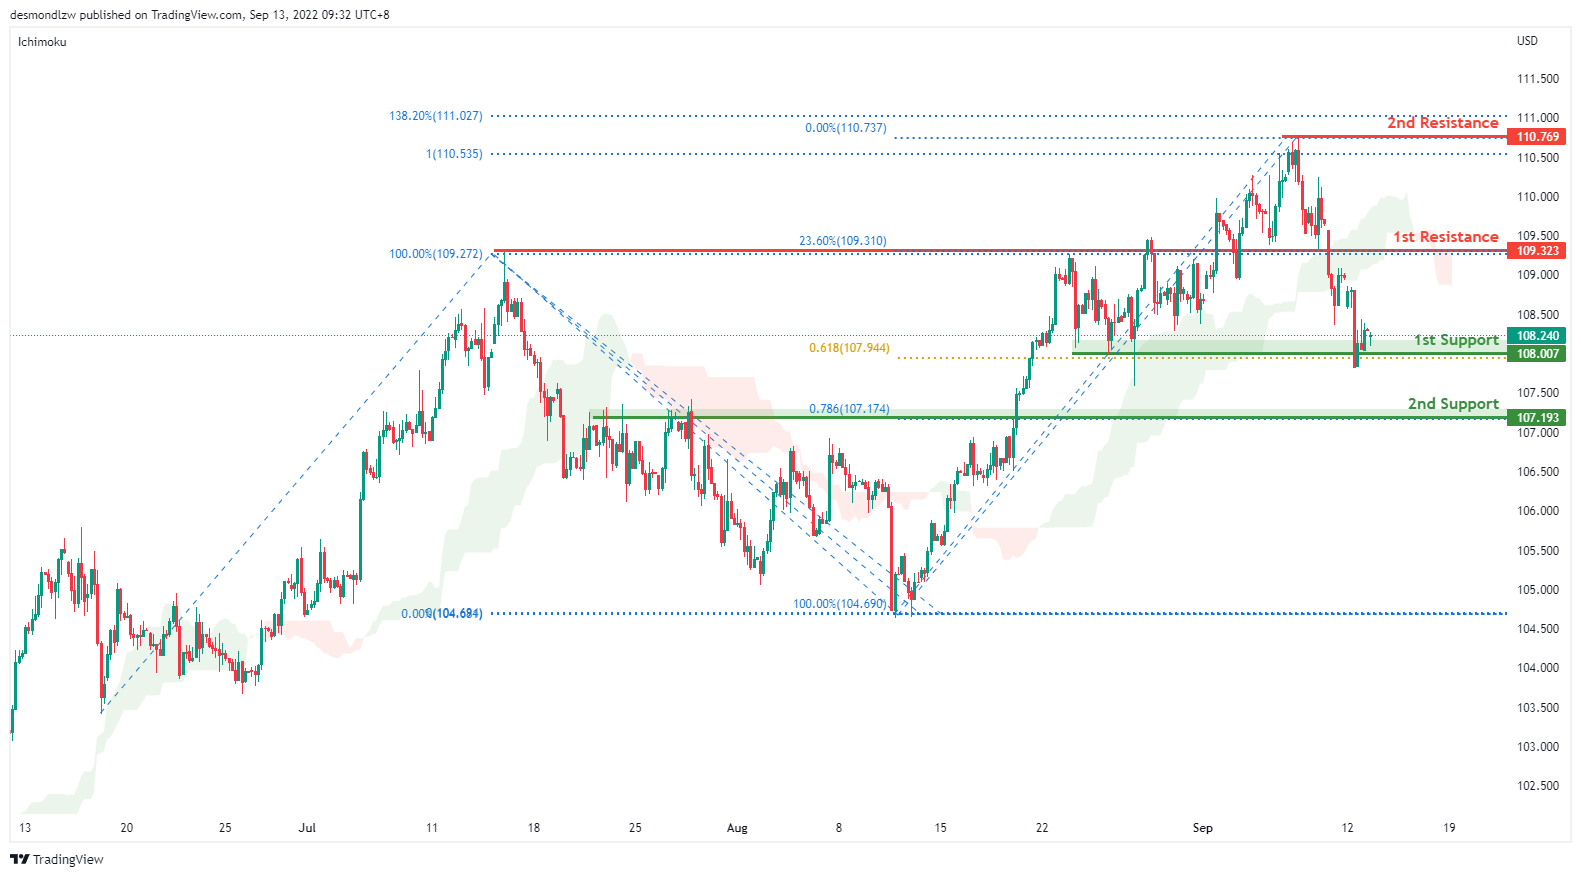
On the H4, prices have broken the ascending trend, we are bearish bias. Price has pulled back and is testing the first support at 108.007 where the 61.8% projection and previous swing low sits. If bearish momentum continues, it should bring price to the second support at 107.193 where the 78.6% projection sits. Alternatively, if price reverses from the first support, it should test first resistance at 109.323 where the 23.6% retracement sits and subsequently the second resistance at 110.769 where the previous swing high sits.
Areas of consideration:
- H4 time frame, 1st resistance at 109.323
- H4 time frame, 1st support at 108.007
EUR/USD:
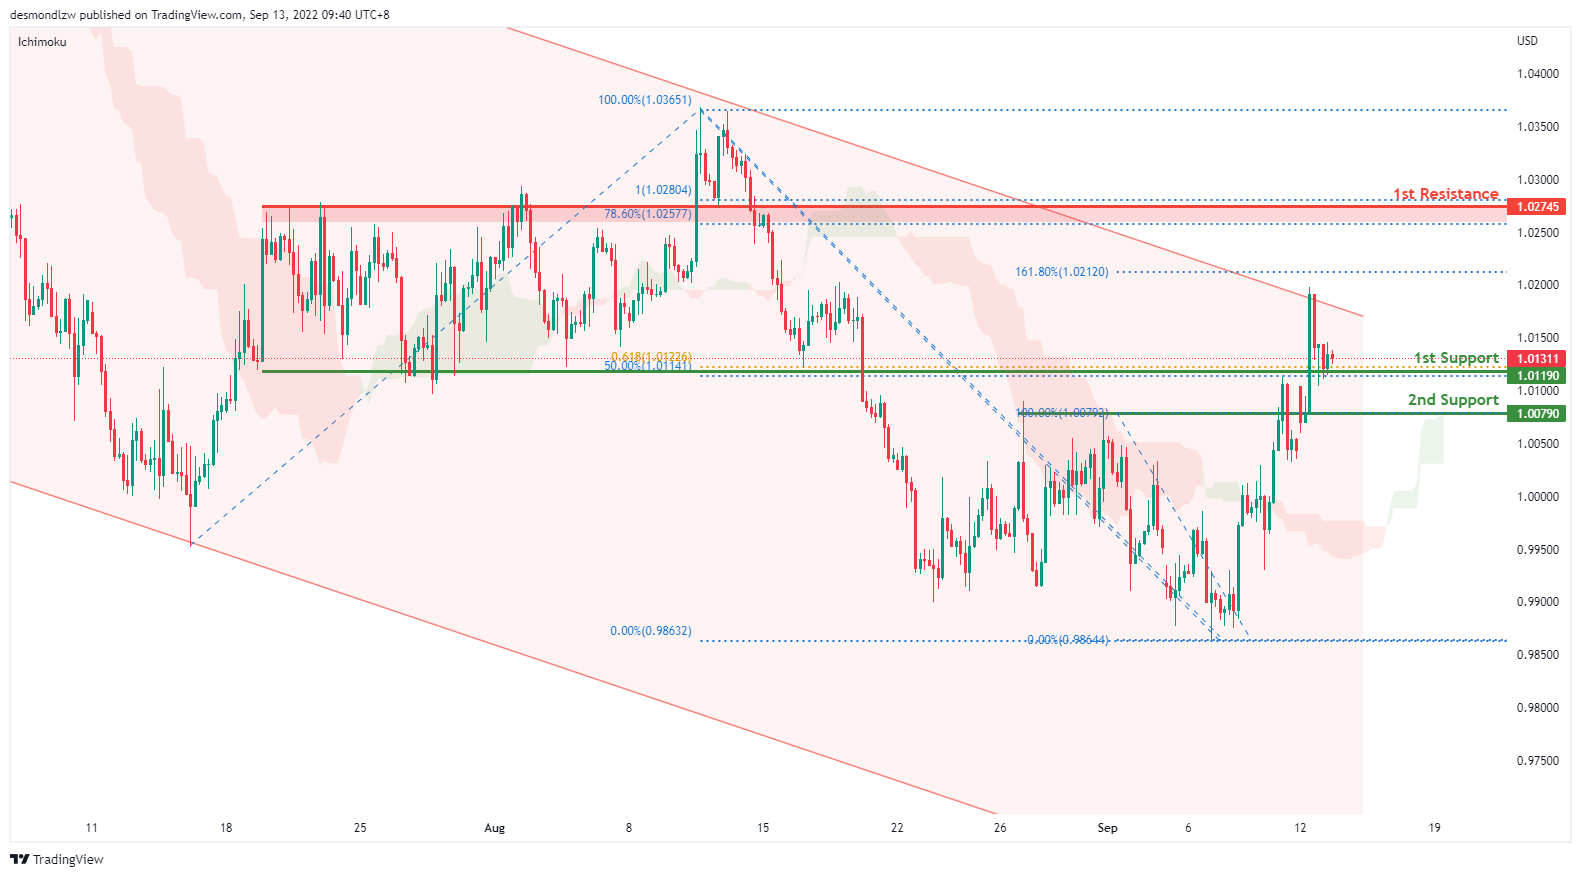
On the H4, price is moving in an ascending manner signalling bullish momentum – we are bullish bias. Price seems like it’s testing the first support at 1.0119 where the 50% retracement and 61.8% projection sits. If bullish momentum continues, it should bring price to the first resistance at 1.0274 where the 78.6% retracement and 100% projection sits. Alternatively, if price pulls back and breaks the first support, it should test the second support at 1.0079 levels where the overlapping support and previous swing high sits
Areas of consideration :
- H4 1st resistance at 1.0224
- H4 1st support at 1.0119
GBP/USD:
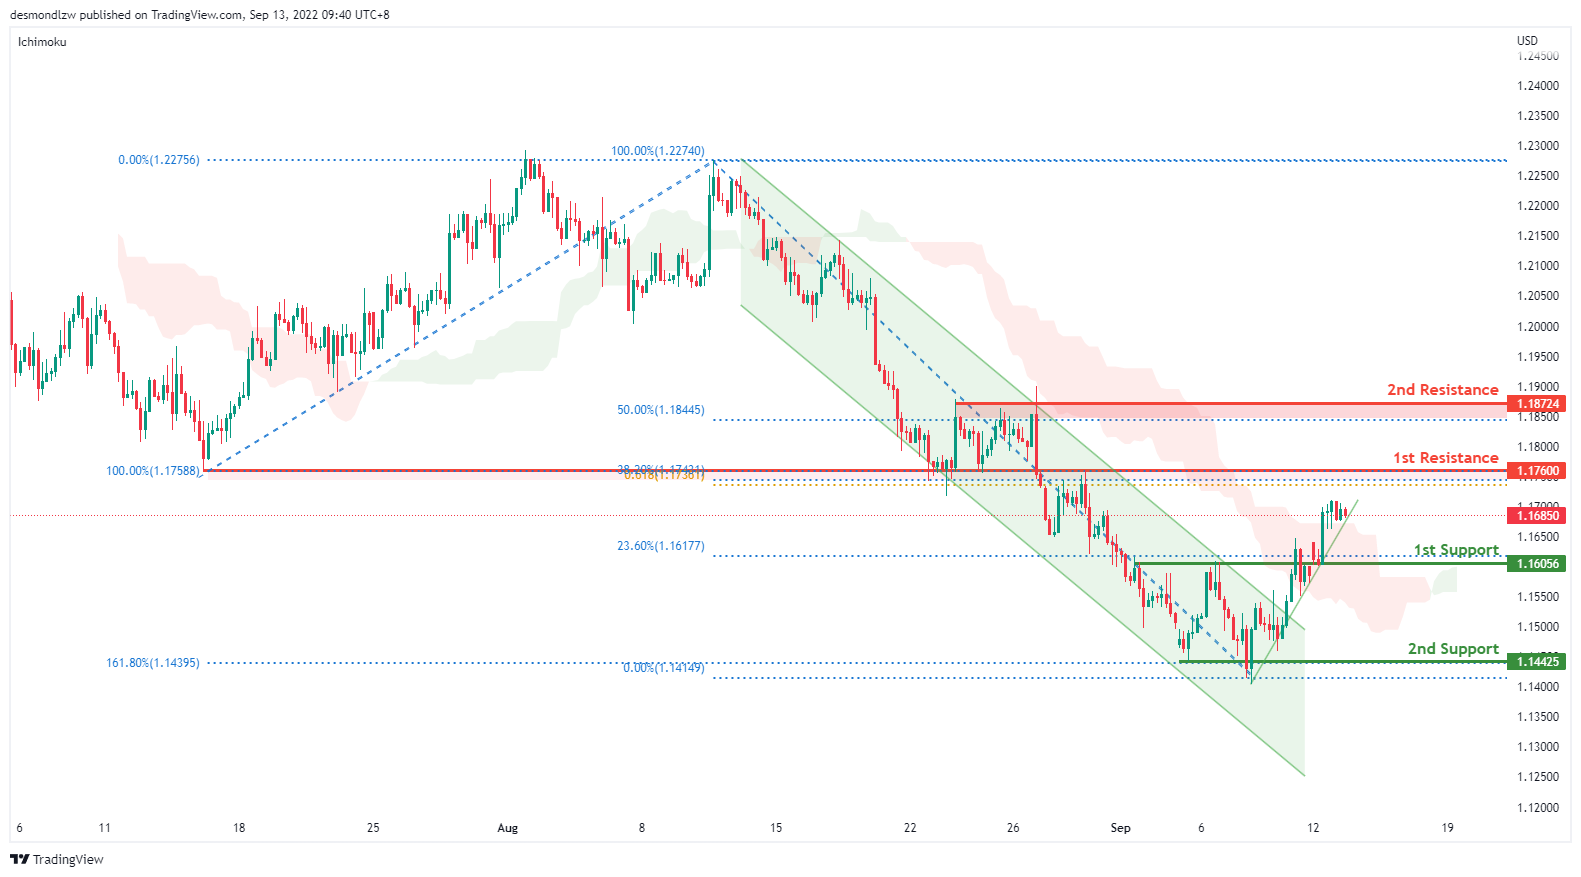
On the H4, prices have broken the descending channel and are moving in a bullish momentum- we are bullish biassed. Prices seem to be moving toward the first resistance at 1.1760 where the 38.2% retracement and 61.8% projection sits. If bullish momentum continues, it should bring prices to the second resistance at 1.1872 levels where the 50% retracement sits. Alternatively, if it fails to break the first resistance, it might look to test the first support at 1.1605 where the 23.6% retracement and overlapping support sits then the second support at 1.1442 where the 161.8% extension sits
Areas of consideration:
- H4 1st resistance at 1.1760
- H4 1st support at 1.1605
USD/CHF:
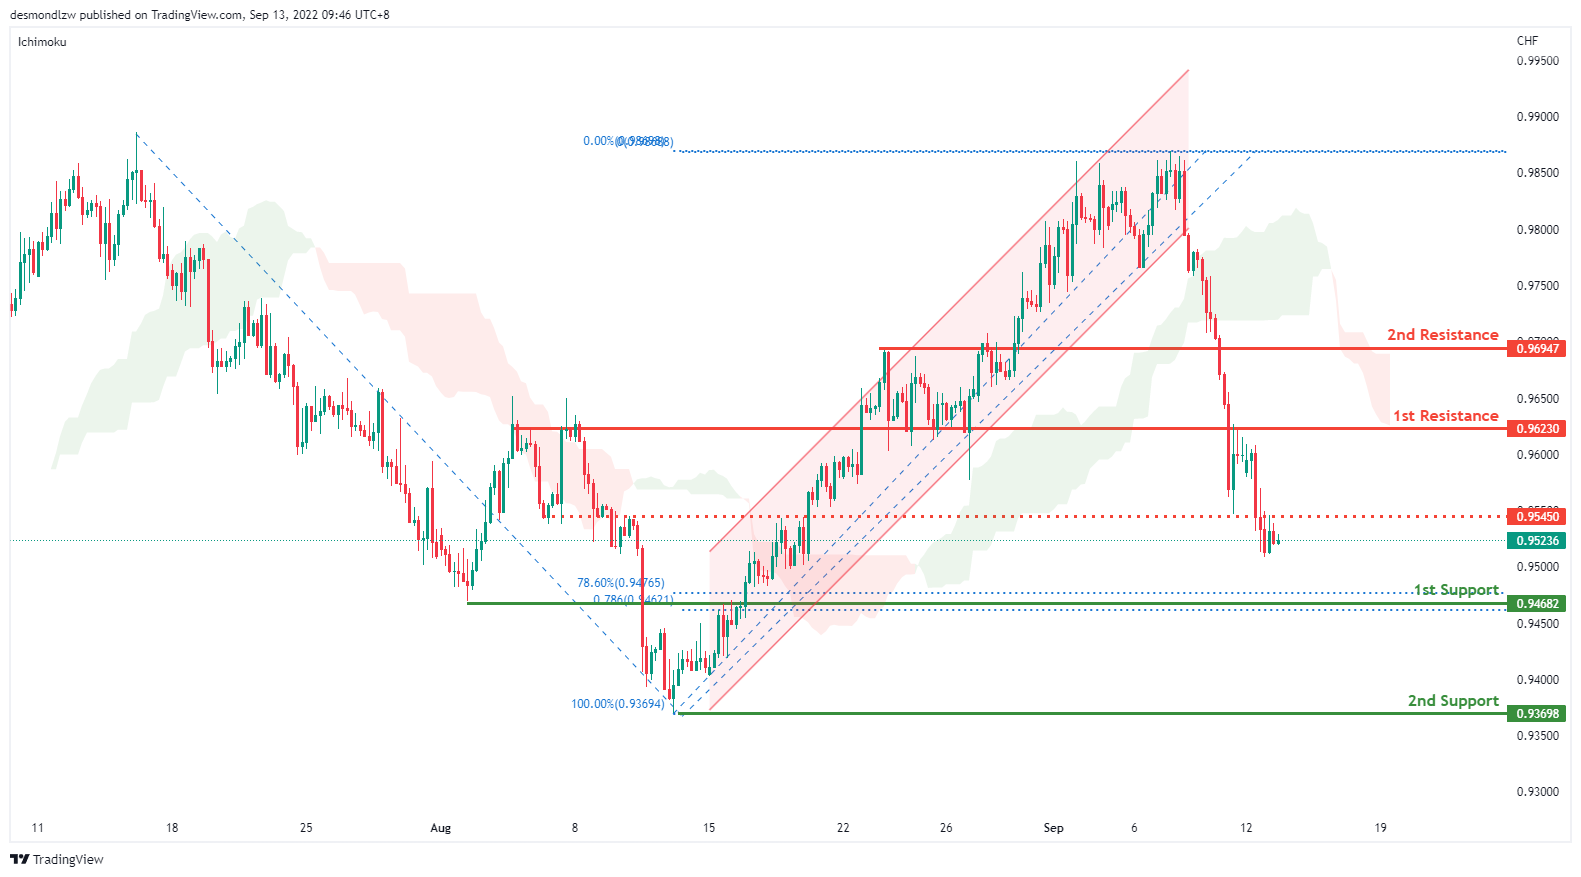
On the H4, prices have broken the ascending channel and we are currently bearish bias. Price is moving toward the first support around the 0.9468 levels where the 78.6% retracement and 78.6% projection sits. If bearish momentum continues, it should bring prices to the second support at 0.9369 levels where the swing low sits. Alternatively, price could pull back to test the first resistance at 0.9623 where the overlapping resistance and 50% retracement sit and then second resistance at 0.9694 where the 38.2% retracement sits
Areas of consideration
- H4 1st support at 0.9468
- H4 1st resistance at 0.9623
XAU/USD (GOLD):
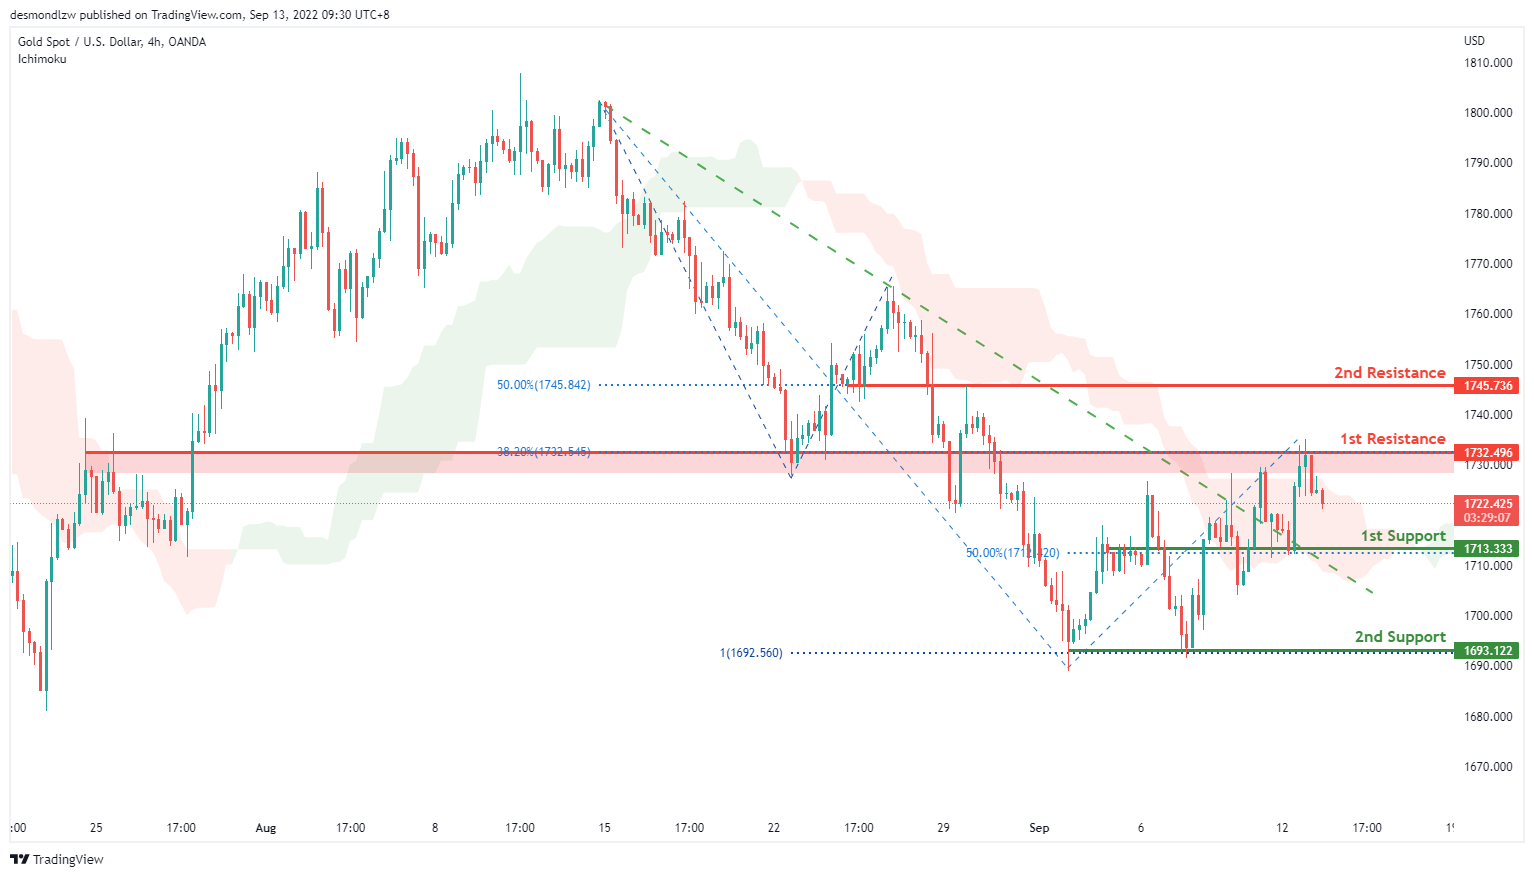
On the H4, with the price below ichimoku cloud, and dropping from the 1st resistance, we have a bearish bias that the price may drop to the 1st support at 1713.333, which is in line with the 50% fibonacci retracement and overlap support. If the price can break this level, the 2nd support could be at 1693.122, where the swing low and 100% fibonacci projection. Alternatively, the price may retest the 1st resistance at 1732.496, which is in line with the overlap resistance and 38% fibonacci retracement. If the price can break the 1st resistance, the 2nd resistance could be at 1745.736, where the 50% fibonacci retracement and overlap resistance are.
Areas of consideration:
- H4 time frame, 1st resistance at 1732.496
- H4 time frame, 1st support at 1713.333
AUD/USD:
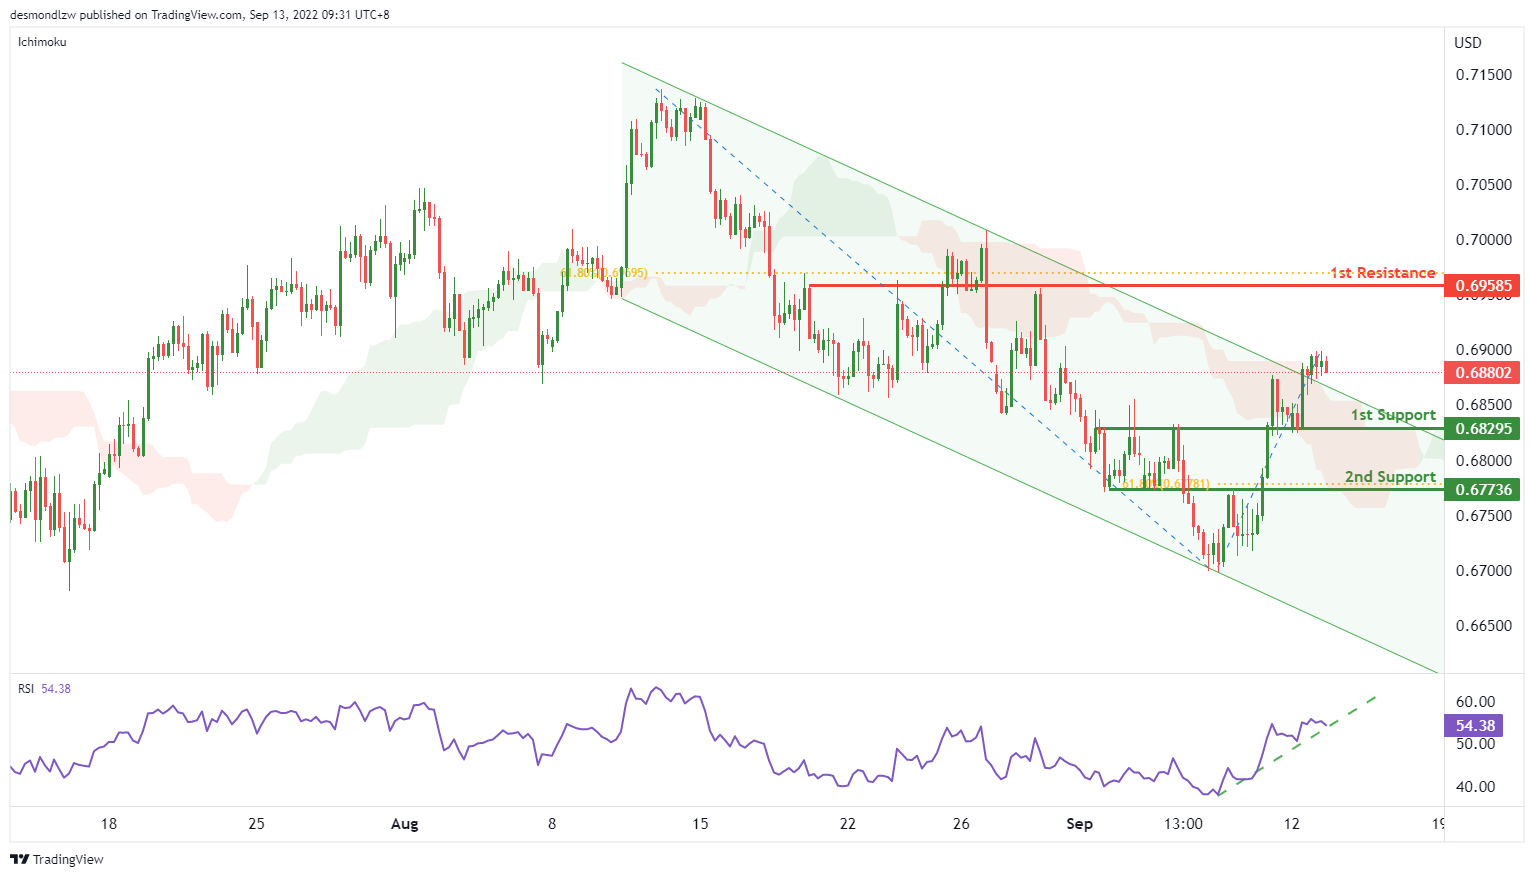
On the H4, with the price breaking the descending channel, ichimoku cloud and RSI is showing the ascending trend, we have a bullish bias that the price may rise to the 1st resistance at 0.69585, which is in line with the 61.8% fibonacci retracement and overlap resistance. Alternatively, the price may drop to the 1st support at 0.68295, which is in line with the overlap support. If this support level is broken, the next support level could be at 0.67736, where the swing lows and 61.8% fibonacci retracement are.
Areas of consideration
- H4 1st support at 0.68295
- H4 1st resistance at 0.69585
NZD/USD:
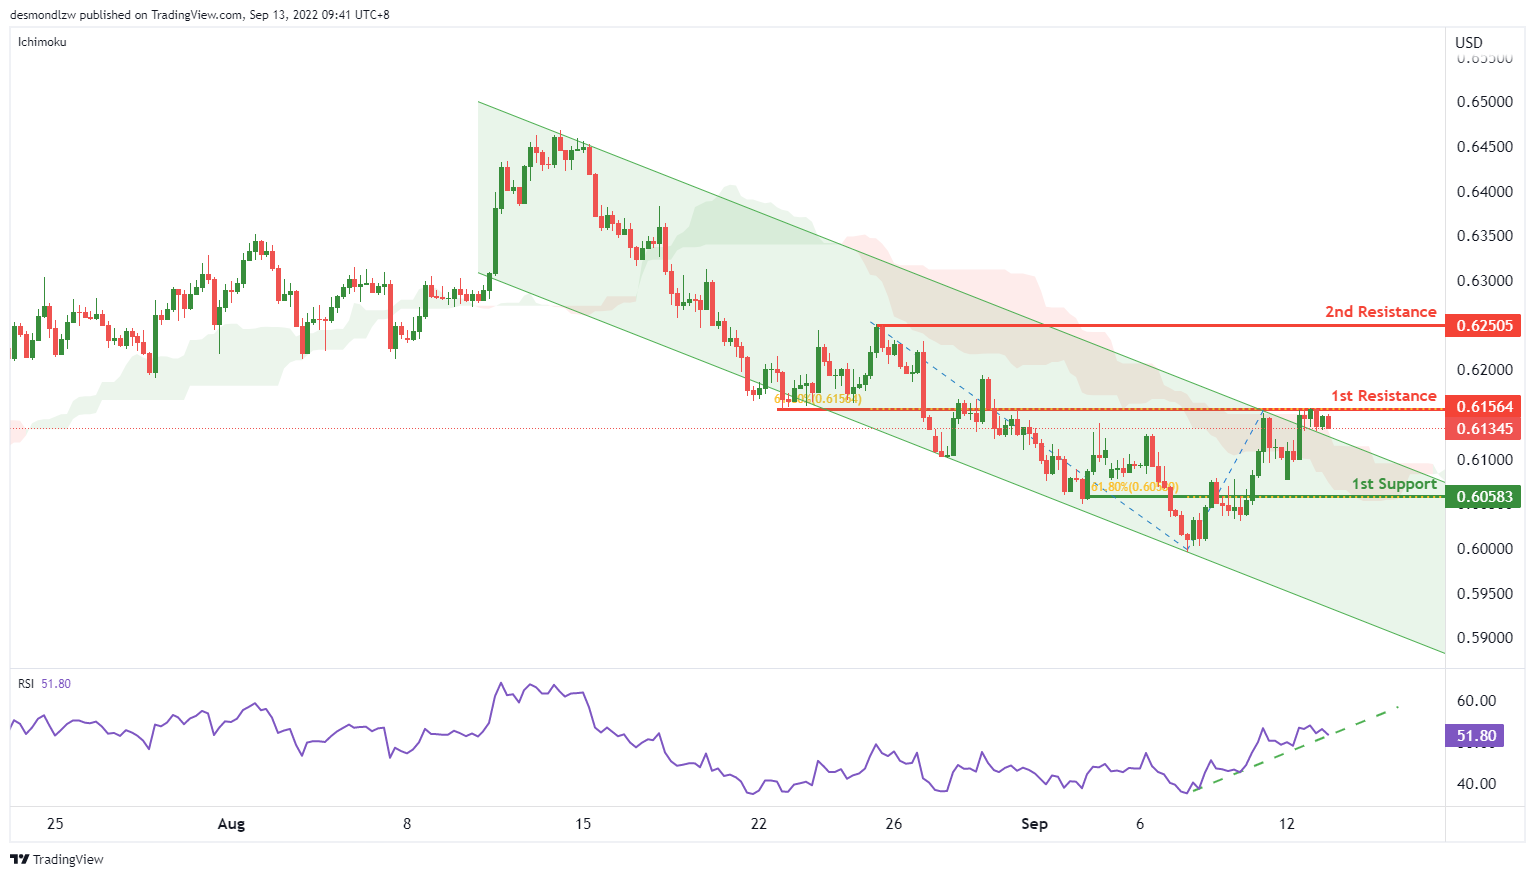
On the H4, with the price breaking the descending channel, ichimoku cloud and RSI is showing a ascending trend, we have a weak bullish bias that the price may test the 1st resistance at 0.61564, which is in line with the 61.8% fibonacci retracement and overlap resistance. If the price can break the 1st resistance, the 2nd resistance could be at 0.62505, which is in line with the wing high. Alternatively, the price may drop to the 1st support at 0.60583, which is in line with the 61.8% fibonacci retracement.
Areas of consideration:
- H4 time frame, 1st resistance at 0.61564,
- H4 time frame, 2nd resistance at 0.62505
USD/CAD:
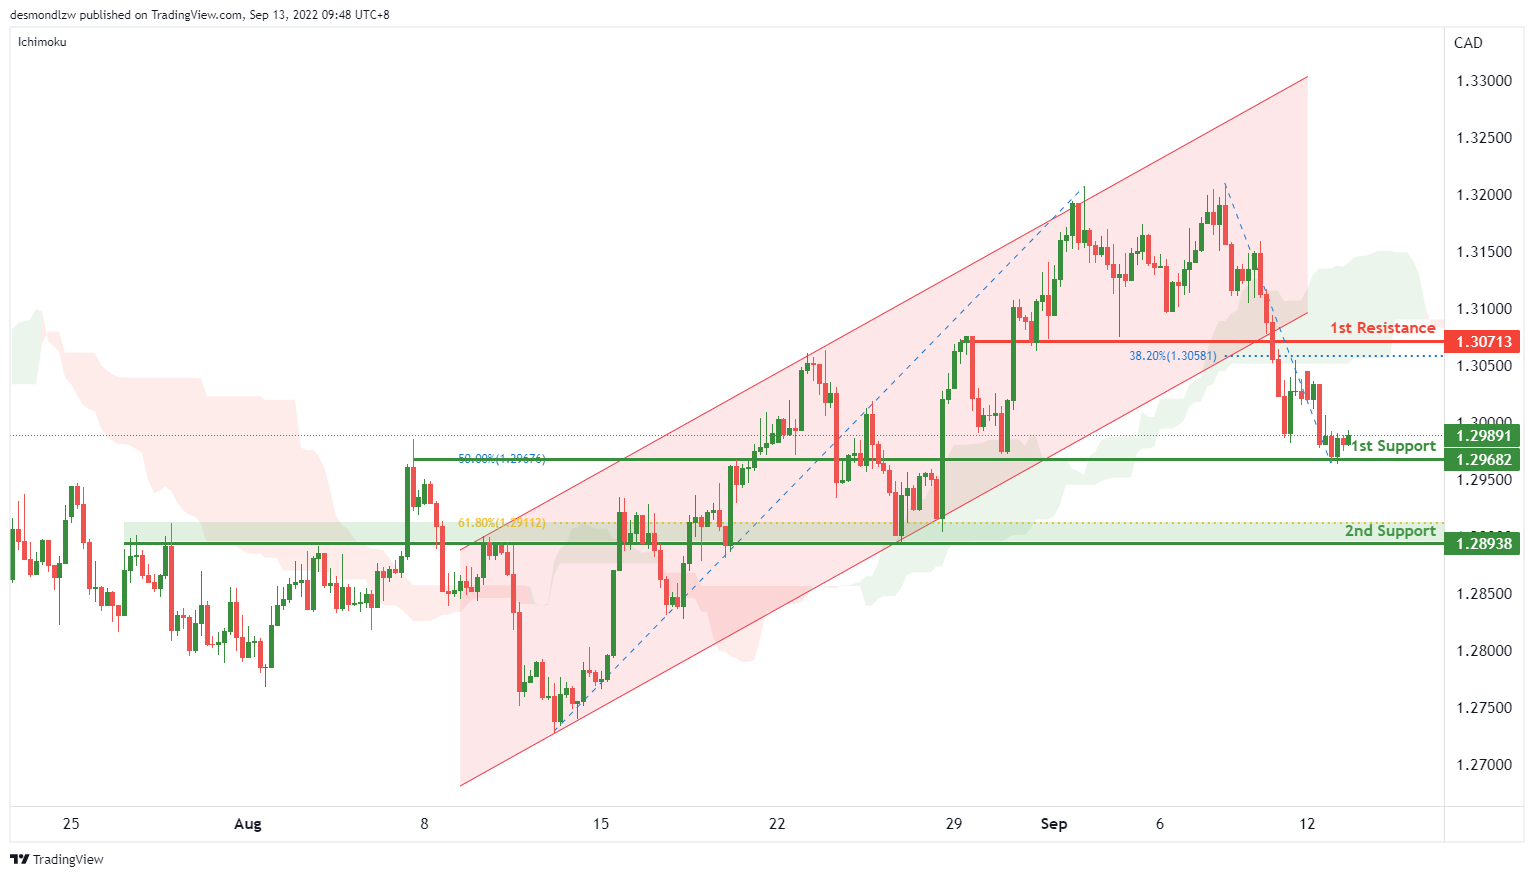
On the H4, with the price breaking the ascending channel, below the ichimoku cloud, and there’s a possible “double top” pattern, we have a bearish bias that the price may drop to the 1st support at 1.29682, which is in line with the overlap support and 50% fibonacci retracement. If the 1st support is broken, the 2nd support could be at 1.28938, where the overlap support and 61.8% fibonacci retracement are. Alternatively, the price may rise to the 1st resistance at 1.30713, where the “neckline” of the “double top” pattern and 38.2% fibonacci retracement are.
Areas of consideration:
- H4 time frame, 1st support at 1.29682
- H4 time frame, 2nd support at 1.28938
OIL:
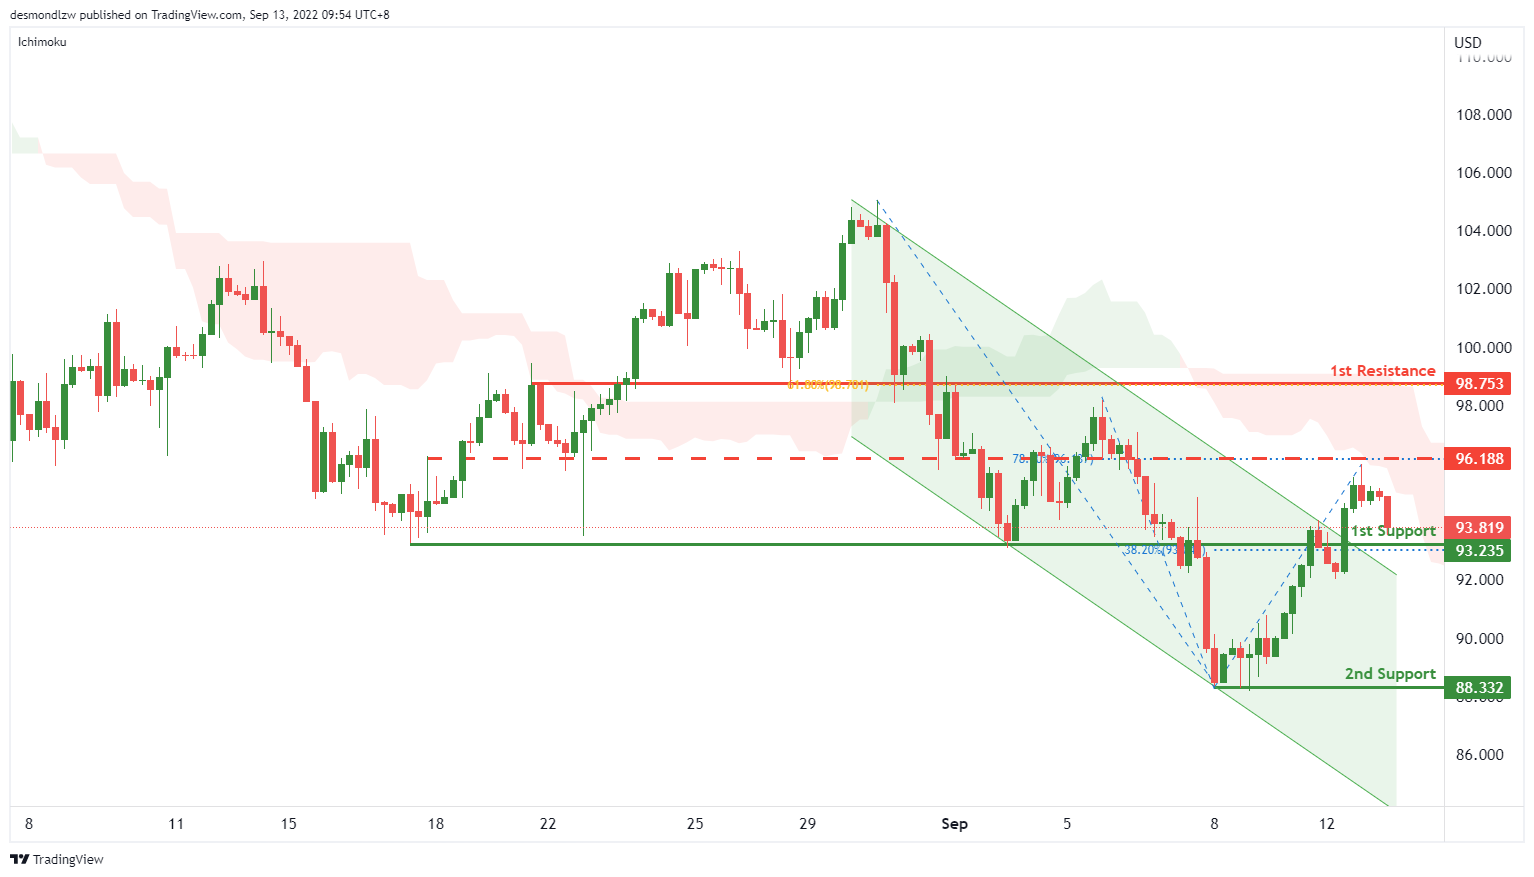
On the H4, with price below ichimoku and dropping from the intermediate resistance, we have a bearish bias that the price may drop to the 1st support at 93.235, where the overlap resistance and 38.2% fibonacci retracement are. If the price can break this resistance level, the next support level could be at 88.332, which is in line with the swing low. Alternatively, the price may rise to the 1st resistance at 98.753, which is in line with the 61.8% fibonacci retracement and overlap resistance. Take note the intermediate resistance could be at 96.188, which is in line with the 78.6% fibonacci retracement.
Areas of consideration:
- H4 time frame, 1st support at 93.235
- H4 time frame, 2nd support at 88.332
Dow Jones Industrial Average:
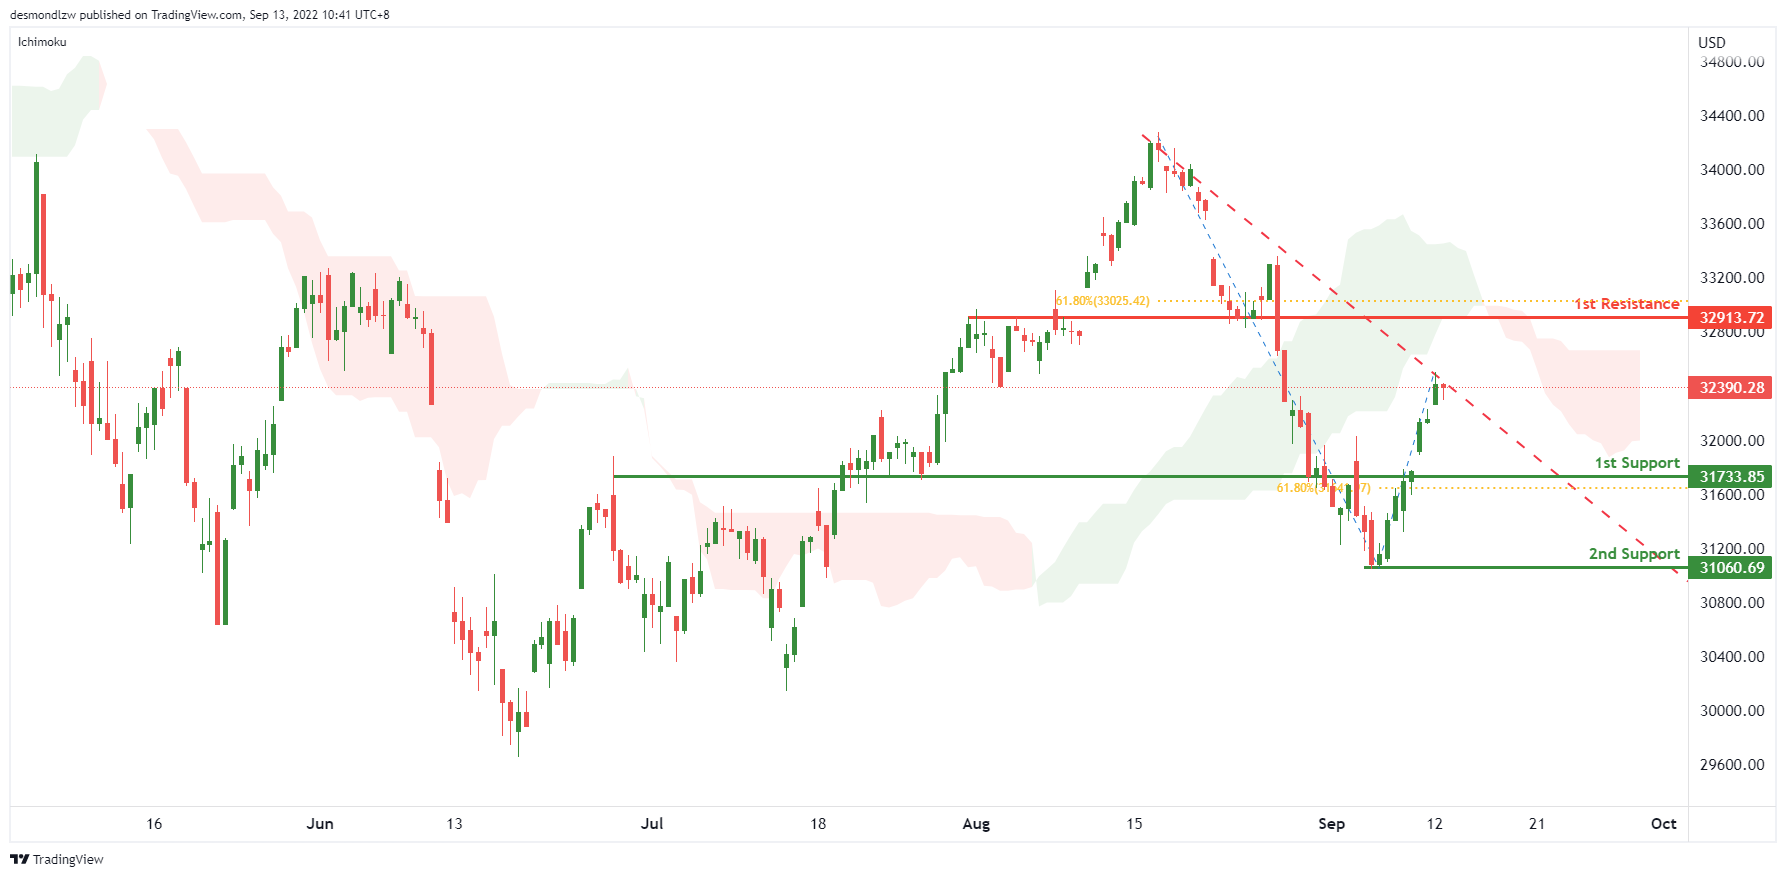
On the H4, with price moving within the descending trendline and below ichimoku cloud, we have a bearish bias that the price may drop to the 1st support at 31733.85, where the overlap support and 61.8% fibonacci retracement are . If the 1st support is broken, the 2nd support could be at 31060.69, which is in line with the swing low. Alternatively, the price may break the descending trendline and rise to the 1st resistance at 32913.72, which is in line with the overlap resistance and 61.8% fibonacci retracement.
Areas of consideration:
- H4 time frame, 1st support at 31733.85
- H4 time frame, 2nd support at 31060.69
DAX:
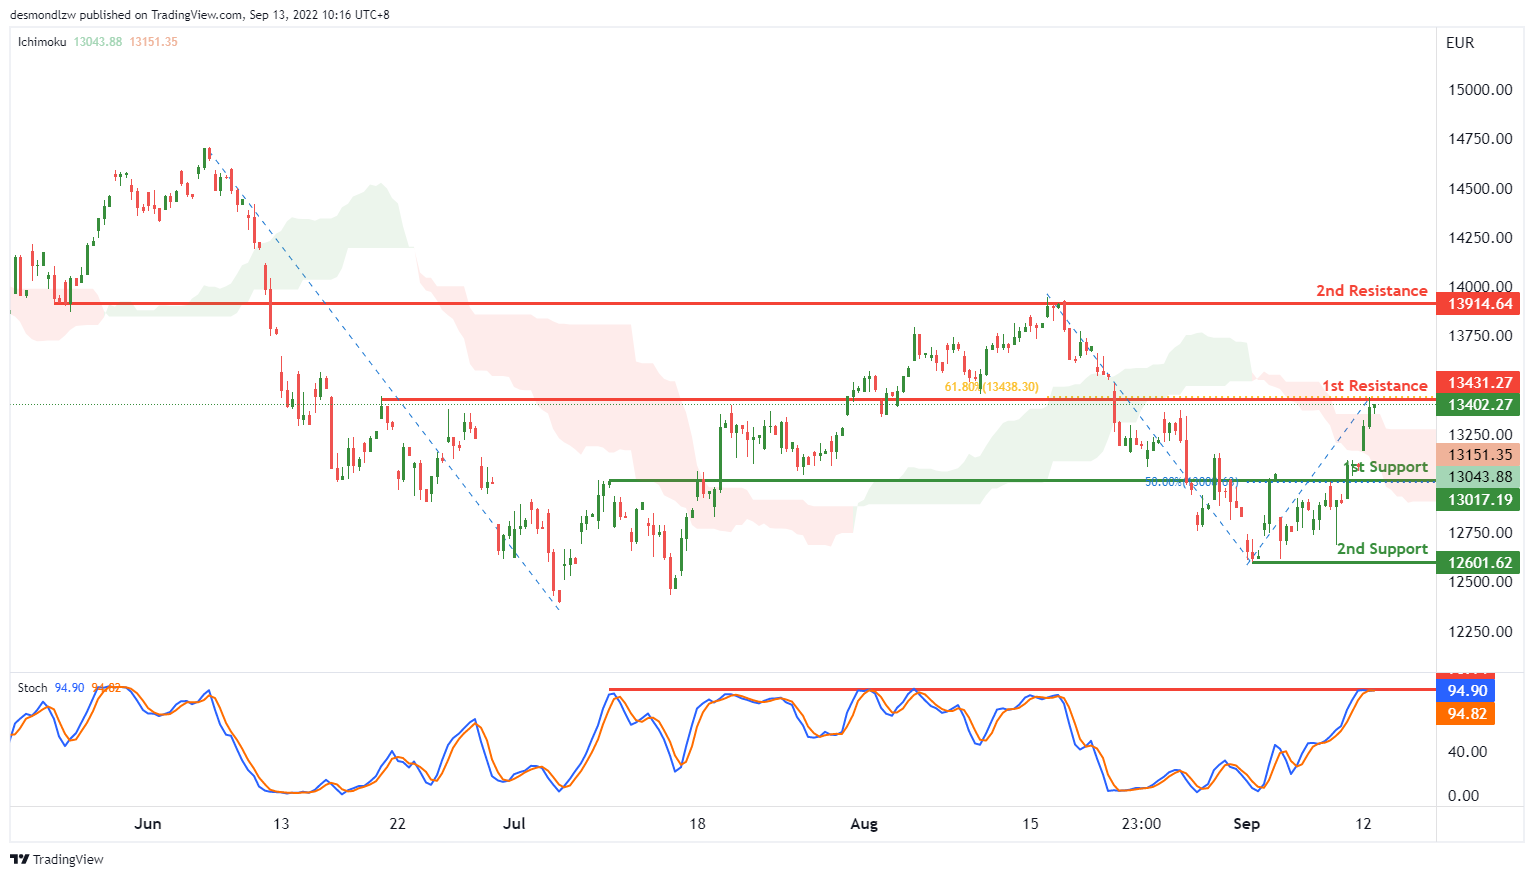
On the H4, with price moving above the ichimoku indicator, we have a weak bullish bias that the price may test the 1st resistance at 13431.27, which is in line with the overlap resistance and 61.8% fibonacci retracement. If the price can break the 1st resistance successfully, the next resistance could be at 13914.64, where the overlap resistance and swing high are. Alternatively, as the Stoch is reaching the resistance, the price may drop to the 1st support at 13017.19, where the 50% fibonacci retracement is. If the 1st support is broken, the 2nd support could be at 12601.62, where the swing low is.
Areas of consideration:
- H4 time frame, 1st resistance at 13431.27
- H4 time frame, 2nd resistance at 13914.64
ETHUSD:
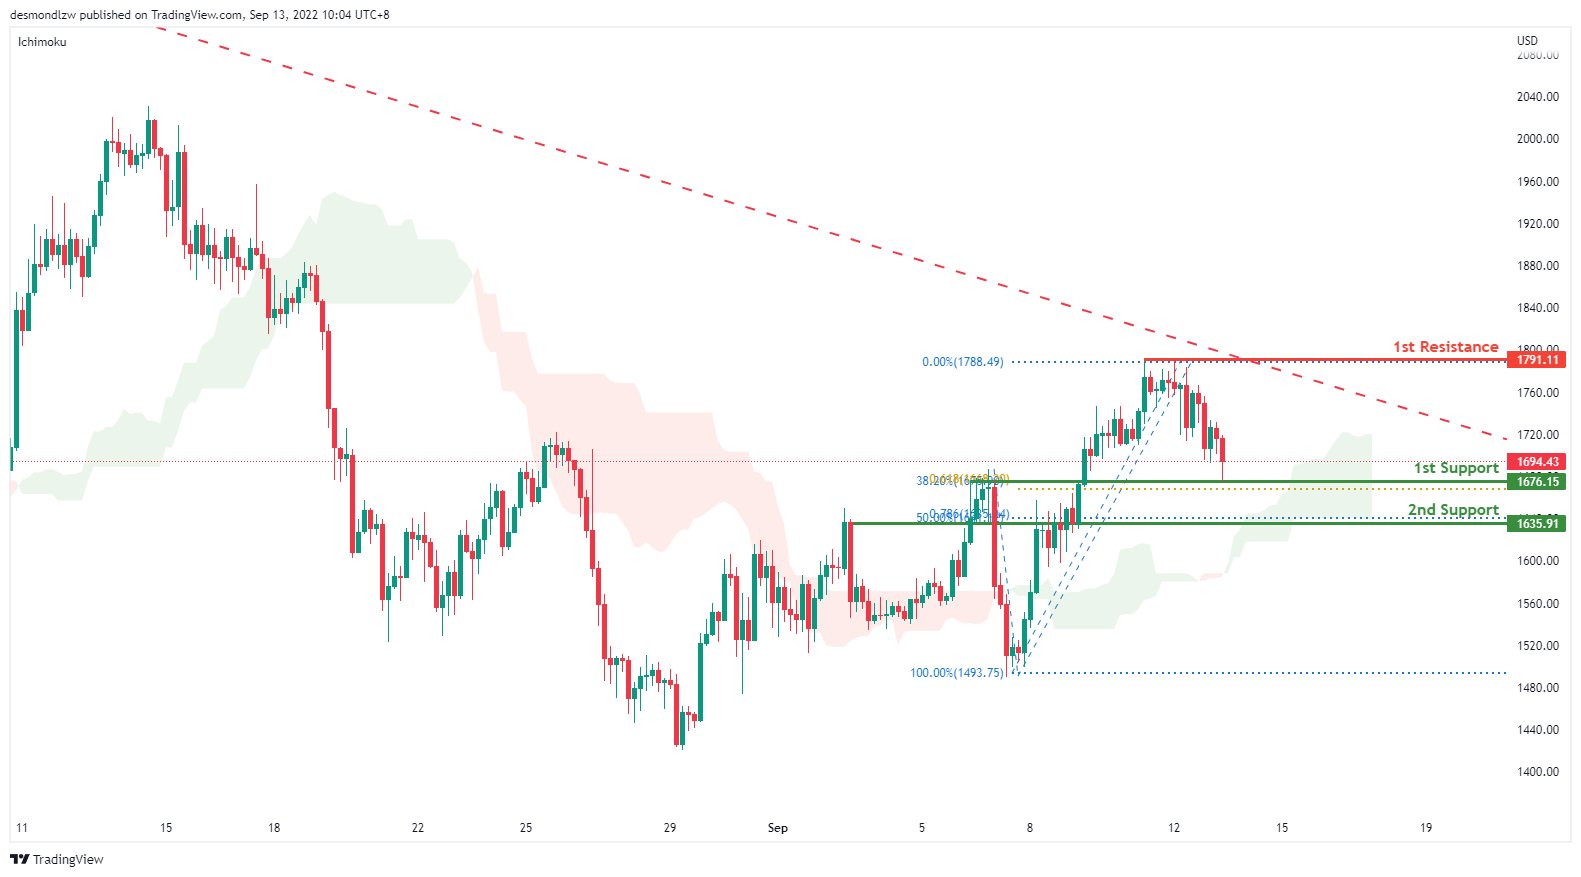
On the H4, with price moving above the ichimoku indicator, we have a bullish bias that price will rise to 1st resistance at 1791.11 where the 61.8% fibonacci retracement sits. Price is currently testing the first support at 1676.15 where the 38.2% retracement and 61.8% projection sits. If price were to break first support, it will bring it to the second support at 1635.91 where the 50% retracement and 78.6% projection sits
Areas of consideration:
- H4 time frame, 1st resistance of 1791.11
- H4 time frame, 1st support at 1676.15
BTCUSD:
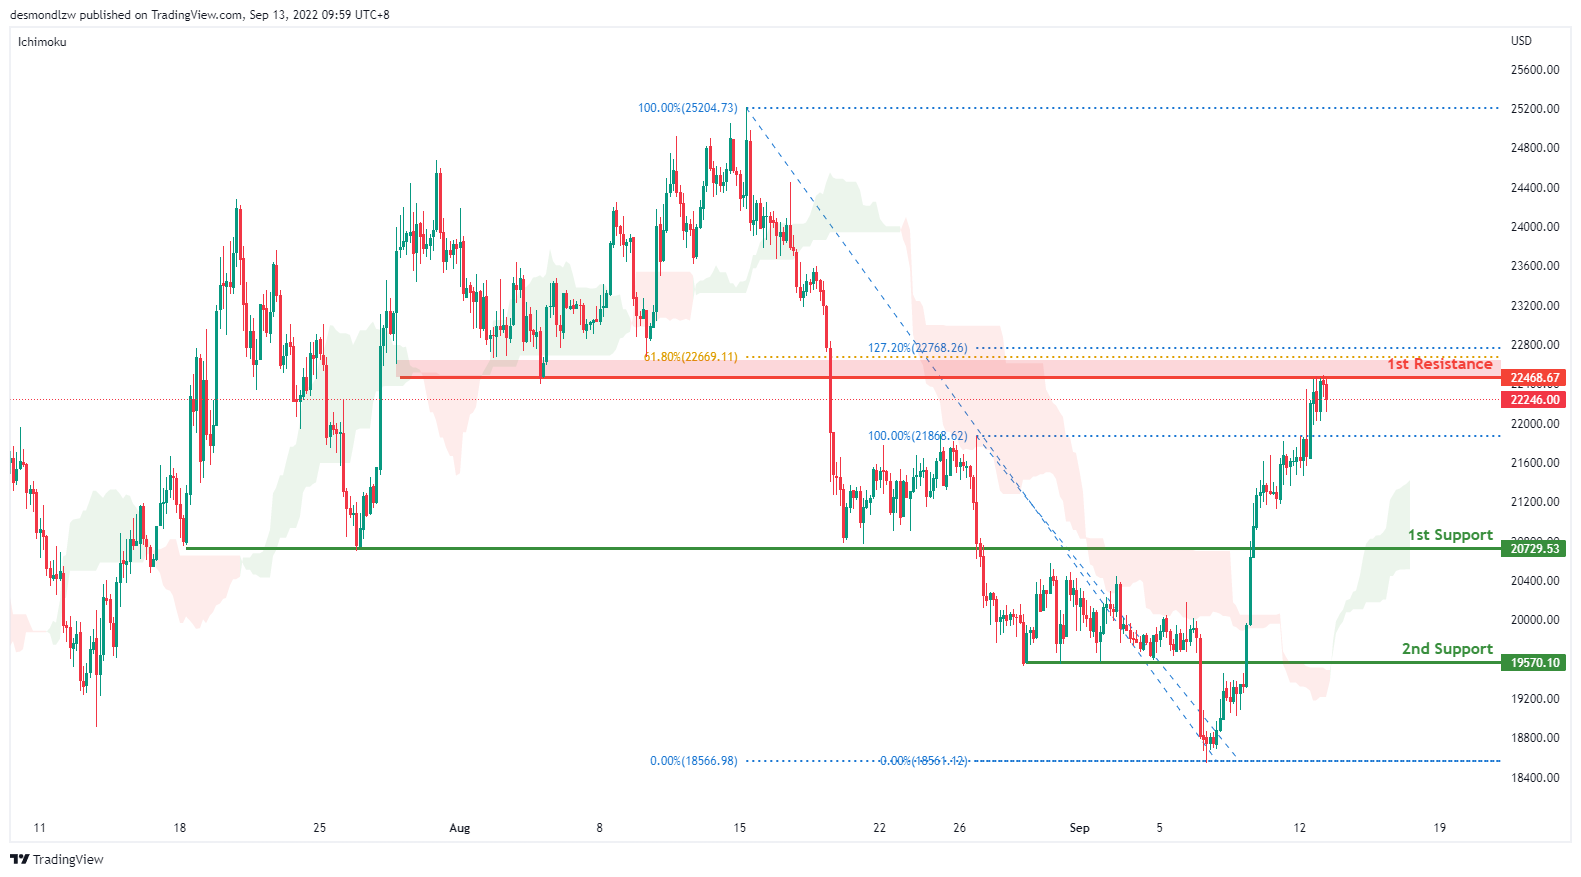
On the H4, with price breaking out of a descending channel and moving above the ichimoku indicator, we are bullish bias- that is testing the 1st resistance at 22468.67 where the pullback resistance and 61.8% fibonacci retracement sits. Alternatively, price could pull back to the first support at 20729.53 where the previous swing low sits and then the second support at 19570.10 levels
Areas of consideration:
- H4 time frame, 1st resistance of 22468.67
- H4 time frame, 1st support at 20729.53
S&P 500:
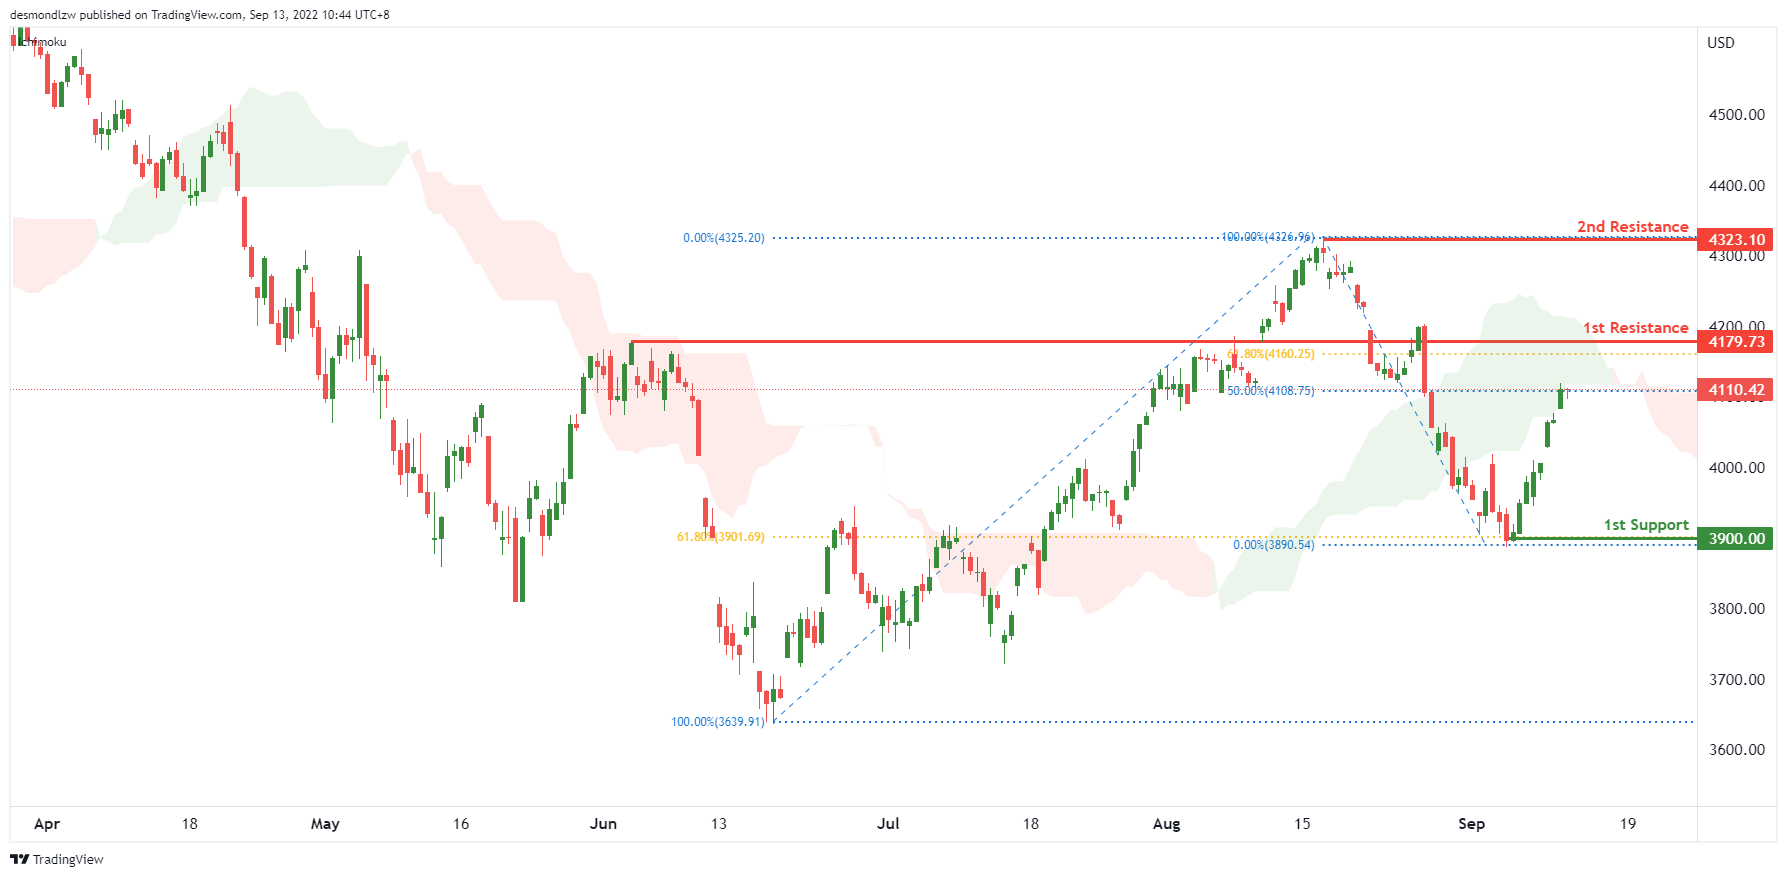
On the H4, price bounced from the 3900 support level earlier and is climbing steadily towards the 1st resistance of 4179. With price moving below the ichimoku indicator, our bearish bias is still valid, while looking for price to drop from the pullback resistance of 61.8% fibonacci retracement. If price rejects the resistance level, price could fall towards the 1st support of 3900 where the pullback support is. Alternatively, price could break 1st resistance structure and rise to 2nd resistance and pullback resistance of 4323.10.
Areas of consideration:
- H4 time frame, 1st resistance of 4179.73
- H4 time frame, 1st support at 3900