Sample Category Title
A Curious Rebound
Stock markets are bouncing back on Tuesday following a rocky couple of weeks as investors grew nervous about the economic impact of tightening.
Fed Chair Jerome Powell could not have been more clear on Friday on the central bank's tightening stance and unlike the warnings from his colleagues, the message appeared to have finally gotten through.
Which makes today's move all the more curious. It's not the fact that we're seeing a rebound as equity markets don't move in straight lines, rather it's the strength of it that is interesting.
Prior to Friday's speech, investors appeared determined to cast aside warnings in favour of the dovish pivot narrative and today's moves may suggest the same could still be true after a brief pullback.
With a 75 basis point rate hike now viewed as the more likely outcome from the Fed in a few weeks and ECB officials putting a similar move on the table ahead of its meeting next week, how strong of a recovery can we really expect in equity markets?
Central banks have made it perfectly clear now that the fight against inflation is their primary concern and a hard landing may just be the price to pay. While that may change if we see any significant improvement on the inflation front over the coming months, the risks still appear more tilted to the downside for the economy.
Saudi Arabia reinforces support
Oil prices are easing a little with Brent potentially settling around $100 and WTI a little below around $95. While there remain many moving parts in the oil market at the moment, the comments last week from Saudi Arabia have reinforced support below the current price.
It seems OPEC+ isn't interested in the oil price slipping much below $100 a barrel and while those warnings would be put to the test in the event of a nuclear deal, which still looks very challenging, or a global recession, the words alone could keep prices high for now.
Gold failing to bounce back
Gold continues to struggle in the aftermath of Powell's comments on Friday, even though the dollar is falling on Tuesday and US yields are a little lower. The yellow metal continues to test $1,730 today; a sign that not all are on board with the recovery trade we're seeing elsewhere.
A significant break of $1,730 would be a real blow for gold, with the next area of notable support falling around $1,680-$1,700. A move back above $1,765 could get gold bulls excited once more but that may be easier said than done if trading over the last few sessions is anything to go by.
A big moment for Bitcoin
Bitcoin is enjoying a slight recovery today after surviving a brief dip below $20,000 over the weekend. The hawkish sentiment by Powell took its toll at the end of the week but crypto bulls are fighting back to defend what could be a key level. We may need to see more of the resilience displayed in recent months as a failure to do so could quickly see bitcoin retesting the June lows.
Bitcoin Clings to $20K
Market picture
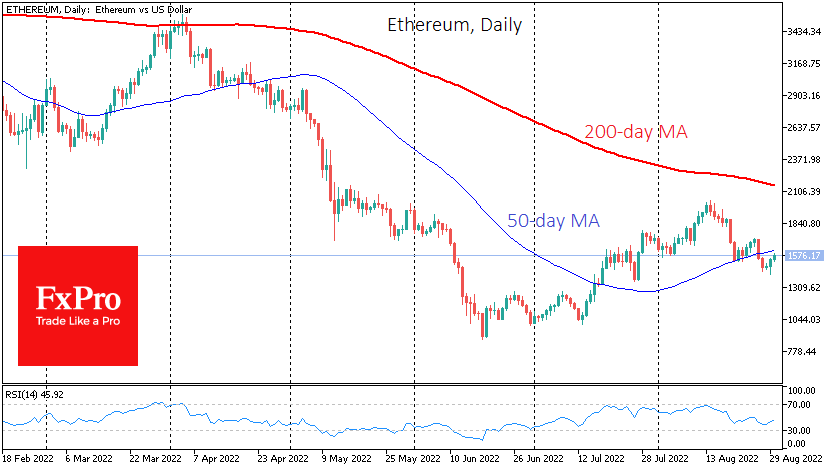
Bitcoin managed to claw its way to a meaningful round level early in the week, trading at $20,400 on Tuesday morning (+2.8% in 24 hours). Ethereum showed an even more decisive rebound, adding 8.5% at once to $1580. Top altcoins are up 3.5% (Dogecoin) to 7.1% (Solana).
Total cryptocurrency market capitalisation, according to CoinMarketCap, rose 4.2% overnight to $992bn. The cryptocurrency Fear and Greed Index rose 3 points to 27 by Tuesday and moved into “fear” from “extreme fear”.
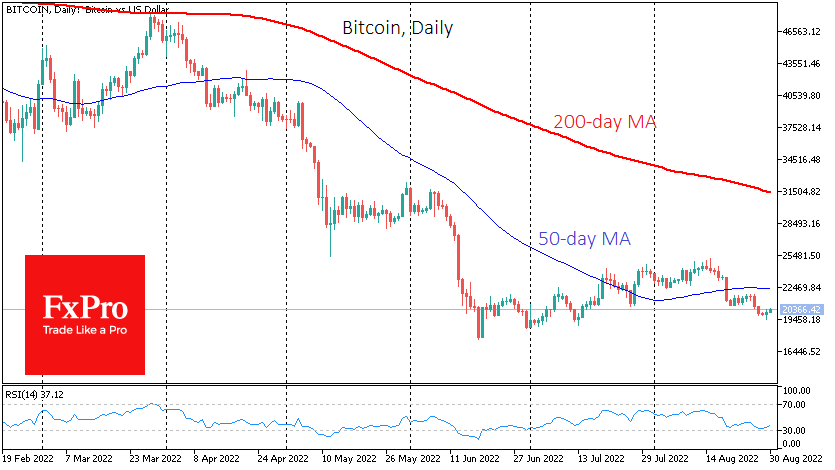
Bitcoin was getting support on Monday on declines under 19500. It attracted buyers roughly at the same levels in July. One can cautiously state that the bears’ impulsive attack has been stopped, preventing the first cryptocurrency from updating lows. Such buybacks slowly create a sense that the bottom is near. This dynamic has encouraged a broad layer of buyers, who quickly returned to buying one of the robust fundamentals of recent months, Ethereum.
News background
According to CoinShares, net capital outflows from cryptocurrencies last week were $27m, with investors taking money out for the third week. Meanwhile, outflows from bitcoin funds accounted for $29 million, with investments in funds that allow shorts on bitcoin up by $1 million.
BTC is unique because it is technically one of the worst cryptocurrencies and solely a speculative asset without utility, said Cyber Capital founder and chief investment officer Justin Bones. He was previously a supporter of the first cryptocurrency but changed his view due to the community’s refusal to increase the block size limit.
Cardano beat out bitcoin in MBLM’s Consumer Emotional Affection ranking, ranking 26th out of 600 global brands. Bitcoin ended up in the 30th position.
Former US broker Jordan Belfort, known as “The Wolf of Wall Street”, sees bitcoin and Ethereum as primarily solid digital assets because of their strong fundamentals but compares the cryptocurrency market to junk bonds from the 1980s.
Meanwhile, the Chicago Mercantile Exchange (CME Group) has launched euro-denominated futures on bitcoin and Ethereum.
Yen Stabilizes after Hitting 139
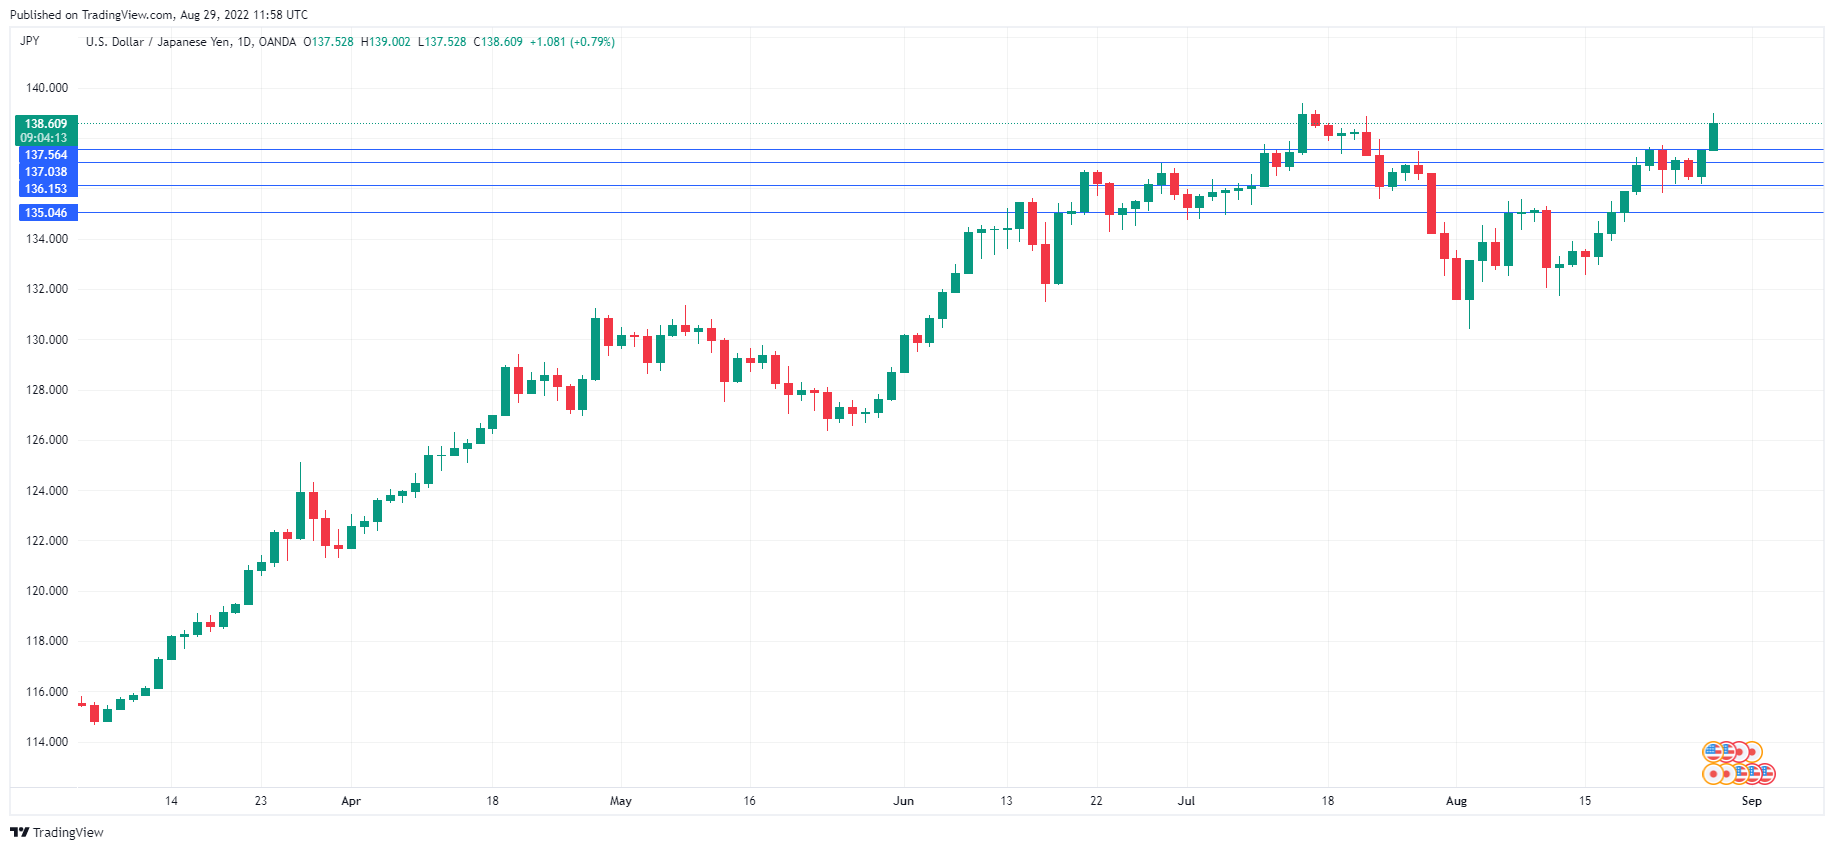
The Japanese yen is in positive territory today after starting the week with sharp losses. USD/JPY is trading at 138.22, down 0.34%.
Japan releases a host of events on Wednesday, including retail sales and consumer confidence. Retail sales for July is expected to come in at -0.5% MoM, following a 1.4% decline in June. Consumer confidence remains weak, with a July estimate of 31.0, following the June read of 30.2. The Japanese consumer is in a sour mood and nervous about the economy, so it’s no surprise that she is holding tight to the purse strings as inflation continues to rise.
Yen remains under pressure
The yen remains under pressure and took it on the chin after Fed Chair Powell’s speech at Jackson Hole on Friday. Powell’s brief speech went straight to the point, pledging to continue raising rates until inflation was brought under control. Powell pointedly said that one or two weak inflation reports would not cause the Fed to U-turn on its tightening, a veiled reference to the market euphoria which followed the July inflation report, which was lower than the June release. With the equity markets taking a tumble after Powell’s speech, it appears that investors have finally gotten the Fed’s hawkish message.
Powell’s speech removed any doubts about the Fed’s plans to continue raising rates, but the size of the increases will depend not just on inflation, but also on other economic data. Overshadowed by Jackson Hole, US Personal Income and Spending data was weaker than expected. As well, the Core PCE index, the Fed’s preferred inflation indicator, fell to 6.3%, down from 6.8% and below the forecast of 7.4%. If Friday’s non-farm payrolls report is weaker than expected, it would be a clear indication that the sharp increase in rates is having its desired effect and the economy is slowing. In such a scenario, Fed policy makers may be more inclined to raise rates at the September meeting by only 50 basis points, rather than 75bp.
USD/JPY Technical
- USD/JPY is testing support at 1.3822. The next support line is at 137.01
- 1.3891 and 1.4012 are resistance lines
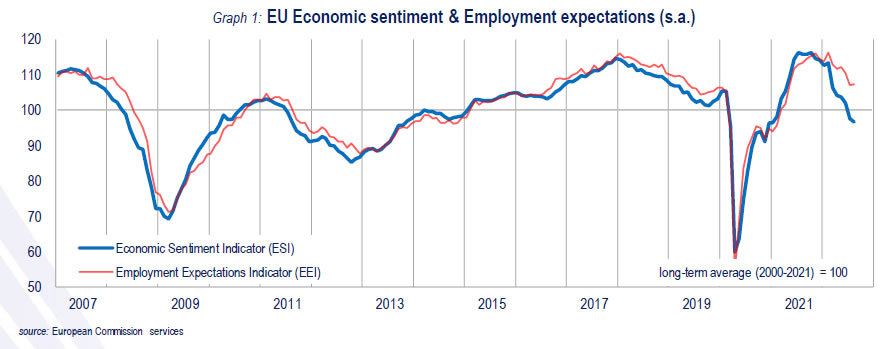
Eurozone economic sentiment dropped to 97.6 in Aug
Eurozone Economic Sentiment Indicator dropped from 98.9 to 97.6 in August, well below expectation of 102.0. Employment Expectation Indicator rose from 107.2 to 108.0. Industry confidence dropped from 3.4 to 1.2. Services confidence dropped from 10.4 to 8.7. Consumer confidence improved from -27.0 to -24.9. Retail trade confidence rose from -7.1 to -6.3.
EU Economic Sentiment Indicator dropped from 97.5 to 96.5. Amongst the largest EU economies, the ESI plummeted in the Netherlands (-4.8) and posted significant declines in Germany (-2.5), France and Poland (both -1.8), as well as Italy (-1.2). Spain stood out with a mild increase (+0.8).
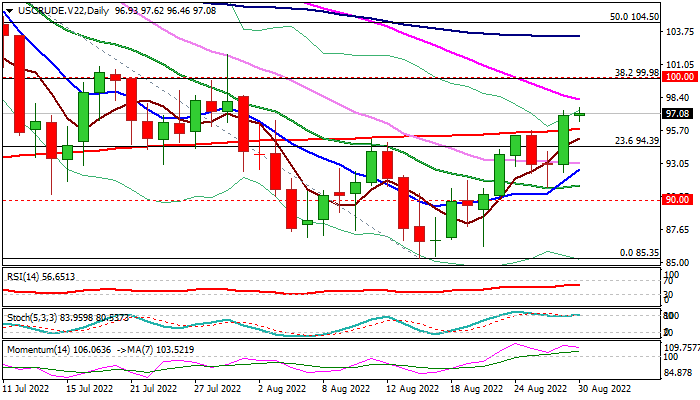
WTI Oil: Recovery Keeps Traction But Remains Weighed by Demand Concerns
WTI oil is consolidating after 4.2% advance on Monday (the biggest one-day gains since July 18), but keeping positive near-term stance, following a bullish signal on Monday’s close above 200DMA ($95.87) which capped the action for some time.
Profit-taking from a three-month fall from $123.65 to $85.35) lifted oil prices, along with improved sentiment, though investors remain concerned by high inflation which is near a double-digit level in a number of Western economies that may spark further aggressive actions in raising interest rates that would cool demand.
The price is also weighed by weakened risk appetite and increased Russia’s oil output that adds to signals of possible recovery stall.
Fresh bulls need a firm breakthrough pivots at $99.00 (daily cloud base( and $100 level (psychological/Fibo 38.2% of $123.65/$85.35) to signal stronger recovery and sideline larger bears.
Otherwise, recovery may lose traction on failure under these barriers, with return below 200DMA tio signal that bears are regaining control.
Res: 97.62; 98.25; 99.00; 100.00.
Sup: 95.87; 95.07; 94.39; 92.28.
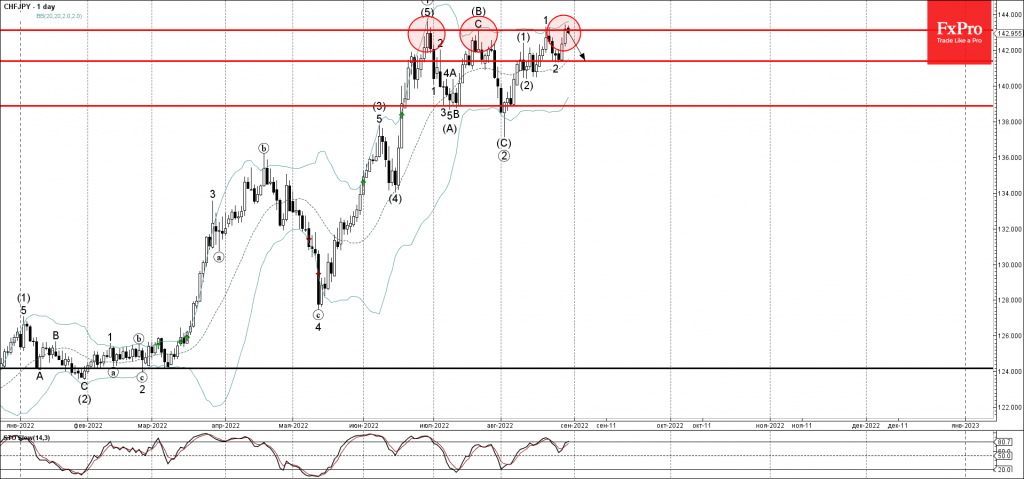
CHFJPY Wave Analysis
- CHFJPY reversed from resistance level 143.00
- Likely to fall to support level 141.35
CHFJPY currency pair recently reversed down from the key resistance level 143.00 (which stopped the previous impulse waves (5) and (B)) intersecting with the upper daily Bollinger Band.
The downward reversal from the resistance level 143.00 stopped the earlier short-term impulse wave 3.
Given strength of the nearby resistance level 143.00 and the overbought daily Stochastic, CHFJPY can be expected to fall further toward the next support level 141.35 (low of the previous wave 2).
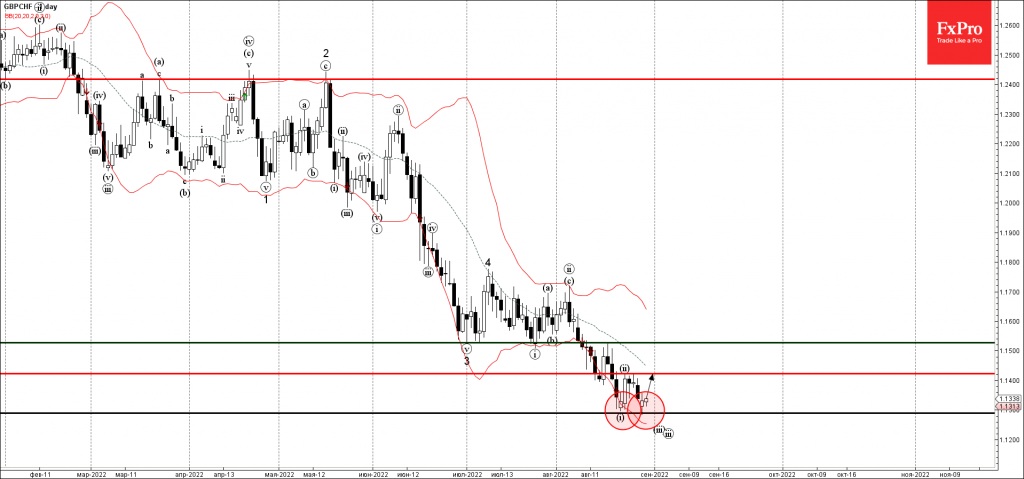
GBPCHF Wave Analysis
- GBPCHF reversed from support level 1.1290
- Likely to rise to resistance level 1.1420
GBPCHF currency pair recently reversed up from the support level 1.1290 (which stopped the previous minor impulse wave (i) earlier this month) standing near the lower daily Bollinger Band.
The upward reversal from the support level 1.1290 stopped the earlier impulse waves iii and (iii).
Given strength of the nearby support level 1.1290, GBPCHF can be expected to rise further toward the next resistance level 1.1420 (top of the previous wave (ii)).
EUR/USD: Extended Sideways Mode Looks for Fresh Direction Signals
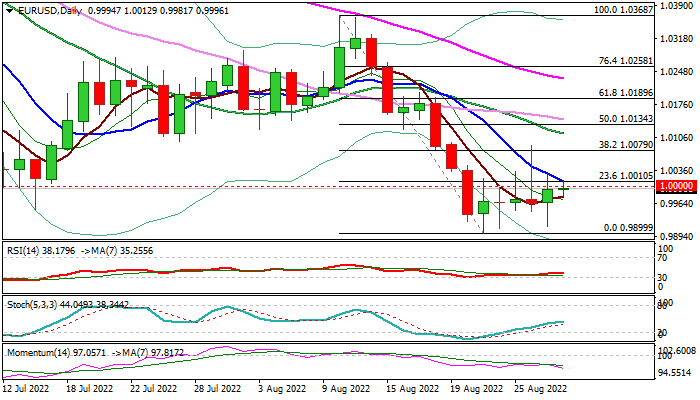
Near-term action remains directionless, with new low at 0.9900 offering strong support and keeping the downside protected, while upticks through parity were so far short-lived and repeatedly failed to register close above, keeping the pair within a narrow range.
Daily and weekly techs remain in bearish configuration and maintain downside pressure, as the pair is on track for the third consecutive strong monthly fall.
From the fundamental side, bears were underpinned by hawkish Fed and Chair Powell’s signals that the period of high interest rates is likely to last until high inflation eases.
On the other side, investors turn their focus on the ECB’s policy meeting next week, expecting the central bank to show strong hawkish stance and go for more aggressive action in policy tightening, as soaring inflation harm the economy.
Markets eye German CPI data today (Aug y/y 7.8% f/c vs July 7.5%), with higher than expected Aug figure to add to expectations of ECB’s 0.75% hike that would offer fresh support to the single currency.
Expect initial bullish signals on close above parity (reinforced by falling 10DMA), which would require confirmation on lift through 1.0080/1.0115 zone (Fibo 38.2% of 1.0368/0.9900/falling 20DMA).
Conversely, sustained break of 0.9900 base would signal bearish continuation.
Res: 1.0029; 1.0079; 1.0115; 1.0134.
Sup: 0.9979; 0.9946; 0.9900; 0.9853.
GBPUSD Turns Bearish Again in Short Term after Dramatic Slump
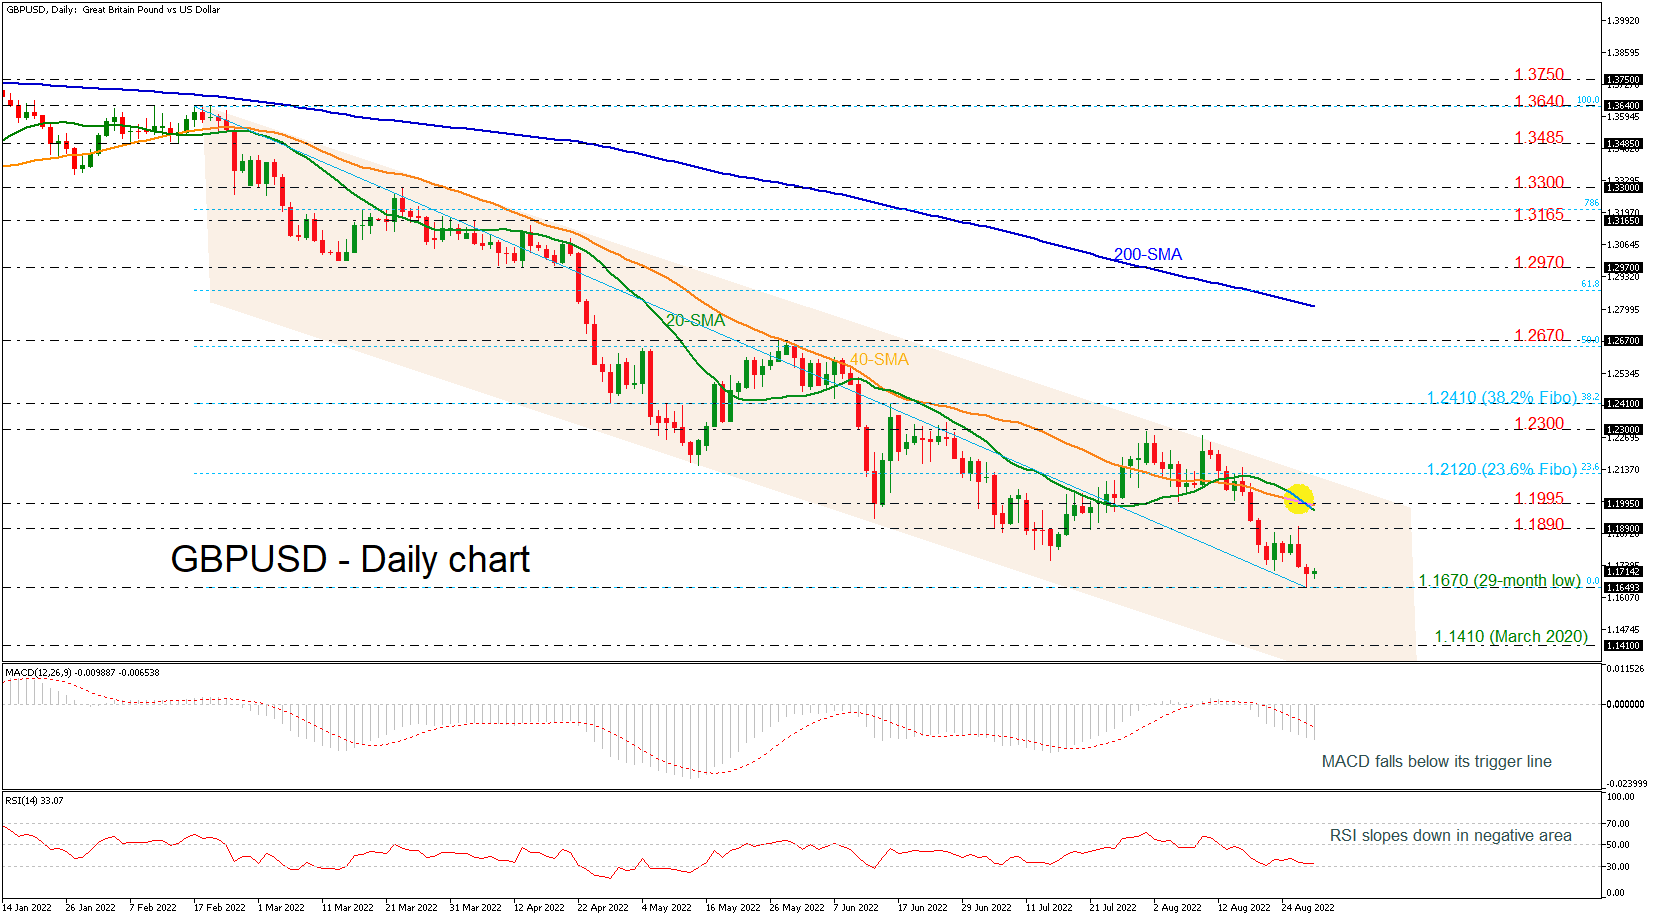
GBPUSD has been underperforming over the past two days, meeting a new 29-month low at 1.1670. When looking at the bigger picture, the pair has been developing within a descending channel since February with the technical indicators confirming the bearish structure.
The MACD oscillator is heading south below its trigger and zero lines, while the RSI is holding near the oversold territory. In trend indicators, the 20- and 40-day simple moving averages (SMAs) posted a bearish crossover and are following the current market price action.
If the 1.1670 support fails, then the focus would be to the downside again towards the 1.1410 mark, registered in March 2020. Additional declines from here may next pause near the 1.1300 psychological mark.
In the event of an upside reversal, the 1.1890-1.1995 resistance area, which encapsulates the short-term SMAs, could be a crucial region to have in mind. A break above it would take the market until the 23.6% Fibonacci retracement level of the downward wave from 1.3640 to 1.1670 at 1.2120, which stands near the descending trend line. More advances may switch the near-term picture to slightly positive, meeting the 1.2300 handle and the 38.2% Fibonacci of 1.2410.
Turning to the long-term picture, the market seems to be in a bearish mode given that the pair is trading below the 200-day SMA and within a downward sloping channel.
EURJPY Looks to Exit Bearish Channel
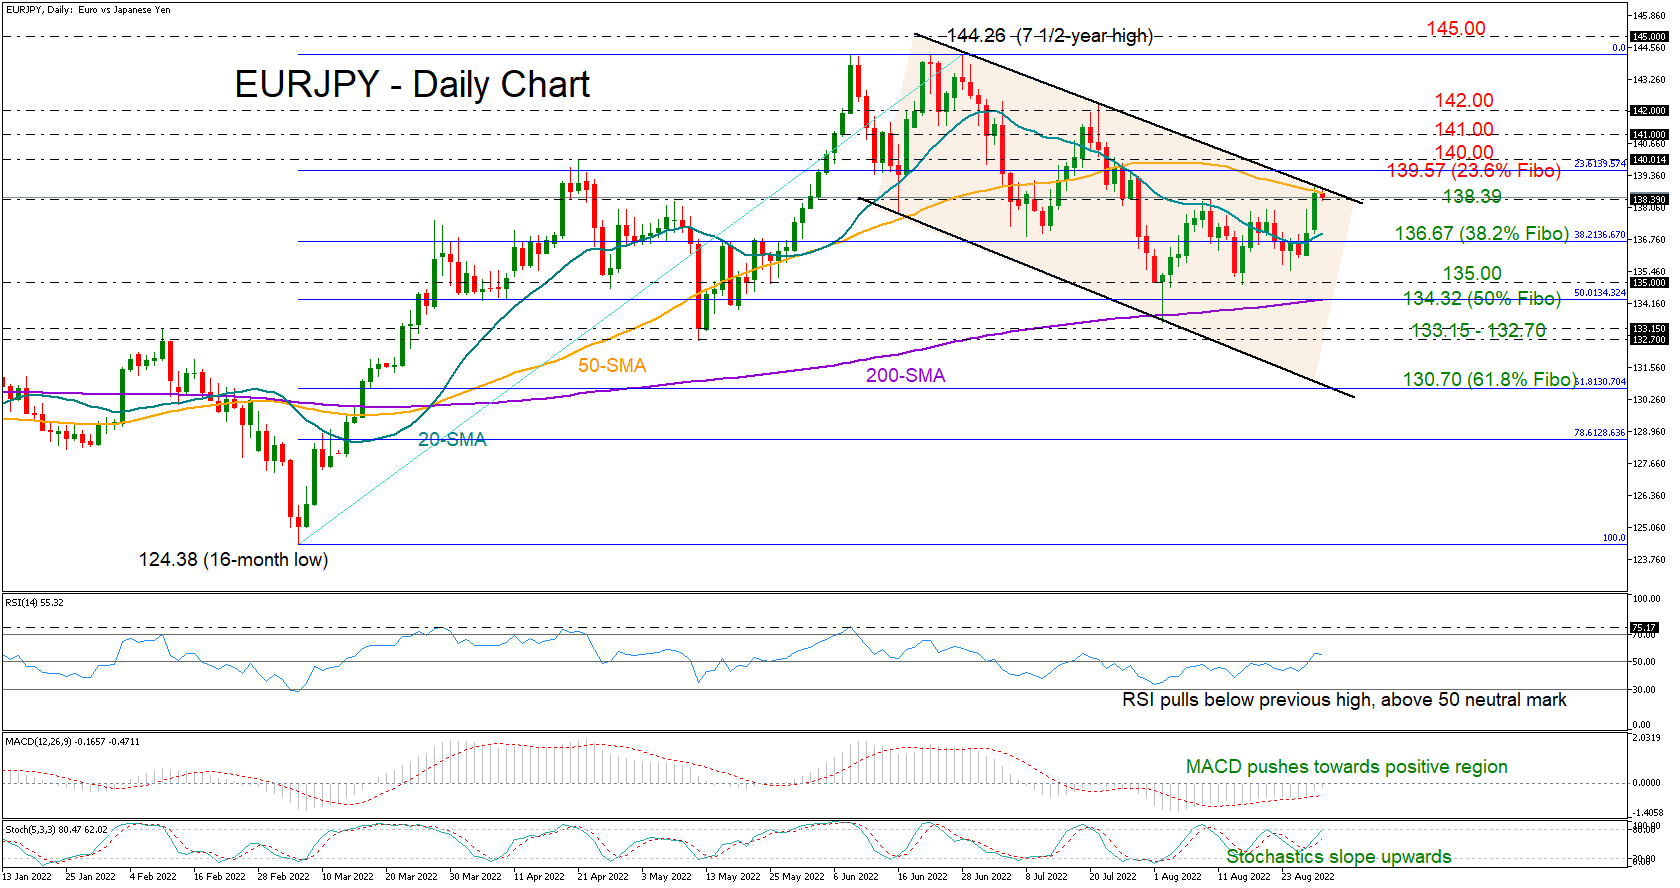
EURJPY had an impressive start to the week, but despite its bold bullish correction up to a one-month high of 138.96, the pair could not exit the bearish channel nor could it close above the 50-day simple moving average (SMA) at 139.00.
Although the MACD keeps pushing towards the positive territory and the stochastics remain positively charged, the RSI suggests that some caution is warranted as the indicator is struggling to overcome its July high.
Should buyers breach the wall at 139.00, resistance could immediately commence somewhere between the 23.6% Fibonacci retracement of the 124.38 – 144.26 upleg at 139.57 and the 140.00 round level. Slightly higher, some congestion may develop within the 141.00 – 142.00 region before the way clears towards the 7½-year high of 144.26.
If the bears take charge soon below the inside swing of 138.39, the 20-day SMA and the 38.2% Fibonacci of 136.67 may attempt to prevent any depreciation towards the 135.00 mark and the 200-day SMA currently intersecting the 50% Fibonacci of 134.32. In the event the sell-off further exacerbates from here, the bears may push for a downtrend resumption under the key support area of 133.15 – 132.70 with scope to reach the channel’s lower boundary around the 61.8% Fibonacci of 130.70.
Summing up, EURJPY is looking cautiously bullish as the price is fighting for an upside channel breakout for the second consecutive day. If efforts prove successful this time, the next barrier could pop up within the 139.57 – 140.00 territory. Otherwise, the next move could be south at 136.67.