

Sample Category Title
Technical Outlook and Review
USD/JPY:
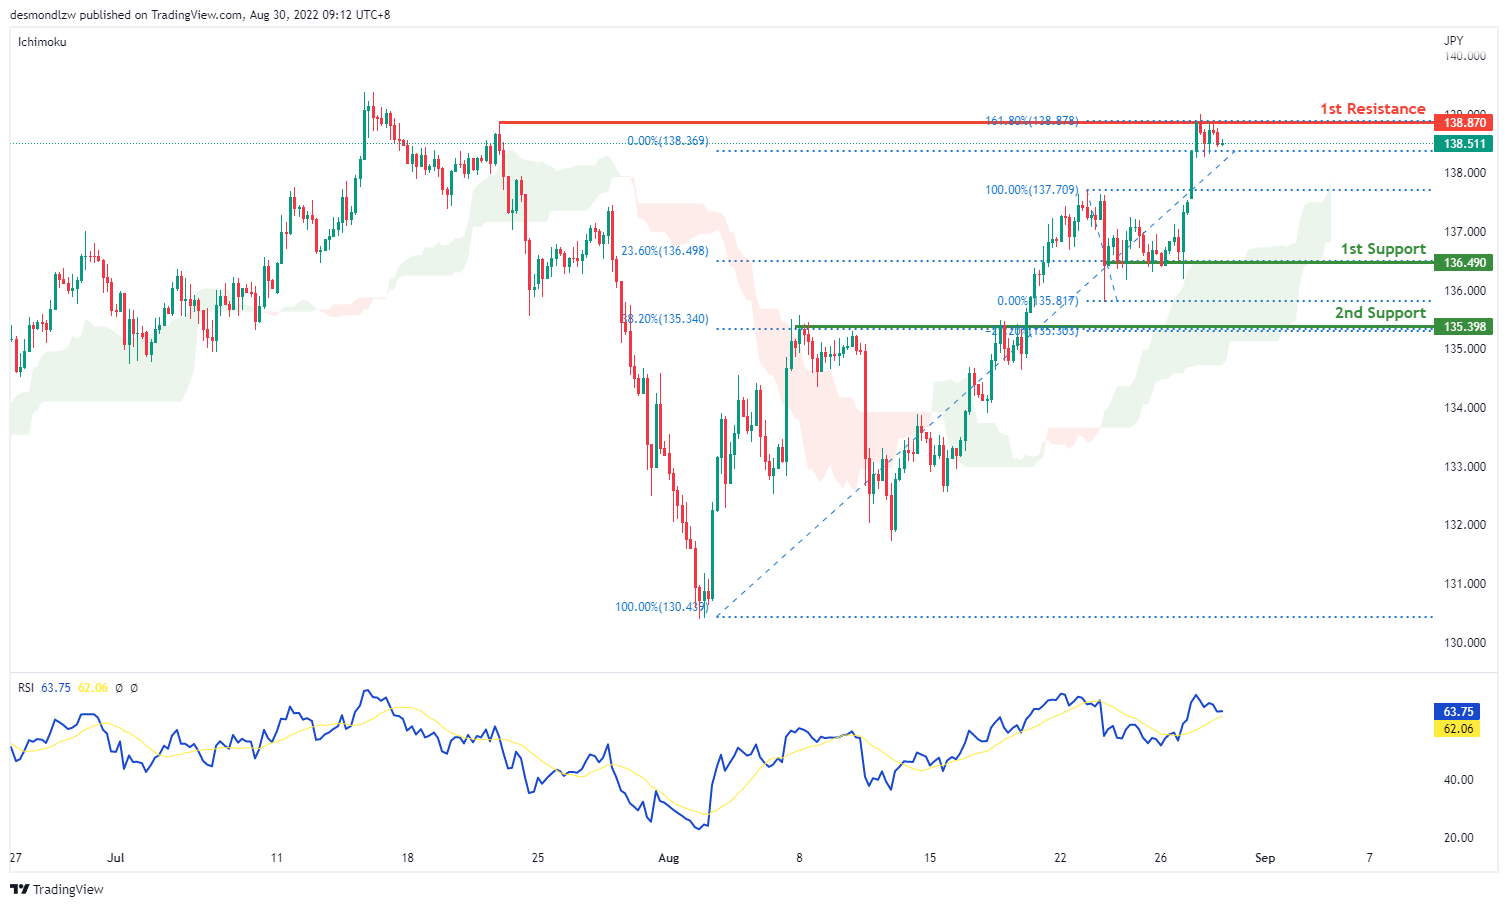
On the H4 chart, price has confirmed a bullish momentum breaking the previous high. We are bullish bias- Price has tested the first resistance at 138.870 where the previous swing high and 161.8% extension sits. If bullish momentum continues, it will bring price to 139.390 where the previous swing high sits. Alternatively, if price reverse, it might pull back to test the first support at 136.490 where the 23.6% fibonacci retracement sits then subsequently the second support at 135.398 where the 38.2% retracement sits
Areas of consideration:
- H4 time frame, 1st resistance at 138.870
- H4 time frame, 1st support at 136.490
DXY:
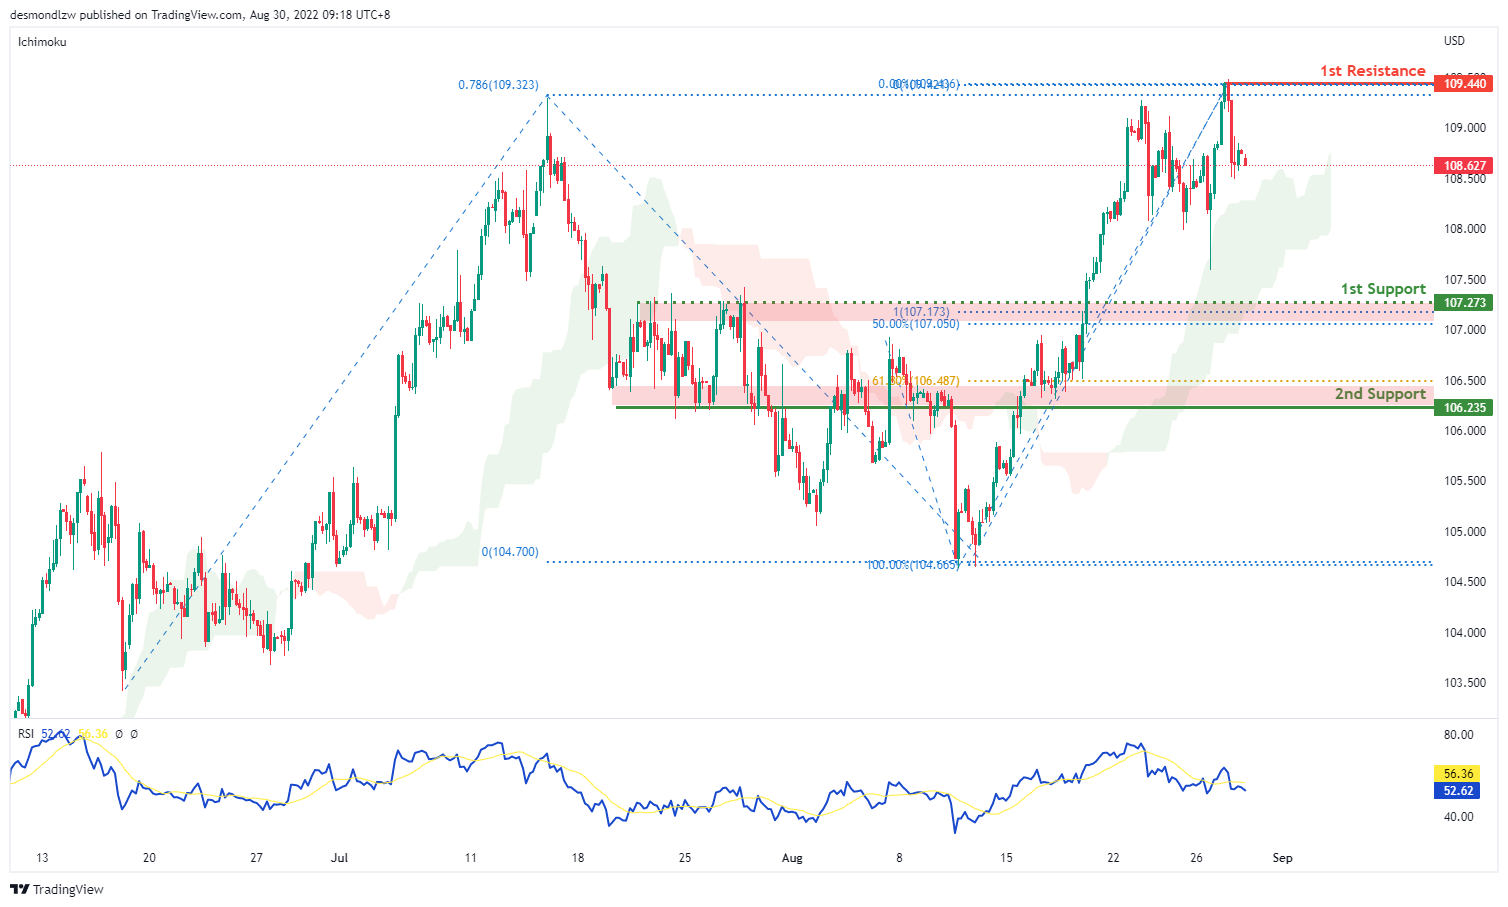
On the H4, price is still moving in an ascending trend and is in a bullish momentum. Price has tested the first resistance at 109.440 where the 78.6% Fibonacci projection and the previous swing high sits. If price fails to break this level, it will pull back to test the first support at 107.273 where the 50% retracement and 100% projection sits and subsequently the second support at 106.235 where the 61.8% retracement sits
Areas of consideration:
- H4 time frame, 1st resistance at 109.440
- H4 time frame, 1st support at 107.273
EUR/USD:
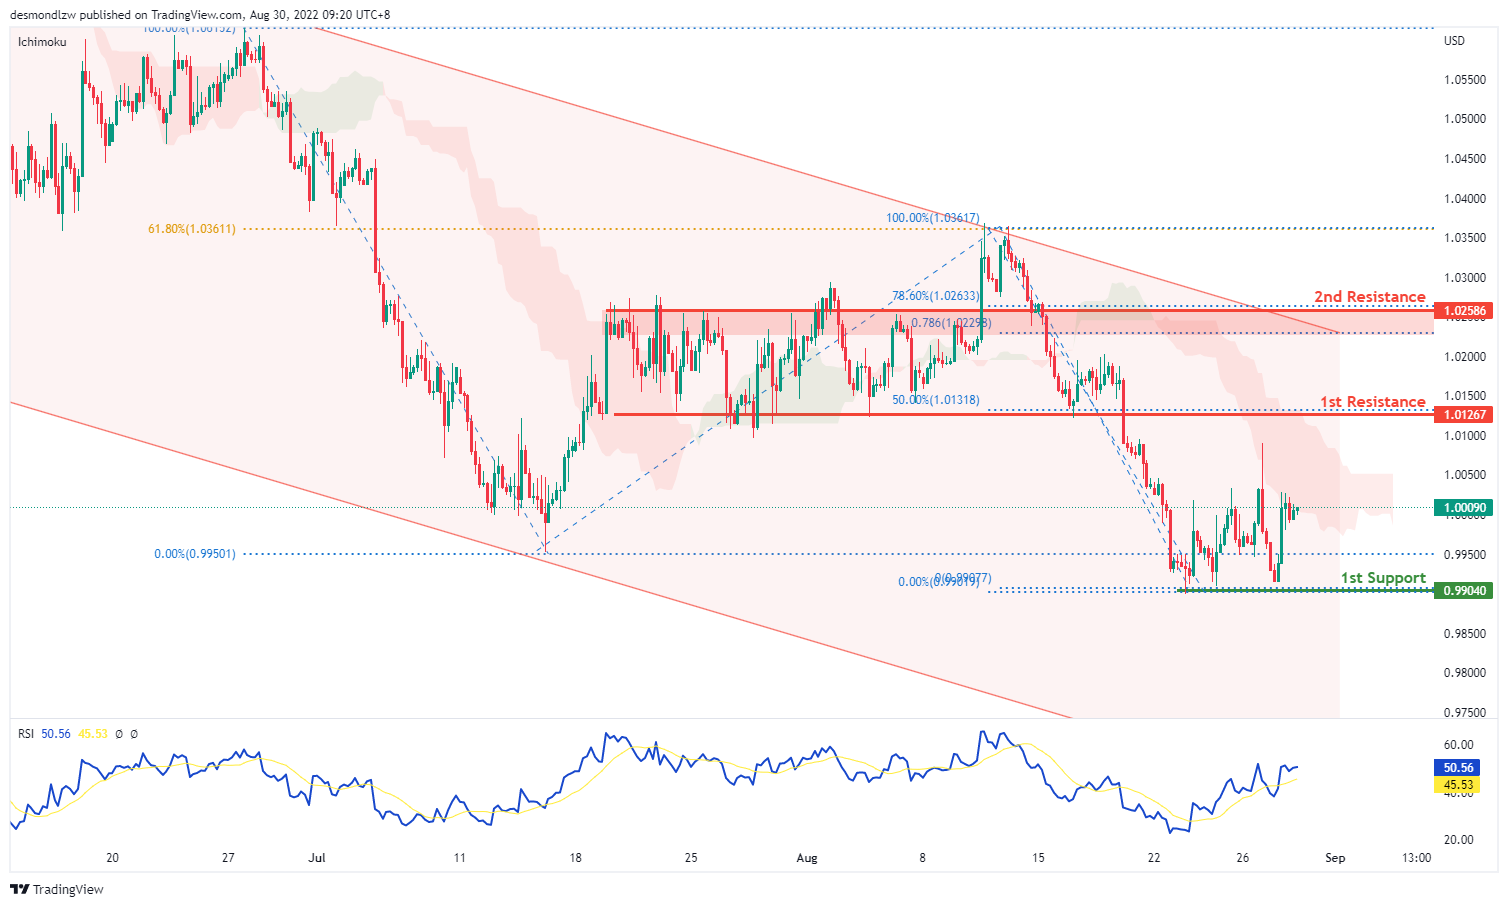
On the H4, prices have tested the first support again at 0.9904 where the 61.8% projection sits. Prices seem to have formed a triple bottom and have reversed – we are in a slightly bullish momentum. Price look like it’s pulling back to test the first resistance at 1.0126 where the previous swing low and 50% retracement sits and subsequently the second resistance at 1.0258 where the 78.6% retracement and swing high sits
Areas of consideration :
- H4 1st resistance at 1.0126
- H4 1st support at 0.9904
GBP/USD:
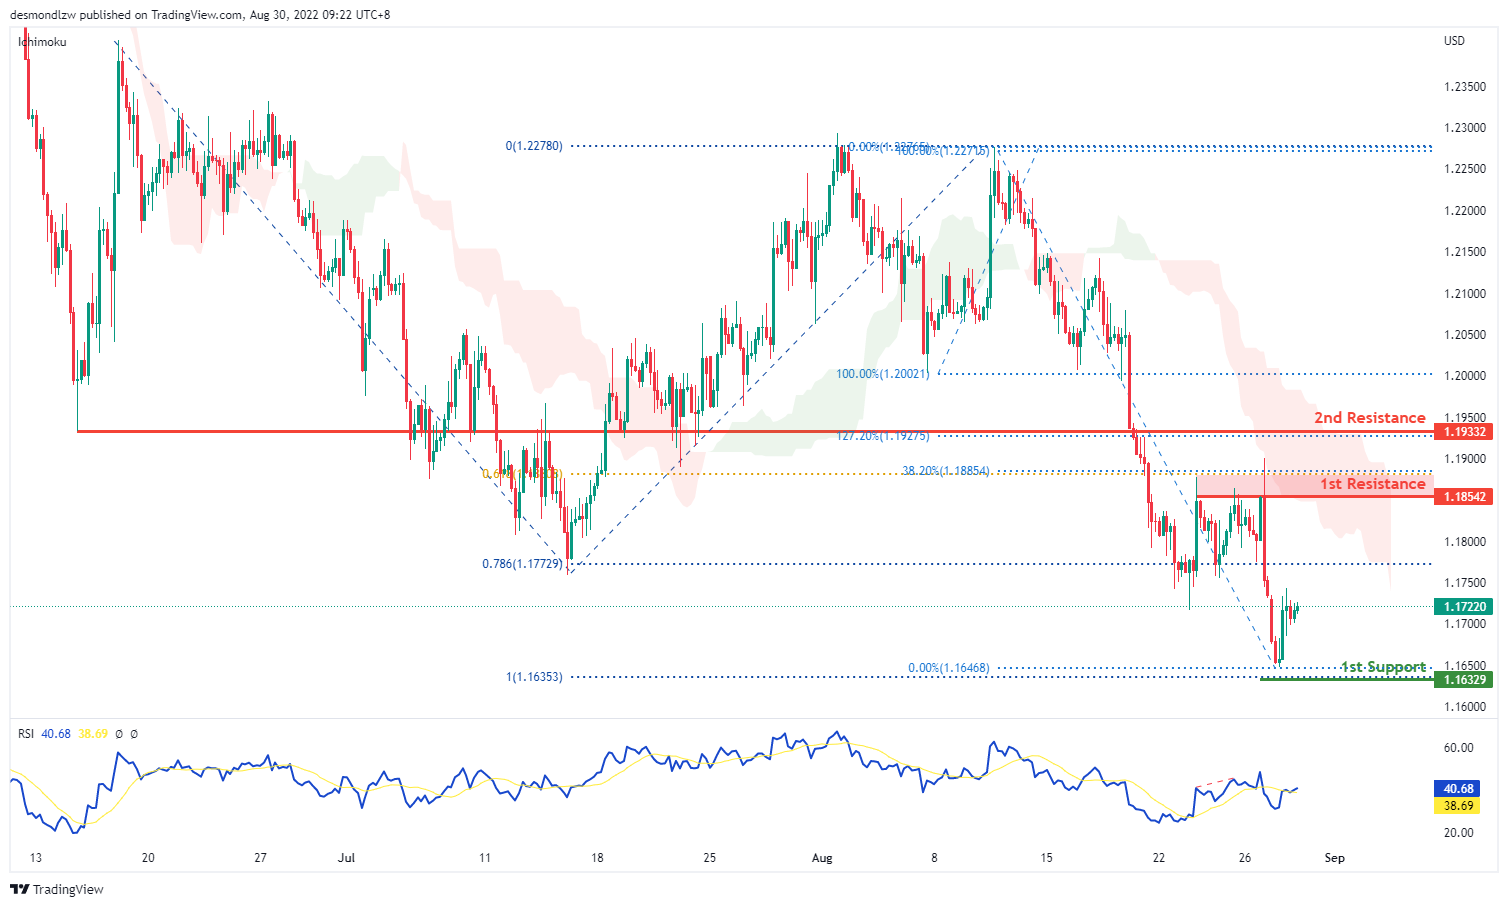
On the H4, prices seem to be in a bearish momentum and respecting the ichimoku cloud. Prices have broken the 78.6% projection level and have tested the first support, 100% projection at 1.1632 levels. Price has pulled back slightly and might look to test the first resistance at 1.1854 level where the 38.2% retracement sit then the second resistance at 1.1933 level where the previous swing low and 127.2% extension sits
Areas of consideration:
- H4 1st resistance at 1.1854
- H4 1st support at 1.1632
USD/CHF:
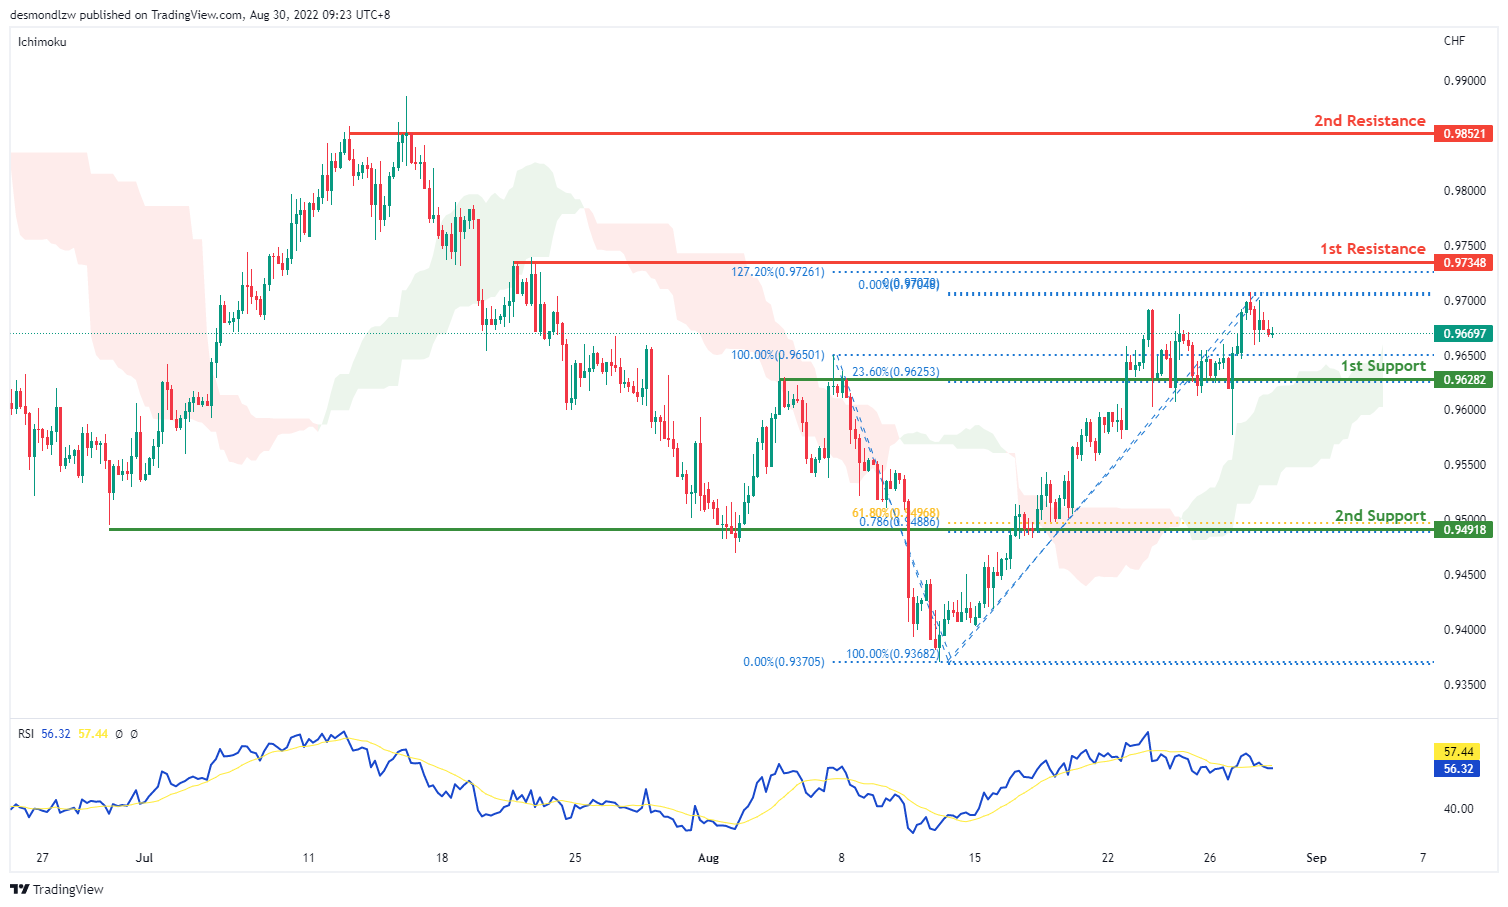
On the H4, with prices moving above the ichimoku cloud and breaking the descending trend, we are bullish bias. We’re looking at price to test the first resistance at 0.9734 where the 127.2% extension sits. If price continues with bullish momentum, it will bring price to second resistance at 0.9852. Alternatively, prices could pull back to test the first support at 0.96282 where the 23.6% fibonacci retracement and previous swing low sits then the second support at 0.9491 where the 61.8% retracement and 78.6% projection sits
Areas of consideration
- H4 1st support at 0.9628
- H4 1st resistance at 0.9734
XAU/USD (GOLD):
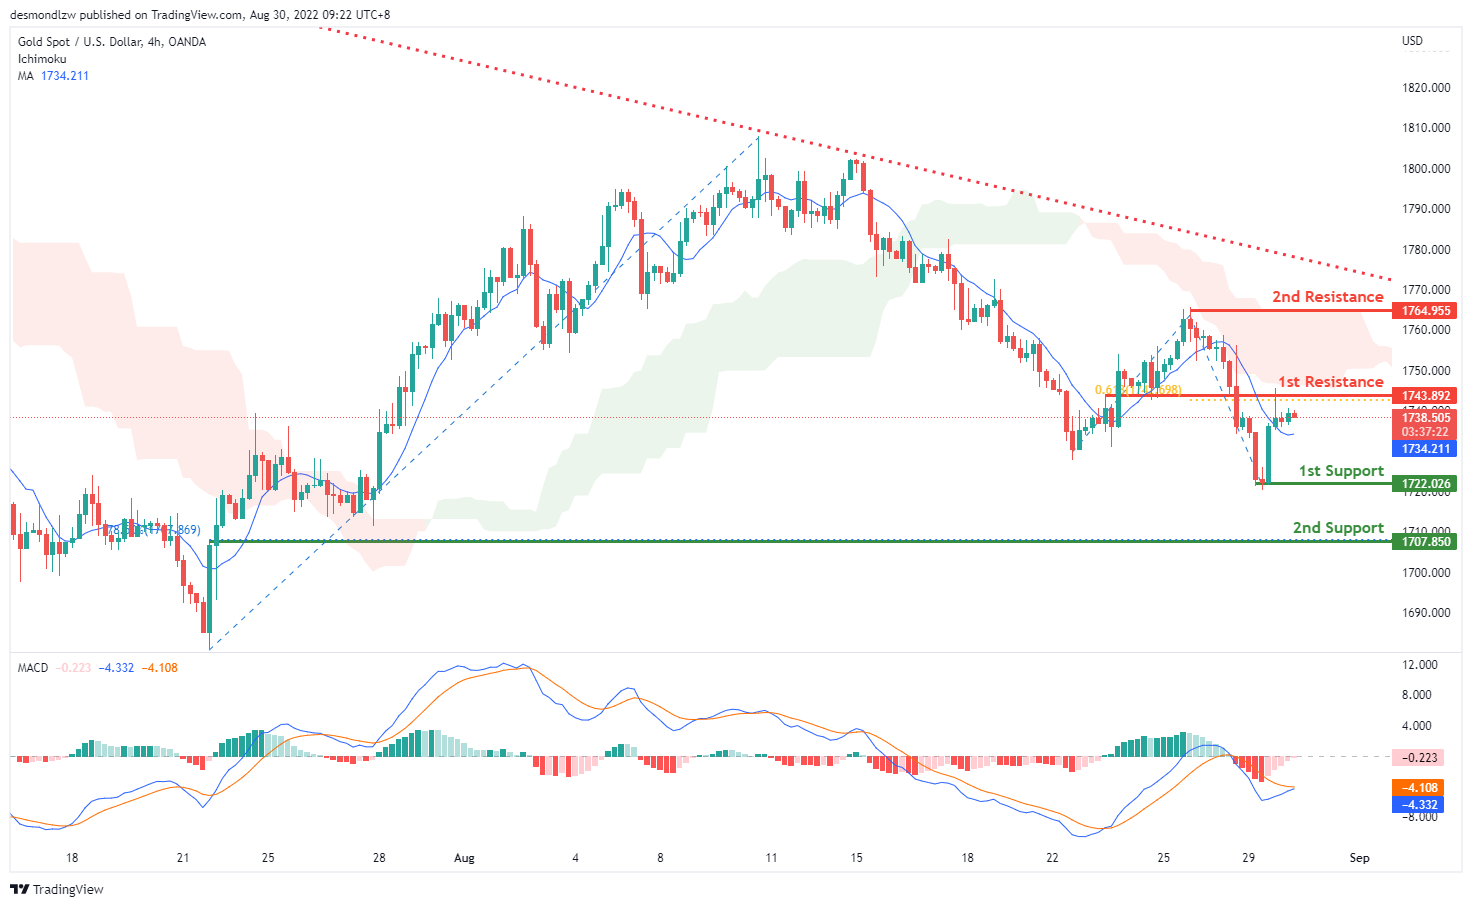
On the H4, with prices moving below ichimoku cloud and long term descending trendline, we have a bearish bias. As the price is above MA and MACD is showing a golden cross signal, we can expect the price bullback to the 1st resistance at 1743.892 first, which is in line with the 61.8% fibonacci projection and then drop to the 1st support at 1722.026, where the swing low is. If the price breaks the 1st support, we can expect the price drop to the 2nd support at 1707.850, where the 78.6% fibonacci retracement is. Alternatively, the price may break the 1st resistance at 1743.892 and then rise to the 2nd resistance at 1764.955, where the swing high is.
Areas of consideration:
- H4 time frame, 1st resistance at 1743.892
- H4 time frame, 1st support at 1722.026
AUD/USD:
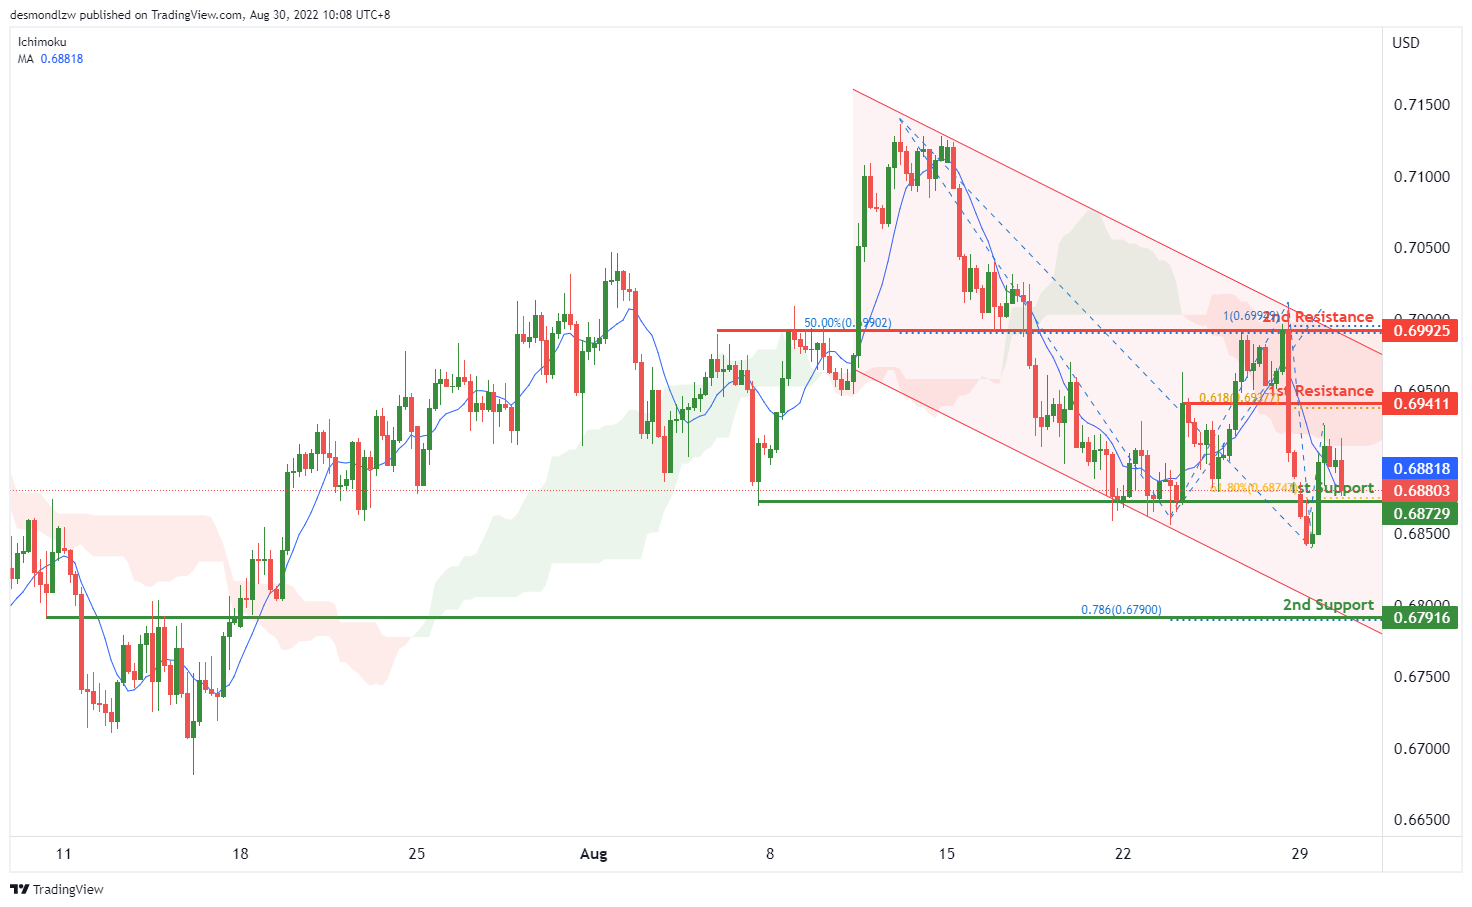
On the H4, with the price moving below the ichimoku cloud and moving within the descending channel, we have a bearish bias that the price may drop from the 1st support at 0.68729, which is in line with the swing lows and 61.8% fibonacci retracement to the 2nd support at 0.67916, where the overlap support and 78.6% fibonacci projection are. Alternatively, the price may rise to the 1st resistance at 0.69411, where the 61.8% fibonacci projection and previous swing high are. If the price can break this resistance level, we can expect the price to rise to the 2nd resistance at 0.69925, where the swing highs, 50% fibonacci retracement and 100% fibonacci projection are.
Areas of consideration
- H4 1st support at 0.68729
- H4 2nd support at 0.67916
NZD/USD:
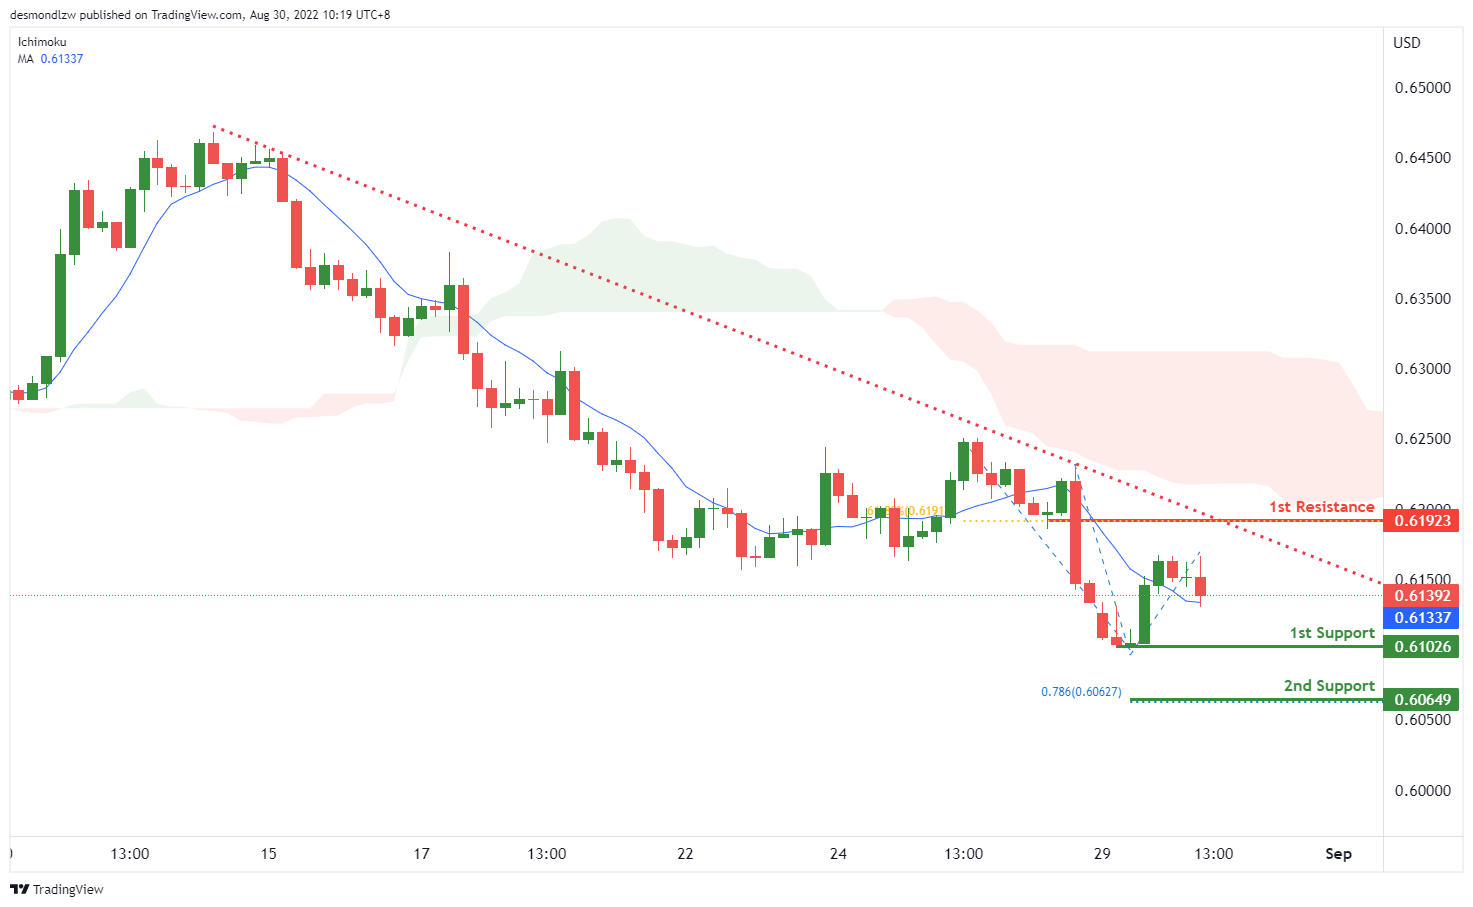
On the H4, with price moving within the descending trendline, below the ichimoku indicator and breaking the MA, we have a bearish bias that price may drop to 1st support at 0.61026, where the swing low is to the 2nd support at 0.60649, where the 78.6% fibonacci projection is. Alternatively, price could rise to 1st resistance at 0.61923, which is in line with 61.8% fibonacci retracement.
Areas of consideration:
- H4 time frame, 1st support at 0.61026
- H4 time frame, 2nd support at 0.60649
USD/CAD:
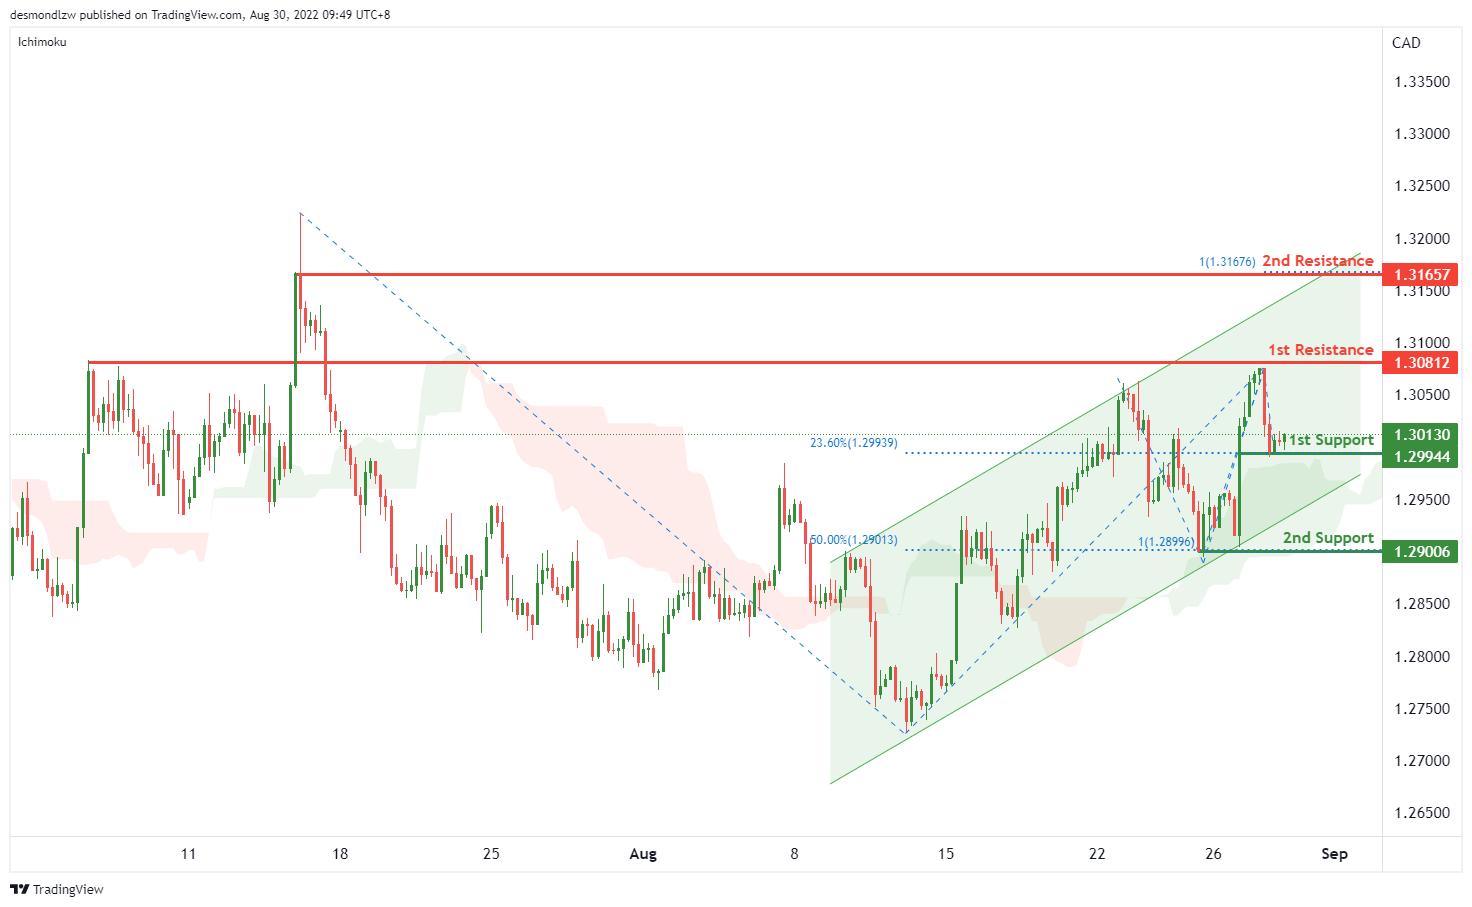
On the H4, with the price moving within the ascending channel, above ichimoku cloud, we have a bullish bias that the price may rise from the 1st support at 1.29944, where the 23.6% fibonacci retracement and swing low are to the 1st resistance at 1.30812, where the swing highs are. If the price can break the 1st resistance, we can expect the momentum to carry the price to the 2nd resistance at 1.31657, where the swing high and 100% fibonacci projection are. Alternatively, price could break the 1st support and drop to the 2nd support at 1.29006, where the 50% fibonacci retracement and 100% fibonacci projection are.
Areas of consideration:
- H4 time frame, 1st support at 1.29944
- H4 time frame, 1st resistance at 1.30812
OIL:
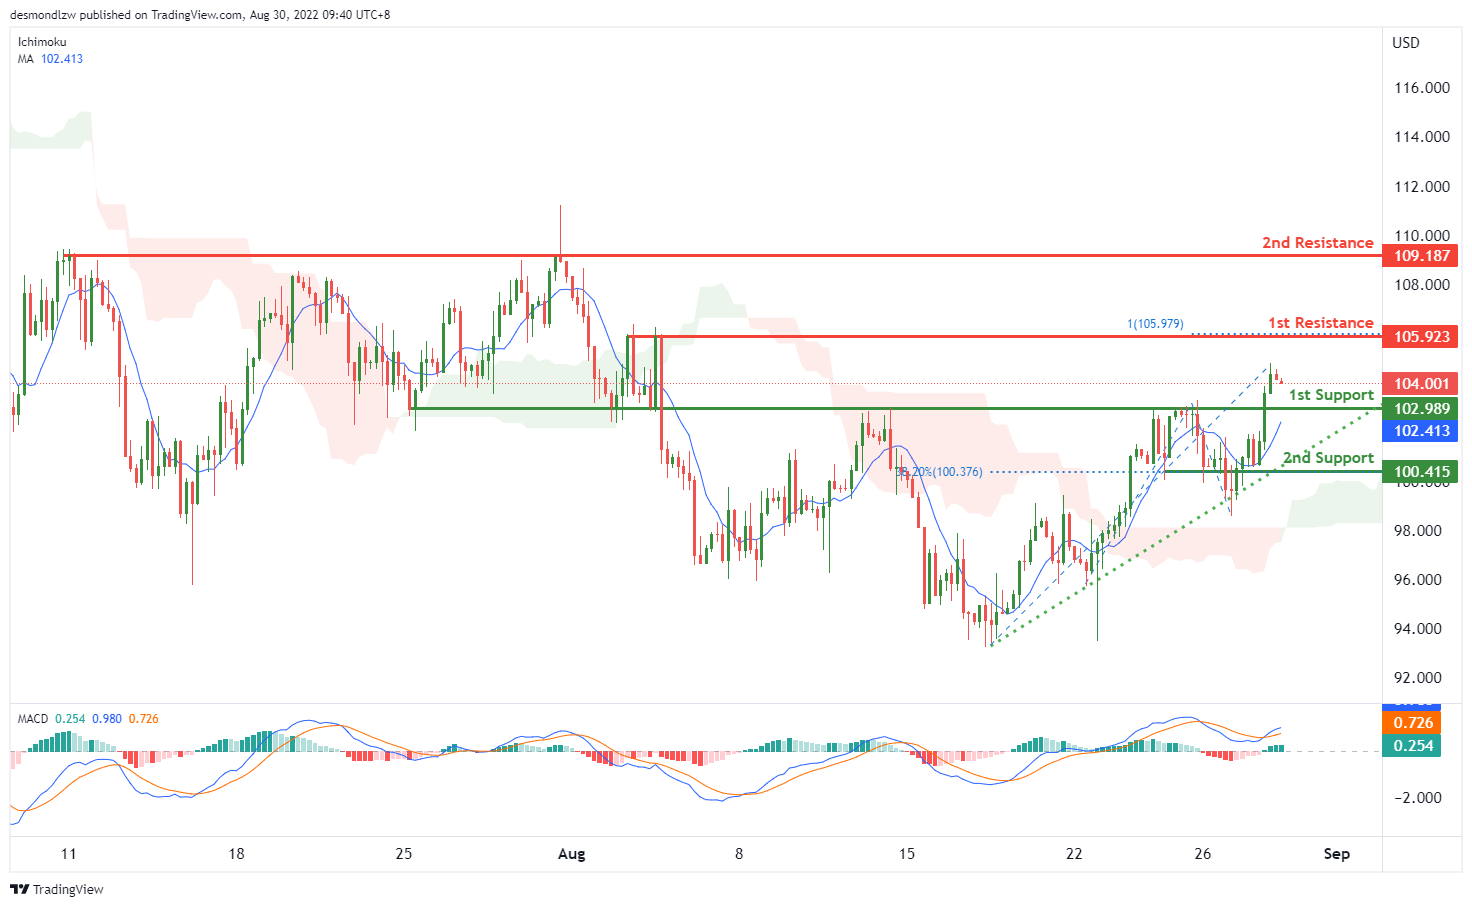
On the H4, with price moving within the ascending trendline, above ichimoku cloud and MA, we have a bullish bias that the price may rise from the 1st support at 102.989, which is in line with the overlap support to the 1st resistance at 105.923, where the swing highs and 100% fibonacci projection are. If the price breaks the 1st resistance, we can expect the price to rise to the 2nd resistance at 109.187, where the previous swing highs are. Alternatively, the price may drop to the 2nd support at 100.415, which is in line with the 38.2% fibonacci retracement.
Areas of consideration:
- H4 time frame, 1st support at 102.989
- H4 time frame, 1st resistance at 105.923
Dow Jones Industrial Average:
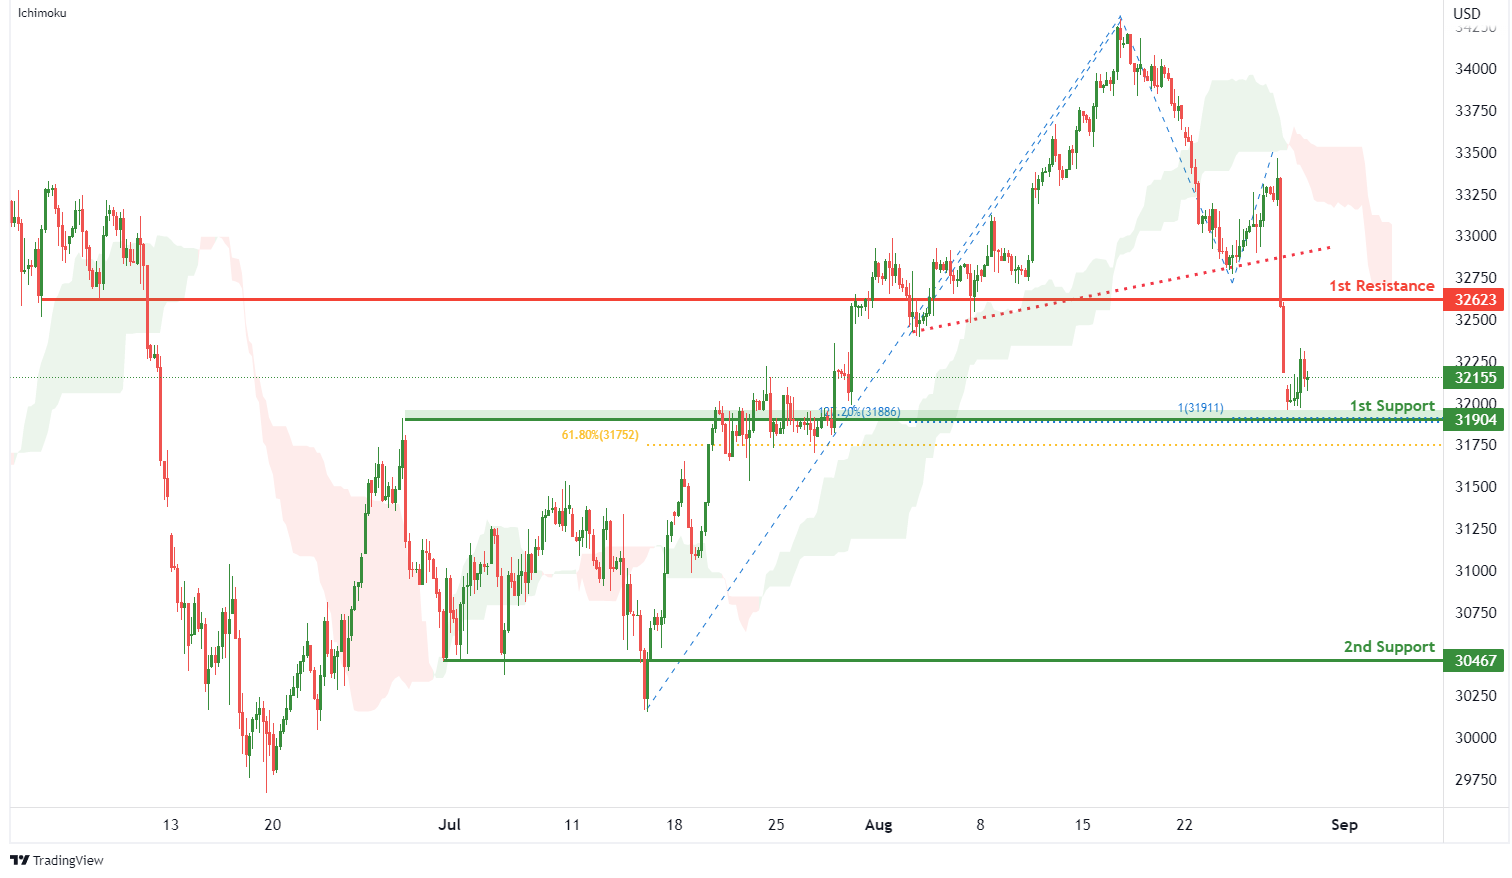
On the H4, with price breaking the ascending trendline and moving below the ichimoku indicator, ,we have a bearish bias that price will drop to 1st support at 31904 where the pullback support, 100% fibonacci projection, 61.8% fibonacci retracement and 127.2% fibonacci extension are. Should price break 1st support, we would expect bearish momentum to carry price to 2nd support at 30467 where the pullback support is. Alternatively, price could rise to 1st resistance at 32623 in line with pullback resistance.
Areas of consideration:
- H4 time frame, 1st resistance of 32623
- H4 time frame, 1st support at 3190
DAX:
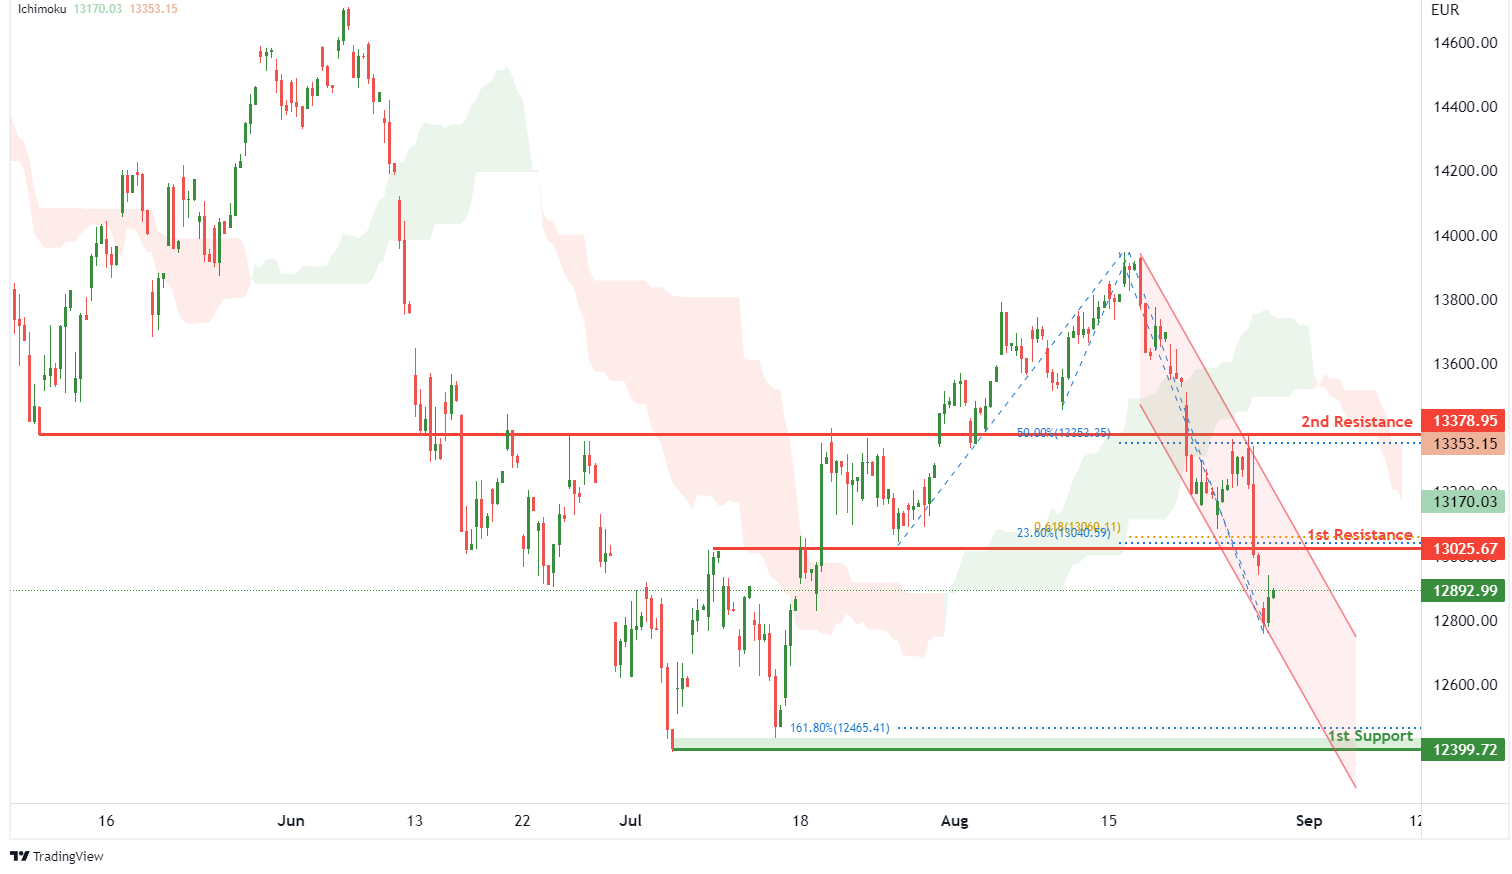
On the H4, with price moving within a descending channel and below the ichimoku indicator, we have a bearish bias that price will drop from 1st resistance at 13025.67 where the pullback resistance, 23.6% fibonacci retracement and 61.8% fibonacci projection are to the 1st support at 12399.72 where the swing low support and 161.8% fibonacci extension are. Alternatively, price could rise to 2nd resistance at 13378.95 where the overlap resistance and 50% fibonacci retracement are.
Areas of consideration:
- H4 time frame, 1st resistance of 13025.67
- H4 time frame, 1st support at 12399.72
ETHUSD:
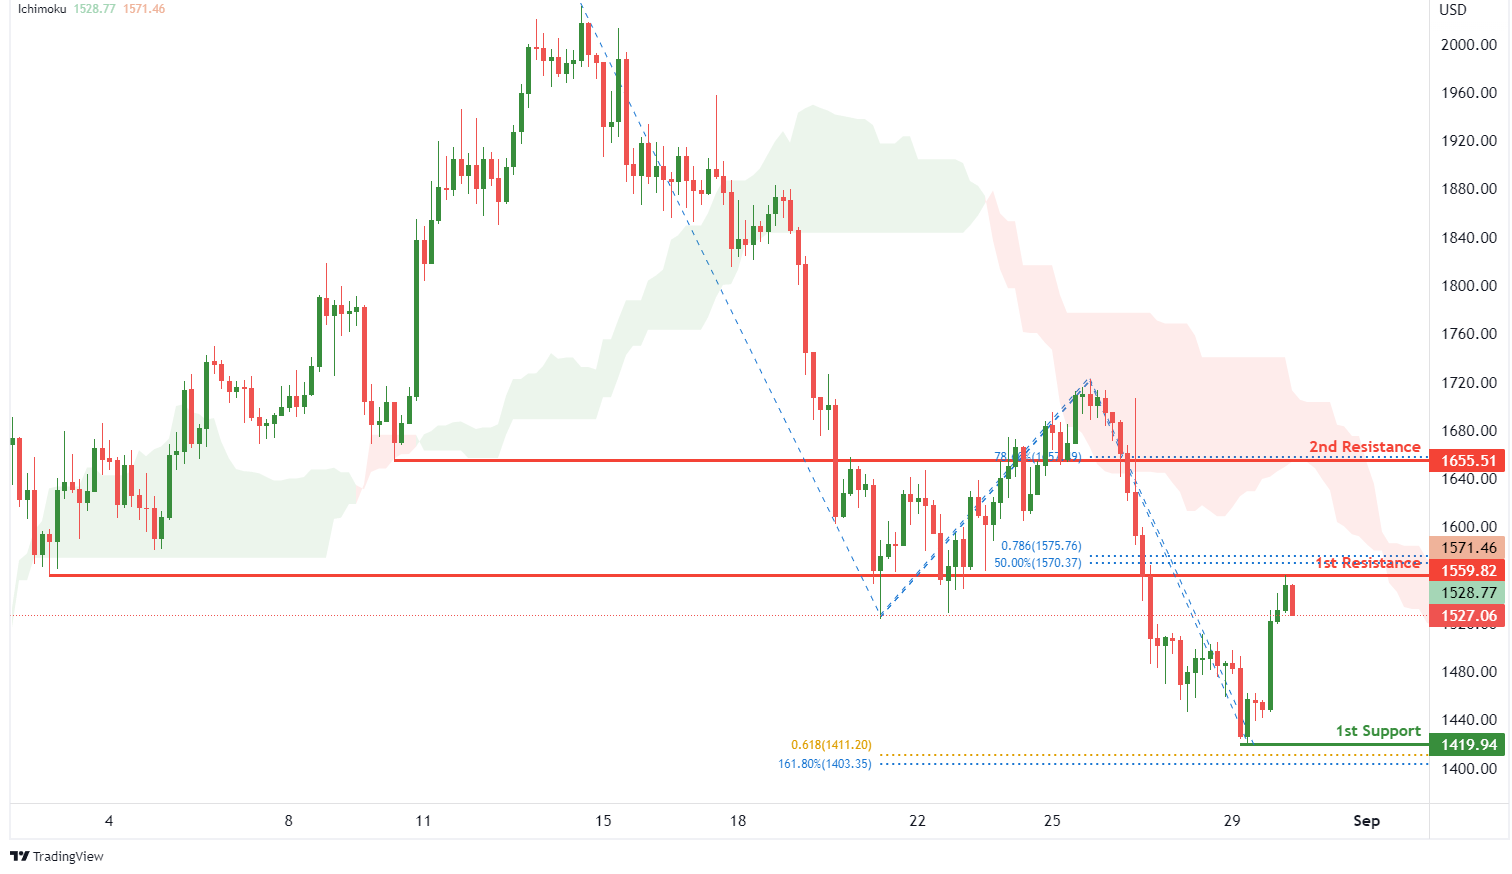
On the H4, with price moving below the ichimoku indicator, we have a bearish bias that price will drop from 1st resistance at 1559.82 where the overlap resistance, 50% fibonacci retracement and 78.6% fibonacci projection are to the 1st support at 1419.94 where the swing low support, 161.8% fibonacci extension and 61.8% fibonacci projection are. Alternatively, price could break 1st resistance structure and rise to 2nd resistance at 1655.51 where the pullback resistance and 78.6% fibonacci retracement are.
Areas of consideration:
- H4 time frame, 1st resistance of 1559.82
- H4 time frame, 1st support at 1419.94
BTCUSD:
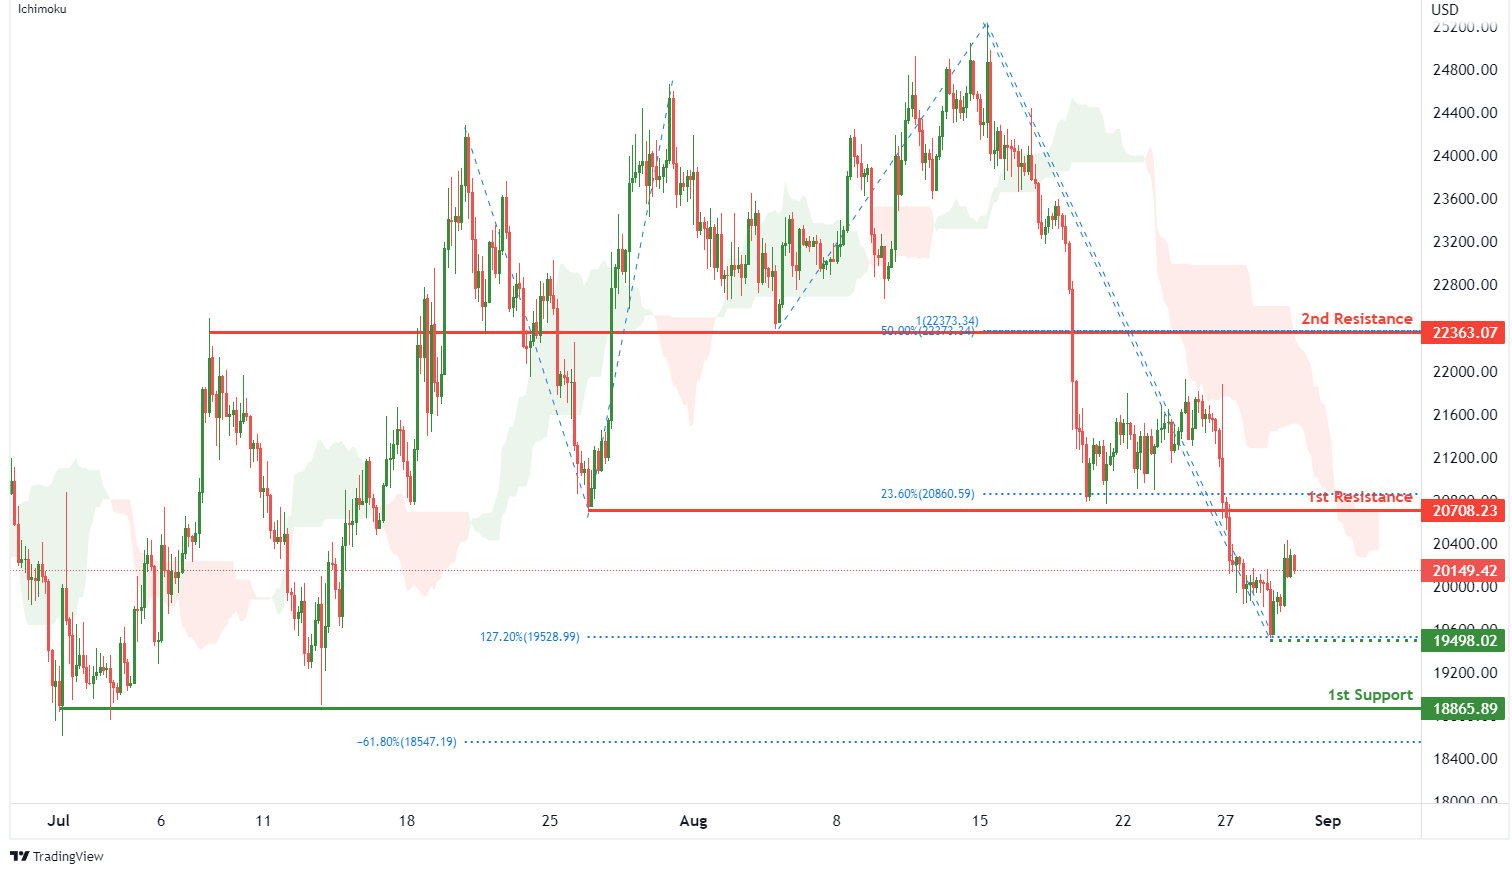
On the H4, with price moving below an ichimoku indicator, we have a bearish bias that price will drop from 1st resistance at 20708.23 where the pullback resistance and 23.6% fibonacci retracement are to the 1st support at 18865.89 where the swing low support and -61.8% fibonacci expansion are. Take note of intermediate support at 19498.02 where the 127.2% fibonacci extension and swing low support are. Alternatively, price could break 1st resistance structure and rise to 2nd resistance at 22363.07 where the overlap resistance, 100% fibonacci projection and 50% fibonacci retracement are.
Areas of consideration:
- H4 time frame, 1st resistance of 20708.23
- H4 time frame, 1st support at 18865.89
S&P 500:
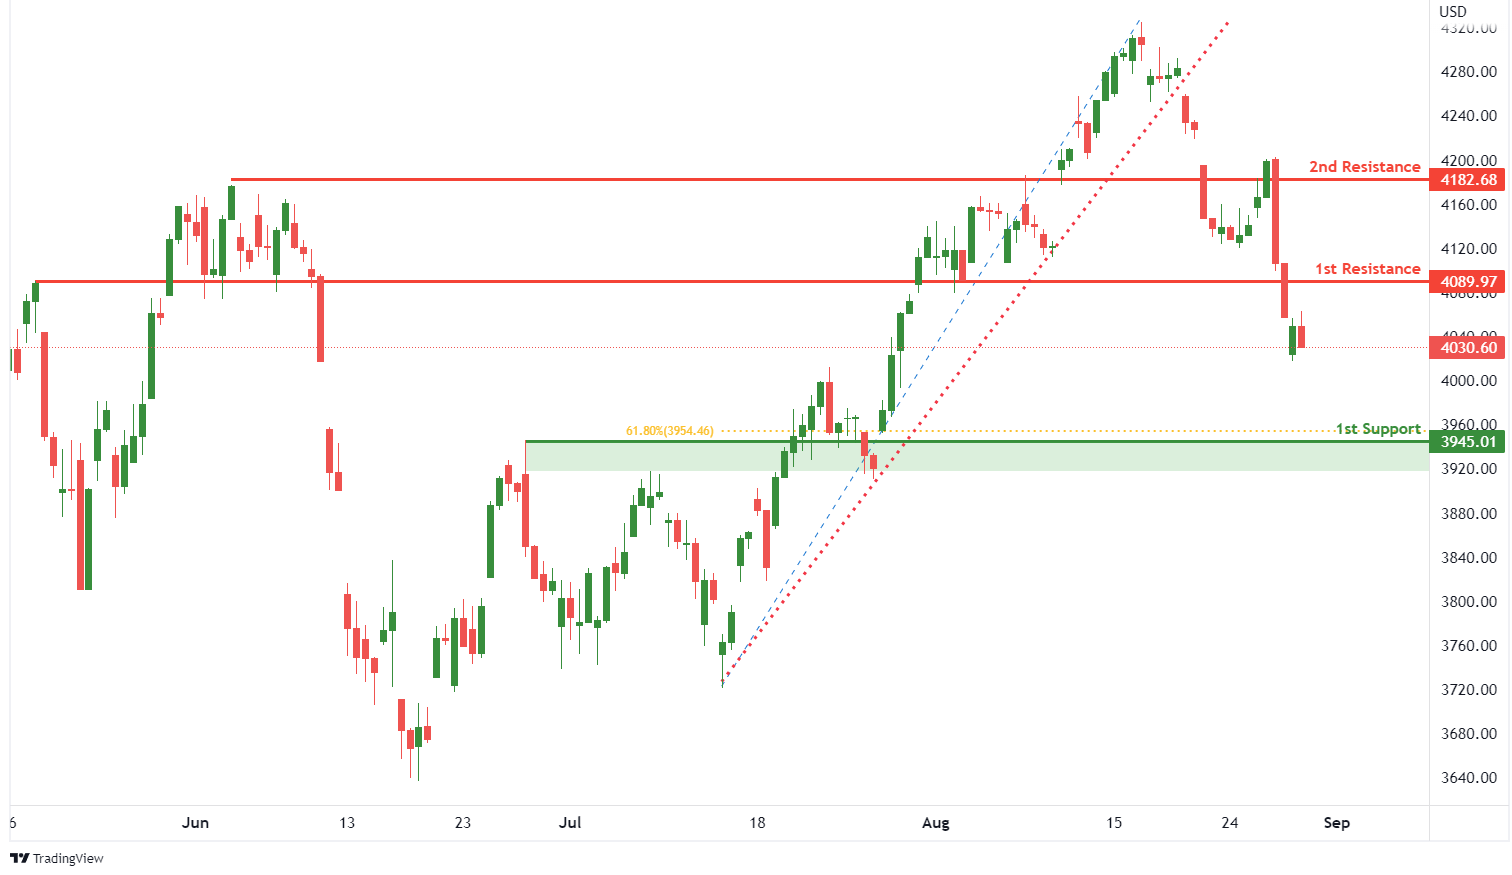
On the H4, with prices breaking out of the ascending trendline, we have a bearish bias that price will drop from 1st resistance at 4089.97 where the pullback resistance is to the 1st support at 3945.01 where the pullback support and 61.8% fibonacci retracement are. Alternatively, price could rise to 2nd resistance at 4182.68 where the pullback resistance is.
Areas of consideration:
- H4 time frame, 1st resistance of 4089.97
- H4 time frame, 1st support at 3945.01
EUR/CHF Daily Outlook
Daily Pivots: (S1) 0.9629; (P) 0.9664; (R1) 0.9714; More....
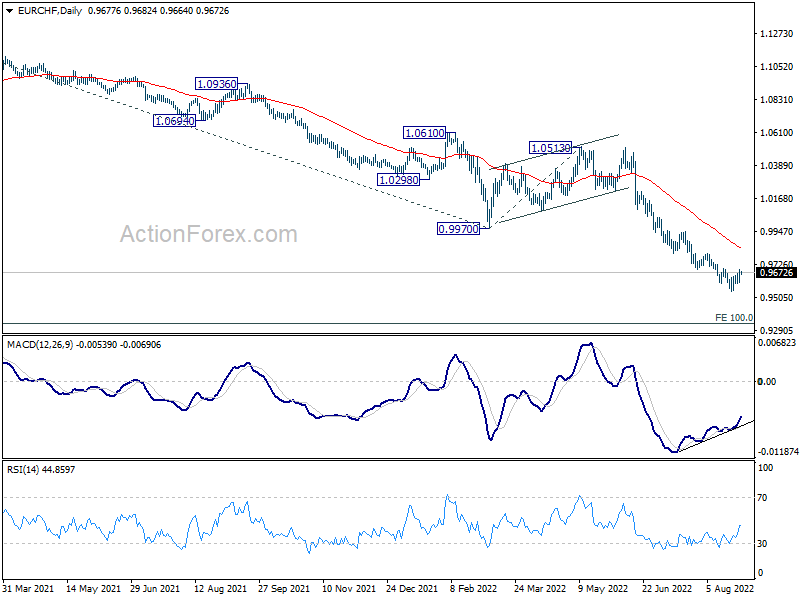
EUR/CHF is staying in range of 0.9550/9698 and intraday bias remains neutral first. Further decline is still in favor. On the downside, break of 0.9550 will resume larger down trend to 100% projection of 1.1149 to 0.9970 from 1.0513 at 0.9334. On the upside, however, firm break of 0.9698 will confirm short term bottoming. Bias will be turned back to the upside for rebound, towards 55 day EMA (now at 0.9838).
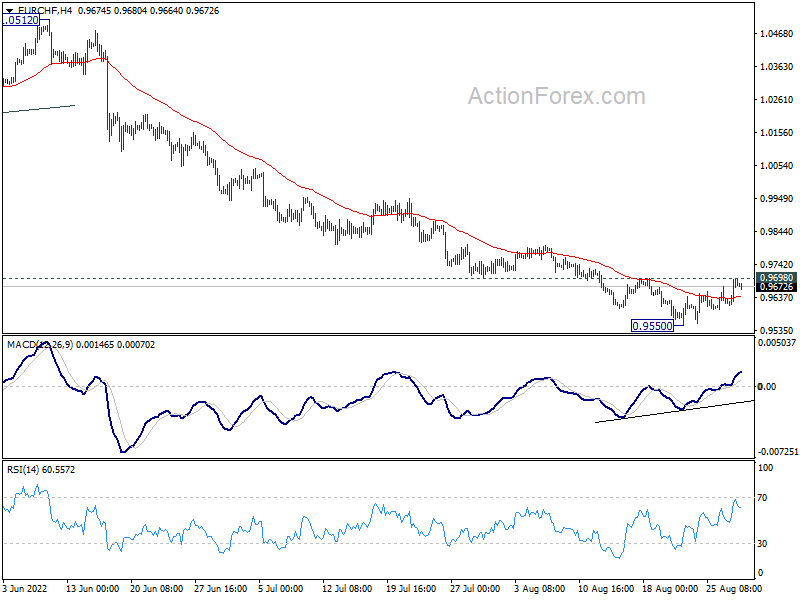
In the bigger picture, long term down trend from 1.2004 (2018 high) is still in progress. Next target is 138.2% projection of 1.2004 to 1.0505 to 1.1149 at 0.9033. On the upside, break of 0.9970 support turned resistance is needed to be the first sign of medium term bottoming. Otherwise, outlook will stay bearish in case of strong rebound.
No Clear Follow Through Buying in Euro Yet
The markets are generally quiet in Asian session today. Euro surged notably yesterday as traders raised their bets on ECB rate hike next week, with some expecting a 75bps increase. But there is no clear follow through buying for now. While Dollar is paring some recent gains, loss is also limited. For now, Sterling, Swiss Franc, and Yen are on the softer side. Traders are waiting for upcoming data including Eurozone CPI and US non-farm payroll to make a bigger bet.
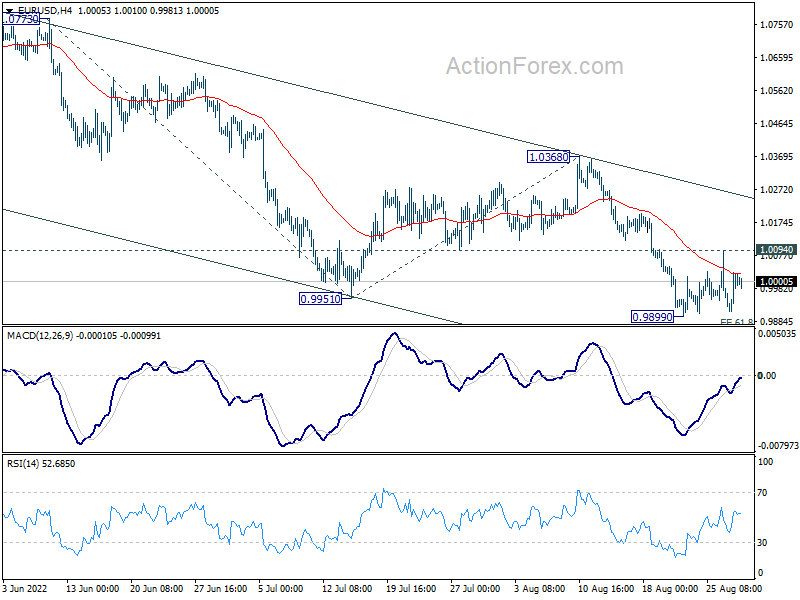
Technically, while Euro looks strong, it hasn't clear out near term resistance level in some pairs yet. The levels include 1.0094 minor resistance in EUR/USD, and 0.9698 minor resistance in EUR/CHF. These two levels need to be decisively taken out to confirm the come back of Euro. Otherwise, momentum in other crosses could be somewhat capped.
In Asia, at the time of writing, Nikkei is up 1.19%. Hong Kong HSI is down -0.90%. China Shanghai SSE is down -0.57%. Singapore Strait Times is up 0.52%. Japan 10-year JGB yield is down -0.0093 at 0.234. Overnight, DOW dropped -0.57%. S&P 500 dropped -0.67%. NASDAQ dropped -1.02%. rose 0.073 to 3.110.
Fed Kashkari: Only relax on compelling evidence that inflation on its way down
Minneapolis Fed President Neel Kashkari said yesterday, "By many, many measures we are at maximum employment and we are at very high inflation. So this is a completely unbalanced situation, which means to me it's very clear: We need to tighten monetary policy to bring things into balance."
"When inflation is 8% or 9%, we run the risk of unanchoring inflation expectations and leading to very bad outcomes that would cause us to have to be very aggressive -- Volcker-esque -- to then re-anchor them," he said.
"We definitely want to avoid allowing that situation to develop. So with inflation this high, for me, I'm in the mode of we need to err on making sure we're getting inflation down, and only relax when we see compelling evidence that inflation is well on its way back down to 2%," he said.
ECB Lane: Meeting-by-meeting approach suited as policy move away from lower bound
ECB Chief Economist Philip Lane said in a speech yesterday that the upcoming September monetary policy meeting will be the "start of a new phase" for the central bank. This new phase consists of a " meeting-by-meeting (MBM) approach" to setting interest rates.
At a basic level, the transition from rate forward guidance to the MBM approach is in line with our monetary policy strategy, which assessed that forward guidance was primarily an appropriate response to the lower bound constraint," he said. "As policy rates move away from the lower bound, the inherent flexibility of the MBM approach is better suited to calibrating monetary policy in a highly uncertain environment."
Lane also explained that the MBM approach essentially has "two elements", the terminal rate, and the speed to close the gap between prevailing interest rate and the assessed terminal rate.
On the data front
Japan unemployment rate was unchanged at 2.6% in July, matched expectations. Australia building permits dropped sharply by -17.2% mom in July, versus expectation of -2.8% mom.
Looking ahead, Swiss KOF economic barometer, UK mortgage approvals and M4 money supply; Eurozone economic sentiment indicator, and Germany CPI flash will be released in European session.
Later in the day, US will release house price index and consumer confidence.
EUR/CHF Daily Outlook
Daily Pivots: (S1) 0.9629; (P) 0.9664; (R1) 0.9714; More....
EUR/CHF is staying in range of 0.9550/9698 and intraday bias remains neutral first. Further decline is still in favor. On the downside, break of 0.9550 will resume larger down trend to 100% projection of 1.1149 to 0.9970 from 1.0513 at 0.9334. On the upside, however, firm break of 0.9698 will confirm short term bottoming. Bias will be turned back to the upside for rebound, towards 55 day EMA (now at 0.9838).
In the bigger picture, long term down trend from 1.2004 (2018 high) is still in progress. Next target is 138.2% projection of 1.2004 to 1.0505 to 1.1149 at 0.9033. On the upside, break of 0.9970 support turned resistance is needed to be the first sign of medium term bottoming. Otherwise, outlook will stay bearish in case of strong rebound.
Economic Indicators Update
| GMT | Ccy | Events | Actual | Forecast | Previous | Revised |
|---|---|---|---|---|---|---|
| 23:30 | JPY | Unemployment Rate Jul | 2.60% | 2.60% | 2.60% | |
| 01:30 | AUD | Building Permits M/M Jul | -17.20% | -2.80% | -0.70% | -0.60% |
| 07:00 | CHF | KOF Leading Indicator Aug | 88.6 | 90.1 | ||
| 08:30 | GBP | Mortgage Approvals Jul | 62K | 64K | ||
| 08:30 | GBP | M4 Money Supply M/M Jul | 0.00% | -0.30% | ||
| 09:00 | EUR | Eurozone Economic Sentiment Indicator Aug | 102 | 99 | ||
| 09:00 | EUR | Eurozone Industrial Confidence Aug | 1.5 | 3.5 | ||
| 09:00 | EUR | Eurozone Services Sentiment Aug | 8.8 | 10.7 | ||
| 09:00 | EUR | Eurozone Consumer Confidence Aug F | -24.9 | -24.9 | ||
| 12:00 | EUR | Germany CPI M/M Aug P | 0.40% | 0.90% | ||
| 12:00 | EUR | Germany CPI Y/Y Aug P | 7.80% | 7.50% | ||
| 12:30 | CAD | Current Account (CAD) Q2 | 3.5B | 5.0B | ||
| 13:00 | USD | S&P/Case-Shiller Home Price Indices Y/Y Jun | 19.80% | 20.50% | ||
| 13:00 | USD | Housing Price Index M/M Jun | 0.80% | 1.40% | ||
| 14:00 | USD | Consumer Confidence Aug | 97.6 | 95.7 |
Fed Kashkari: Only relax on compelling evidence that inflation on its way down
Minneapolis Fed President Neel Kashkari said yesterday, "By many, many measures we are at maximum employment and we are at very high inflation. So this is a completely unbalanced situation, which means to me it's very clear: We need to tighten monetary policy to bring things into balance."
"When inflation is 8% or 9%, we run the risk of unanchoring inflation expectations and leading to very bad outcomes that would cause us to have to be very aggressive -- Volcker-esque -- to then re-anchor them," he said.
"We definitely want to avoid allowing that situation to develop. So with inflation this high, for me, I'm in the mode of we need to err on making sure we're getting inflation down, and only relax when we see compelling evidence that inflation is well on its way back down to 2%," he said.
Loonie Awaits Q2 GDP Data after Depressing Week; OPEC in Focus as Well
Canada will report GDP data for the second quarter on Wednesday at 12:30 GMT as investors largely expect a bold rate increase in September. The figures will follow another depressing week for the loonie versus the US dollar, but even if they are arrive encouraging, they may not be able to provide a strong helping hand to the currency. The US nonfarm payrolls report due on Friday and next week’s OPEC meeting will be the next highlights in the calendar.
Canada to report stronger GDP figures in Q2
The Canadian economy has likely regained positive momentum during the second quarter, with analysts estimating an annualized expansion of 4.5% (quarter-over-quarter) compared to 3.1% registered in the first three months of the year. The monthly reading for June is also expected to show a negligible improvement, inching to 0.1% from no growth previously.
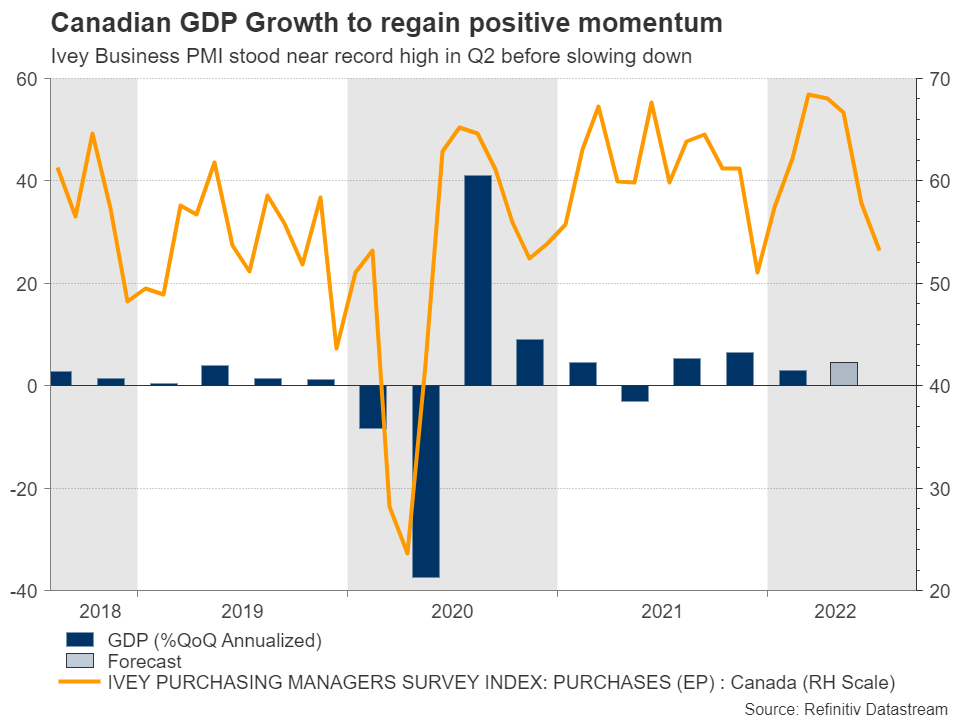
There is plenty of data to support a potential pickup in Canadian activity during the aforementioned period. On the supply side, the Ivey business PMI remained elevated close to its March record high, while exports continued to grow faster than imports, boosting the trade surplus to the highest in 14 years. Given that Canada largely depends on energy exports, higher oil prices have likely generated more revenue for businesses, putting the economy in a better place than the US.
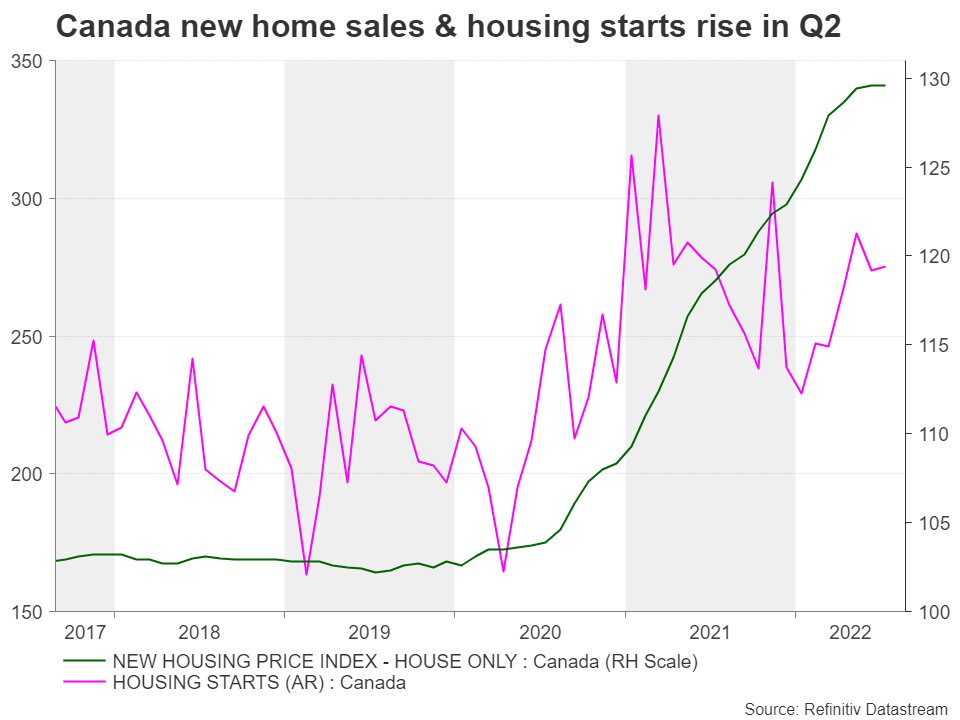
On the demand side, consumption was contributive too. With the unemployment rate pinned at record lows, retail sales marked six months in the expansion area from March onwards, while the continuous growth in housing starts and home prices reflected increasing appetite for spending despite the rising interest rates and the burdening household debt.
BoC may stay aggressive
Hence, although the recession risk has become more real than a statistical probability in the face of the Ukrainian war, the covid infections, as well as the climate change, which have further worsened supply jitters, the Bank of Canada may follow the Fed’s footsteps and not give up monetary tightening until it sees a sustainable decline in inflation. Besides, it's either allowing inflation to destroy the economy itself and become entrenched, or pressing the economy through higher interest rates anyway to stabilize prices. Apparently, policymakers have chosen the second option and will not allow inflation to dominate without a fight, even if the 10-year bond yields have slumped below the 2-year yields recently, flagging that a potential economic downturn is nearing. Futures markets are currently providing a 68.7% probability for a 75 bps rate hike in September after July’s surprising super-sized 100bps increase.
Loonie may shrug off GDP data; NFP & OPEC meeting more important
Turning to FX markets, the loonie faces a difficult time in competing with the US dollar as the Fed is slightly ahead of the BoC in terms of rate increases, while falling oil prices have been acting against the oil-dependent currency since mid-June. Unless GDP growth surprises significantly to the upside, the loonie may not respond to the data given that some indicators such as the employment growth have been trending downwards so far in the third quarter, feeding speculation that the next GDP release might be less rosy.
The all-important US nonfarm payrolls could steal the show at the end of the week as well, potentially causing larger volatility in dollar/loonie than the Canadian GDP. Meanwhile, traders will look for any OPEC headlines ahead of Monday’s meeting, especially after Saudi Arabia opened the case of a sudden output cut.
The largest oil producer complained about thin liquidity in oil markets to justify a potential reduction. Perhaps it wants more oil producers to invest in the oil field and hedge their production to keep up with demand or simply it prefers higher oil prices. Otherwise, it does not look like anything more than another political game against the US. Recall that US president Biden has recently visited Saudi Arabia to negotiate a higher supply, but the Saudi prince has been resisting such a request. Now the US aims to revive the Iranian nuclear deal as an alternative method to boost oil production, but that will probably make the Saudis unhappy as relations with Iran have been intense since the attack on the Saudi embassy in Tehran in 2016. Saudi Arabia has also been a long hater of Iran’s nuclear programs.
In any case, any rumors that a supply cut from OPEC could happen as soon as next week may revive the rally in oil prices, helping the loonie to recover some lost ground.
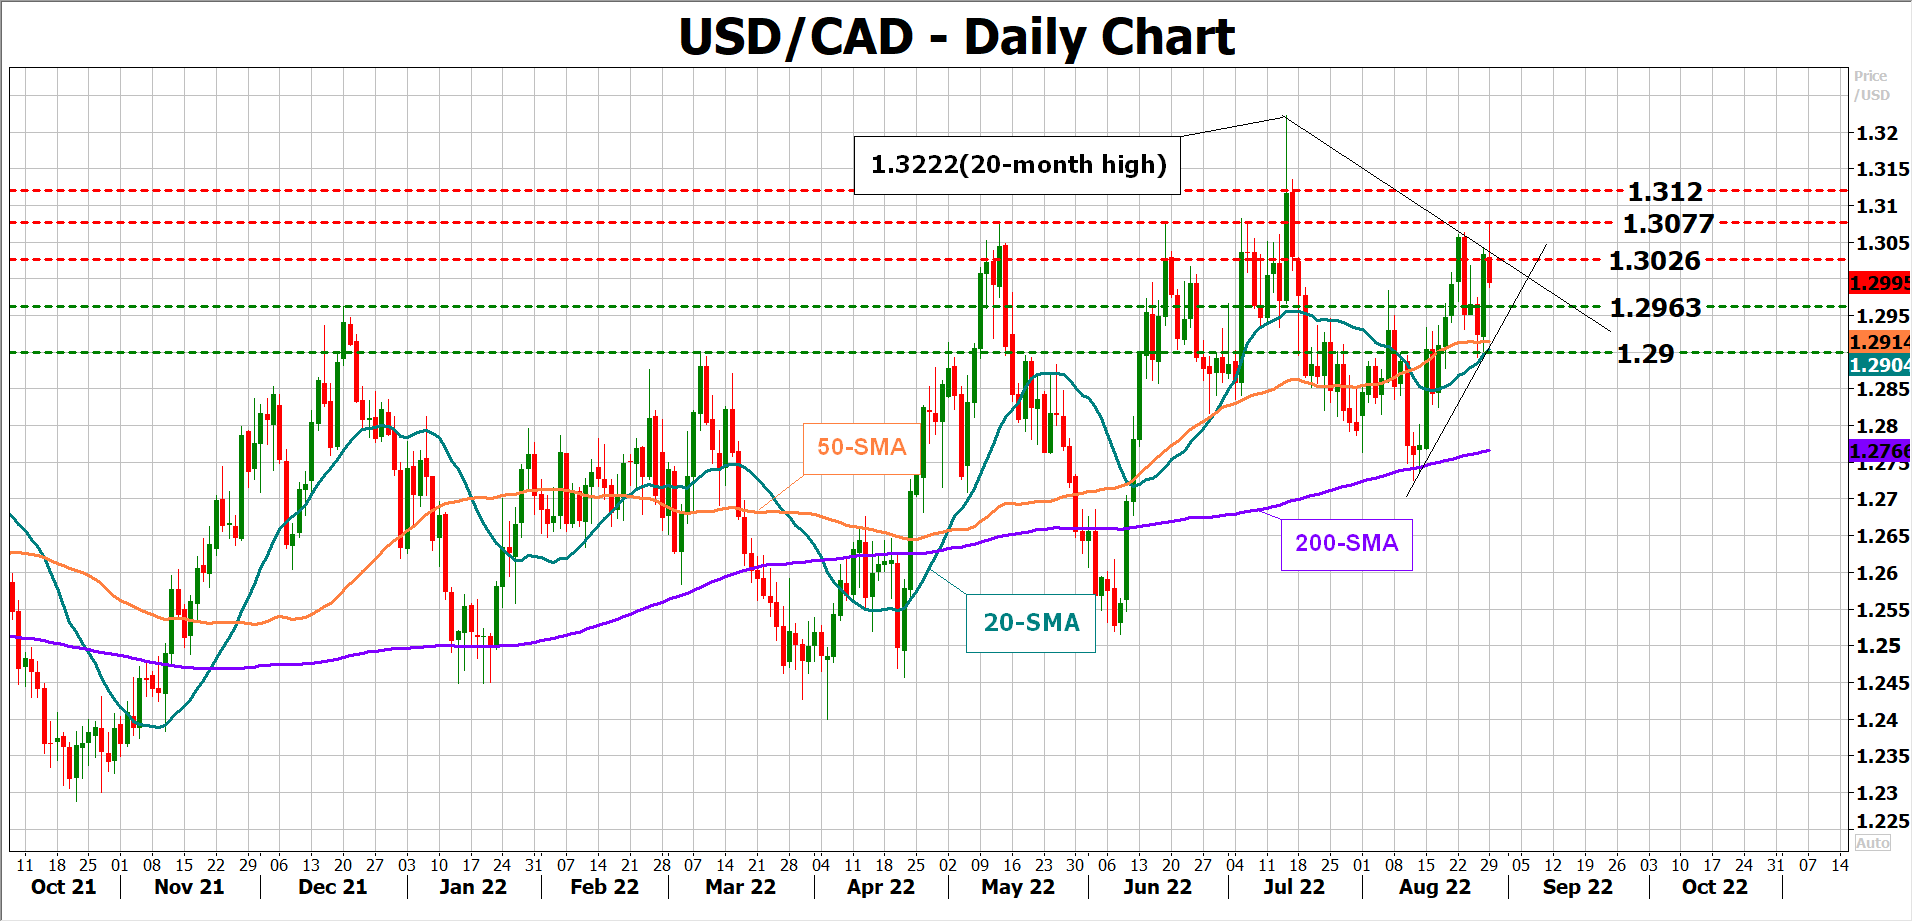
USD/CAD levels to watch
In the meantime, the resistance around the 200-weekly simple moving average (SMA) at 1.3026 per US dollar is still adding some footing under the loonie. If that barrier breaks, dollar/loonie may again re-challenge the 1.3077 bar ahead of the 1.3120 handle. Higher, the door would finally open for the 20-month high of 1.3222.
Alternatively, stronger-than-expected GDP figures combined with a not-so-great NFP report could press the pair towards the tentative support trendline at 1.2963. Moving lower, the price may stabilize near its 20- and 50-day SMAs seen near 1.2900. If that base cracks as well, then the sell-off may speed up towards the 1.2800 psychological level.
GBP/USD: Recovery Could Be Capped Near 1.1800
Key Highlights
- GBP/USD declined to a new multi-month low at 1.1649.
- A major bearish trend line is forming with resistance near 1.1800 on the 4-hours chart.
- EUR/USD is consolidating losses above the 0.9900 zone.
- Crude oil price is rising and there was a clear move above the $95 resistance.
GBP/USD Technical Analysis
The British Pound followed a bearish path below the 1.2000 support against the US Dollar. GBP/USD declined below the 1.1800 support zone to move further into a bearish zone.
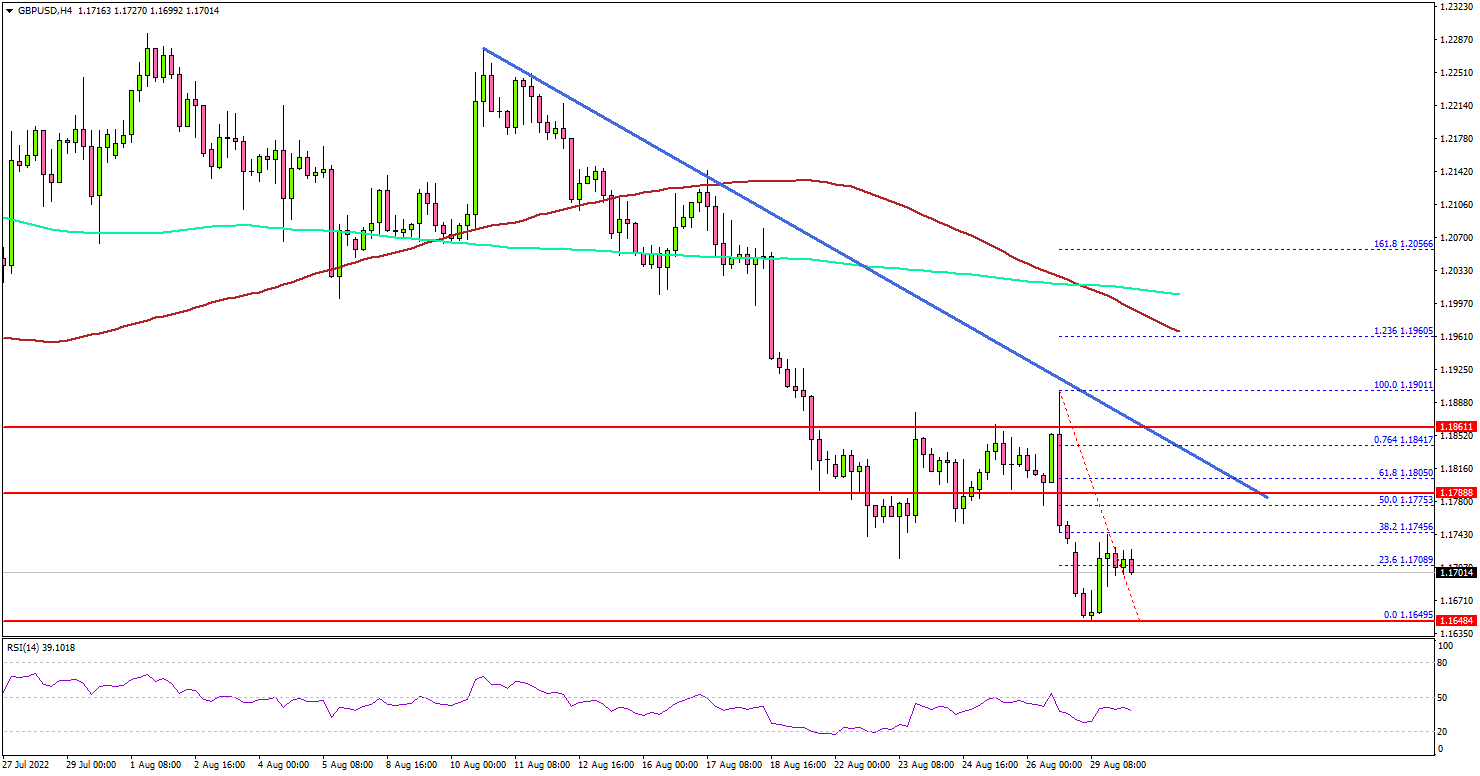
Looking at the 4-hours chart, the pair settled below the 1.1800 level, the 100 simple moving average (red, 4-hours), and the 200 simple moving average (green, 4-hours).
The pair traded to a new multi-month low at 1.1649. Recently, it saw a minor upward move above the 1.1700 resistance zone. The pair climbed above the 23.6% Fib retracement level of the downward move from the 1.1901 swing high to 1.1649 low.
On the upside, the pair is facing resistance near the 1.1770 level. It is near the 50% Fib retracement level of the downward move from the 1.1901 swing high to 1.1649 low.
The next major resistance is near the 1.1800 level. There is also a major bearish trend line forming with resistance near 1.1800 on the same chart. A clear move above the 1.1800 resistance might send the pair higher towards the 1.1950 level or the 100 simple moving average (red, 4-hours).
If not, the pair might resume its decline below the 1.1650 level. The next major support is near the 1.1600 level. Any more losses might call for a move towards 1.1500.
Looking at EUR/USD, the pair is consolidating losses above the 0.9900 level and the bears seem to be active near the 1.0000 zone.
Economic Releases
- German Consumer Price Index for August 2022 (YoY) (Prelim) – Forecast +7.8%, versus +7.5% previous.
- German Consumer Price Index for August 2022 (MoM) (Prelim) – Forecast +0.4%, versus +0.9% previous.
- US Housing Price Index for March 2022 (MoM) - Forecast +1.1%, versus +1.4% previous.
Elliott Wave View: Gold (XAUUSD) Still Has Scope for Further Downside
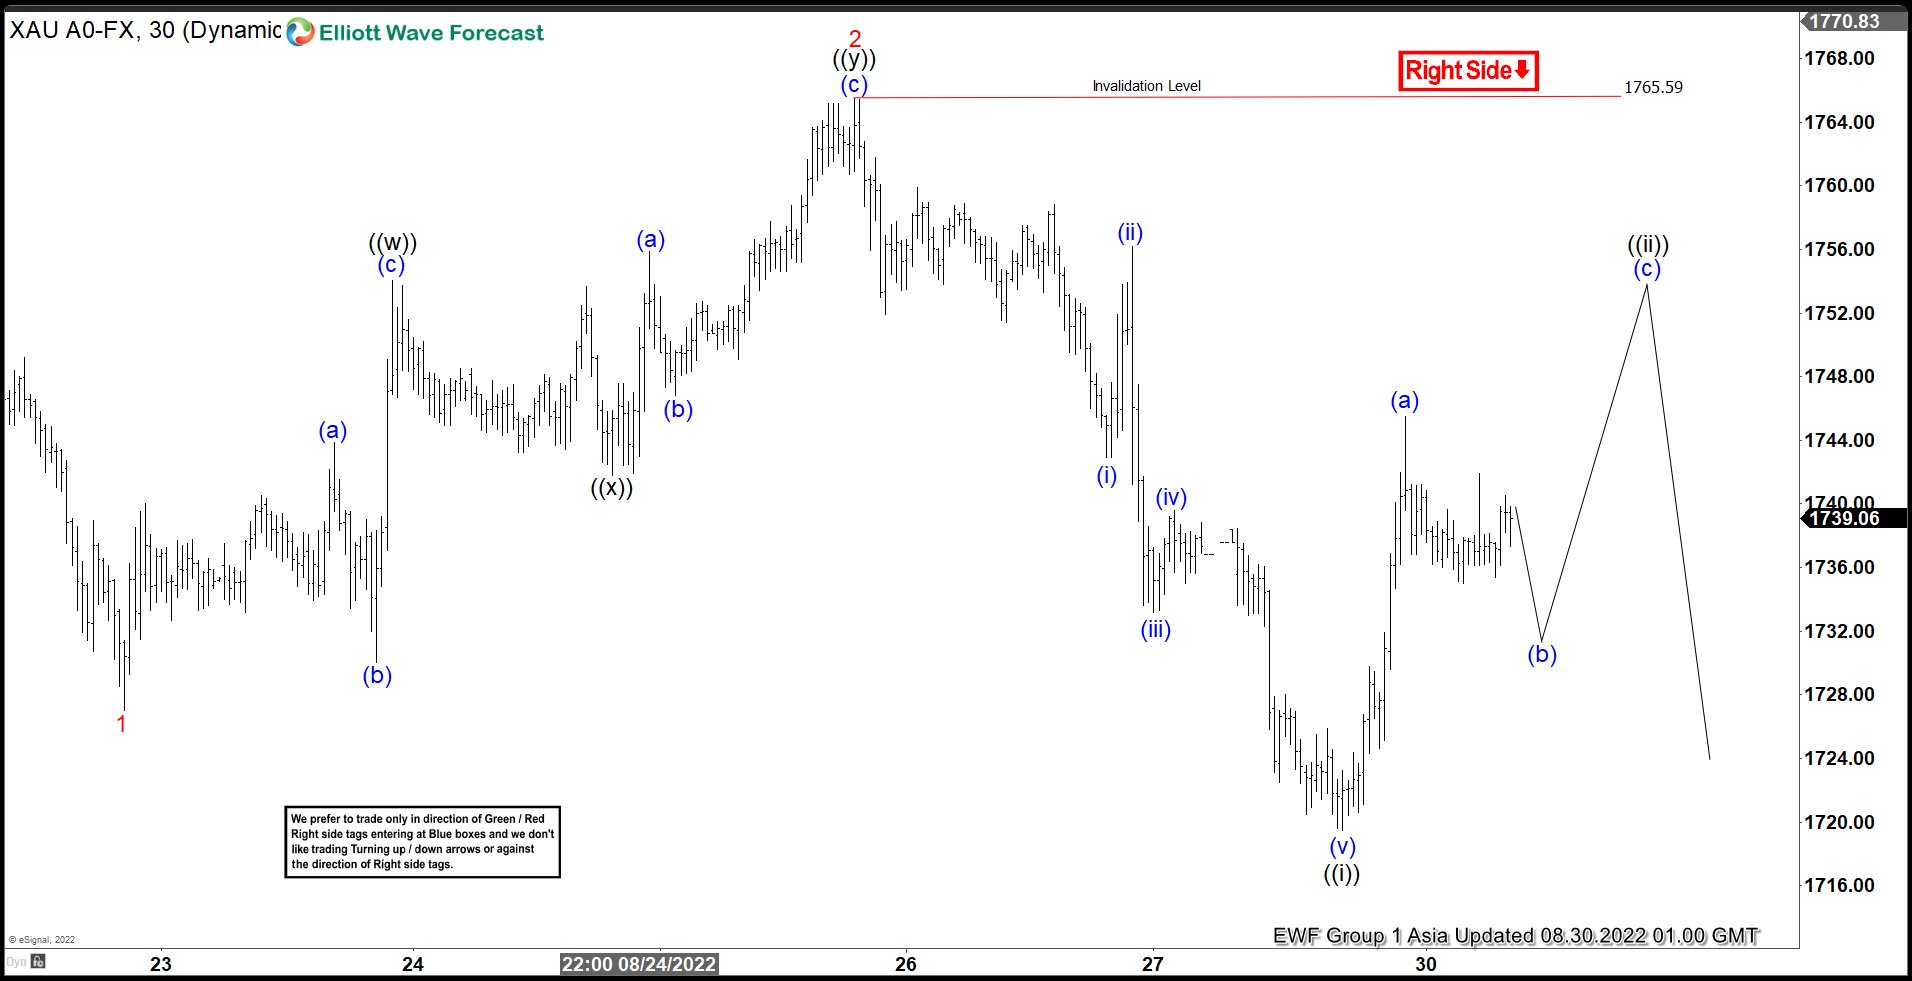
Short Term Elliott Wave View in XAUUSD suggests rally to 1765.59 ended wave 2. Wave 3 lower is in progress to complete a cycle from August 10th, 2022 high. Internal subdivision of wave 2 unfolded as a double three Elliott Wave structure. Up from wave 1, wave (a) ended at 1743.85 and pullback in wave (b) ended at 1730.00. Gold extended higher in wave (c) of ((w)) towards 1754.02. Connector wave ((x)) completed as a zigzag correction at 1741.81. The metal then resumed the rally in wave (a) ended at 1755.92 and pullback in wave (b) finished at 1746.72. Final leg higher wave (c) ended at 1765.59 which ended wave ((y)) of 2.
XAUUSD turned lower in wave 3. Internal subdivision in wave ((i)) unfolded as an impulse. Down from wave 2, wave (i) ended at 1742.86 and bounce in wave (ii) ended at 1756.20. Gold extended lower in wave (iii) at 1733.10. A shallow bounce completed wave (iv) at 1739.56. Last leg lower ended at 1719.48 completing wave (v) of ((i)). Wave ((ii)) correction has started and looks like it is building a zig zag correction. Wave (a) ended at 1745.53, wave (b) we expect to drop a little more and then the metal to rally to finish wave (c) and wave ((ii)) where XAUUSD should continue lower. As far as pivot at 1765.59 high stays intact, expect rally to fail in 3, 7, or 11 swing for further downside.
XAUUSD 60 Minutes Elliott Wave Chart
USDJPY Wave Analysis
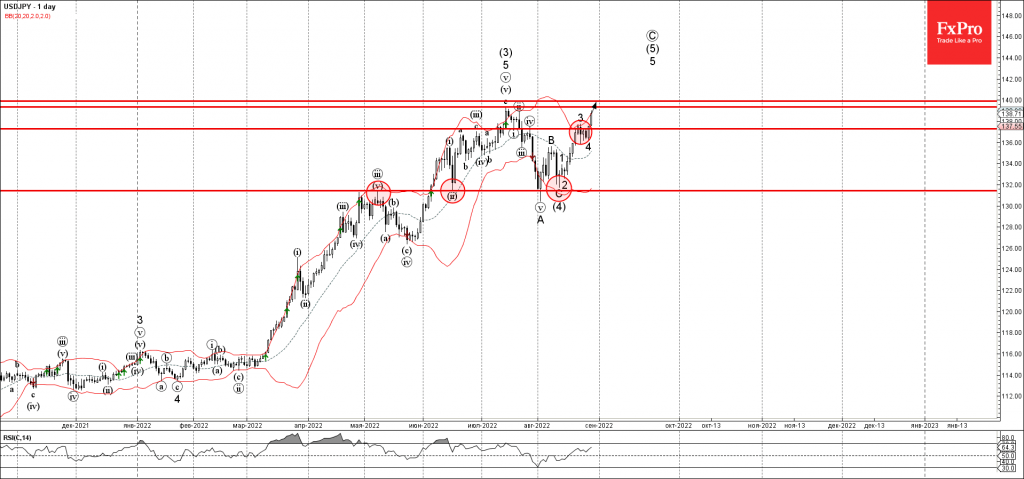
- USDJPY broke key resistance level 137.30
- Likely to rise to resistance level 140.00
USDJPY currency pair recently broke the key resistance level 137.30 (which stopped the previous minor impulse wave 3 earlier this month).
The breakout of the resistance level 137.30 accelerated the active short-term impulse wave 5 of the intermediate impulse wave (5) from the start of August. Given the clear daily uptrend, USDJPY can be expected to rise further toward the next resistance level 140.00 (which stopped the earlier extended impulse sequence (3) in July).
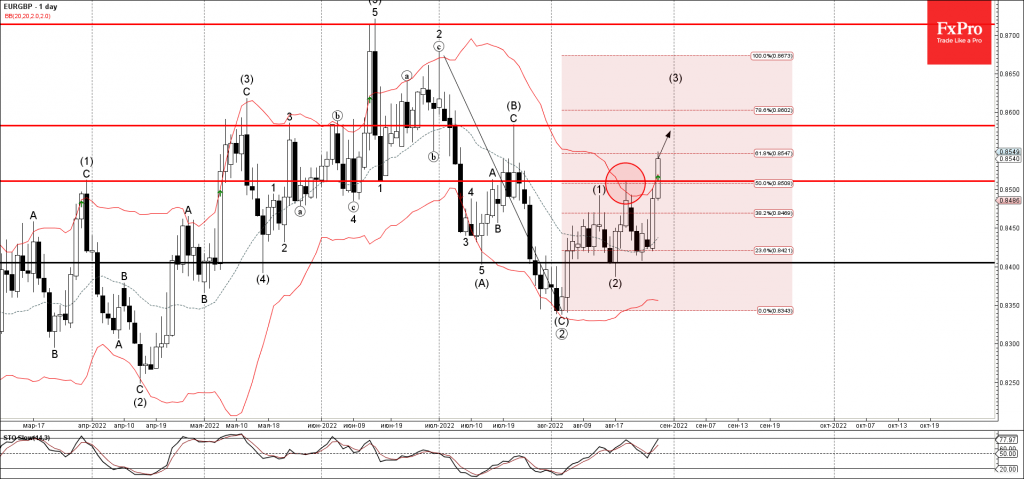
EURGBP Wave Analysis
- EURGBP broke key resistance level 0.8510
- Likely to rise to resistance level 0.8585
EURGBP currency pair recently broke the resistance level 0.8510 (which stopped the pair earlier this month) intersecting with the 50% Fibonacci correction of the earlier downward correction from July.
The breakout of the resistance level 0.8510 accelerated the active medium-term impulse wave (3) from the middle of August.
Given the prevailing euro optimism, EURGBP can be expected to rise further toward the next resistance level 0.8585 (top of wave (B) from July).
Eco Data 8/30/22
[php_everywhere instance="1"]