Sample Category Title
XAG/USD: How High Will the Price Rise in the Intervening Wave (X)?
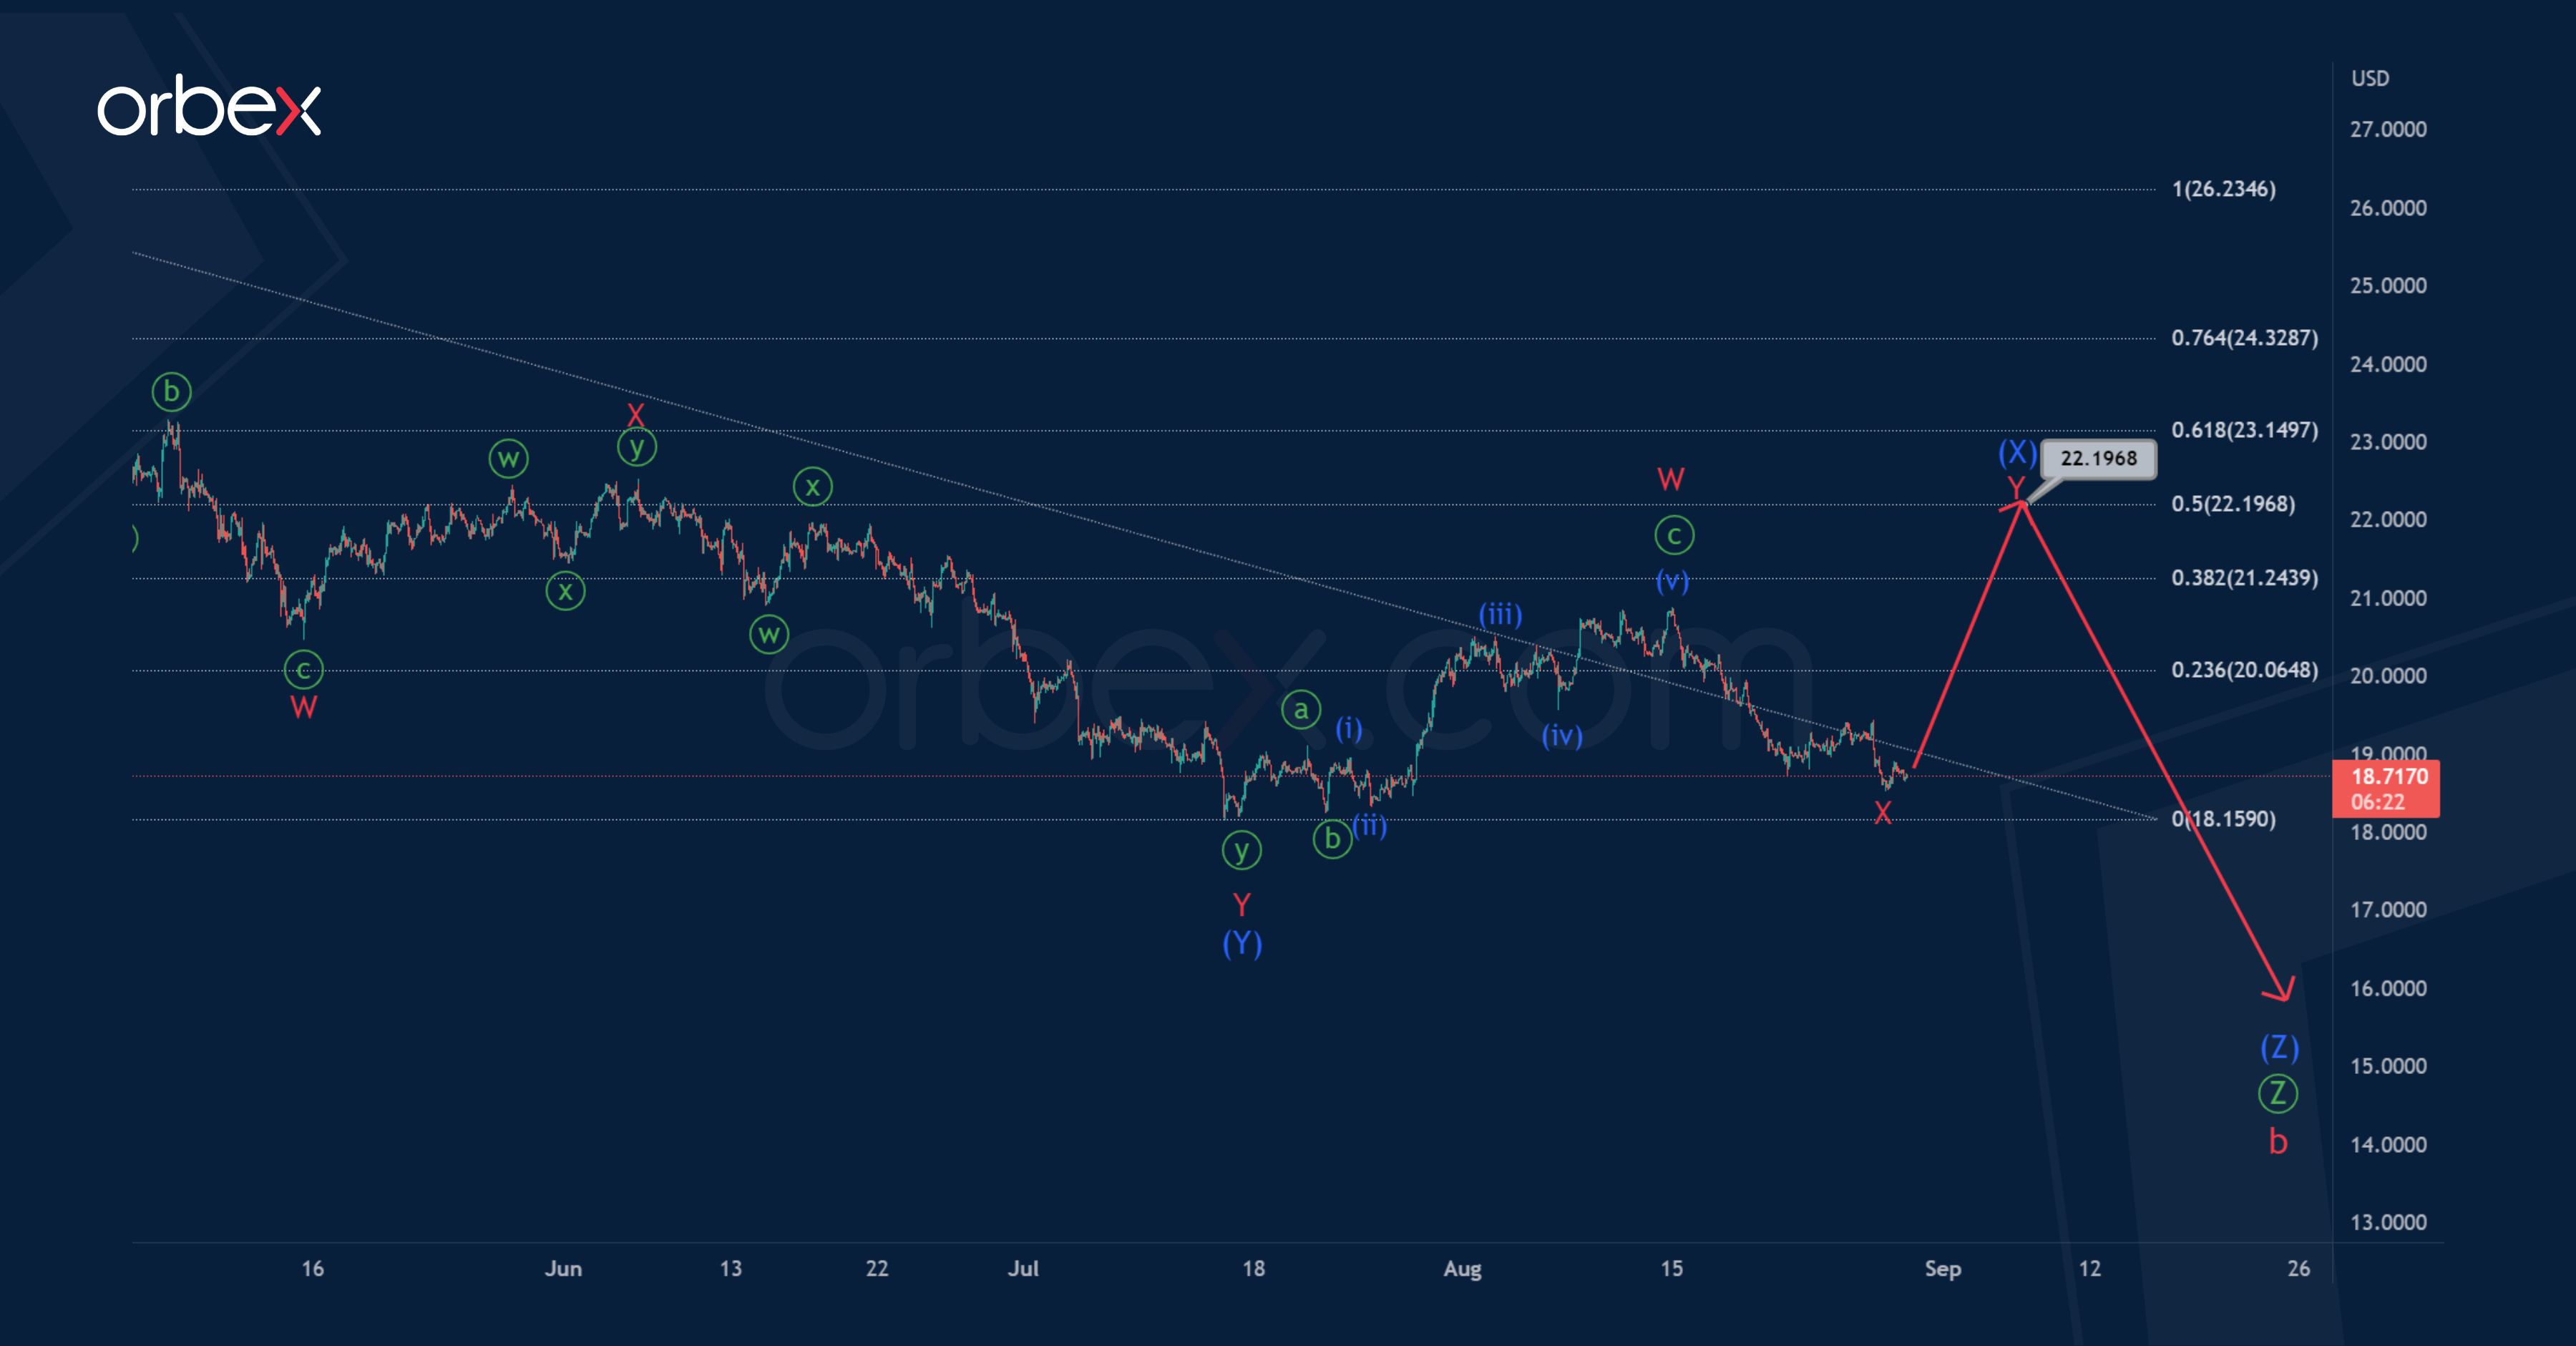
XAGUSD seems to be forming a correction wave b of the cycle degree, which is part of a large zigzag.
Apparently, correction b is a primary triple zigzag Ⓦ-Ⓧ-Ⓨ-Ⓧ-Ⓩ. The first four parts of it have already been fully completed, now we see the construction of the last wave Ⓩ.
Most likely, the wave Ⓩ will be an intermediate triple zigzag (W)-(X)-(Y)-(X)-(Z). It seems that the formation of the actionary intermediate wave (Y) has come to an end, it has taken the form of a double zigzag W-X-Y. Thus, now we see growth in the intermediate intervening wave (X).
It can be assumed that the wave (X) will end in the form of a minor double zigzag W-X-Y near 21.169. At that level, it will be at 50% along the Fibonacci lines of sub-wave (Y).
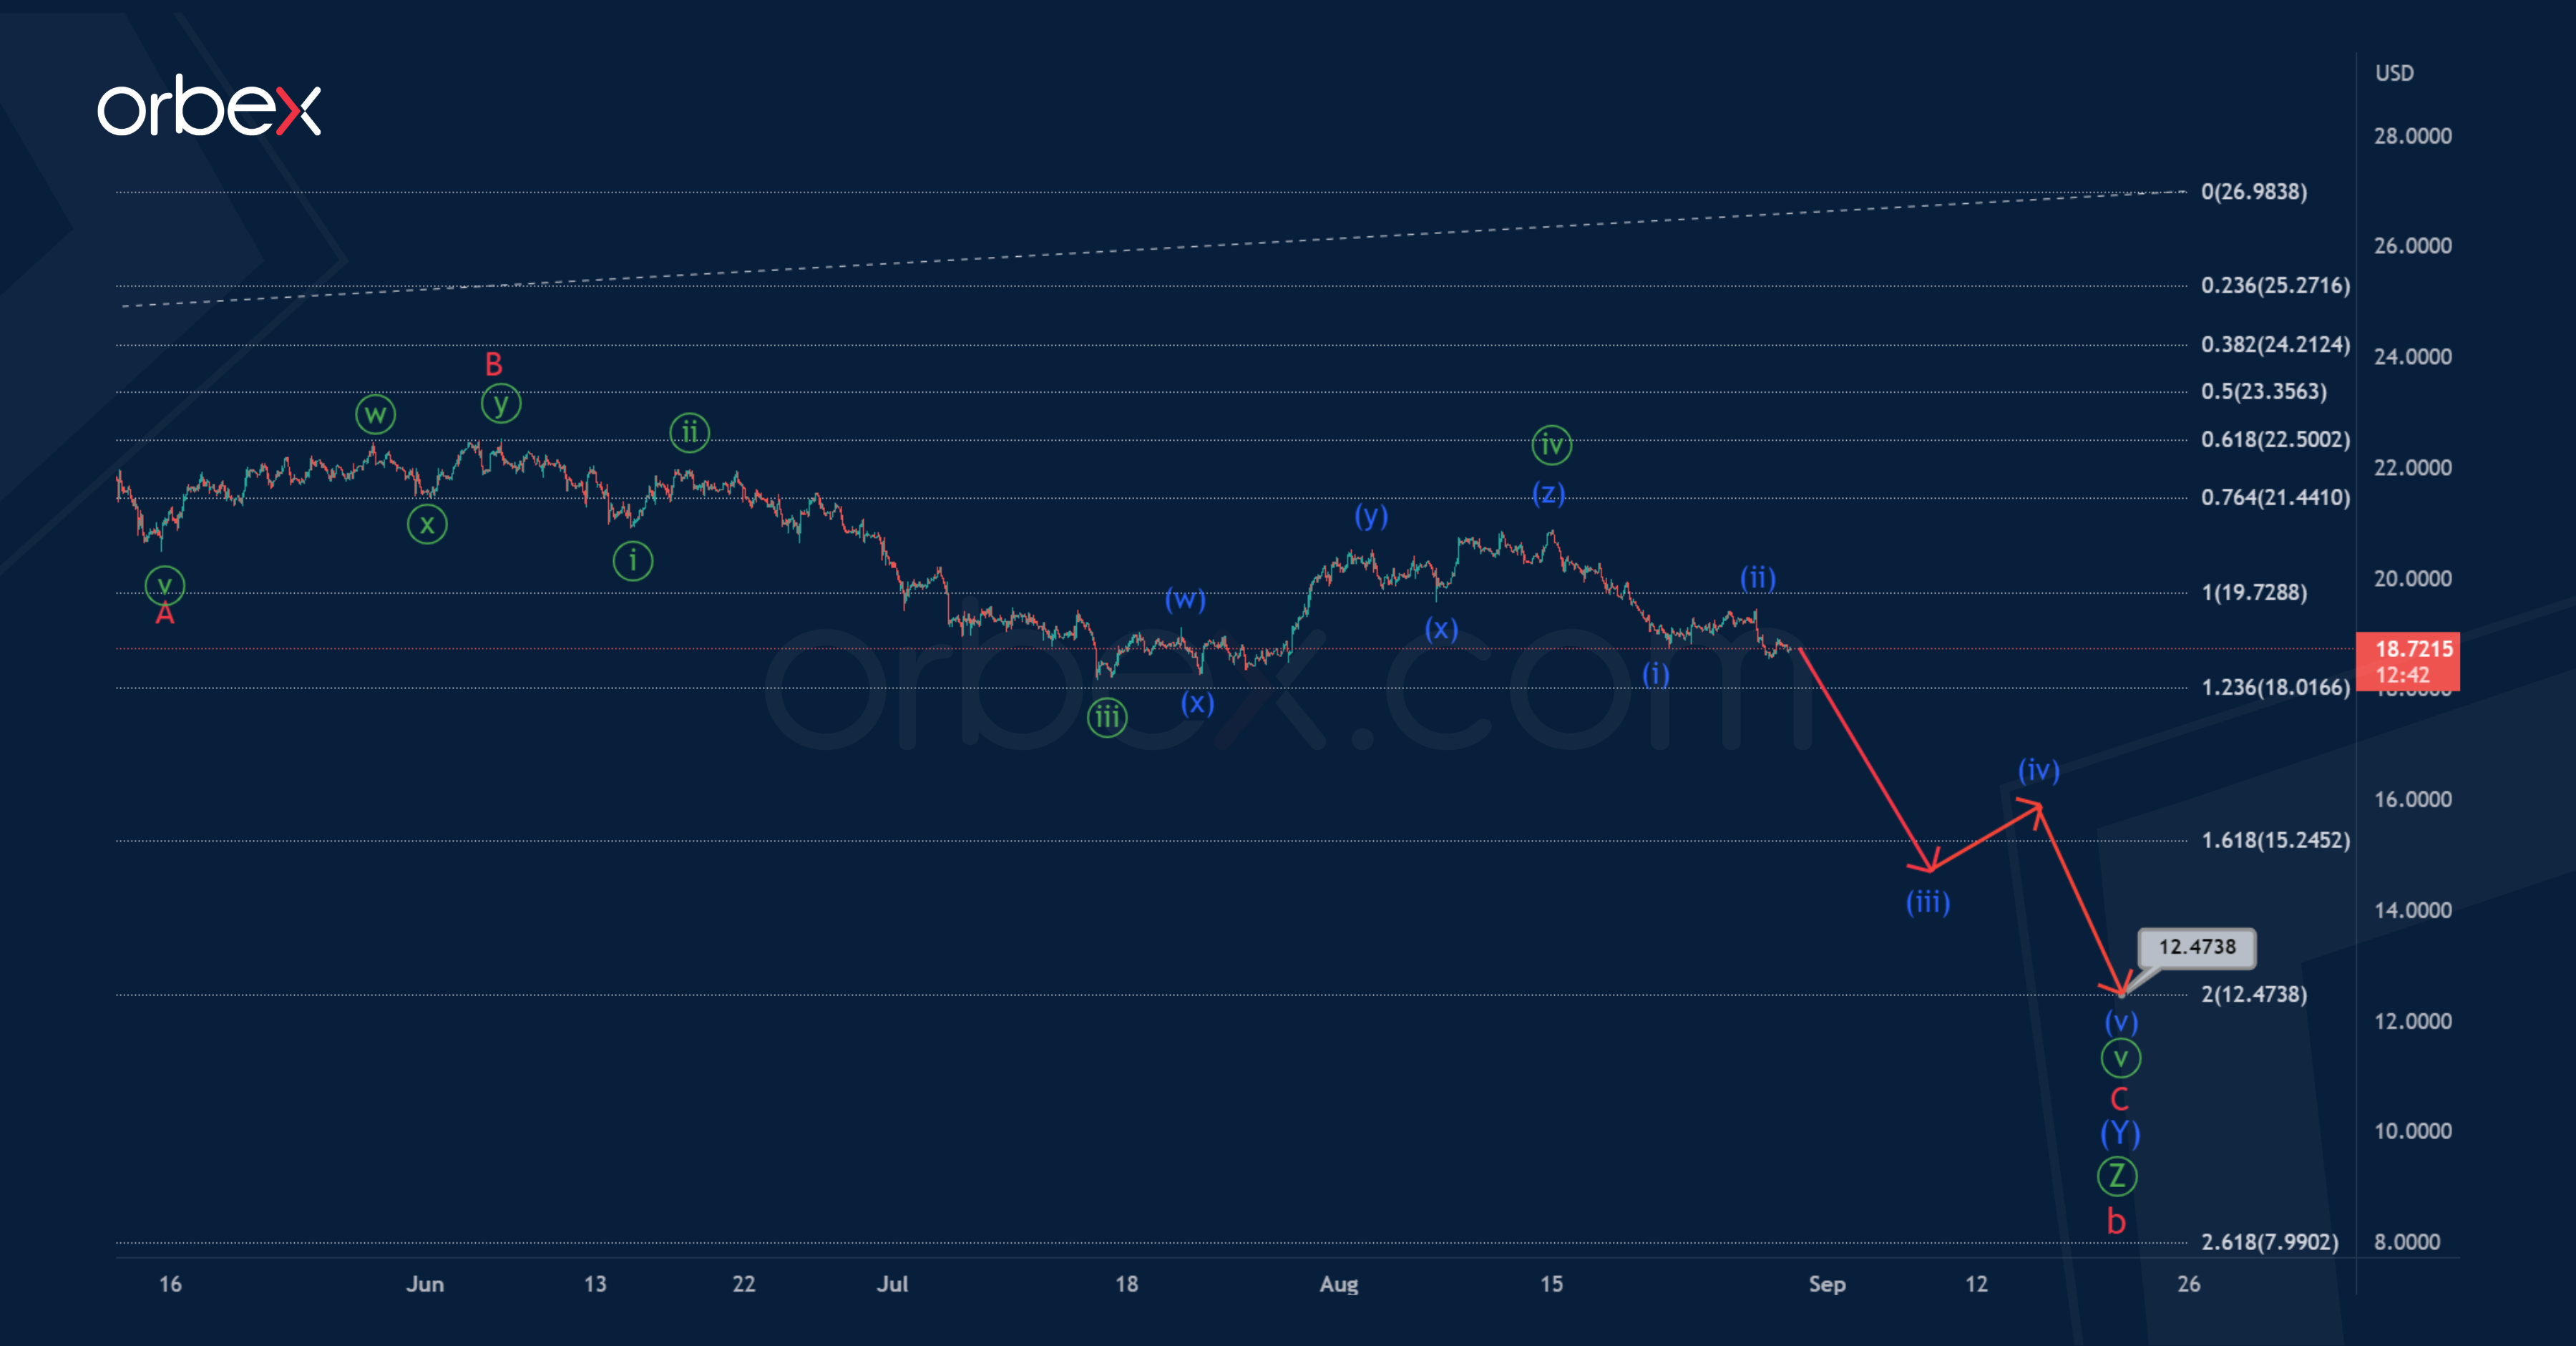
Alternatively, it is assumed that the bearish primary wave Ⓩ may end in the form of a double zigzag (W)-(X)-(Y).
Most likely, the market is now in the final part of the actionary wave (Y), or rather in its final minor sub-wave C.
Wave C may end in the form of an impulse consisting of minute sub-waves.
To complete this impulse, a final sub-wave ⓥ is needed. The end of the specified impulse is possible near 12.473. At that level, primary wave Ⓩ will be at 200% of actionary wave Ⓨ.
FTSE 100 Breaks Lower
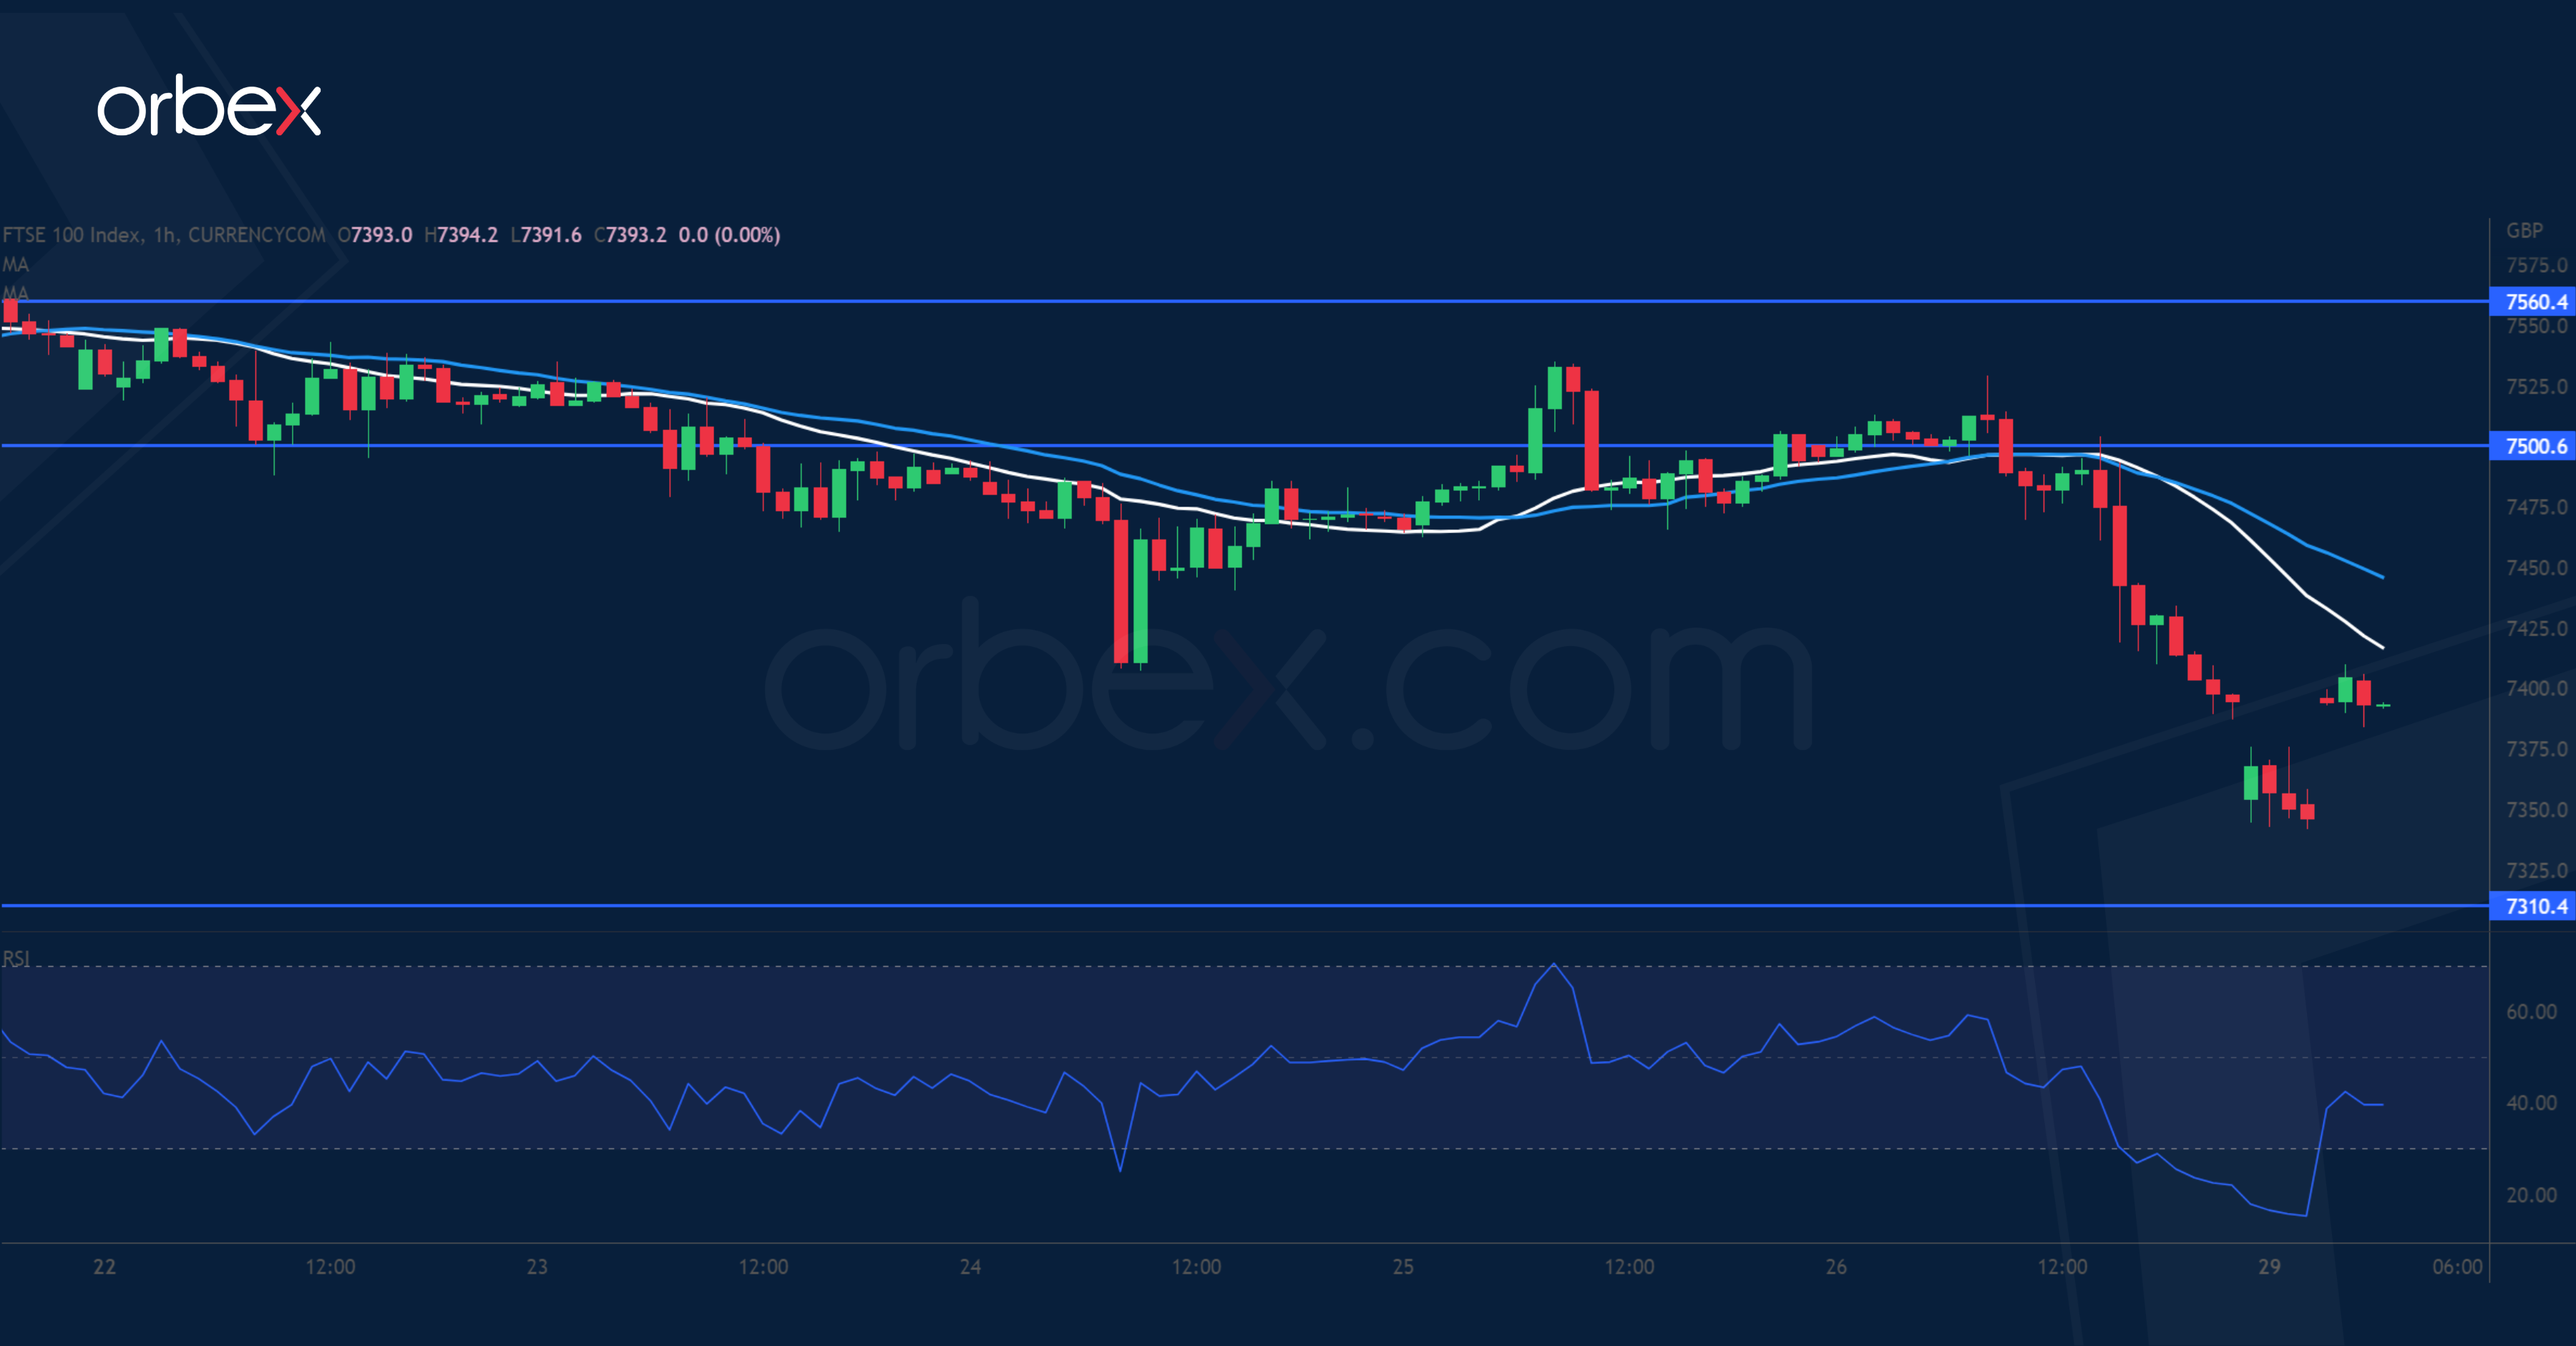
Equities remain under pressure as investors brace for more aggressive hikes from central banks. The FTSE 100 lost its momentum as it came closer to the triple top (7650) from the daily chart. An initial fall below 7460 triggered some profit-taking. Then a break below 7400 invalidated the latest rebound and forced buyers to bail out. 7310 is the closest support and the RSI’s oversold condition may cause a limited bounce. The index could be vulnerable to another round of liquidation unless the bulls manage to reclaim 7500.
AUD/USD Sees Limited Rebound
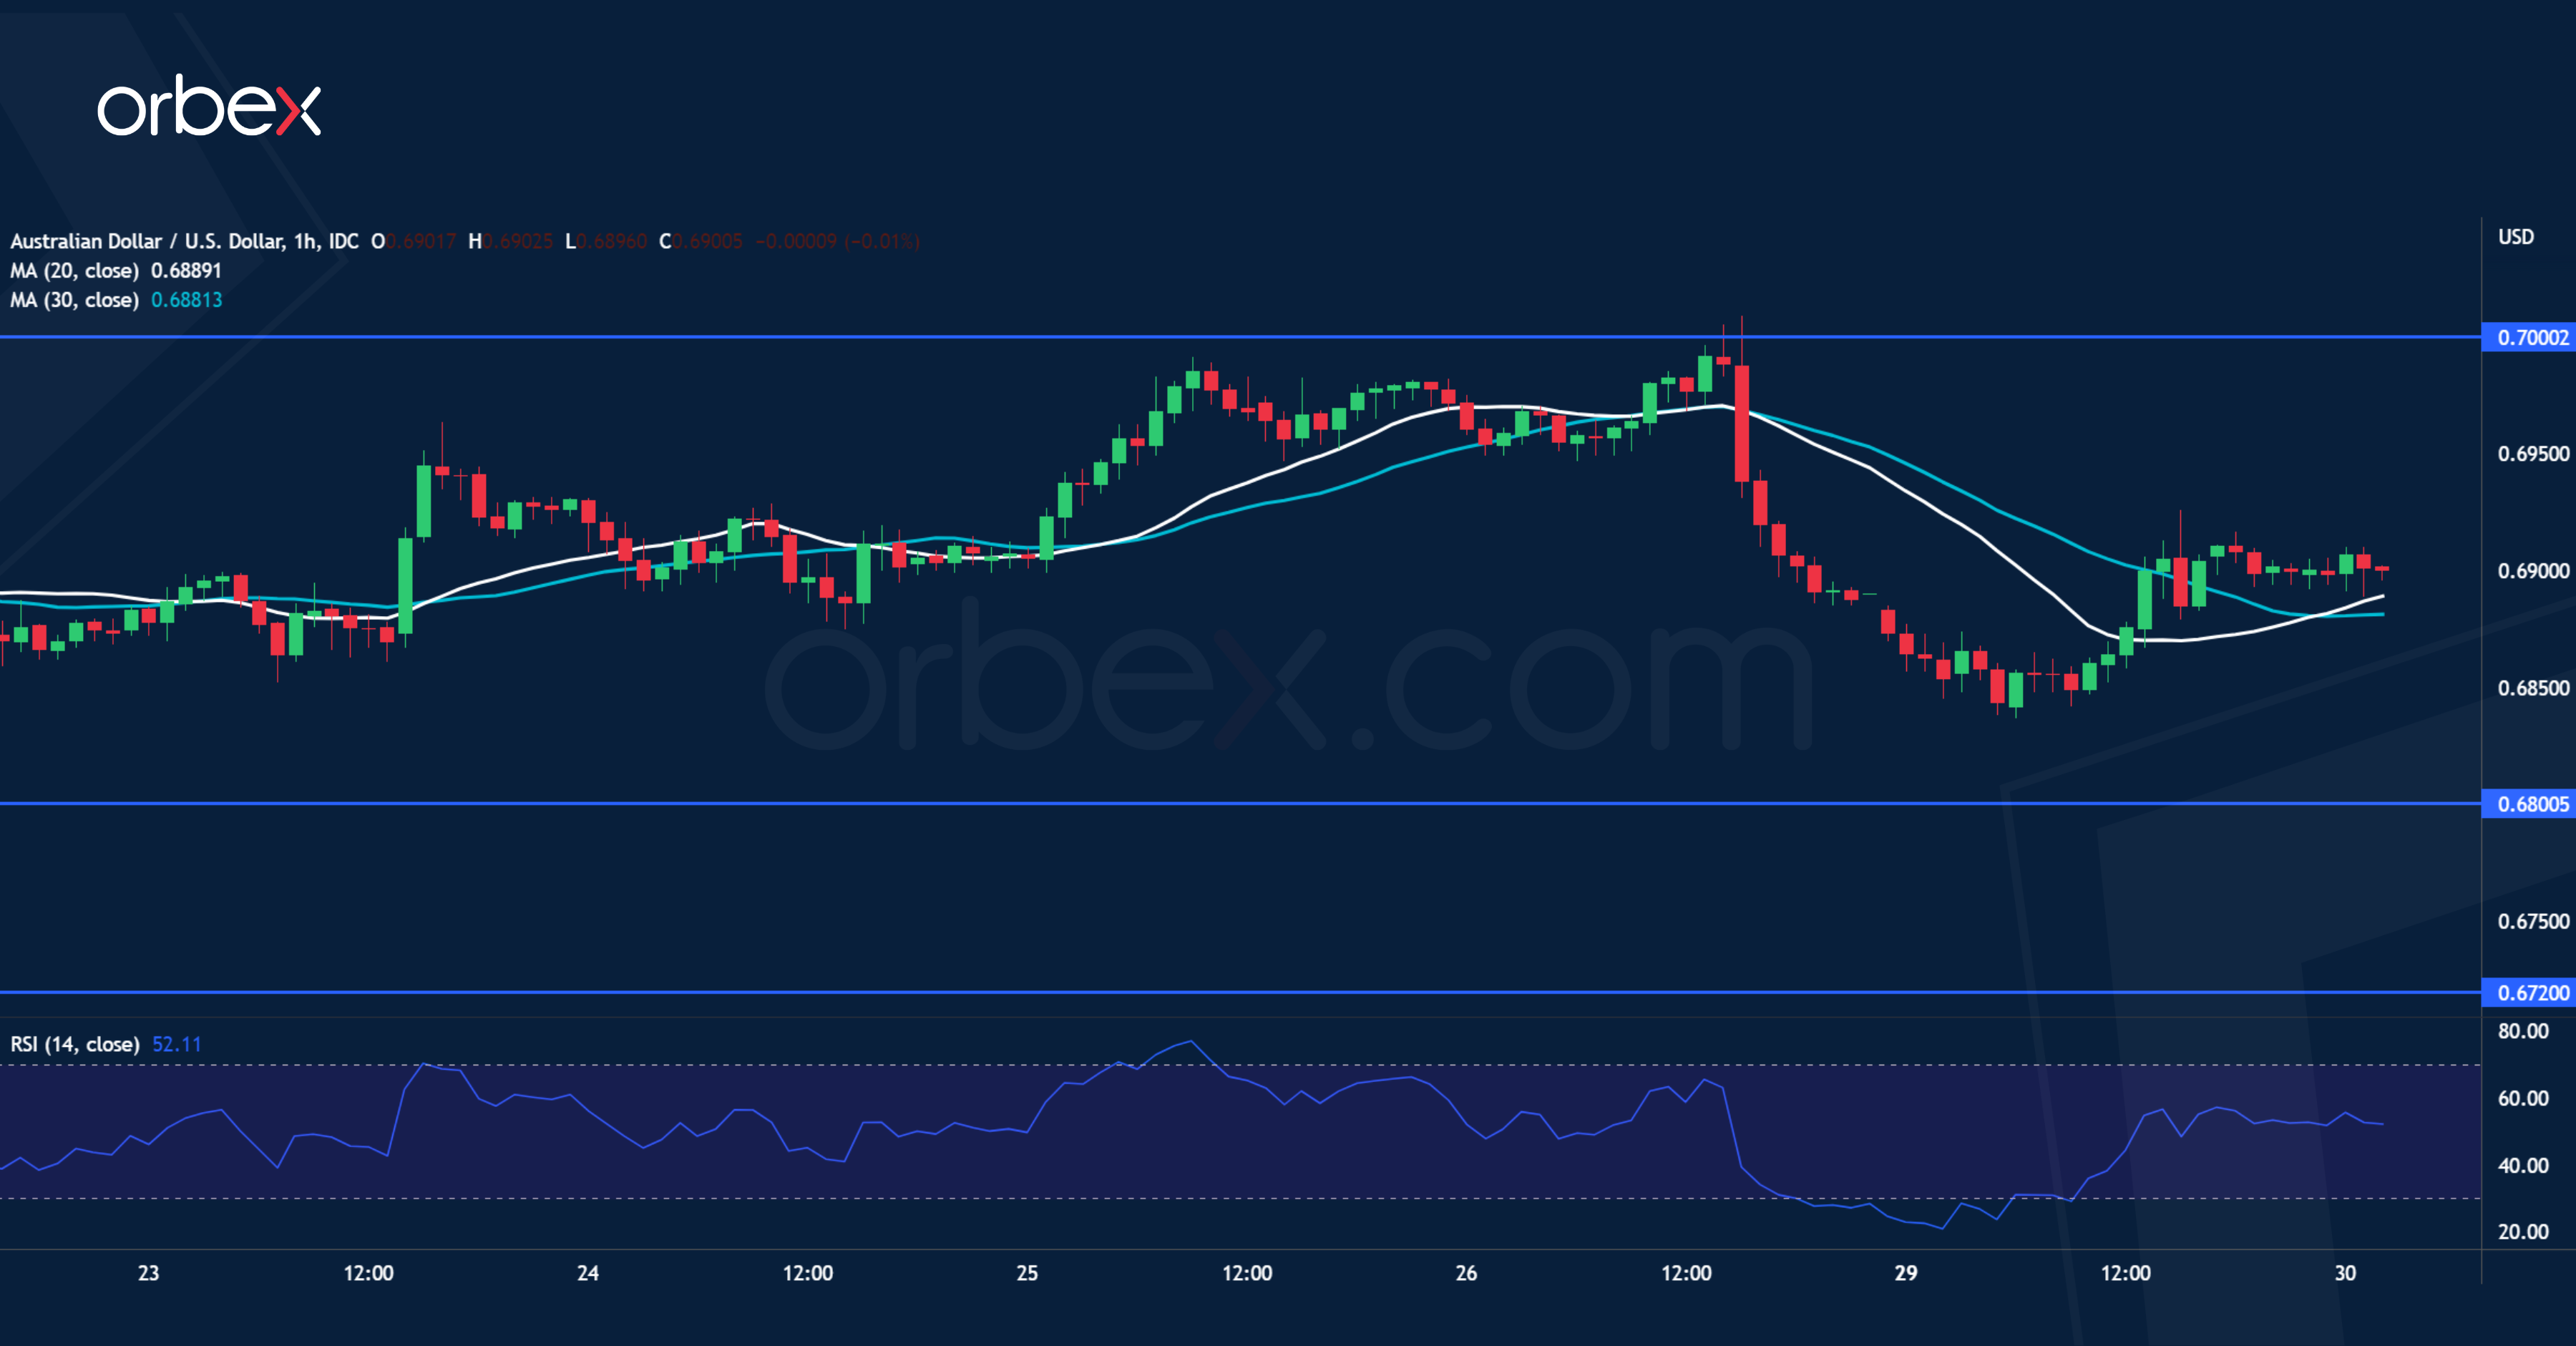
The Australian dollar bounced higher after upbeat retail sales in July. Its previous failed attempt to clear the psychological level of 0.7000 led to a new round of sell-off below 0.6850. This is a sign that the bears may have regained control of the price action. A bearish MA cross on the daily chart may further weigh on sentiment. After the RSI sank into oversold territory, some bargain hunting tried to push back. However, stiff selling pressure could be expected near 0.7000. 0.6800 would be the next stop when volatility returns.
USD/JPY Hits Major Resistance
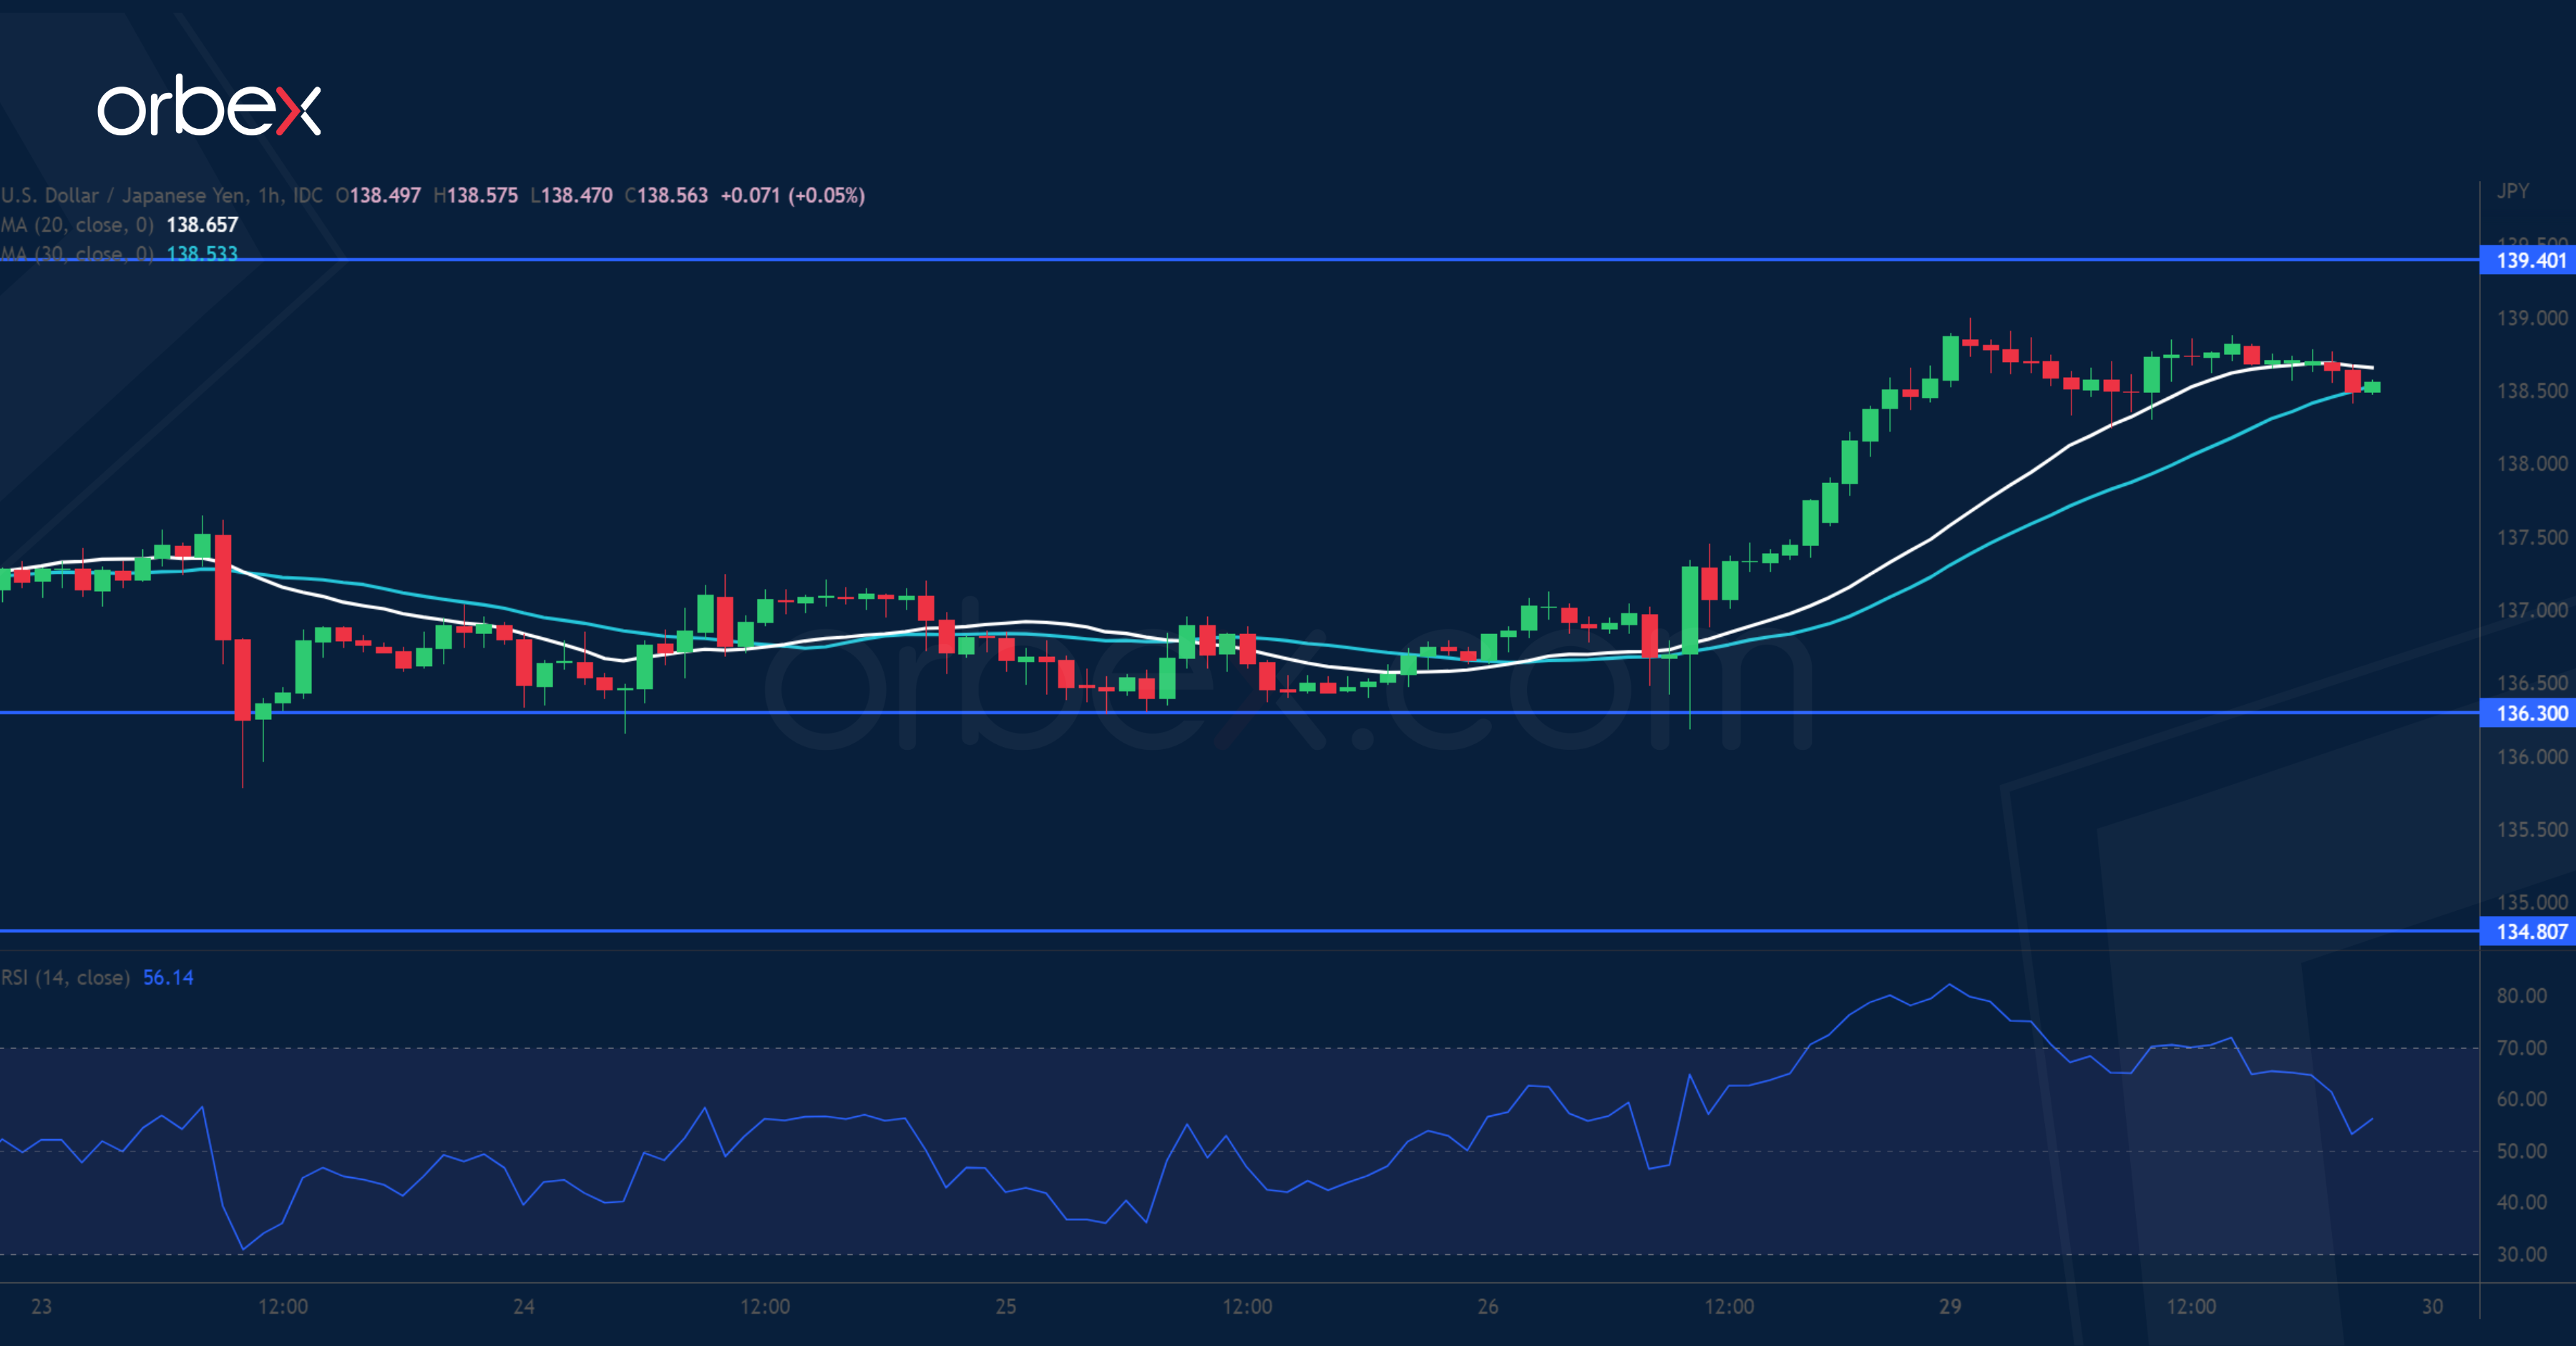
The Japanese yen steadied after July’s unemployment met expectations. A close above 138.80 has put the greenback right under last July’s peak at 139.40, hitting a 24-year high. A bullish breakout would attract more buying interests and resume the uptrend in the medium-term. In the meantime, an overbought RSI may cause a limited pullback as intraday traders take profit in the supply zone. Fresh selling as a last attempt by the short side might drive the pair lower. 136.30 is a key support to keep the momentum going.
Daily Technical Analysis
EUR/USD
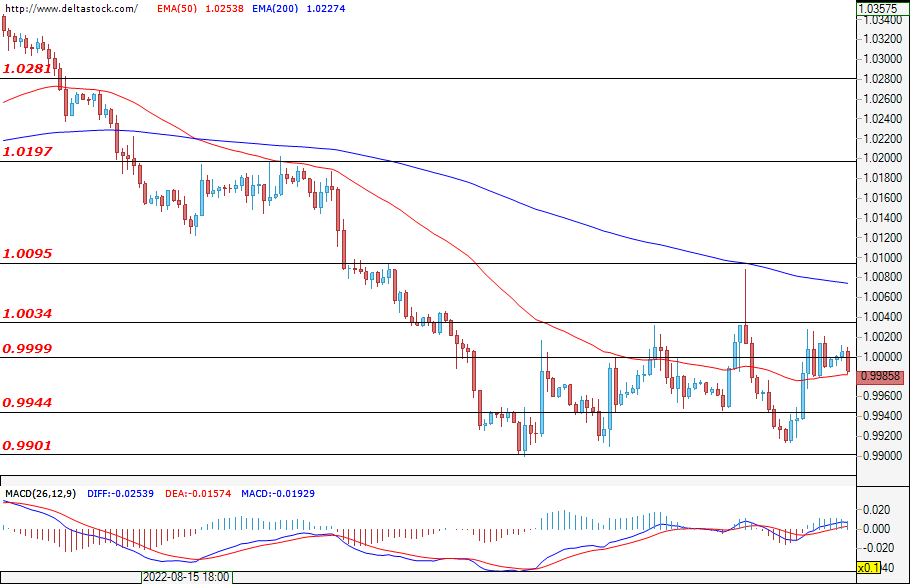
The single European currency is trying to stop its depreciation against the U.S. dollar and has been moving in a range between 1.0089 and 0.9901 for the past five days. While attempts by the bulls to settle more permanently above the resistance at 0.9999 are not particularly successful for the time being, the bears cannot gain the upper hand in their attempts to overcome the support at 0.9901, either. Despite the struggles to form a consolidation, the downward movement cannot be said to be over just yet. Economic indicators that may influence the course of today’s session is the U.S. consumer confidence data at 14:00 GMT.
USD/JPY
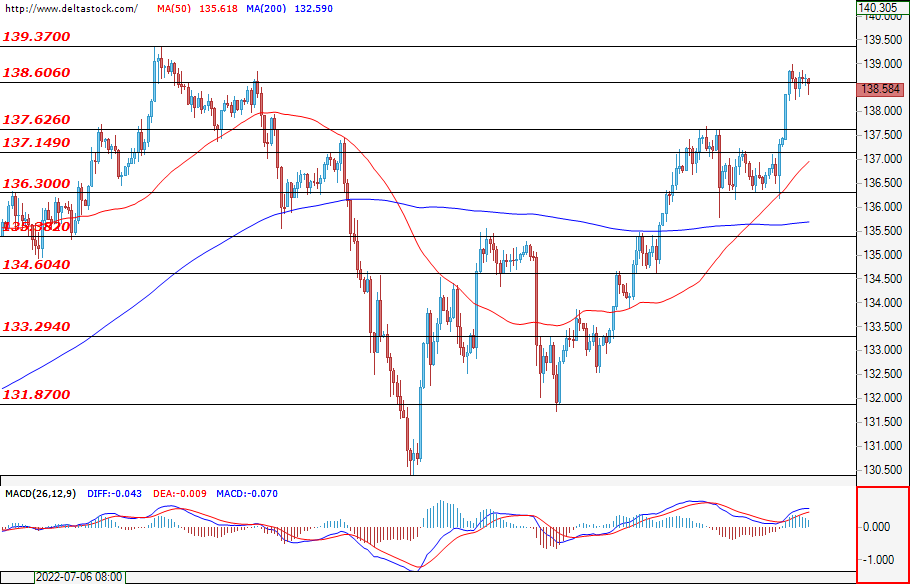
In the past session, the yen continued to lose ground against the dollar and headed towards the resistance at 136.60. A possible breach of the next important resistance at 139.37 would give the bulls an even more serious advantage, but if the price does not hold above it, then we could witness a double top and a downward movement, which would weaken the currency pair’s current trend.
GBP/USD
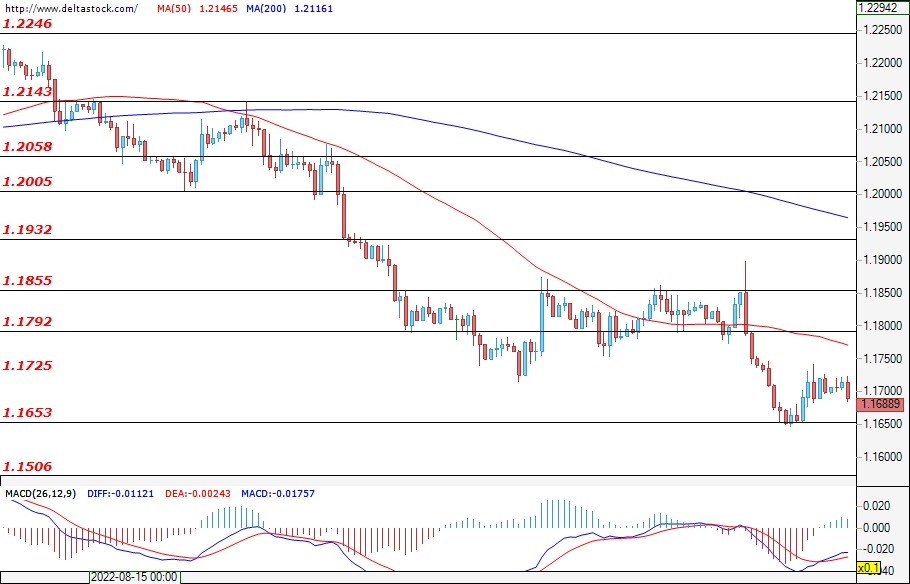
The bears failed to overcome the support formed at 1.1649, but this does not necessarily mean that they have given up all hope. The bulls need to breach at least three important resistances – 1.1725, 1.1792 and 1.1855 – before it could be said that they have achieved any temporary success at all. Sentiment remains negative and the bears are likely to head south and breach the support at 1.1648.
EUGERMANY40
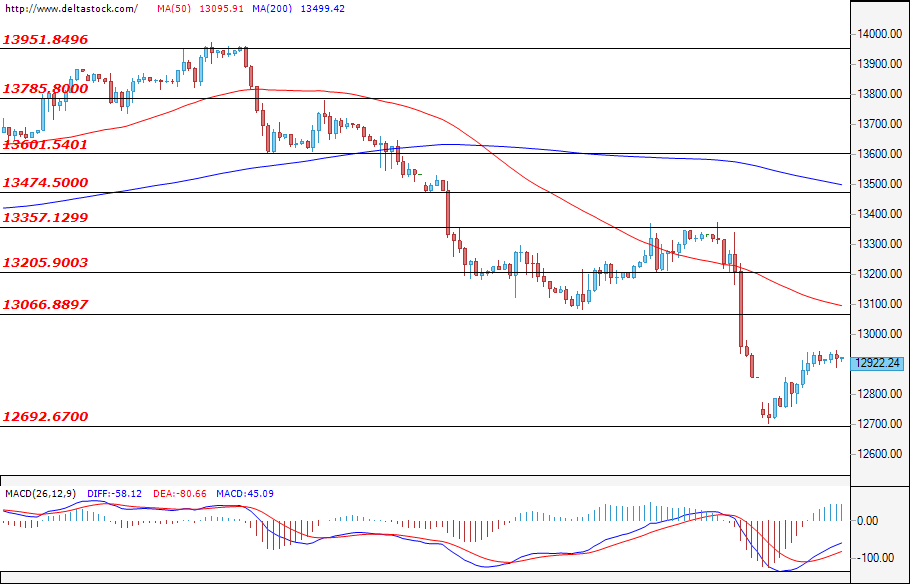
The downward movement of the German index was limited for now and the bears failed to reach the support at 12693. On the other hand, the performance of the bulls so far is equally unconvincing as their target – the resistance at 13066 – is still yet to be reached. If this resistance is not overcome, then it is very likely that the bears will “settle down” for longer than initially expected. The release of the data on the preliminary consumer prices in Germany at 12:00 GMT might rattle the markets and lead to an increase in volatility.
US30
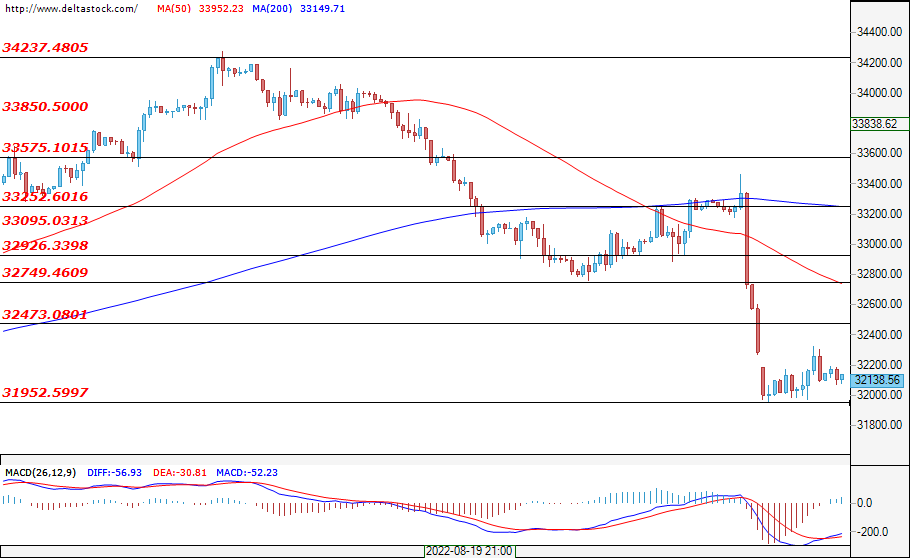
The U.S. blue-chip index is trying to recover from the sell-off in the past week, holding its course above the support level at 31942. On the other hand, the bulls' target – the resistance at 32473 – is also still left intact. If it remains this way, then we are likely to witness the return of the bears to the market and another attack on the support at 31942.
Swiss KOF dropped to 86.5 in Aug, economic outlook appears less than encouraging
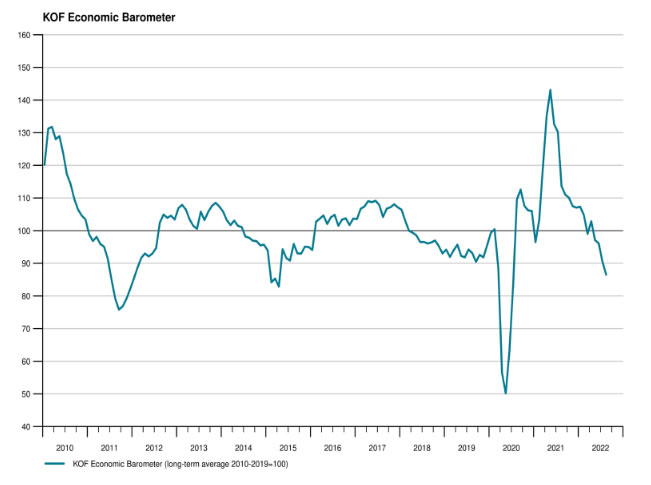
Swiss KOF Economic Barometer dropped from 90.5 to 86.5 in August, below expectation of 88.6. KOF said the reading is "quite considerably below its long-term average". Accordingly, "for the near future the outlook for the Swiss economy appears less than encouraging."
KOF added: " The decline is primarily due to indicators broadly associated with private consumption, but the manufacturing sector and the construction industry are emitting negative signals, too. The other indicators included in the barometer show hardly any changes."
Friday’s Payrolls a Potential Trigger to Decide on the Next Directional Move
Markets
Yesterday, last week’s repositioning on US and European interest rate markets simply continued with European markets again underperforming. Chair Powell on Friday was very clear that the Fed will do ‘whatever it takes’ to bring inflation back to the 2.0% target, even as that may cause pain in terms of lower growth and higher unemployment. US yields rose further between 2.7 bps (2-y) and 6.2 bps (10-y). Interestingly, the move this time wasn’t the usual bear flattening that often dominated recent repositioning. Is the faster pace of QT in September weighing on bonds with longer maturities? Technical considerations might also be in play as the US 2-y yield is retesting the cycle top near 3.42%. Anyway the rise in US yields was fully driven by higher real yields. EMU swap yields jumped between 15.3 bps (2-y), 11.9 bps for the 10-y yield and 4.9 bps for the 30-y. The 2-y swap jumped above the 2.0% June top to close at a new cycle peak of 2.08% after hawkish ECB members on Friday and over the weekend started the debate on a 75 bps rate hike at next week’s meeting. ECB’s Lane isn’t in the camp of this kind aggressive frontloading yet and prefers a gradual/protracted approach to minimize negative consequences. Still current market pricing sees a chance of 75% of a 75 bps hike rather than a 50 bps step. The (broad) tightening of monetary conditions that the Fed is aiming for also continued via equity markets. US indices again lost up to 1.0% (Nasdaq). The EuroStoxx50 declined 0.92%, but a correction in European gas prices helped equities to close off the intraday lows. The dollar is holding strong, but a clean break higher didn’t occur (yet?). DXY touched a minor cycle top at 109.47, but gains couldn’t be sustained (close 108.83) despite the rise in US real yields. USD/JPY (close 138.72) also just missed the July top. The euro gains some reprieve from the catching up move in European yields (EUR/USD close 0.9997).
Asian equities this morning mostly trade in positive territory with China underperforming (-0.75/-1.0%). The PBOC with a stronger than expected fixing is again leaning against recent yuan depreciation. Still the onshore yuan weakens slightly further to USD/CNY 6.9165. Later today, the calendar is well filled with the preliminary German (and Spanish) August inflation, the EC confidence indicators, US house prices and consumer confidence (Conference Board). The Bund future gains some ground on a (mildly) softer than expected North Rhine Westphalia CPI. However, there is still a decent chance for the Y/Y figure to return to (or above) the 8.7% May top (HICP) . In a data-dependent approach, this leaves a solid case for bold frontloading ECB action. For now, we don’t anticipate a sustained correction to the established trend of higher US and European yields. On FX markets, the dollar apparently needs a clear sign to break beyond recent cycle peak levels. Maybe some consolidation might be on the cards with Friday’s payrolls a potential trigger to decide on the next directional move. The euro probably isn’t out of the woods yet, but a further correction in the gas price might help to keep the EUR/USD pair away from the 0.99 short-term.
News Headlines
European Commission President von der Leyen said that the EU was working on emergency intervention measures as well as structural reforms to the power market. She pointed to decoupling electricity prices from the gas price with the exorbitant surge of the latter influencing the former. The EU also wants to ensure that renewable energies are generated at lower costs, that those costs are transferred to consumers and that windfall profits are used to help vulnerable households. Von der Leyen wants those emergency instruments to be triggered very quickly, perhaps in weeks. The announcement helps explain yesterday’s setback in gas prices with the reference Dutch TTF future dropping 15% after last week’s test of the YTD high set in the wake of the start of the Russian invasion.
The Fed’s balance-sheet roll-off (Quantitative Tightening) is set to hit max speed. From Thursday, monthly caps for maturing assets will be raised to $60bn for Treasuries and $35bn for mortgage-backed securities. If the Fed’s portfolio doesn’t allow for such amounts, it will use its $326bn T-bill portfolio to make up for what’s left. More specifically, we’re already looking at $16.4bn of Bills in September and $13.6bn in October.
EUR/USD Daily Outlook
Daily Pivots: (S1) 0.9932; (P) 0.9980; (R1) 1.0047; More...
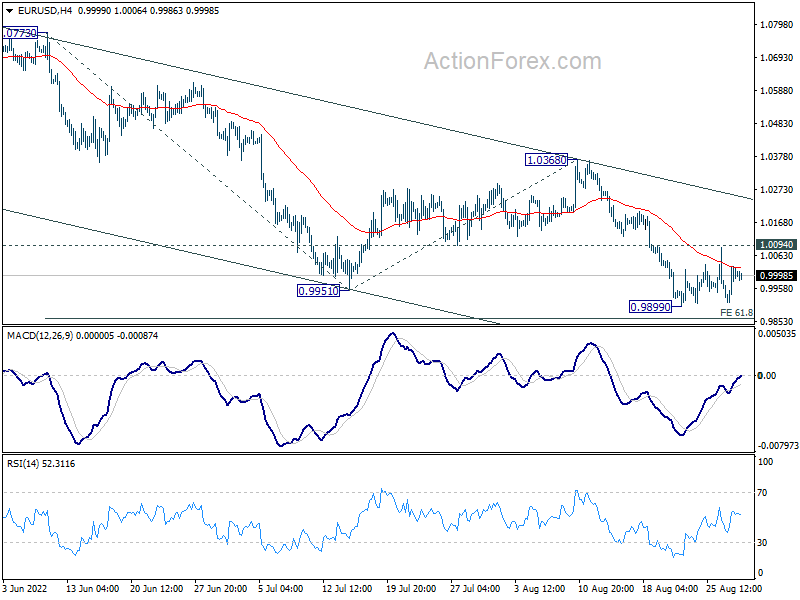
Intraday bias in EUR/USD stays neutral and further fall is expected with 1.0094 resistance intact. On the downside, break of 0.9899 will resume larger down trend to 61.8% projection of 1.0773 to 0.9951 from 1.0368 at 0.9860. Firm break there should prompt downside acceleration to 100% projection at 0.9546. However, firm break of 1.0094 minor resistance will dampen this bearish view, and turn bias back to the upside for 1.0368 resistance instead.
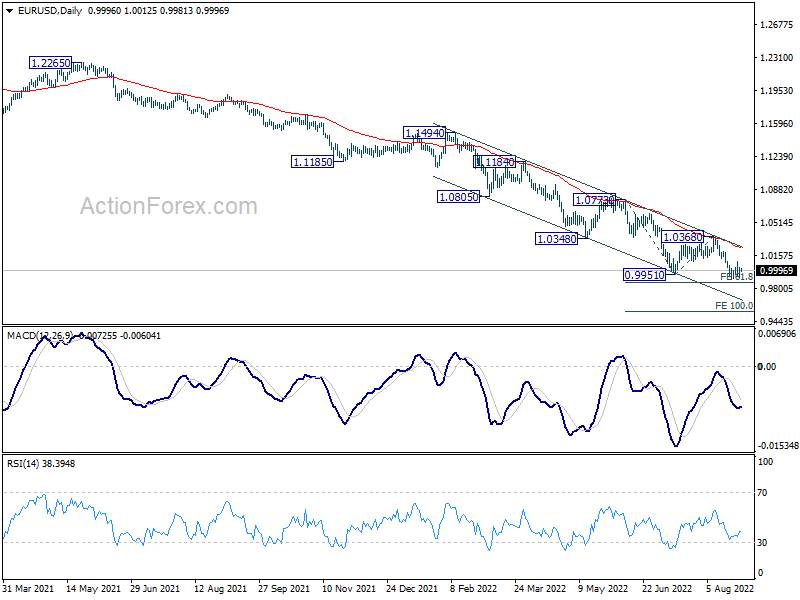
In the bigger picture, down trend from 1.6039 (2008 high) is still in progress. Next target is 100% projection of 1.3993 to 1.0339 from 1.2348 at 0.8694. In any case, outlook will stay bearish as long as 1.0368 resistance holds, in case of strong rebound.
USD/JPY Daily Outlook
Daily Pivots: (S1) 136.67; (P) 137.12; (R1) 137.96; More...
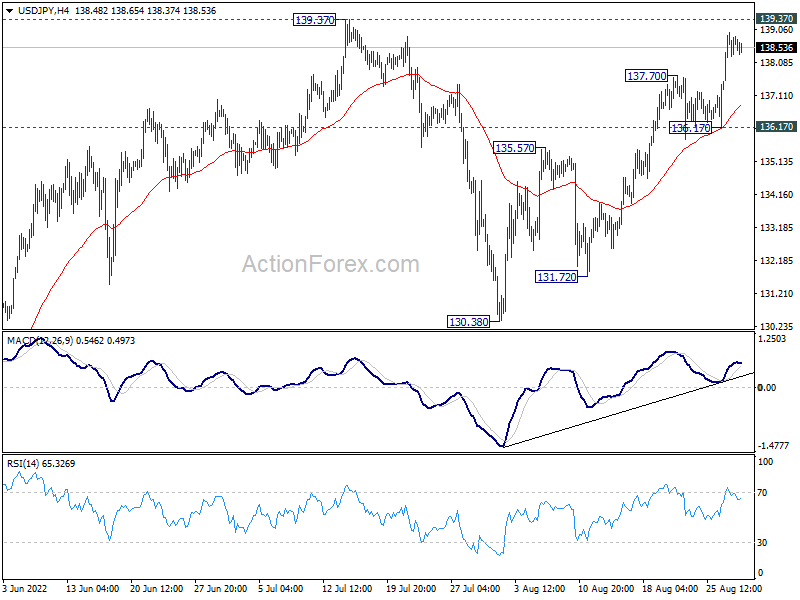
USD/JPY's rally is still in progress for 139.37 high. Strong resistance could be seen there to limit upside, to start the third leg of the corrective pattern from 139.37. Break of 136.17 minor support will turn bias back to the downside for 130.38 support. Nevertheless, decisive break of 139.37 will confirm up trend resumption for 147.68 long term resistance.
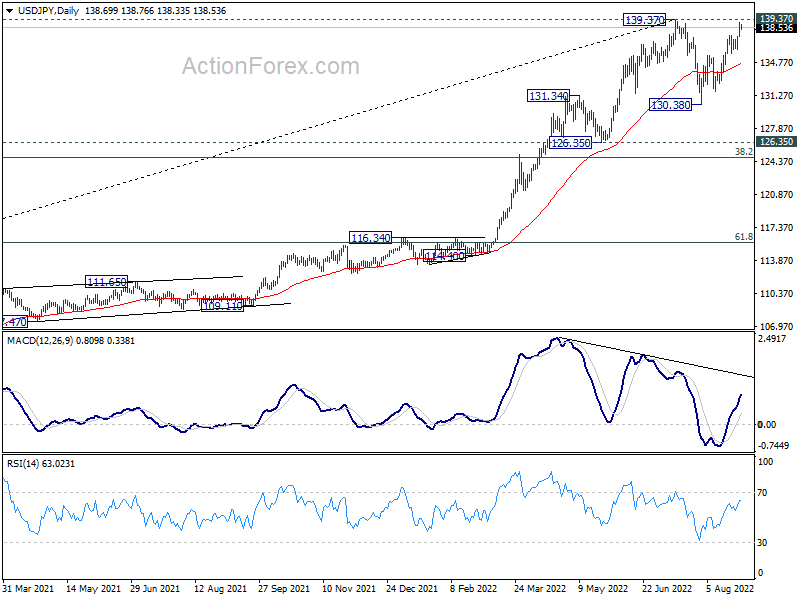
In the bigger picture, price actions from 139.37 medium term top are seen as a corrective pattern to up trend from 101.18 (2020 low). While deeper decline cannot be ruled out, outlook will stays bullish as long as 55 week EMA (now at 123.72) holds. Long term up trend is expected to resume through 139.37 at a later stage, after the correction finishes. Next target is 147.68 (1998 high).
GBP/USD Daily Outlook
Daily Pivots: (S1) 1.1655; (P) 1.1700; (R1) 1.1750; More...
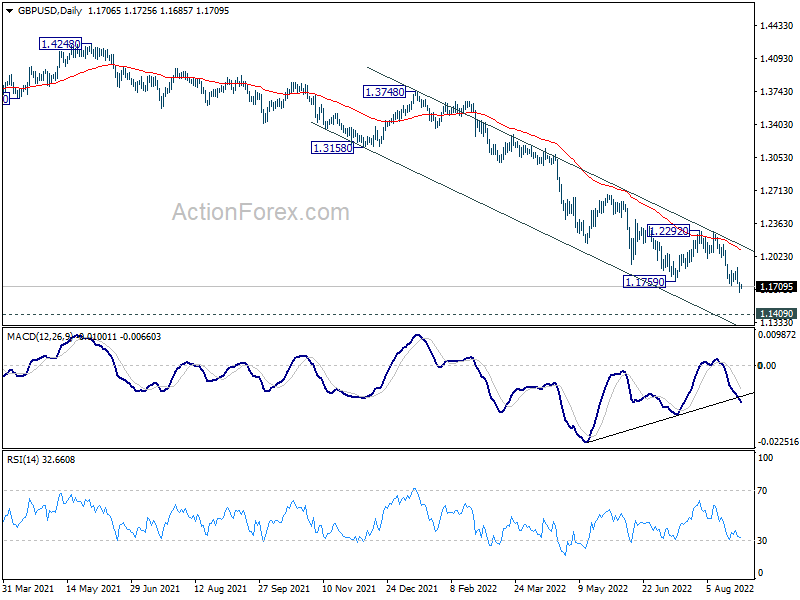
Intraday bias in GBP/USD stays on the downside despite some recovery. Current decline should target 1.1409 long term support. On the upside, above 1.1899 minor resistance will turn intraday bias neutral again. But outlook will stay bearish as long as 1.2292 resistance holds, in case of recovery.
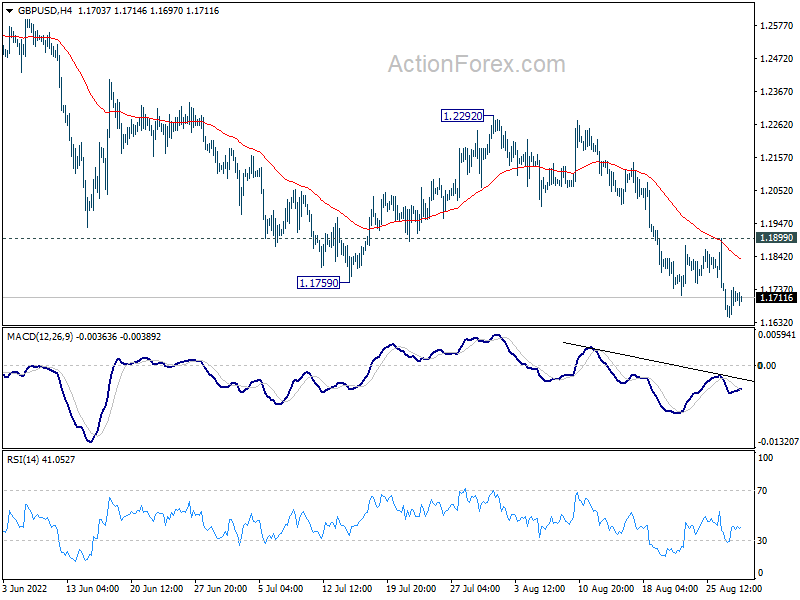
In the bigger picture, fall from 1.4248 (2018 high) could be a leg inside the pattern from 1.1409 (2020 low), or resuming the longer term down trend. Deeper decline is expected as long as 1.2292 resistance holds. Next target is 1.1409 low. However, firm break of 1.2292 will bring stronger rise back to 55 week EMA (now at 1.2859).