Sample Category Title
USD/CHF Daily Outlook
Daily Pivots: (S1) 0.9655; (P) 0.9682; (R1) 0.9709; More...
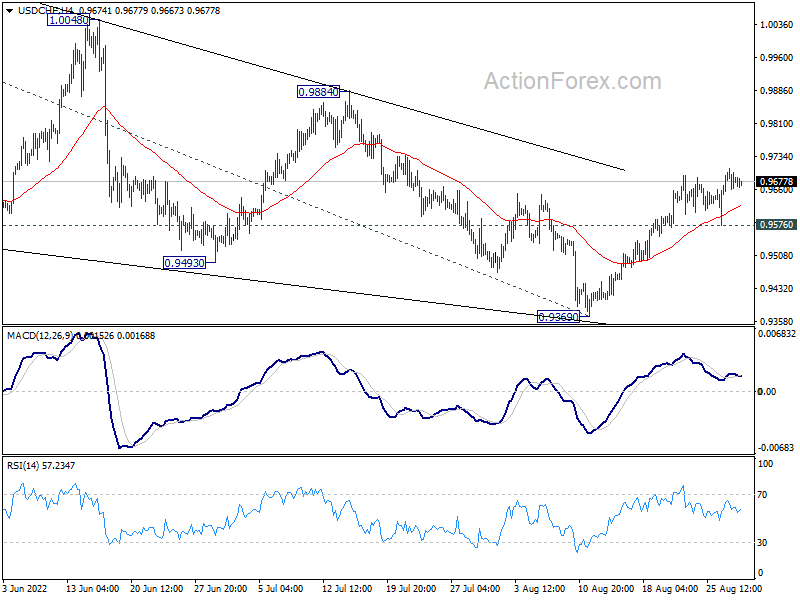
With 0.9576 minor support intact, further rise is expected in USD/CHF. Outlook is unchanged that triangle correction from 1.0063 could have completed at 0.9369 already. Further rally should be seen to 0.9884 resistance next. Break there will argue that larger up trend is ready for resumption through 1.0063. On the downside, below 0.9576 minor support will dampen this view and turn bias back to the downside for 0.9369 support instead.
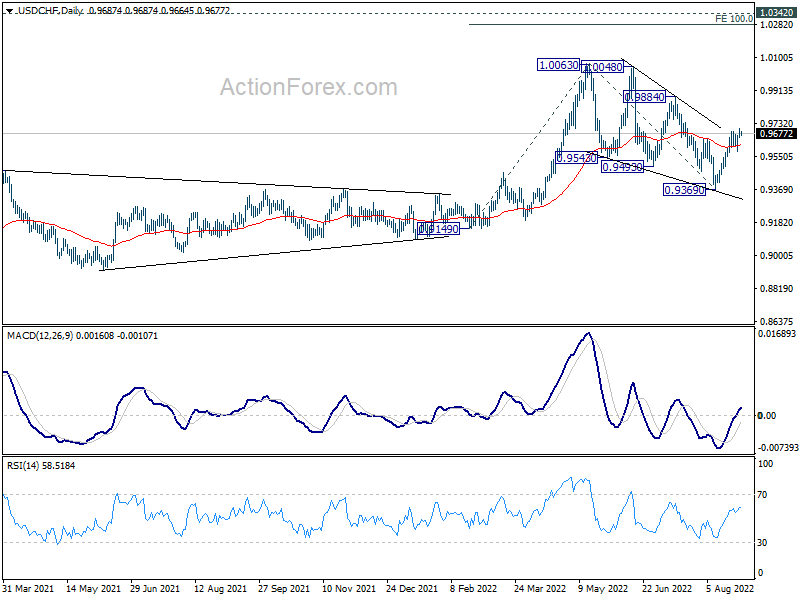
In the bigger picture, current development suggests that up trend from 0.8756 (2021 low) is still in progress. Sustained break of 1.0063 will target 100% projection of 0.9149 to 1.0063 from 0.9369 at 1.0283, and then 1.0342 (2016 high). For now, this will remain the favored case as long as 0.9369 support holds, even in case of deep pull back.
AUD/USD Daily Report
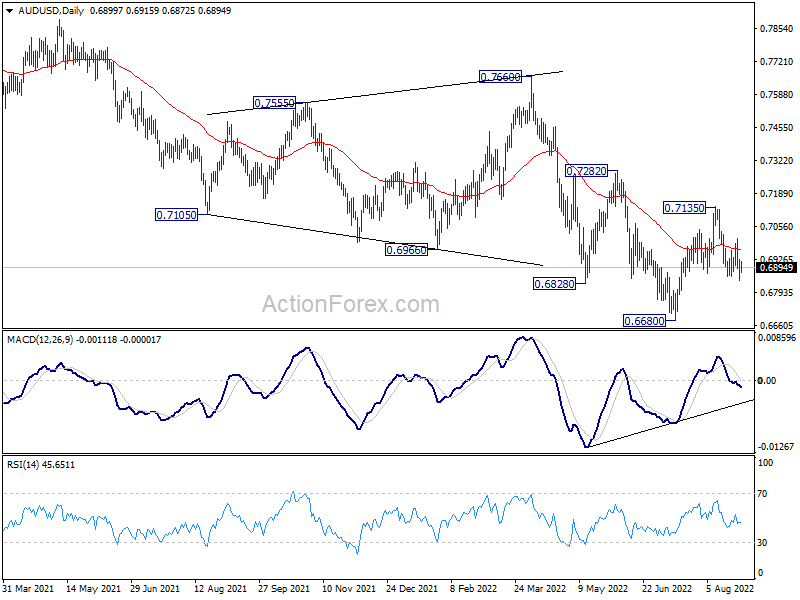
Daily Pivots: (S1) 0.6853; (P) 0.6890; (R1) 0.6938; More...
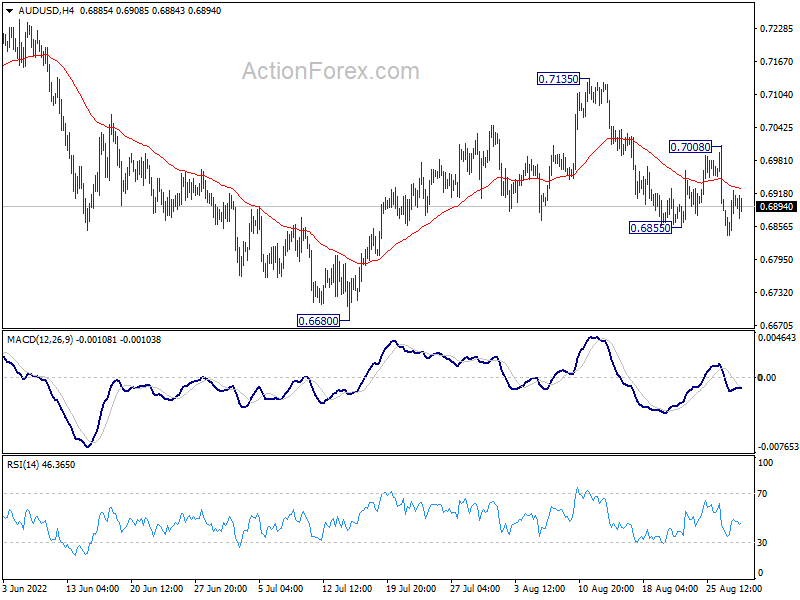
Further decline is expected in AUD/USD as long as 0.7008 minor resistance holds. . As noted before, corrective rebound from 0.6680 could have completed with three waves up to 0.7135. Retest of 0.6680 should be seen next. Firm break there will resume larger down trend. However, break of 0.7008 will turn bias back to the upside for 0.7135 resistance instead.
In the bigger picture, price actions from 0.8006 (2021 high) is seen more as a corrective pattern to rise from 0.5506 (2020 low). Or it could also be a bearish impulsive move. In either case, outlook will remain bearish as long as 0.7282 resistance holds. Next target is 61.8% retracement of 0.5506 to 0.8006 at 0.6461.
USD/CAD Daily Outlook
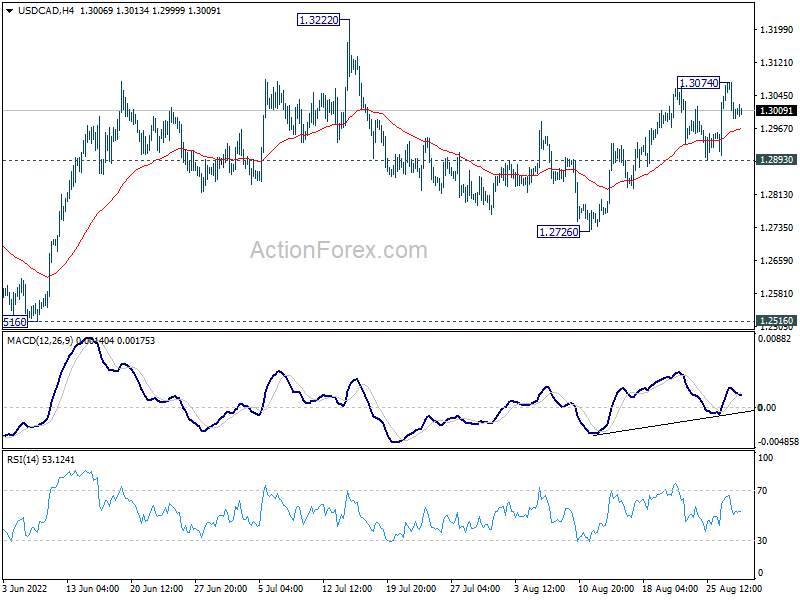
Daily Pivots: (S1) 1.2977; (P) 1.3027; (R1) 1.3062; More...
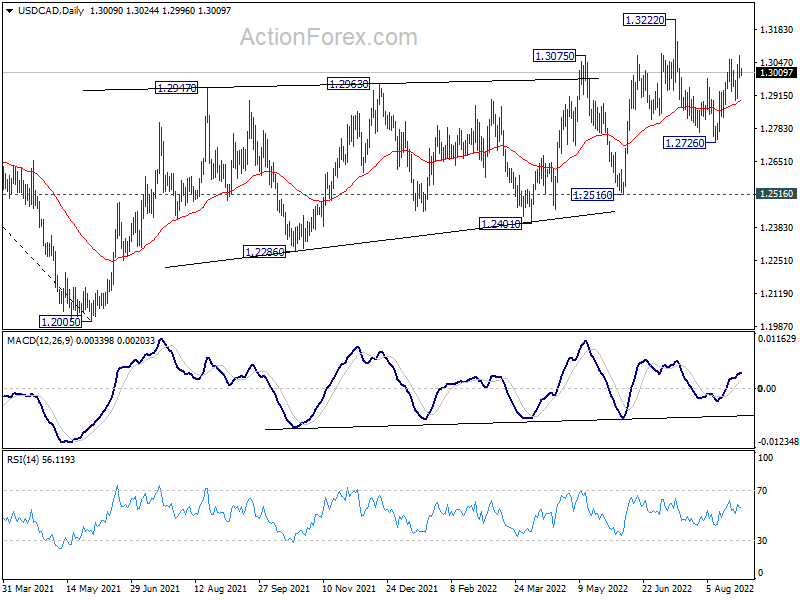
USD/CAD retreated after edging higher to 1.3074 and intraday bias is turned neutral. Further rally is in favor as long as 1.2893 support holds. Above 1.3074 will resume the rise from 1.2726 to retest 1.3222 high. Decisive break there will resume larger up trend. However, break of 1.2893 will turn bias back to the downside for 1.2726 support instead.
In the bigger picture, down trend from 1.4667 (2020 high) should have completed at 1.2005, after defending 1.2061 long term cluster support. Rise from there should target 61.8% retracement of 1.4667 to 1.2005 (2021 low) at 1.3650. This will remain the favored case now as long as 1.2516 support holds.
GBP/JPY Daily Outlook
Daily Pivots: (S1) 161.63; (P) 162.14; (R1) 162.88; More...
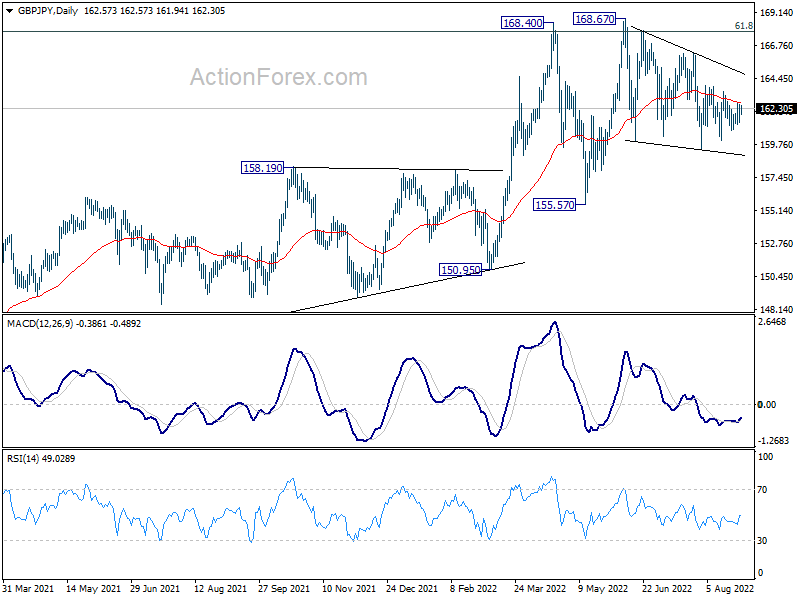
GBP/JPY is still bounded inside sideway trading and intraday bias stays neutral. Corrective pattern from 168.67 would extend for a while. On the upside, break of 163.91 will bring stronger rise to 166.31 resistance. On the downside, below 160.07 will turn bias to the downside for 159.42 and below.
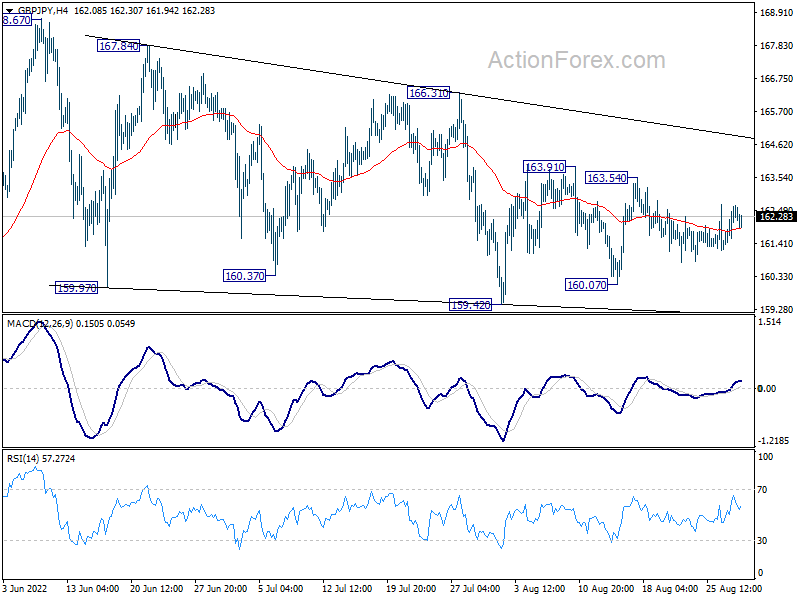
In the bigger picture, up trend from 123.94 (2020 low) is still in progress. Sustained break of 61.8% retracement of 195.86 (2015 high) to 122.75 (2016 low) at 167.93 will be a long term bullish signal, and could pave the way back to 195.86 high. This will remain the favored case as long as 155.57 support holds, even in case of deep pull back.
EUR/JPY Daily Outlook
Daily Pivots: (S1) 137.48; (P) 138.23; (R1) 139.44; More....
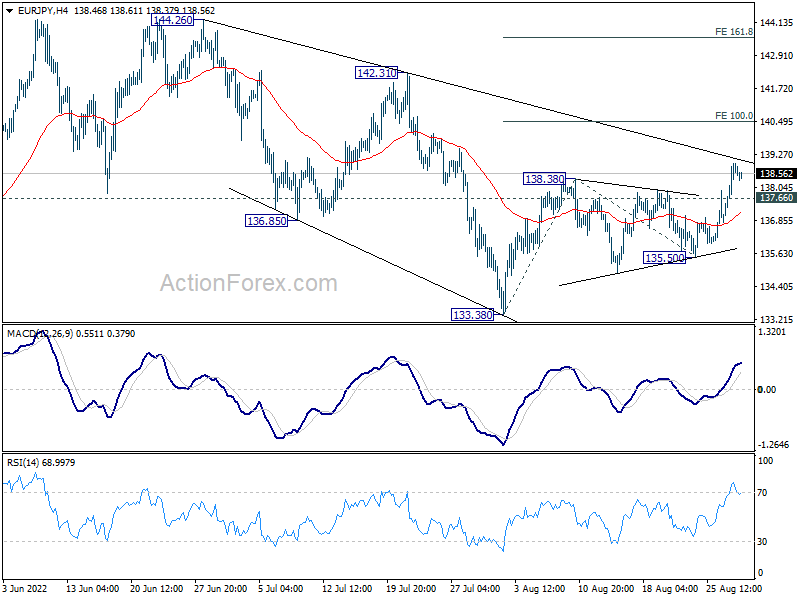
Intraday bias in EUR/JPY remains on the upside at this point. Current rally from 113.38 should target 100% projection of 133.38 to 138.38 from 135.50 at 140.50. Decisive break there will indicate upside acceleration, and raise the chance of up trend resumption through 144.26 high. On the downside, below 137.66 minor support will turn intraday bias neutral again.
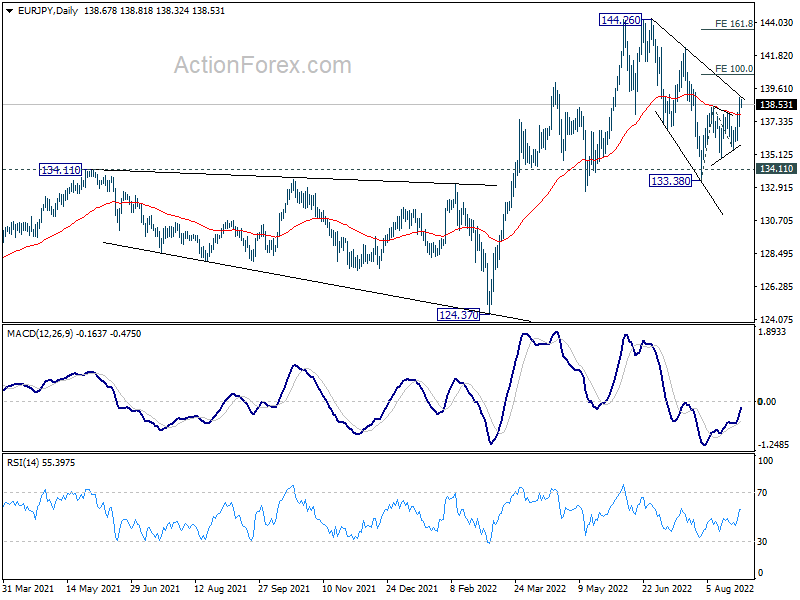
In the bigger picture, up trend from 114.42 (2020 low) is seen as the third leg of the pattern from 109.30 (2016 low). Further rally is in favor as long as 134.11 resistance turned support holds, even in case of deep pull back. Next target is 149.76 (2015 high). However, sustained break of 134.11 will be a sign of medium term bearish reversal and turn focus to 124.37 support for confirmation.
EUR/GBP Daily Outlook
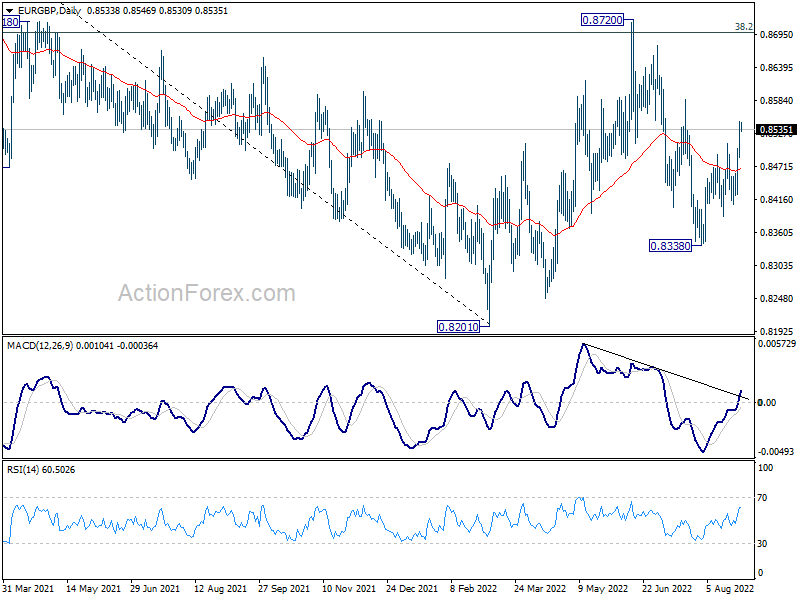
Daily Pivots: (S1) 0.8503; (P) 0.8526; (R1) 0.8566; More...
Intraday bias in EUR/GBP stays on the upside, as rise from 0.8338 is in progress. Break of 0.8585 will bring further rally to 0.8720 resistance. On the downside, below 0.8501 minor support will turn intraday bias neutral first. But break of 0.8406 support is needed to confirm completion of the rebound. Otherwise, further rally will remain mildly in favor in case of retreat.
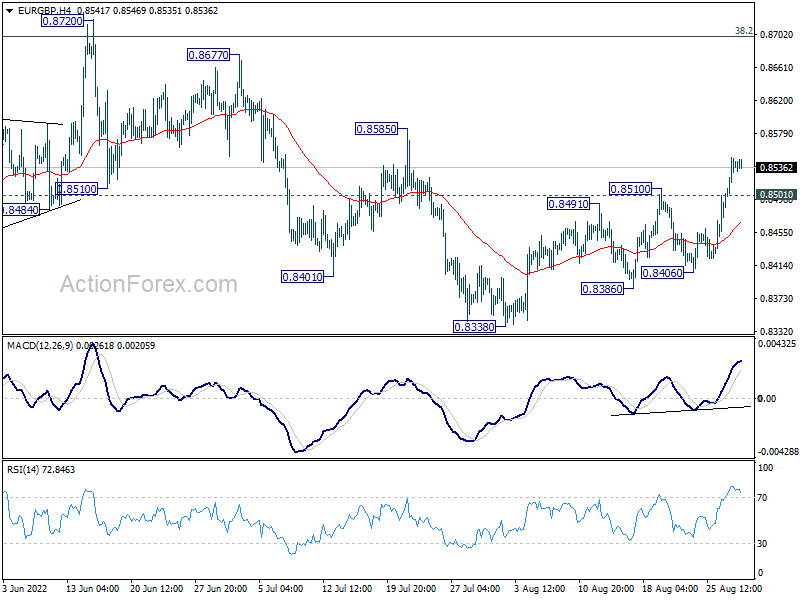
In the bigger picture, medium term bearishness is maintained with prior rejection by 38.2% retracement of 0.9499 to 0.8201 at 0.8697. Break of 0.8201 will resume larger down trend from 0.9499 (2020 high). Nevertheless, sustained break of 0.8697 will affirm the case that rise from 0.8201 is a medium term up trend itself.
EUR/AUD Daily Outlook
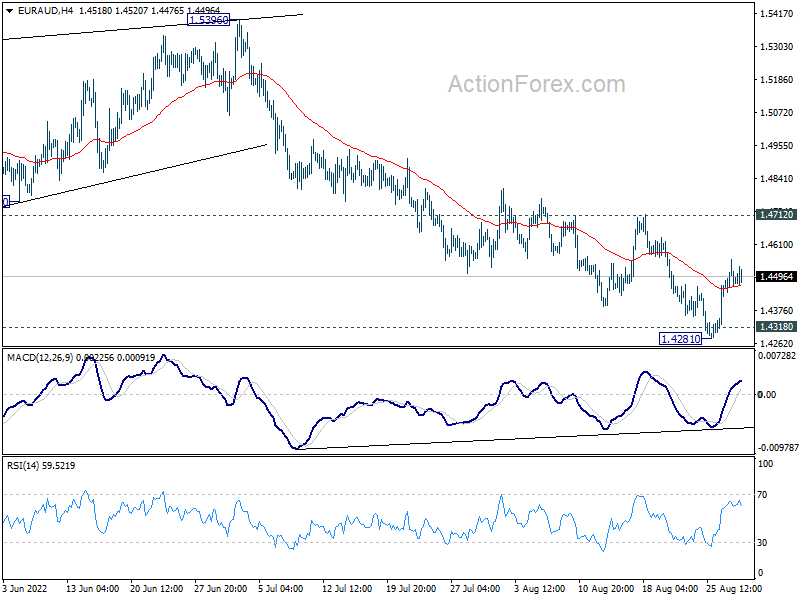
Daily Pivots: (S1) 1.4434; (P) 1.4496; (R1) 1.4549; More...
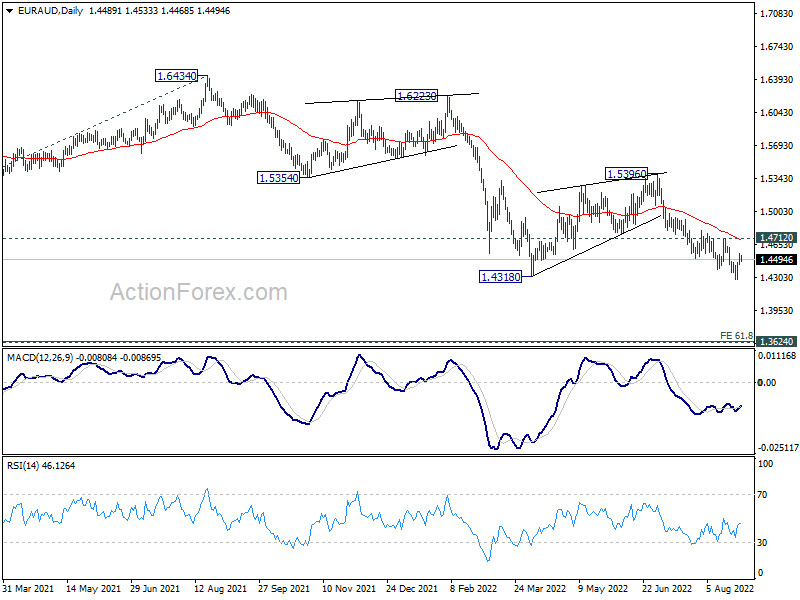
Intraday bias in EUR/AUD stays neutral, and further decline is expected with 1.4712 resistance intact. On the downside, firm break of 1.4318 low will resume larger down trend to medium term projection level at 1.3623. On the upside, break of 1.4712 resistance will turn bias back to the upside for stronger rebound, towards 1.5396 resistance.
In the bigger picture, down trend from 1.9799 is still in progress. Break of 1.4318 low will target 61.8% projection of 1.9799 to 1.5250 from 1.6434 at 1.3623, which is close to 1.3624 long term support (2017 low). This will remain the favored case now as long as 1.5396 resistance holds.
Europeans Will Step in to Stop the Soaring Energy Prices
The S&P 500 stepped into the bearish consolidation zone after having cleared a major Fibonacci resistance, the 38.2% retracement on the summer rally. Nasdaq fell another 1% and tested the 50-DMA to the downside, where it found support, while the German DAX fell to the lowest levels since mid-July, and has given back more than 75% of the summer gains.
The US futures look better this morning, but the market sentiment will likely remain morose after Powell’s clear declaration that the Federal Reserve (Fed) will have no pity for the markets, and continue tightening its policy until it puts inflation on a sustainable path toward its 2% policy target.
At this point, it’s difficult to get a pricing that goes against the Fed.
Anyway, all that Fed drama doesn’t concern the energy stocks, which had a good session yesterday thanks to firmer oil prices. The barrel of US crude advanced past the 200-DMA, which a touch below $97 per barrel. Exxon mobile jumped 2.30% to above $100 for the first time since mid-June, as Occidental Petroleum advanced to the highest levels since October 2018, and closed at $75 per share.
The European nat gas futures however slumped 20% yesterday, as Germany said its gas stores are filling up faster than planned.
But energy prices remain exorbitantly high, and governments are increasingly frustrated with the skyrocketing energy prices that hammer economies and households, while putting a lot of money in energy companies’ pockets.
As a result, the European policymakers are now cooking new measures to stop the excessive rise in energy prices and decouple the price of gas from electricity. The measures will likely include taxes on excessive earnings. If this is the case, the energy companies could react by reducing output, with the risk of further deepening the energy crisis.
Germany and Spain will release the latest inflation update today. The euro is making a great effort to throw itself above parity against the US dollar, and stronger than expected inflation figures could help boosting the European Central Bank (ECB) hawks.
Happily, it looks like the Powell pricing on the dollar is done for now, which means that we can also see some relief on the euro front. However, the topside will likely remain limited in the EURUSD, and we expect to see the strong 50-DMA continue to hold near 1.0120.
Will EU Intervention in the Electricity Market Work?
Market movers today
ECB Governing Council member Klaas Knot speaks at our Danske Talks hybrid event today, where we will discuss the monetary policy outlook (see registration here). Hawkish ECB Governing Council members Holzmann, Muller and Wunsch will also speak along with dove Stournaras about "Inflation: Can Central Banks Cope?" at the Alpbach Forum in Austria.
In Europe, inflation will remain in focus today, as German and Spanish HICP figures for August are released. The numbers could show a further increase in inflation pressures despite government efforts to stem the rise in prices.
US consumer confidence for August, JOLTS job openings and house price data are also on the agenda. New York Fed President Williams will speak about the US economic outlook.
In Sweden we look forward to wage data and the NIER survey.
Discussions about further EU energy investments (especially a gas pipeline linking the Iberian Peninsula to the rest of Europe's network) will likely feature during a meeting between German chancellor Scholz and Spanish premier Sánchez.
The 60 second overview
ECB set to hike 75bp: We have changed our call on ECB from a rate hike of 50bp to 75bp on the back of the hawkish comments from ECB officials, see our ECB comment New ECB call - We expect 75bp at the meeting next week, 29 August. We now expect ECB to hike 75bp next week, which will be followed by 50bp in October and 25bp in December. We believe the euro area will face a recession and ECB will continue to hike despite the recession given the elevated level of inflation and the risk of rising inflation expectations. The 75bp is almost fully priced in the market rates. Hence, a 75bp rate hike at the upcoming meeting should not come as a big surprise. Nonetheless, the hike is substantial and will contribute to the ongoing efforts in curtailing (global) inflation over the medium term.
EU politicians want to intervene: Seemingly led by Ursual Von Der Leyen, it was widely reported yesterday that EU politicians intend to intervene in and reform the gas and electricity markets within 'days or weeks'. While the goal likely is to curtail the strong rise in prices, there has been little to no details as to how they might go about this. Most speculation relates to what other politicians and member states have previously suggested such as a cap on prices.
Equities: Equities were lower yesterday across regions in a post-Jackson Hole reaction. Hence, the hawkish stagflation trade continued with Min Vol, defensive and value outperforming. VIX took another step higher to north of 26 and thereby opening up for more two-sided risk compared to a couple of weeks back where VIX was below 20. In US Dow -0.6%, S&P 500 -0.7%, Nasdaq -1.0% and Russell 2000 -0.9%. Asian stocks are higher this morning and the same goes for European and US futures.
FI: It was a challenging day in the global financial markets with a significant rise in global bond yields as well as a decline in equity prices on the back of the hawkish comments from both ECB and the Federal Reserve during the weekend.
FX: Hawkish comments from ECB over the weekend and a big drop in natural gas prices lent slight support to EUR/USD yesterday. The pair briefly rose above parity. USD/JPY rose close to 139 yesterday due to a rebound in long-term bond yields.
Credit: With the UK markets closed there was no trading in CDS indices and the primary market was also more or less closed. However, judging by the moves in other asset classes, credit will probably be weak today to catch up with yesterday's moves in other risky assets.
Nordic macro
Today, the Swedish National Mediation Office publishes wage data through June. The last report showed wage growth at 2.7%, in line with the pre-pandemic level. The centrally negotiated wages are expected to rise by 2% (y/y) through March 2023. It remains to be seen if this report yields any further signs of a pick-up in wage drift.
We also get the latest Economic Tendency Survey (ETS) from NIER. The takeaway from the last surveys have been increasingly depressed consumers, now at all-time-lows, whilst the manufacturing sector is seemingly still going strong. The general Economic Tendency Indicator is still signalling 'normal' levels, however extrapolating the recent trend it is only a matter of time before it is in contractionary territory, possible already today.
Technical Outlook and Review
USD/JPY:
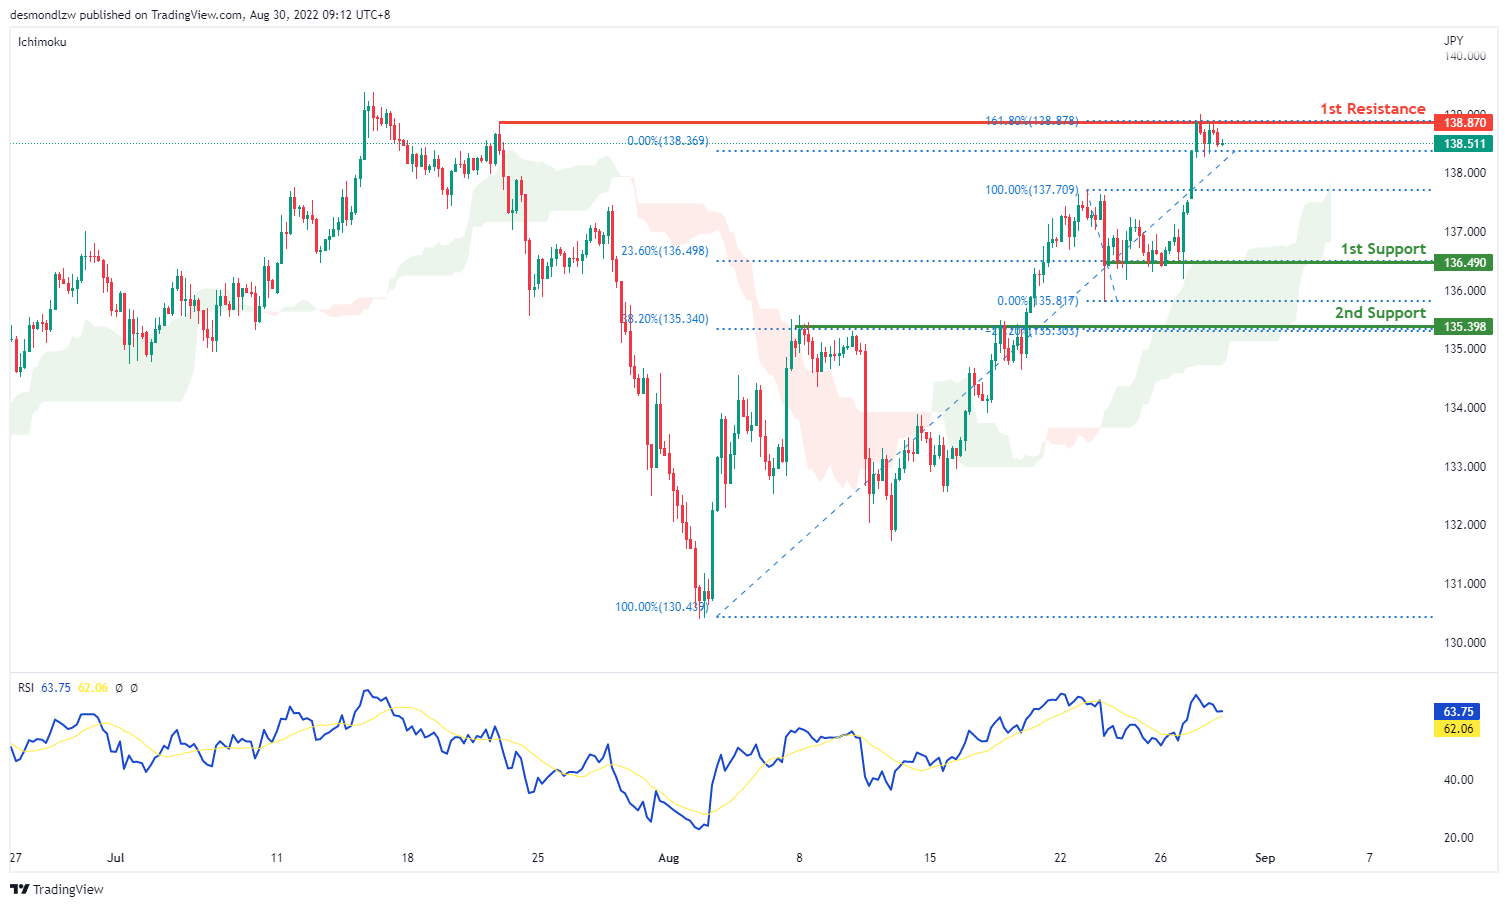
On the H4 chart, price has confirmed a bullish momentum breaking the previous high. We are bullish bias- Price has tested the first resistance at 138.870 where the previous swing high and 161.8% extension sits. If bullish momentum continues, it will bring price to 139.390 where the previous swing high sits. Alternatively, if price reverse, it might pull back to test the first support at 136.490 where the 23.6% fibonacci retracement sits then subsequently the second support at 135.398 where the 38.2% retracement sits
Areas of consideration:
- H4 time frame, 1st resistance at 138.870
- H4 time frame, 1st support at 136.490
DXY:
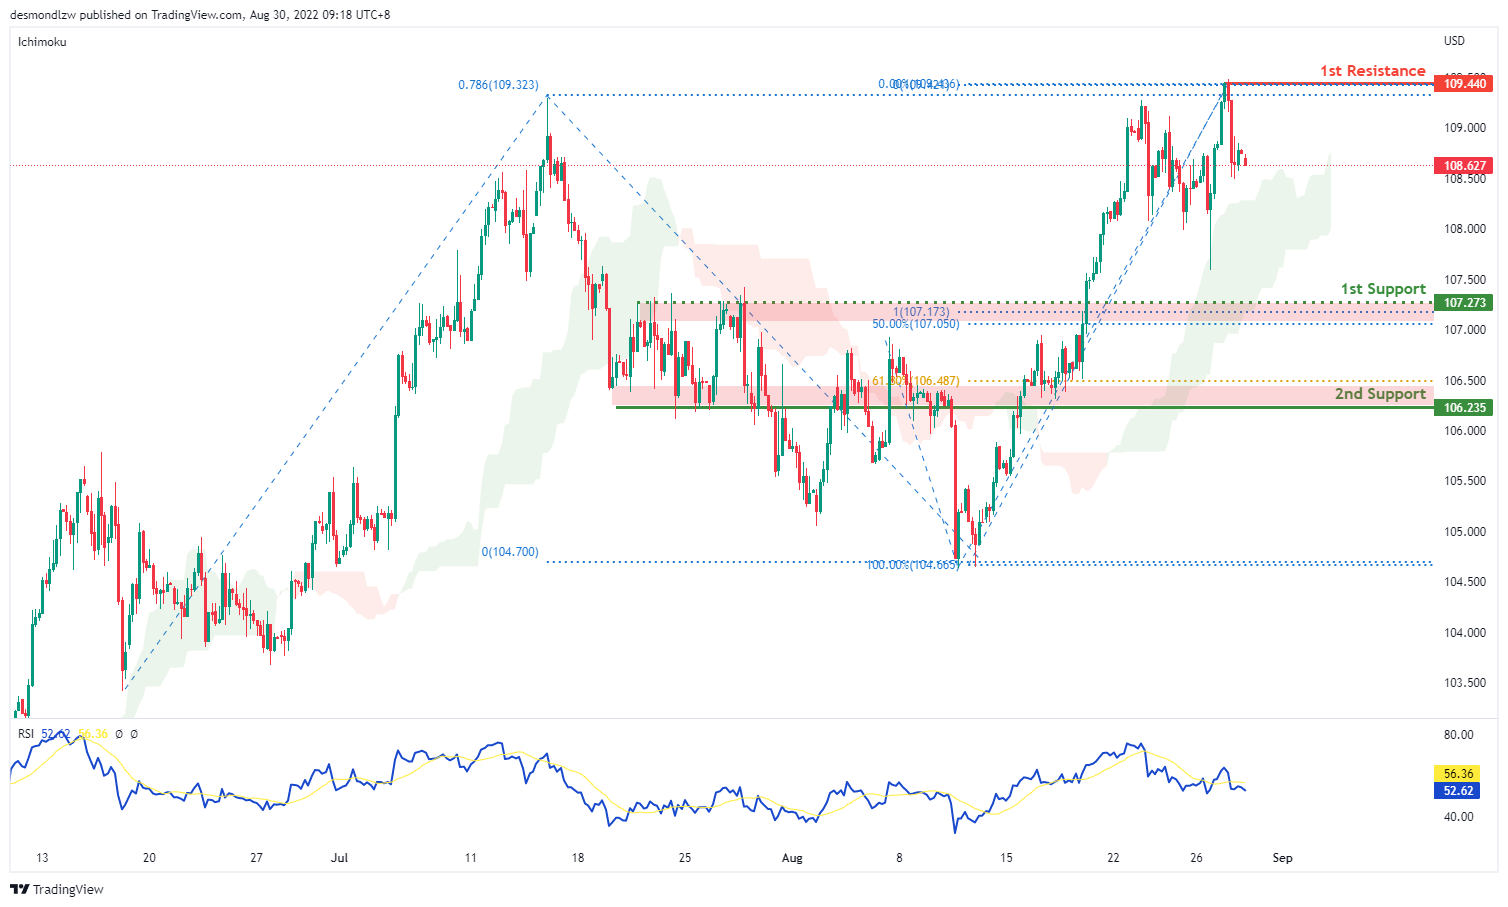
On the H4, price is still moving in an ascending trend and is in a bullish momentum. Price has tested the first resistance at 109.440 where the 78.6% Fibonacci projection and the previous swing high sits. If price fails to break this level, it will pull back to test the first support at 107.273 where the 50% retracement and 100% projection sits and subsequently the second support at 106.235 where the 61.8% retracement sits
Areas of consideration:
- H4 time frame, 1st resistance at 109.440
- H4 time frame, 1st support at 107.273
EUR/USD:
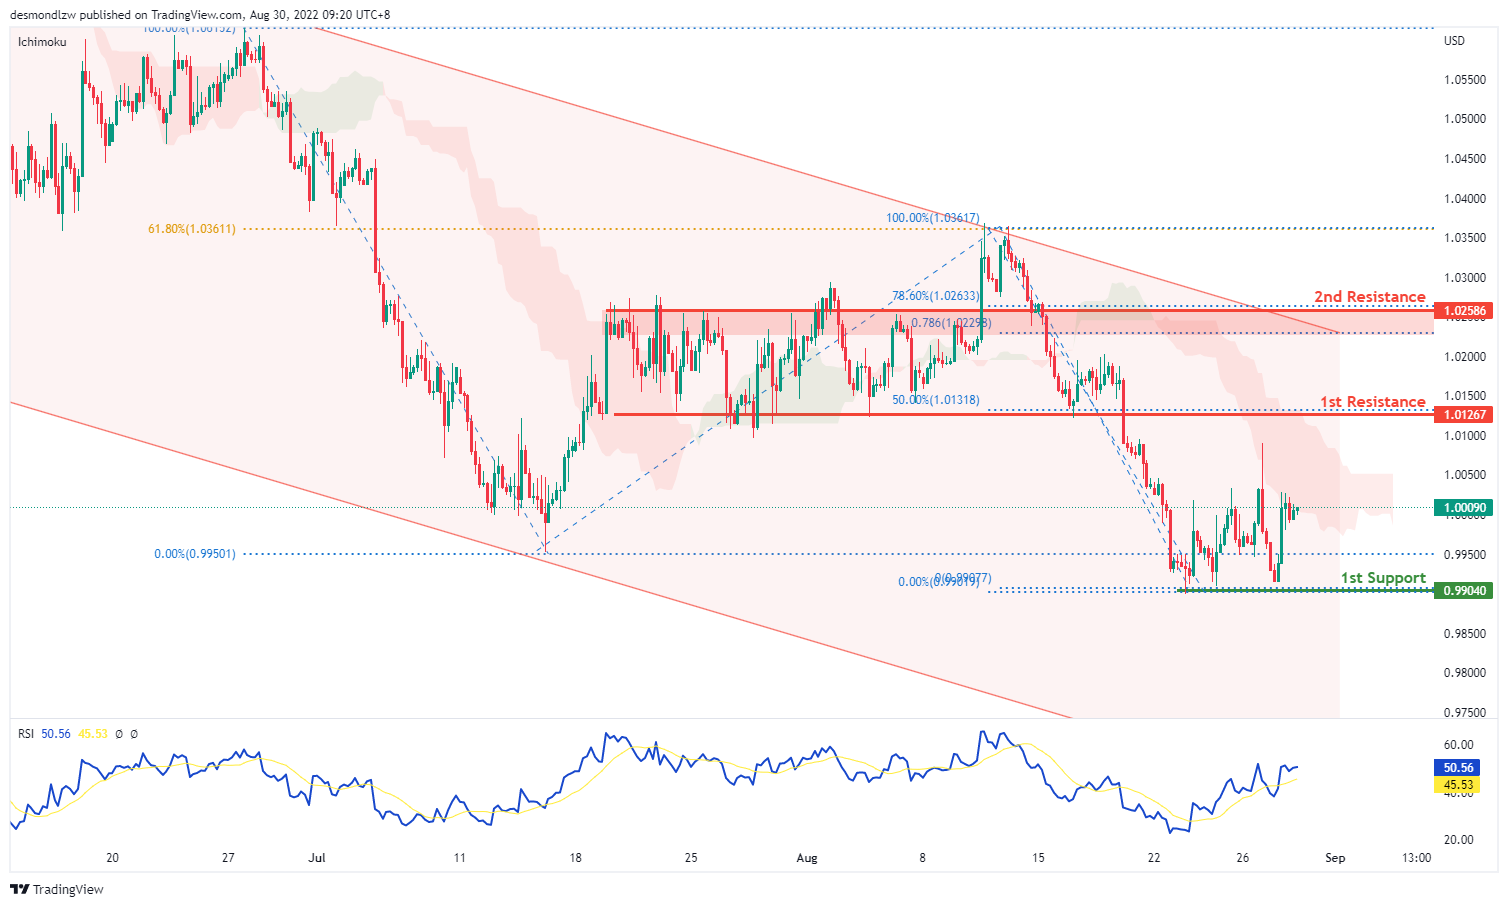
On the H4, prices have tested the first support again at 0.9904 where the 61.8% projection sits. Prices seem to have formed a triple bottom and have reversed – we are in a slightly bullish momentum. Price look like it’s pulling back to test the first resistance at 1.0126 where the previous swing low and 50% retracement sits and subsequently the second resistance at 1.0258 where the 78.6% retracement and swing high sits
Areas of consideration :
- H4 1st resistance at 1.0126
- H4 1st support at 0.9904
GBP/USD:
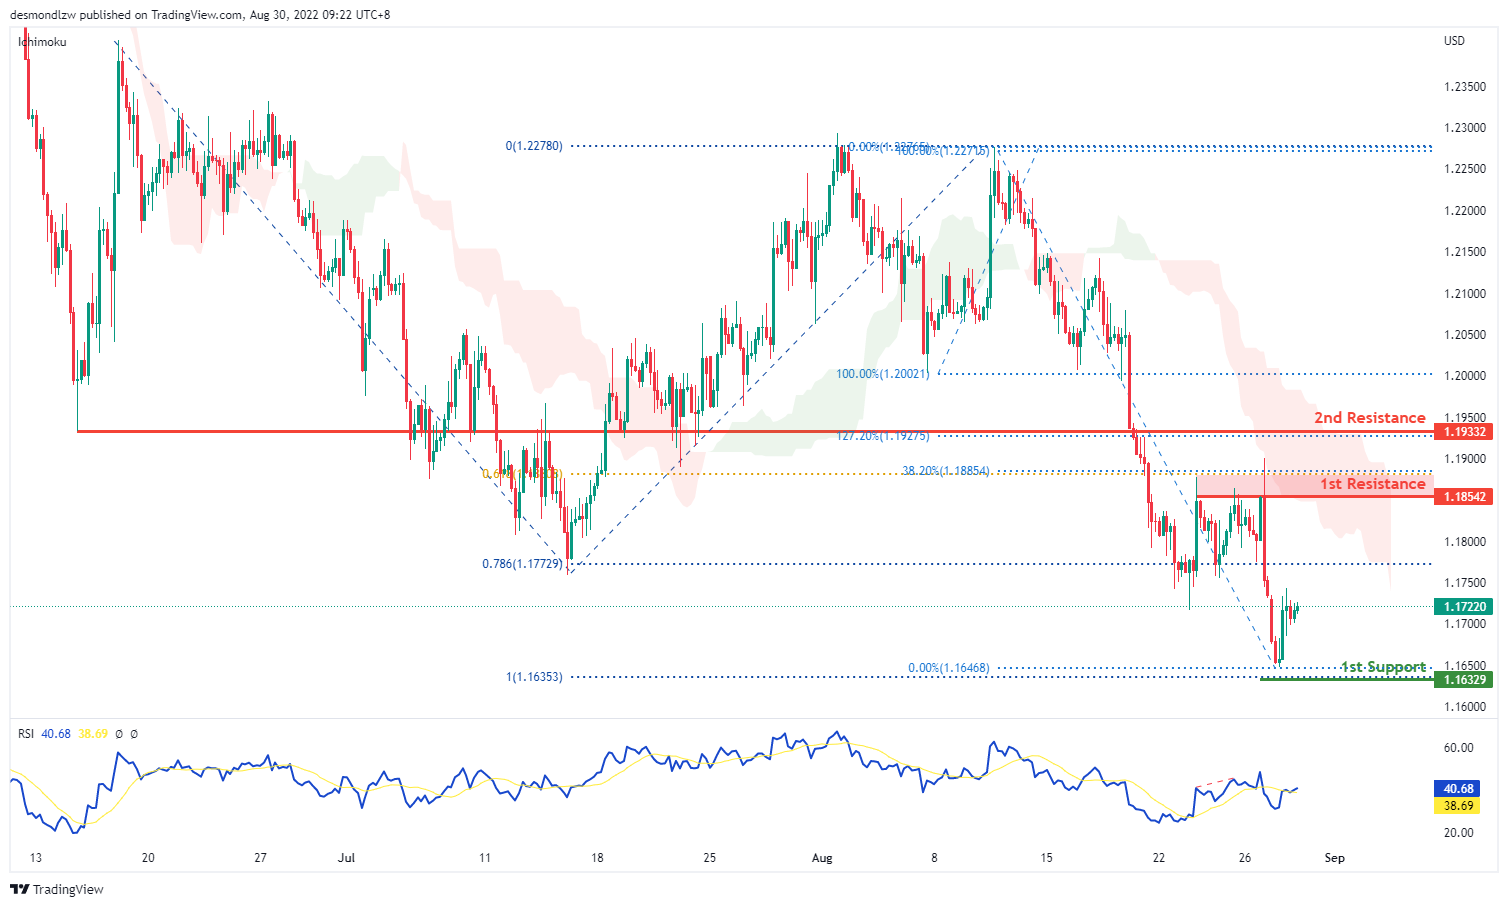
On the H4, prices seem to be in a bearish momentum and respecting the ichimoku cloud. Prices have broken the 78.6% projection level and have tested the first support, 100% projection at 1.1632 levels. Price has pulled back slightly and might look to test the first resistance at 1.1854 level where the 38.2% retracement sit then the second resistance at 1.1933 level where the previous swing low and 127.2% extension sits
Areas of consideration:
- H4 1st resistance at 1.1854
- H4 1st support at 1.1632
USD/CHF:
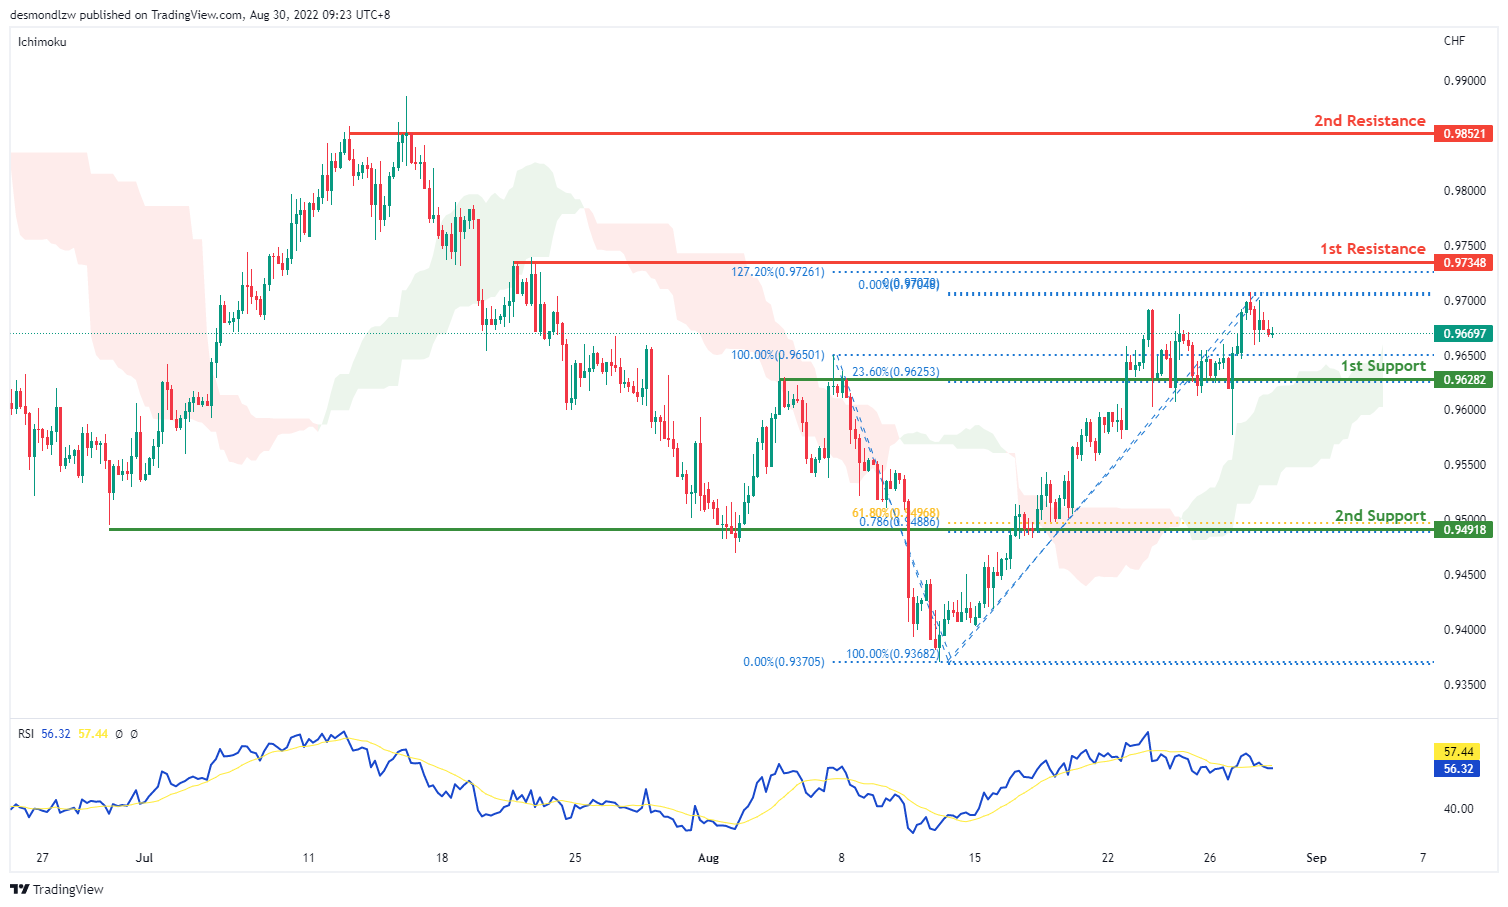
On the H4, with prices moving above the ichimoku cloud and breaking the descending trend, we are bullish bias. We’re looking at price to test the first resistance at 0.9734 where the 127.2% extension sits. If price continues with bullish momentum, it will bring price to second resistance at 0.9852. Alternatively, prices could pull back to test the first support at 0.96282 where the 23.6% fibonacci retracement and previous swing low sits then the second support at 0.9491 where the 61.8% retracement and 78.6% projection sits
Areas of consideration
- H4 1st support at 0.9628
- H4 1st resistance at 0.9734
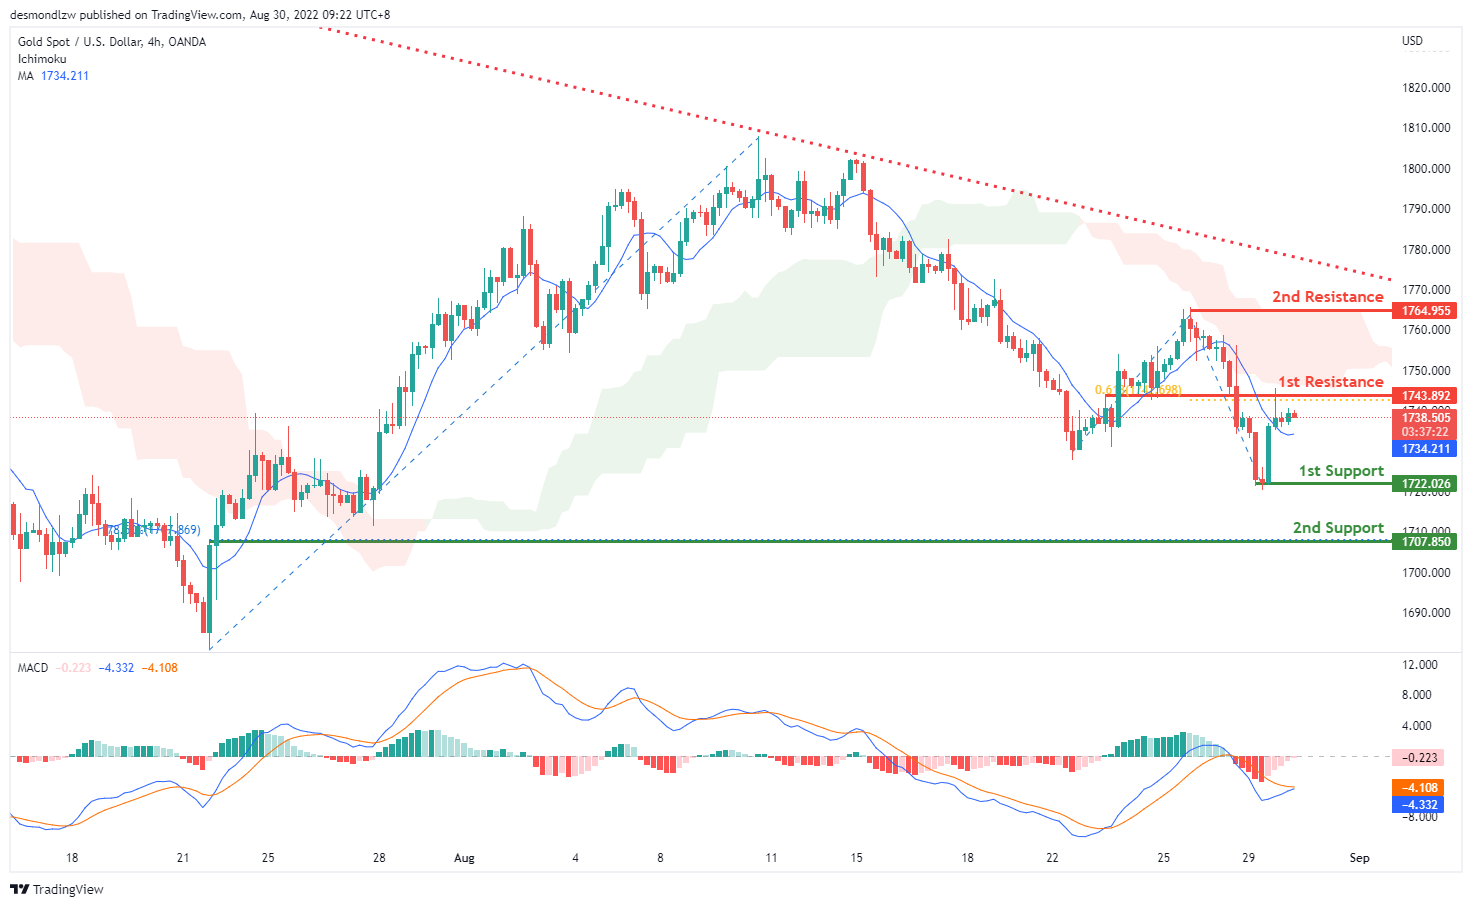
XAU/USD (GOLD):
On the H4, with prices moving below ichimoku cloud and long term descending trendline, we have a bearish bias. As the price is above MA and MACD is showing a golden cross signal, we can expect the price bullback to the 1st resistance at 1743.892 first, which is in line with the 61.8% fibonacci projection and then drop to the 1st support at 1722.026, where the swing low is. If the price breaks the 1st support, we can expect the price drop to the 2nd support at 1707.850, where the 78.6% fibonacci retracement is. Alternatively, the price may break the 1st resistance at 1743.892 and then rise to the 2nd resistance at 1764.955, where the swing high is.
Areas of consideration:
- H4 time frame, 1st resistance at 1743.892
- H4 time frame, 1st support at 1722.026
AUD/USD:
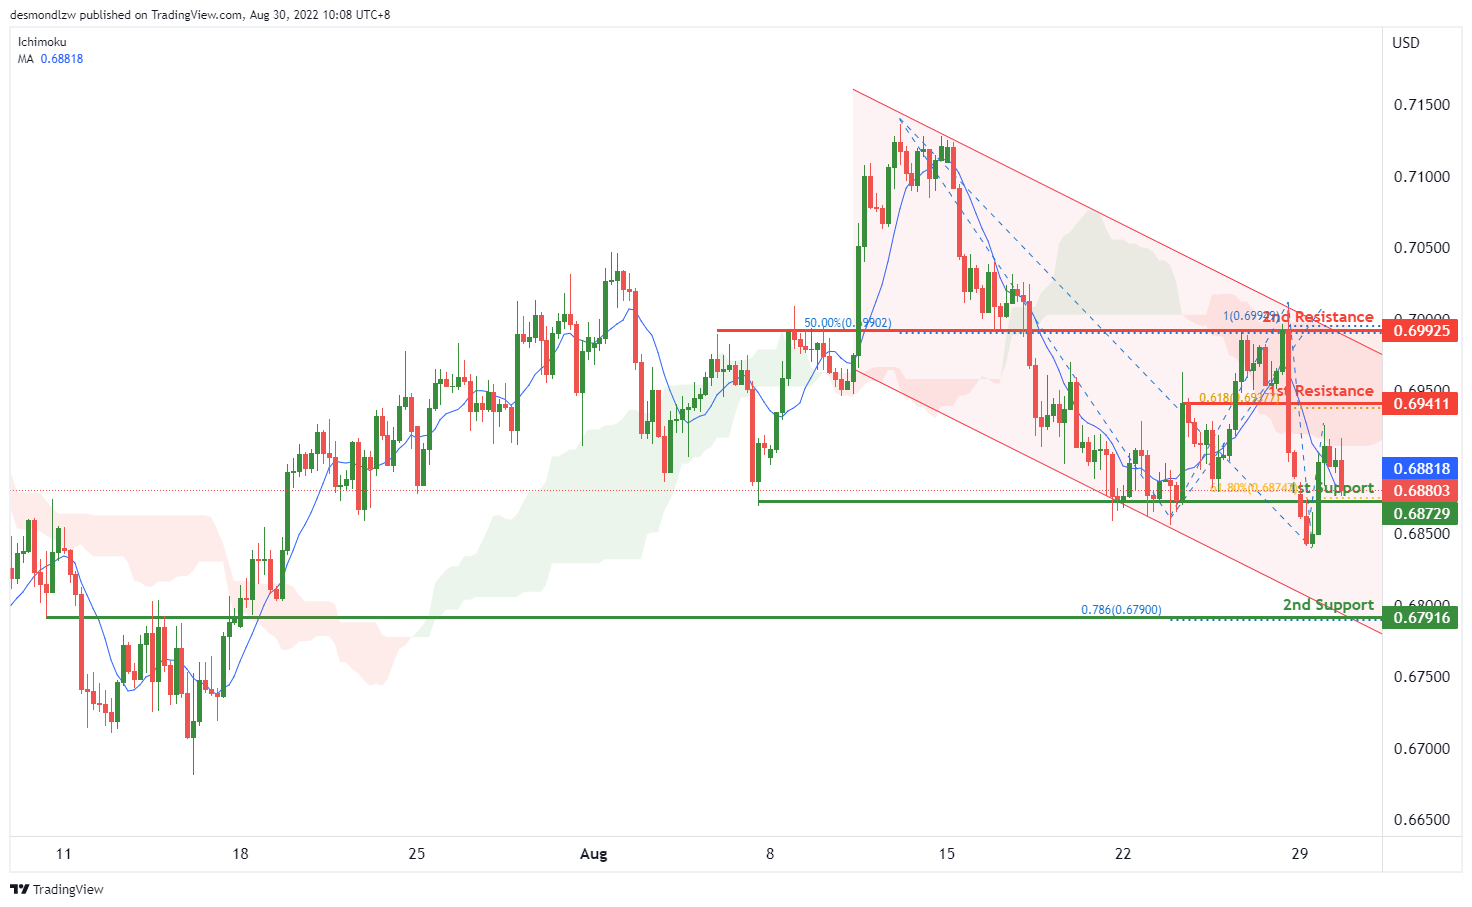
On the H4, with the price moving below the ichimoku cloud and moving within the descending channel, we have a bearish bias that the price may drop from the 1st support at 0.68729, which is in line with the swing lows and 61.8% fibonacci retracement to the 2nd support at 0.67916, where the overlap support and 78.6% fibonacci projection are. Alternatively, the price may rise to the 1st resistance at 0.69411, where the 61.8% fibonacci projection and previous swing high are. If the price can break this resistance level, we can expect the price to rise to the 2nd resistance at 0.69925, where the swing highs, 50% fibonacci retracement and 100% fibonacci projection are.
Areas of consideration
- H4 1st support at 0.68729
- H4 2nd support at 0.67916
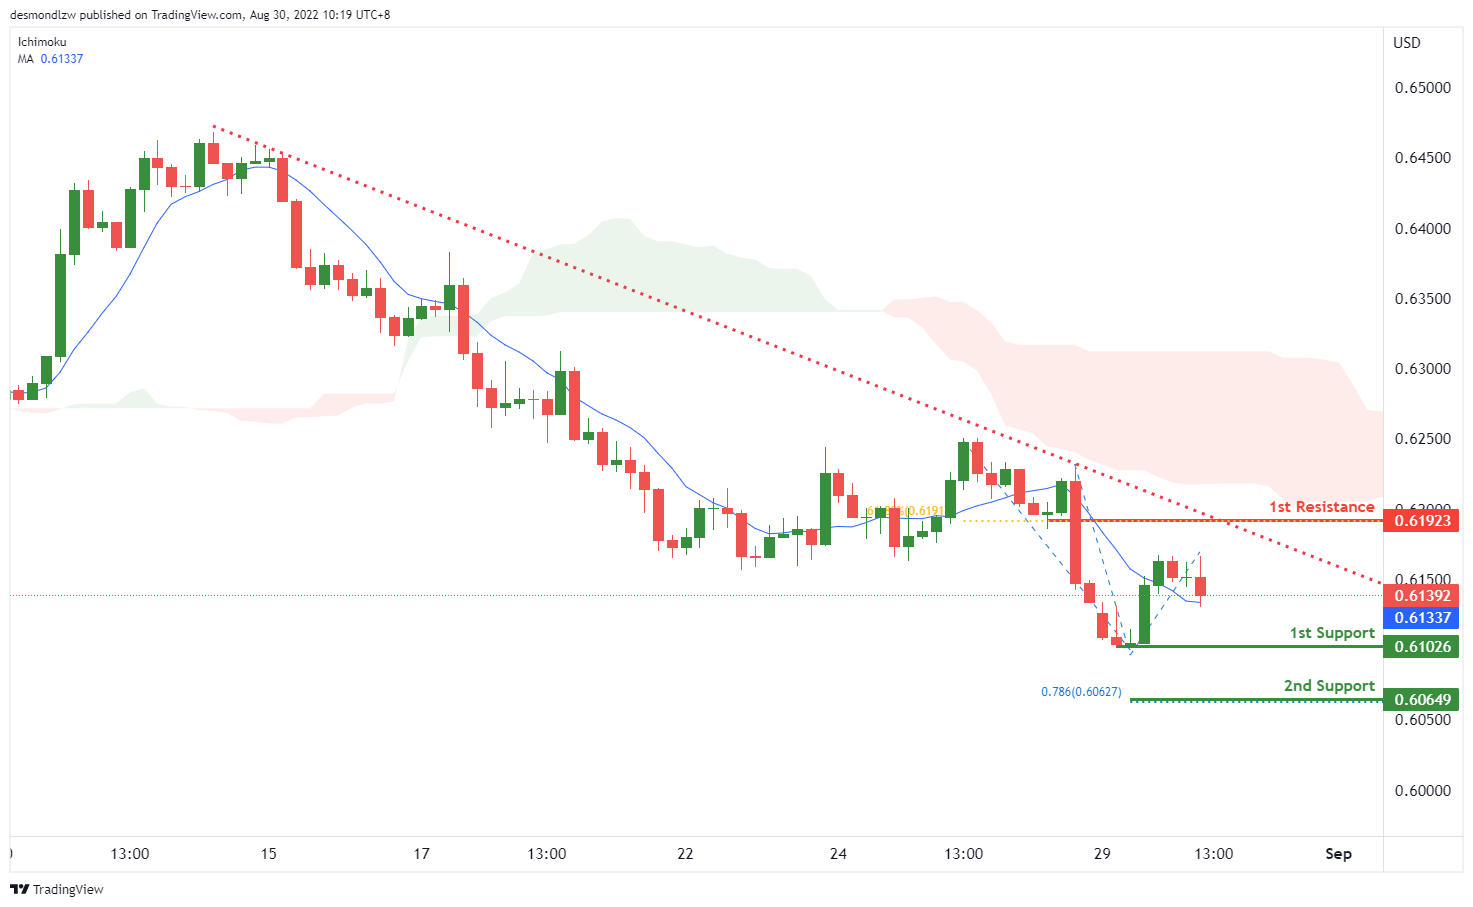
NZD/USD:
On the H4, with price moving within the descending trendline, below the ichimoku indicator and breaking the MA, we have a bearish bias that price may drop to 1st support at 0.61026, where the swing low is to the 2nd support at 0.60649, where the 78.6% fibonacci projection is. Alternatively, price could rise to 1st resistance at 0.61923, which is in line with 61.8% fibonacci retracement.
Areas of consideration:
- H4 time frame, 1st support at 0.61026
- H4 time frame, 2nd support at 0.60649
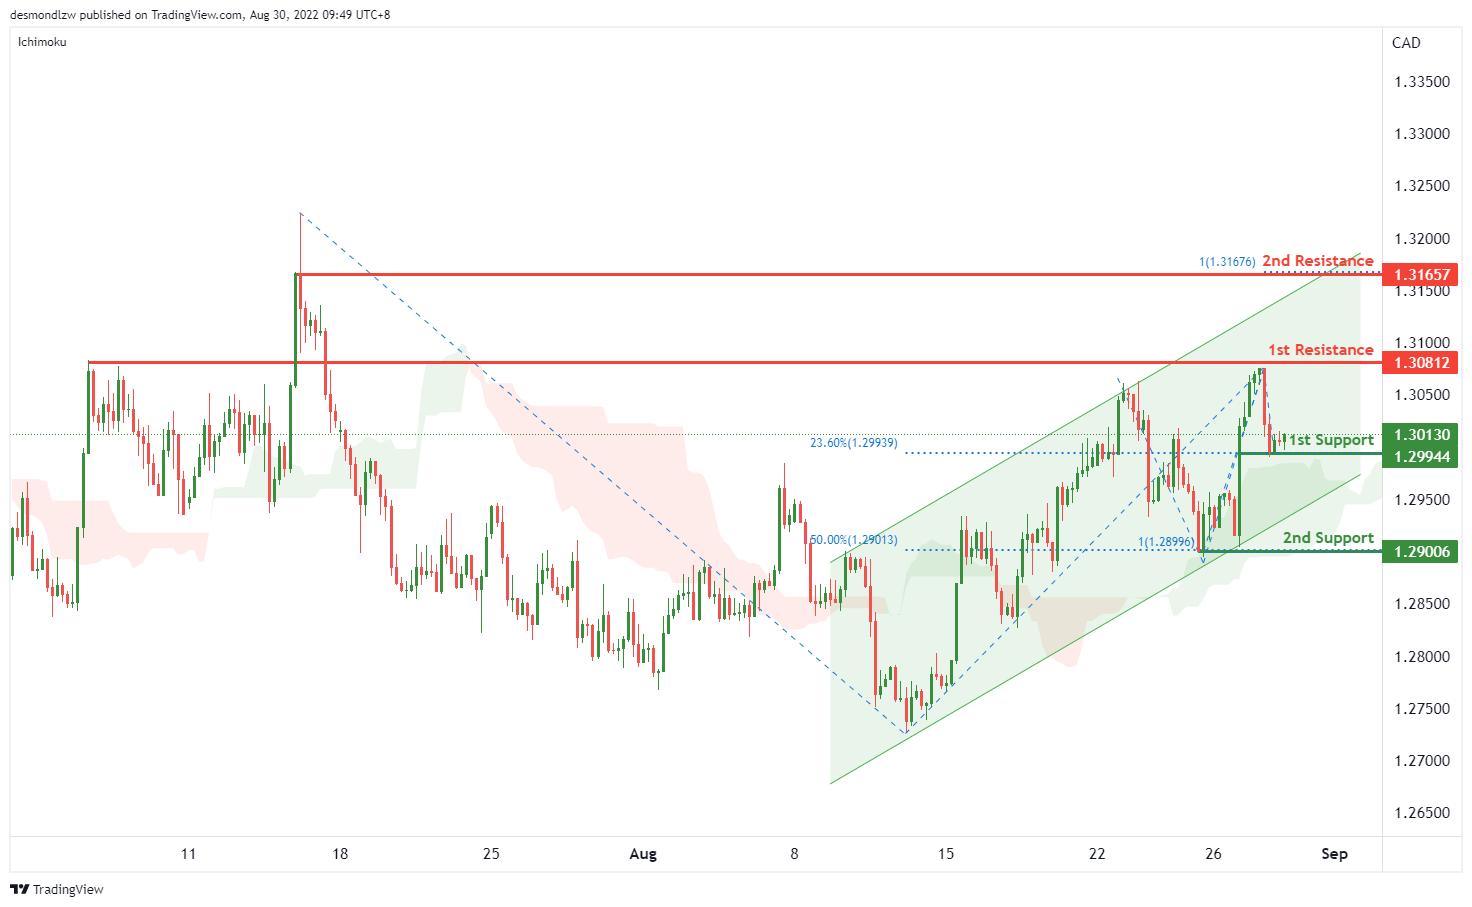
USD/CAD:
On the H4, with the price moving within the ascending channel, above ichimoku cloud, we have a bullish bias that the price may rise from the 1st support at 1.29944, where the 23.6% fibonacci retracement and swing low are to the 1st resistance at 1.30812, where the swing highs are. If the price can break the 1st resistance, we can expect the momentum to carry the price to the 2nd resistance at 1.31657, where the swing high and 100% fibonacci projection are. Alternatively, price could break the 1st support and drop to the 2nd support at 1.29006, where the 50% fibonacci retracement and 100% fibonacci projection are.
Areas of consideration:
- H4 time frame, 1st support at 1.29944
- H4 time frame, 1st resistance at 1.30812
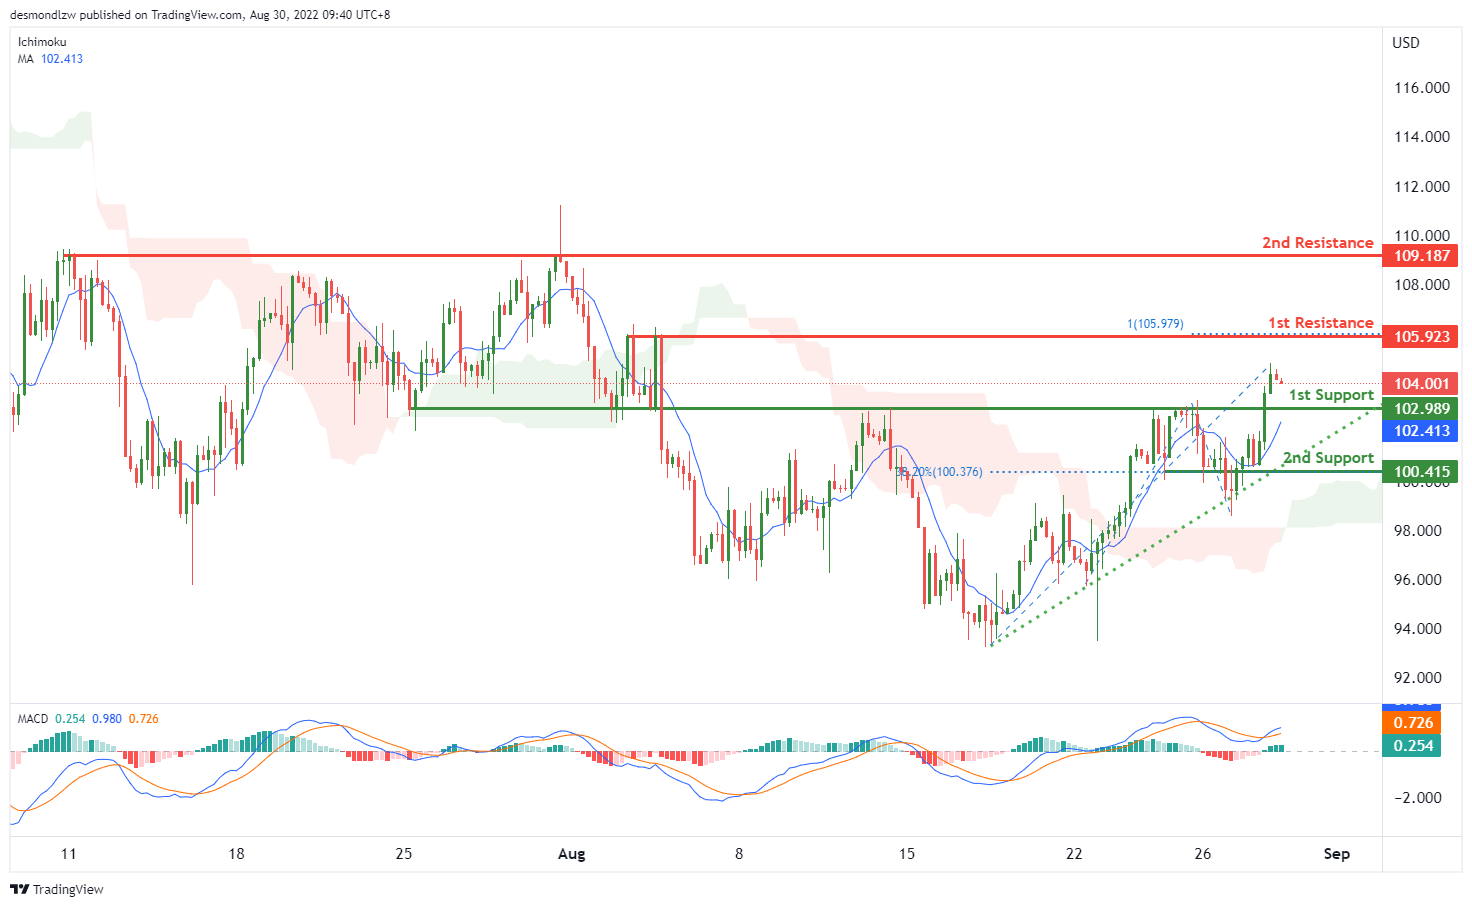
OIL:
On the H4, with price moving within the ascending trendline, above ichimoku cloud and MA, we have a bullish bias that the price may rise from the 1st support at 102.989, which is in line with the overlap support to the 1st resistance at 105.923, where the swing highs and 100% fibonacci projection are. If the price breaks the 1st resistance, we can expect the price to rise to the 2nd resistance at 109.187, where the previous swing highs are. Alternatively, the price may drop to the 2nd support at 100.415, which is in line with the 38.2% fibonacci retracement.
Areas of consideration:
- H4 time frame, 1st support at 102.989
- H4 time frame, 1st resistance at 105.923
Dow Jones Industrial Average:
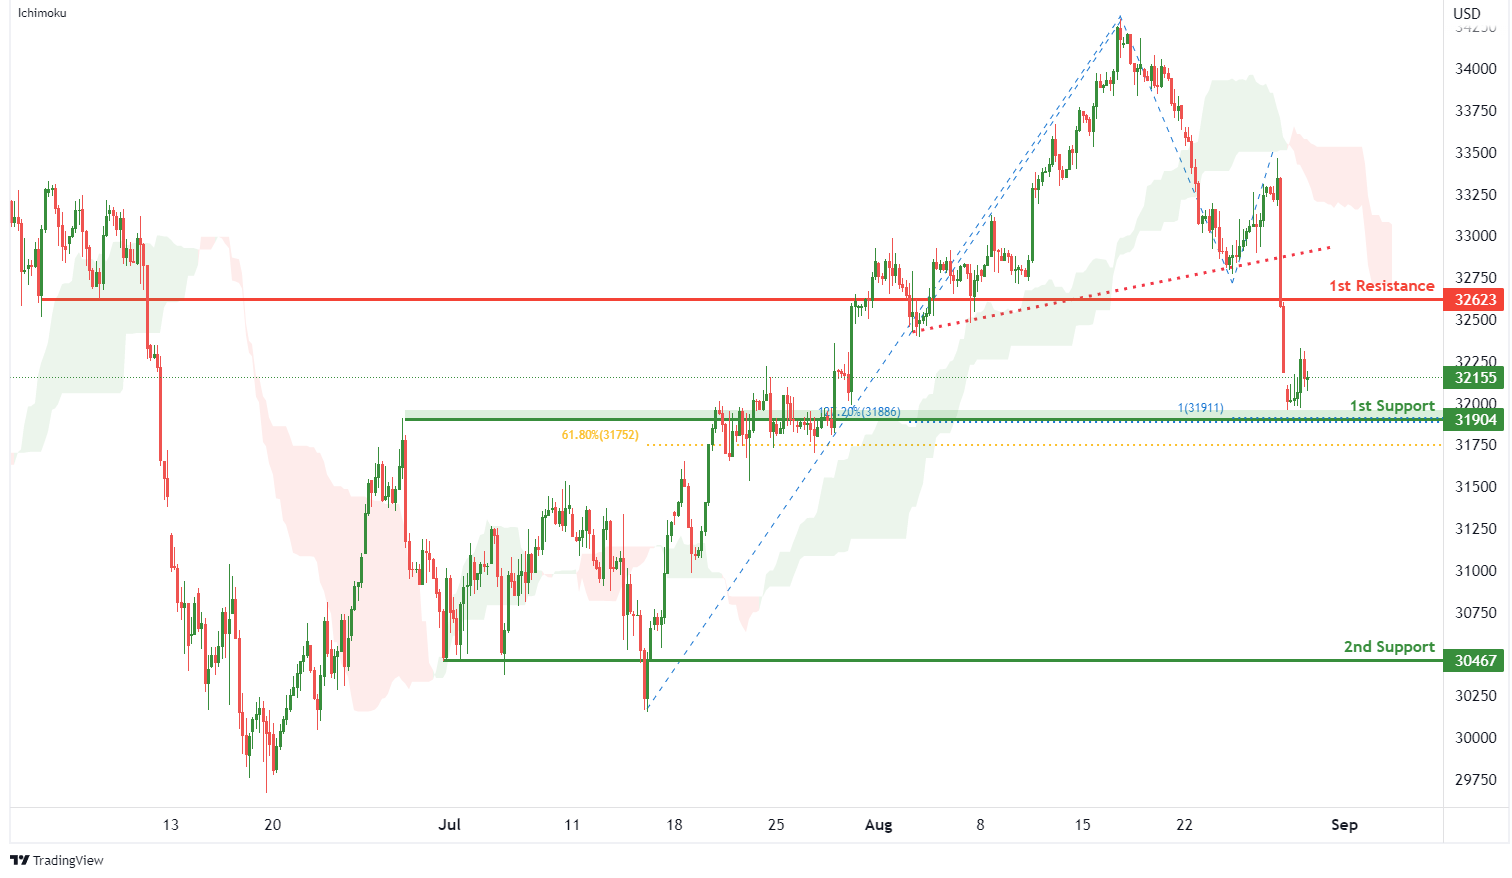
On the H4, with price breaking the ascending trendline and moving below the ichimoku indicator, ,we have a bearish bias that price will drop to 1st support at 31904 where the pullback support, 100% fibonacci projection, 61.8% fibonacci retracement and 127.2% fibonacci extension are. Should price break 1st support, we would expect bearish momentum to carry price to 2nd support at 30467 where the pullback support is. Alternatively, price could rise to 1st resistance at 32623 in line with pullback resistance.
Areas of consideration:
- H4 time frame, 1st resistance of 32623
- H4 time frame, 1st support at 3190
DAX:
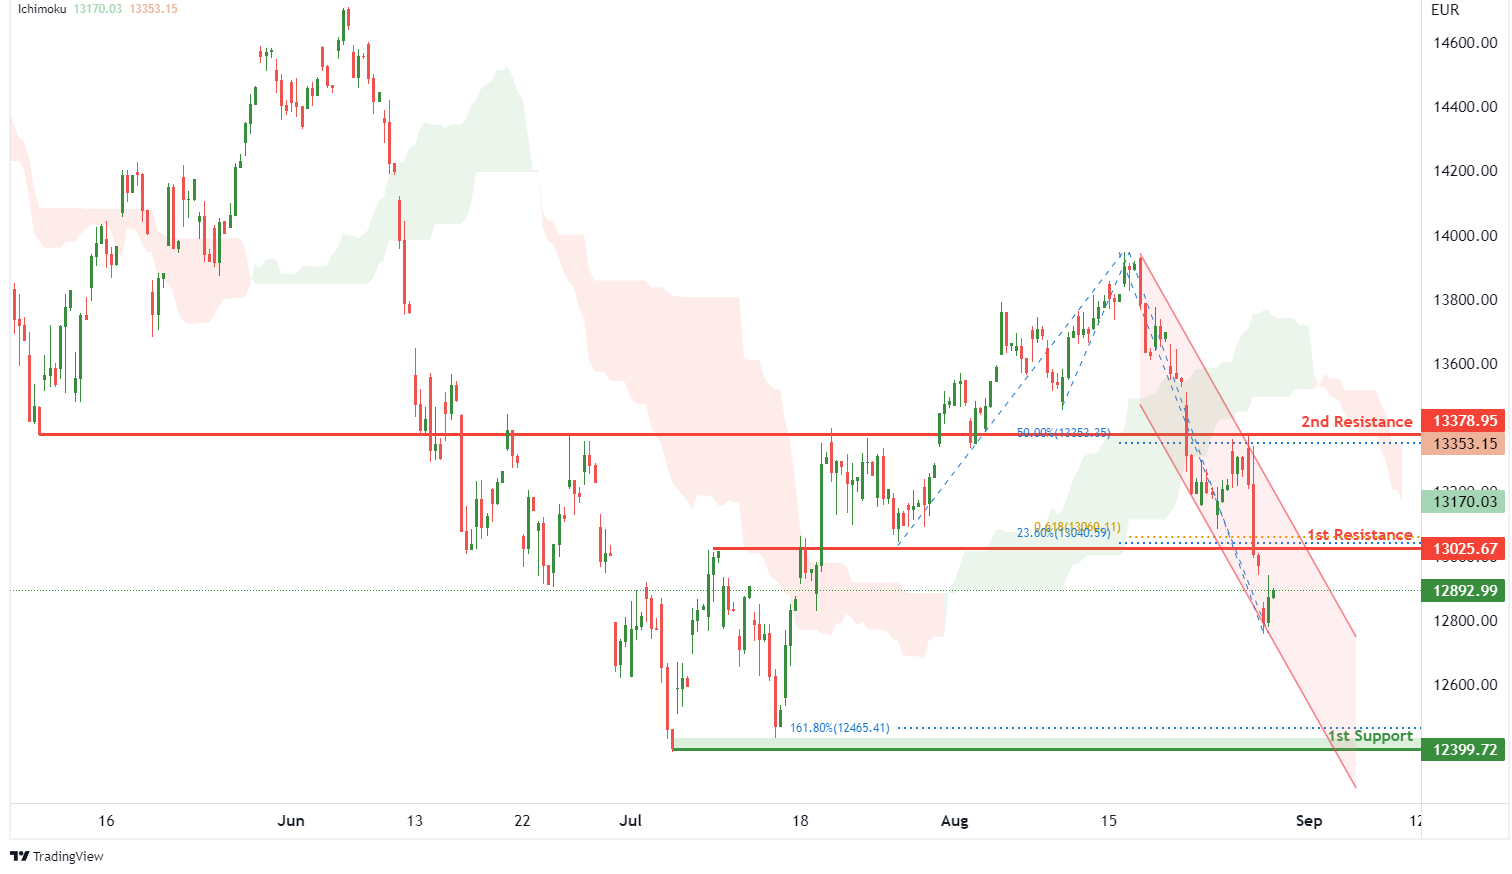
On the H4, with price moving within a descending channel and below the ichimoku indicator, we have a bearish bias that price will drop from 1st resistance at 13025.67 where the pullback resistance, 23.6% fibonacci retracement and 61.8% fibonacci projection are to the 1st support at 12399.72 where the swing low support and 161.8% fibonacci extension are. Alternatively, price could rise to 2nd resistance at 13378.95 where the overlap resistance and 50% fibonacci retracement are.
Areas of consideration:
- H4 time frame, 1st resistance of 13025.67
- H4 time frame, 1st support at 12399.72
ETHUSD:
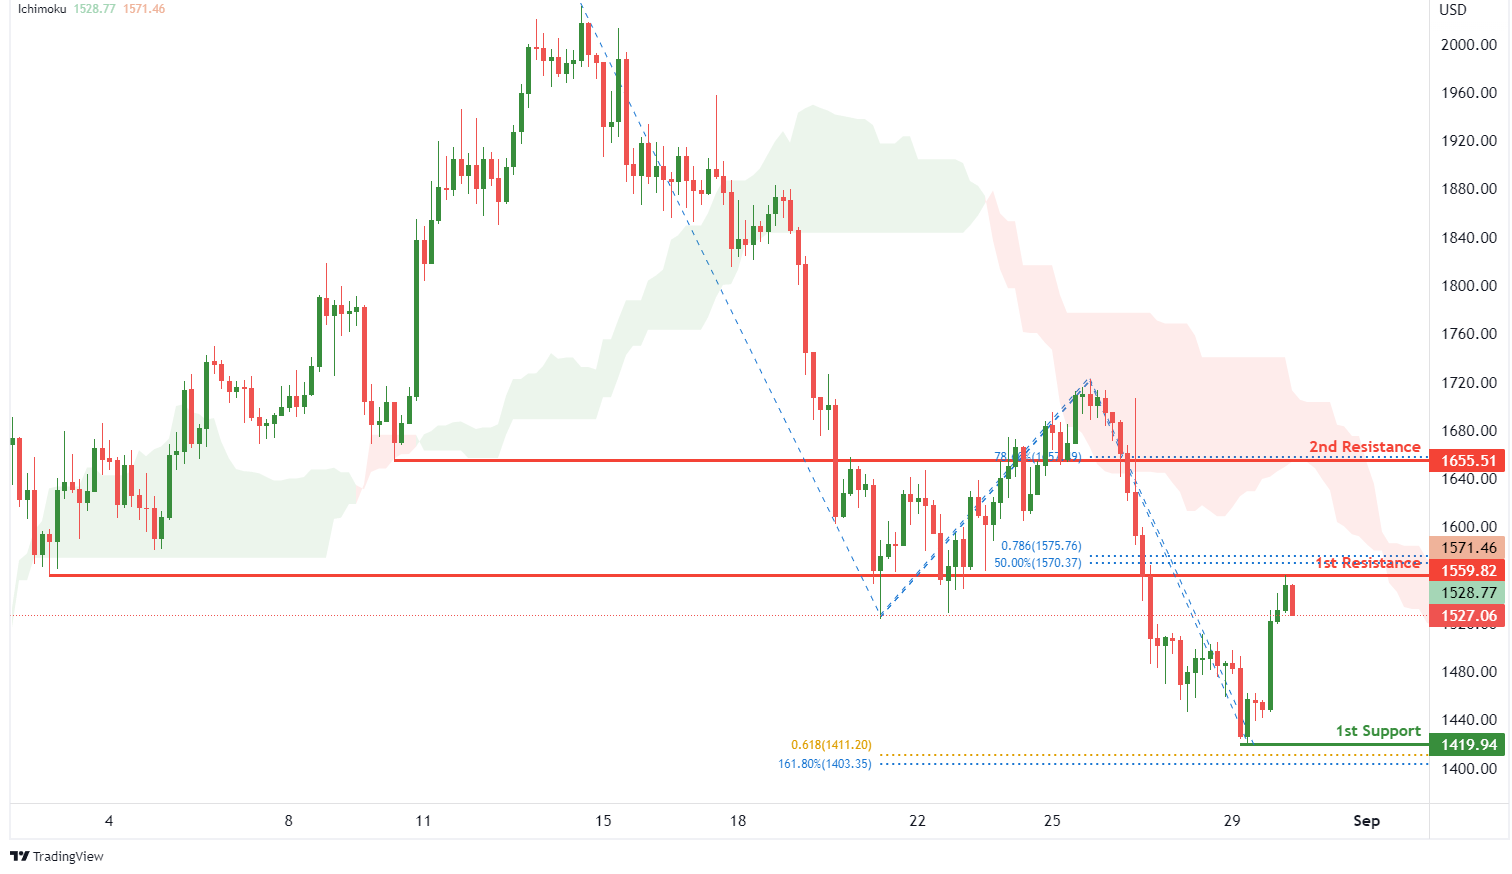
On the H4, with price moving below the ichimoku indicator, we have a bearish bias that price will drop from 1st resistance at 1559.82 where the overlap resistance, 50% fibonacci retracement and 78.6% fibonacci projection are to the 1st support at 1419.94 where the swing low support, 161.8% fibonacci extension and 61.8% fibonacci projection are. Alternatively, price could break 1st resistance structure and rise to 2nd resistance at 1655.51 where the pullback resistance and 78.6% fibonacci retracement are.
Areas of consideration:
- H4 time frame, 1st resistance of 1559.82
- H4 time frame, 1st support at 1419.94
BTCUSD:
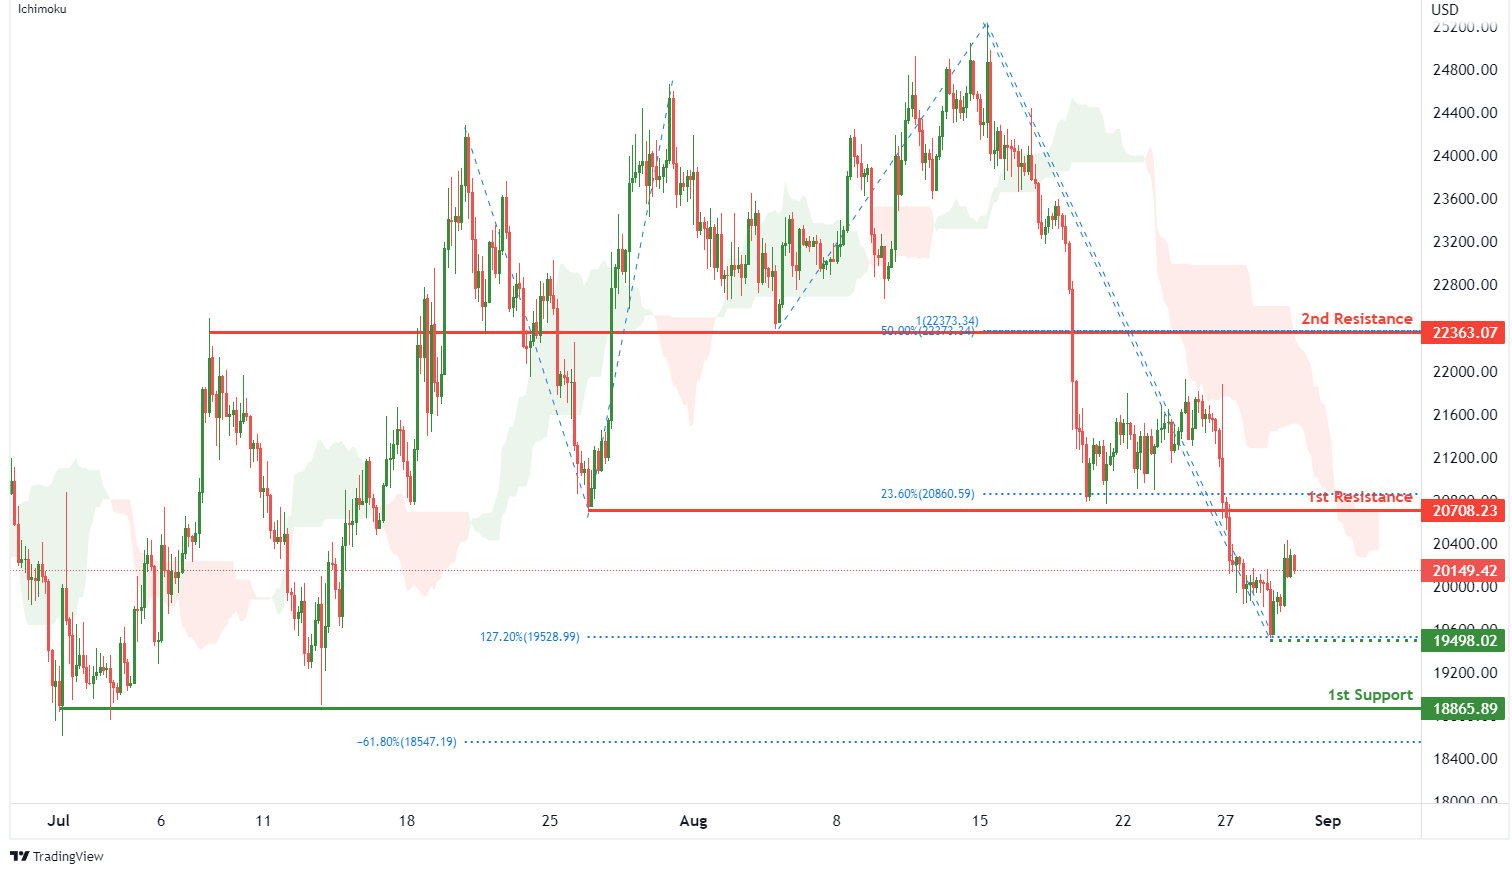
On the H4, with price moving below an ichimoku indicator, we have a bearish bias that price will drop from 1st resistance at 20708.23 where the pullback resistance and 23.6% fibonacci retracement are to the 1st support at 18865.89 where the swing low support and -61.8% fibonacci expansion are. Take note of intermediate support at 19498.02 where the 127.2% fibonacci extension and swing low support are. Alternatively, price could break 1st resistance structure and rise to 2nd resistance at 22363.07 where the overlap resistance, 100% fibonacci projection and 50% fibonacci retracement are.
Areas of consideration:
- H4 time frame, 1st resistance of 20708.23
- H4 time frame, 1st support at 18865.89
S&P 500:
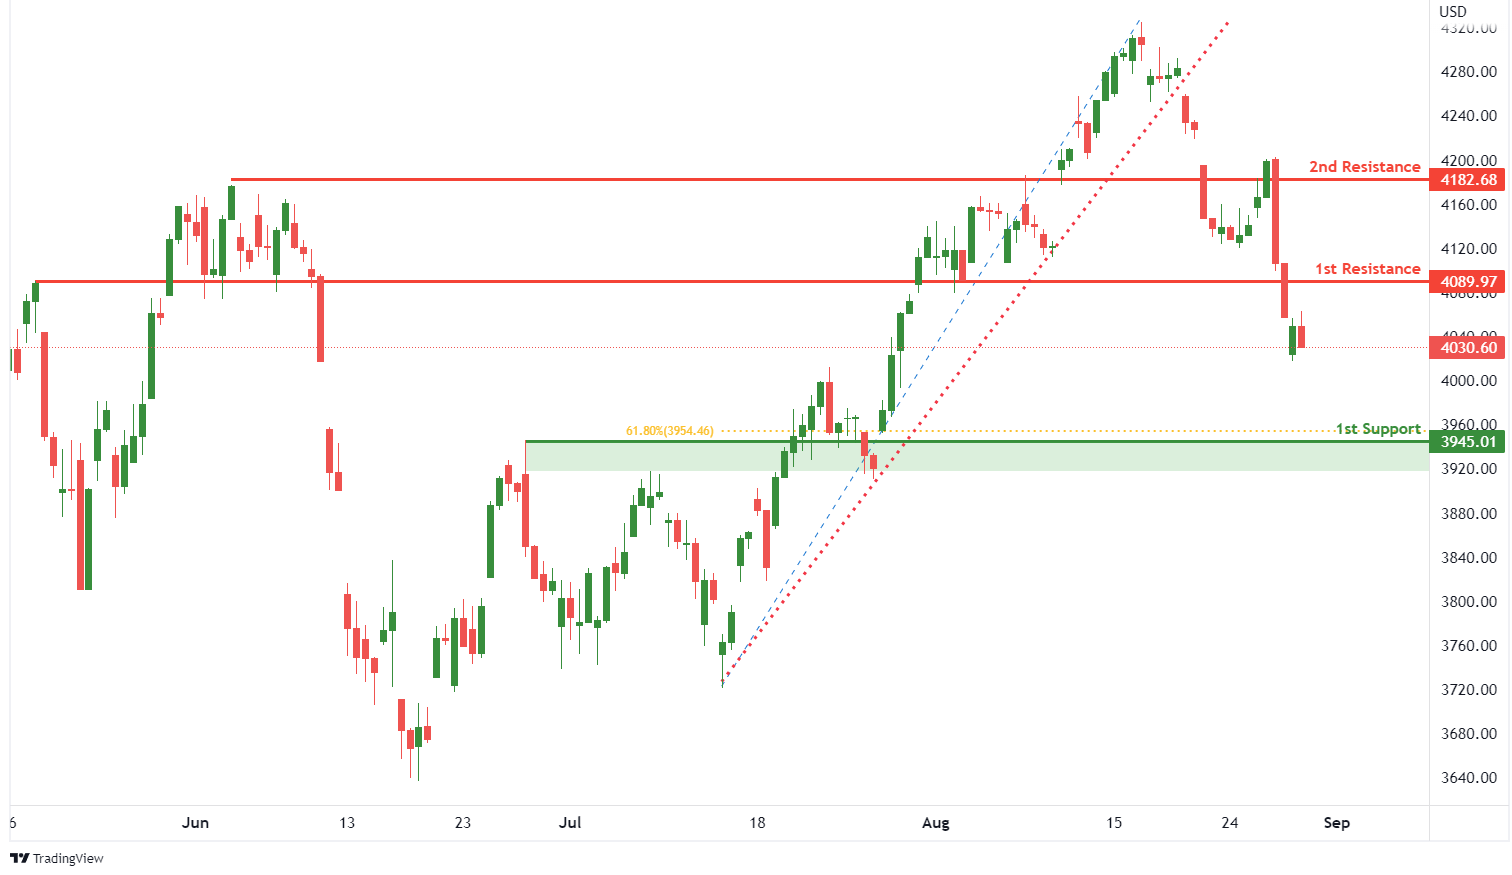
On the H4, with prices breaking out of the ascending trendline, we have a bearish bias that price will drop from 1st resistance at 4089.97 where the pullback resistance is to the 1st support at 3945.01 where the pullback support and 61.8% fibonacci retracement are. Alternatively, price could rise to 2nd resistance at 4182.68 where the pullback resistance is.
Areas of consideration:
- H4 time frame, 1st resistance of 4089.97
- H4 time frame, 1st support at 3945.01