Sample Category Title
Japan GDP grew 0.5% qoq in Q2, exceeding pre-pandemic level finally
Japan GDP grew 0.5% qoq in Q2, below expectation of 0.6% qoq. In annualized term, GDP grew 2.2%, below expectation of 2.5%. The size of the economy was lifted to JPY 542.1T, finally exceeding pre-pandemic level in Q4 2019.
Growth was driven by 1.1% gain in private consumption. Capital expenditure rose 1.4%. Public investment rose 0.9%. Exports and imports rose 0.9% and 0.7% respectively.
NZ BusinessNZ services dropped to 51.2, back below average
New Zealand BusinessNZ Performance of Services Index dropped from 54.7 to 51.2 in July. Activity/Sales dropped from 55.8 to 54.4. Employment dropped from 52.7 to 49.2.New orders/business dropped from 60.5 to 52.5. Stocks/inventories dropped from 54.0 to 53.1. Supplier deliveries dropped from 48.4 to 47.3.
BNZ Senior Economist Doug Steel said that "it is difficult to be sure from one month's data, but July's outcome is the lowest since February, has retreated further from the recent 54.9 peak set in May, and is back below average."

Is China Headed for a Lehman-Style Crisis?
The Chinese economic miracle seems to have turned into a nightmare lately. With a property sector in collapse and an overleveraged banking system as global interest rates move higher at the speed of light, there is a clear risk that China might suffer a 2008 moment that infects the entire global financial system. How high is that risk and which markets would be impacted the most?
Property boom
A seismic shift is underway in China. The past couple of decades were characterized by meteoric economic growth, which was enabled by businesses and households being encouraged to take on tons of debt. It wasn’t so much an economic miracle, but rather a mirage.
Faced with high demand and ever-rising prices because Chinese citizens saw their houses as an investment, property developers tried to build as much as possible and banks were incentivized to lend out money to everyone.
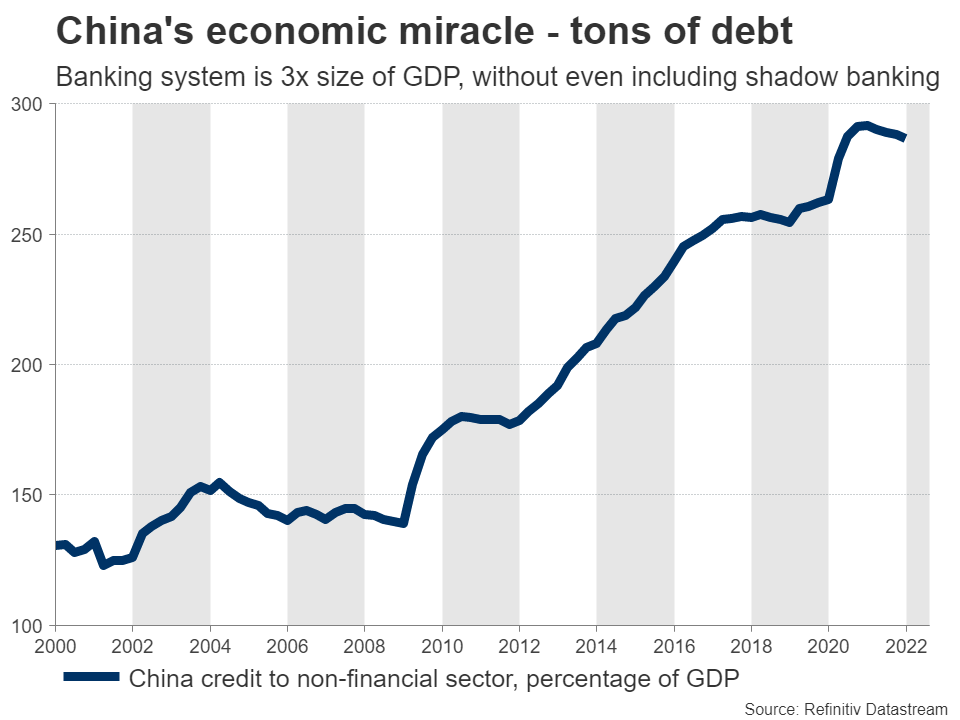
Over time, this process saw the real estate sector expand to account for around one third of national output, while the banking system issued out loans amounting to almost three times the size of the economy. And that’s before considering shadow banking, which is essentially off-the-books financing - something quite popular in China.
Mortgage revolt
Worried about an asset bubble, Chinese policymakers stepped on the brakes. They issued some rules back in 2020 that forced developers to deleverage, limiting the amount of debt they can take on. A wave of defaults ensued, shattering the long-held belief that Beijing would bail out any distressed companies to prevent contagion.
That is when the crisis entered a new phase. Around 90% of houses in China are pre-sold. Buyers are required to pay everything upfront before construction is complete - sometimes before it even starts. Worried that their developer might default and never hand over the key to their property, many people stopped paying their mortgages. It has been dubbed a ‘mortgage revolt’ and it has been spreading like wildfire.
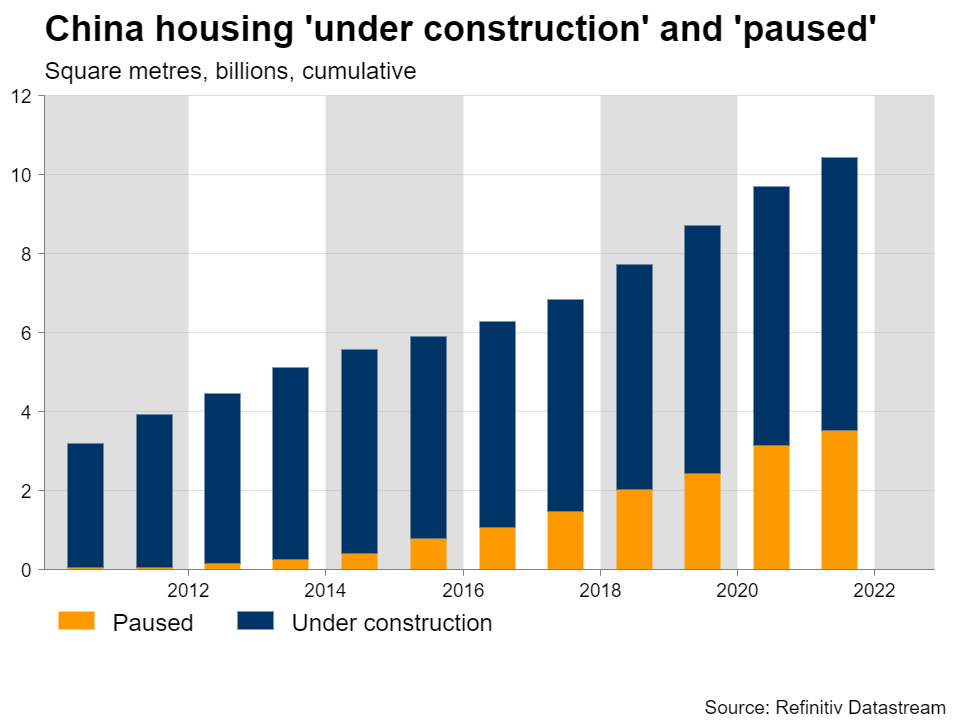
This is a dangerous game. When loans are not being repaid and banks have a footprint that exceeds the size of the economy many times over, it usually ends in disaster. Add in the fact that interest rates are being raised at the speed of light in other countries, making foreign investors more hesitant to seek riskier investments in China, and it looks like a ticking time bomb.
This risk has been reflected in the nation’s junk bonds, which are trading near record lows. Investors see a lot of default risk in those bonds and want to be compensated for holding them.
Hammer and dance
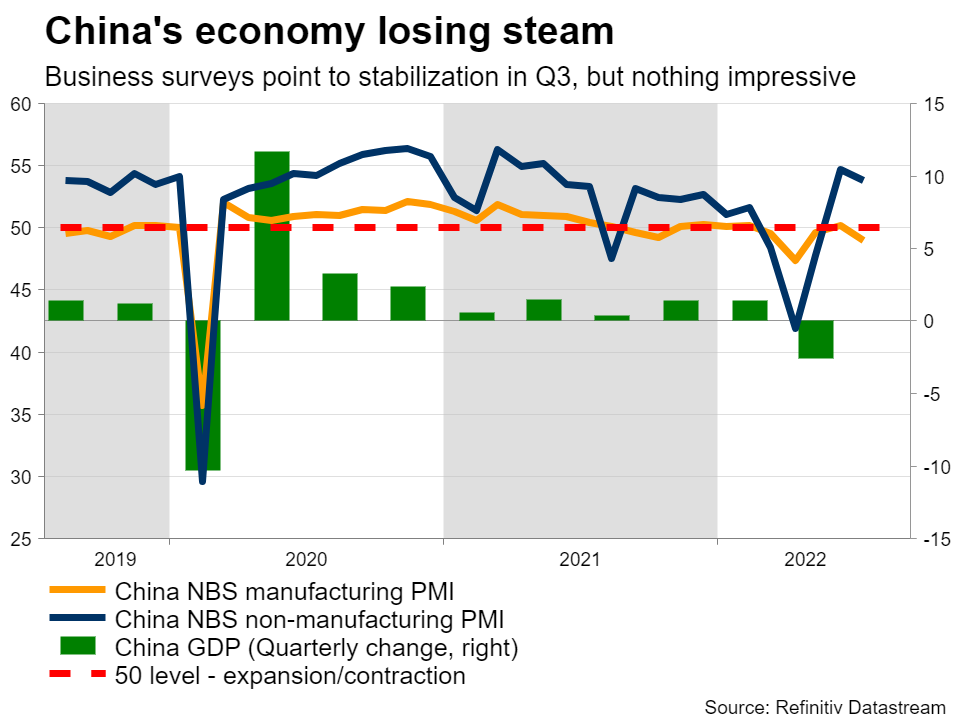
A spiraling property crisis is not the only risk facing China. Local authorities are still pursuing a ‘hammer and dance’ strategy with covid lockdowns, enacting strict restrictions whenever outbreaks are detected in some area. The economic fallout was evident during the second quarter, when the economy contracted.
Although the latest business surveys paint a more positive picture for this quarter, they are still consistent with an economy that is stalling and employment indicators suggest that companies are cutting workforce numbers to cope. Consumer confidence is already running at record lows.
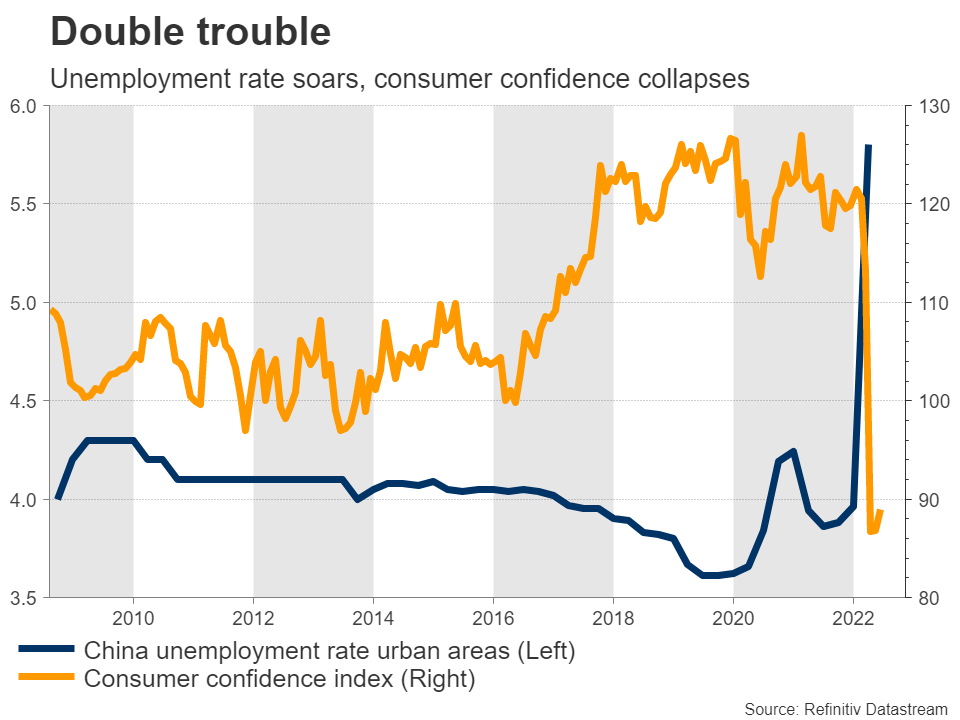
And the situation abroad isn’t great either. Europe has been crippled by the energy crisis and while the US economy is holding up better, it is also losing steam. That’s a threat for Chinese factory demand, which the latest data suggest is already rolling over.
Market implications
China is the world’s second-largest economy, with deep trade ties in every country. Even though it still has soft capital controls in place, it is almost certain that any crisis would not stay contained within its borders for long. Even the Federal Reserve warned about a domino effect that could infect America in its latest Financial Stability Report.
If the situation truly escalates, that would send shockwaves across every asset class. Stock markets could get hit hard, especially those in Asia as traders slash their risk exposure to the region. Currencies like the Australian and New Zealand dollars would likely crumble as well, since the entire business model of their economies relies on exporting commodities to China.
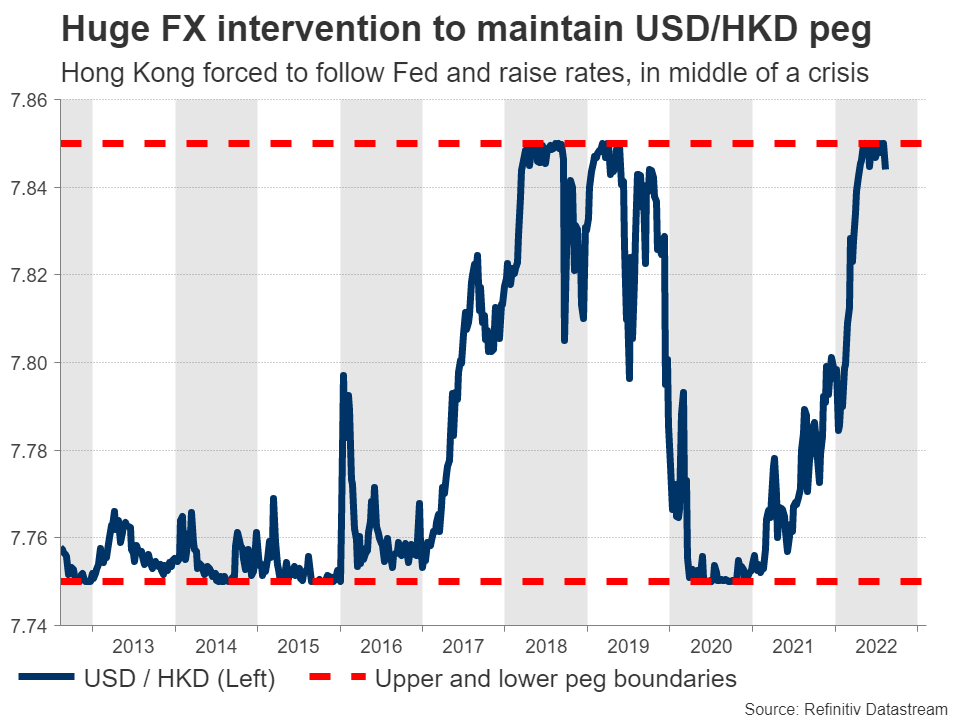
The Hong Kong dollar could get ravaged too. It is already testing the weaker end of its peg with the US dollar and the local authority is burning through its FX reserves to maintain this fix. If the selling pressure becomes even greater, they might decide it is not worth defending and simply abandon it, or at least allow the currency to depreciate.
Across the risk spectrum, the Japanese yen would likely benefit from such a scenario as traders take shelter in defensive assets and global bond yields retreat. For similar reasons, gold could come back into fashion. On the contrary, other commodities like industrial metals would probably suffer.
Mind the bailouts
All told, this is just a toxic cocktail, with local banks being incredibly exposed to a property market that is going downhill, mortgages that aren’t being repaid, and global interest rates moving higher to amplify all the stress while the Chinese economy stalls.
If there is a silver lining, it is that the Chinese government holds a lot of cards. It might be able to stop the contagion, at least initially, if it decides to bail out the most distressed entities before the domino effect truly begins. The People’s Bank of China is also likely to reduce interest rates further in an attempt to counter the increase in global rates.
Only time will tell whether the policy response will be enough. For now, this seems like the most underappreciated risk surrounding the global economy - the real ‘grey swan’.
Technical Outlook and Review
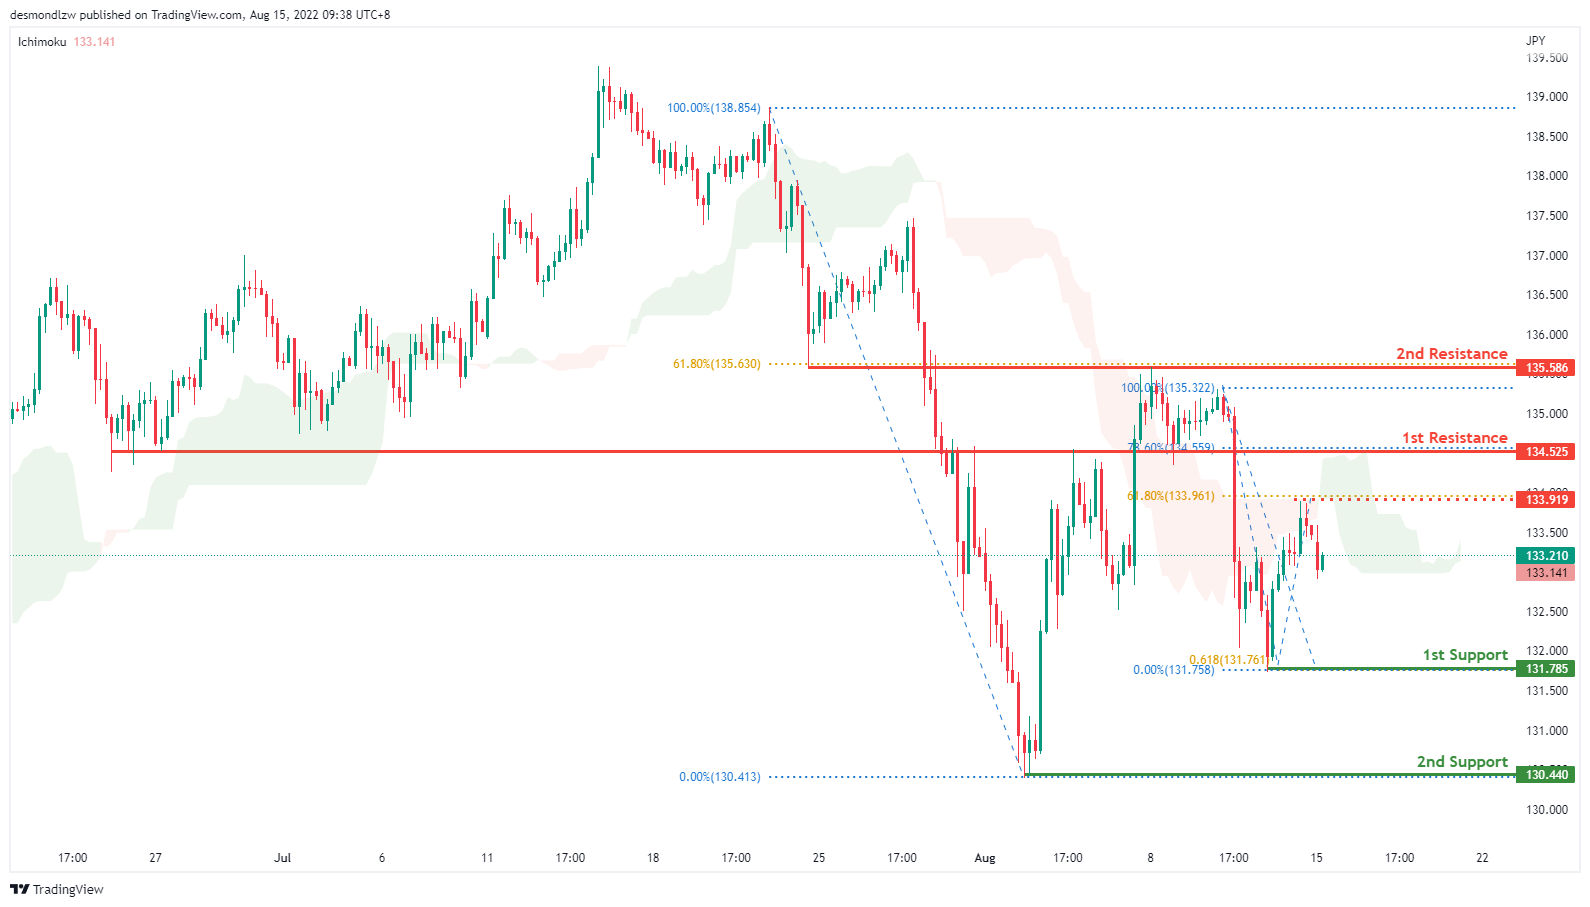
USD/JPY:
On the H4, prices are still respecting the descending trend and are testing the 61.8% fibonacci retracement. If prices continue with the bearish momentum, we are looking at price pulling back to test at the first support 131.785 where the fibonacci projection as well as the previous swing low sits, subsequently testing the second support at 130.440. Alternatively if prices fail to continue with the bearish trend, we are expecting prices to test at the intermediate resistance 133.919. If it breaks that resistance and confirms bullish momentum, prices will test at first resistance 134.525 where the 78.6% fibonacci retracement sits.
Areas of consideration:
- H4 time frame, 1st resistance at 134.525
- H4 time frame, 1st support at 131.785
DXY:
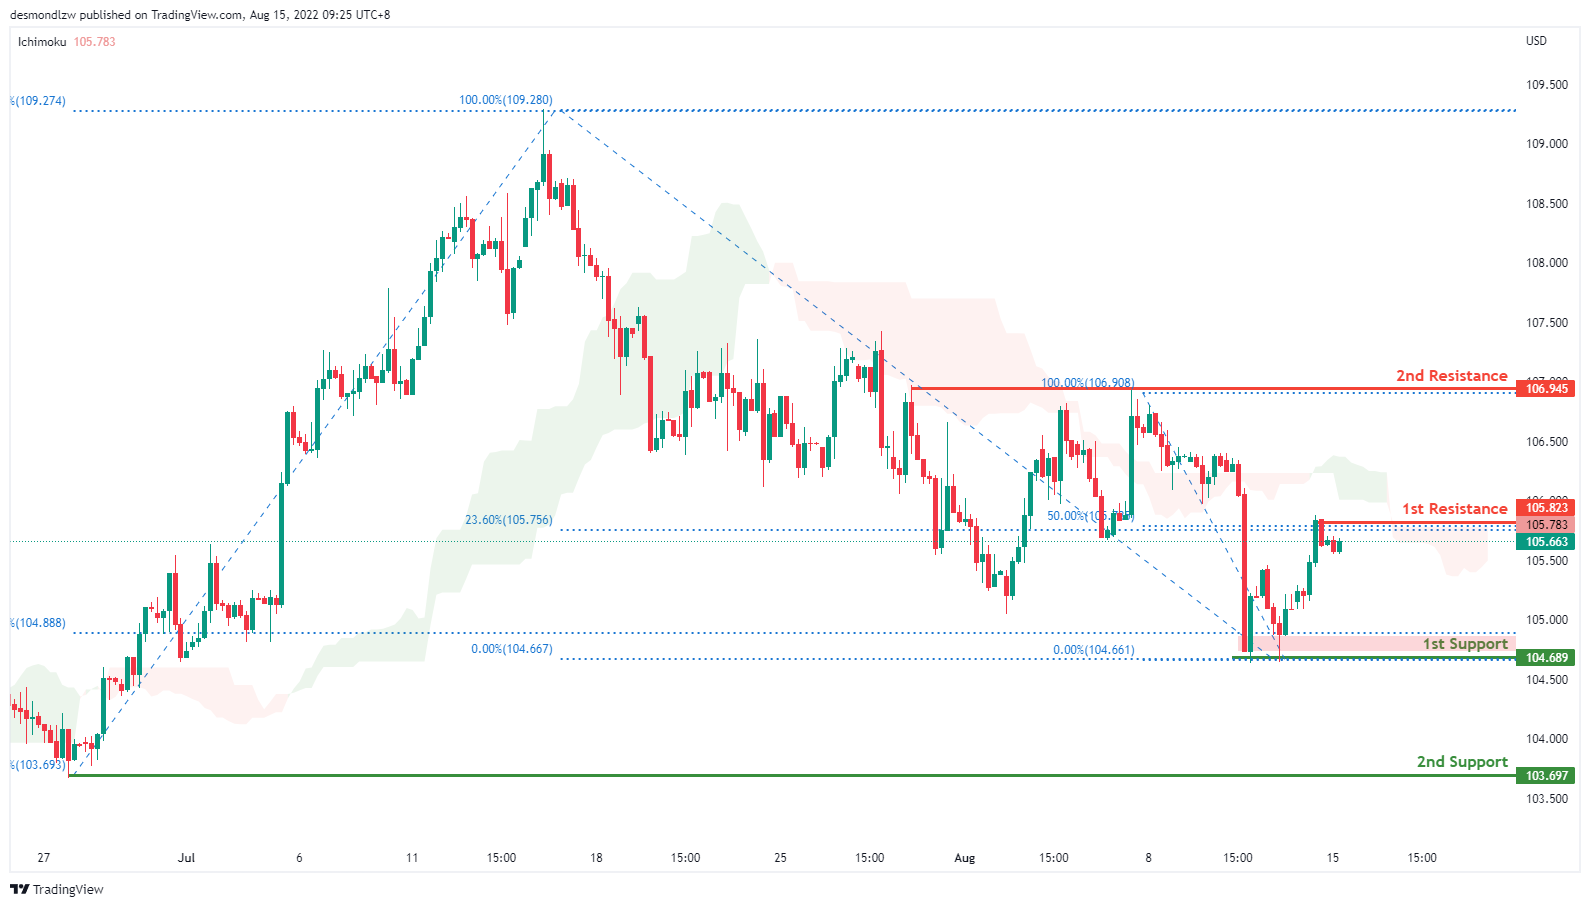
On the H4, price is moving in a descending trend and has confirmed a bearish momentum. It is now testing around the 105.823 level where the 50% fibonacci retracement sits. If price continues the bearish momentum, it will bring price down to 104.689 where the first support and 78.6% fibonacci sits. Alternatively, prices might pull back to test the first resistance at 106.945
Areas of consideration:
- H4 time frame, 1st resistance at 106.945
- H4 time frame, 1st support at 104.689
EUR/USD :
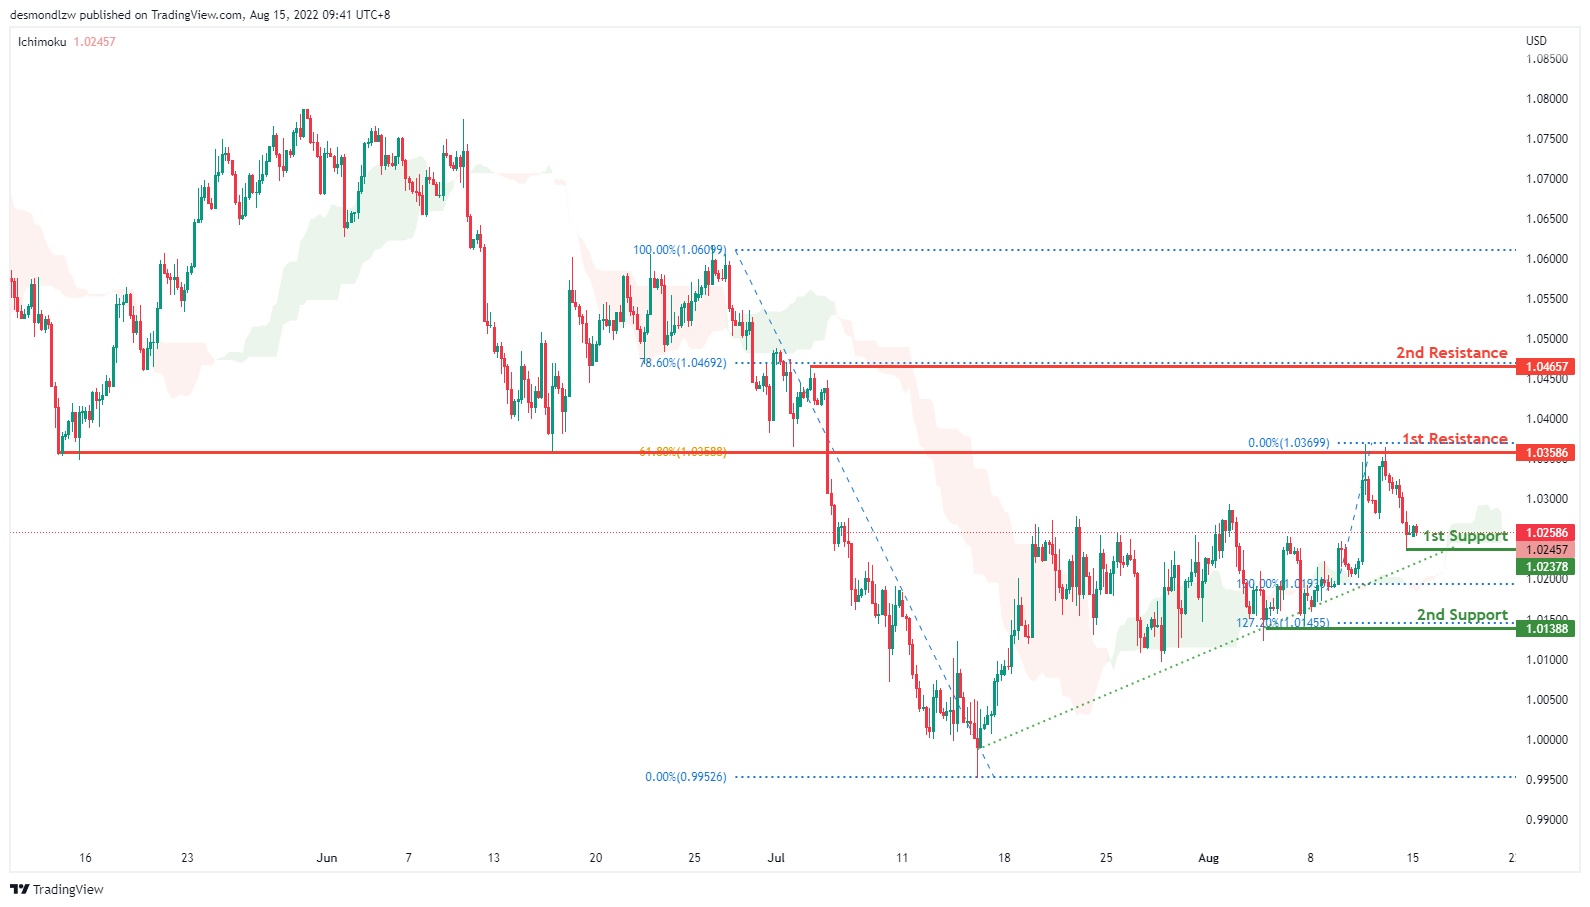
On the H4, with prices moving along the ascending trend and above the ichimoku indicator, we are bullish bias. Prices have tested the first resistance at 1.03583 where the 61.8% fibonacci retracement sits and is pulling back slightly. If prices fails to break the first resistance, it will pull back further to test at the first support 1.020 where the previous swing low sits and subsequently the second support at 1.012 level
Areas of consideration :
- H4 1st resistance at 1.035
- H4 1st support at 1.020
GBP/USD:
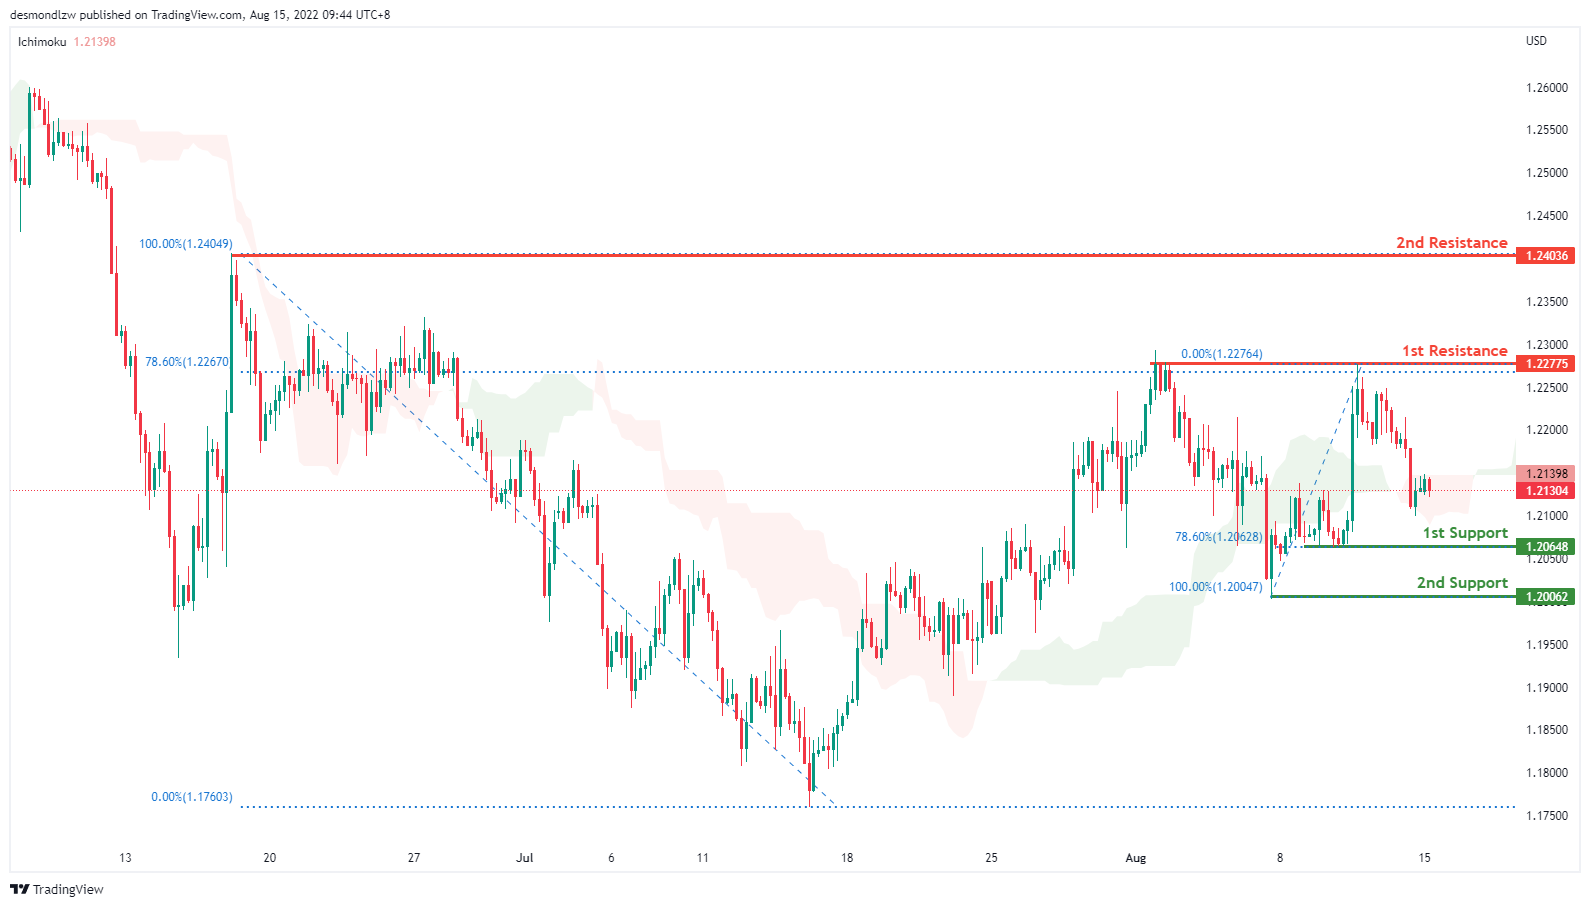
On the H4, with price moving within an ascending trend and above the ichimoku indicator, we have a bullish bias that price will rise to test the first resistance at 1.227 where the 78.6% fibonacci retracement sits and subsequently the second resistance at 1.240. If prices fail to break the first resistance, we can confirm a bearish momentum where prices will pull back and test the first support at 1.206 where the 78.6% fibonacci retracement sits
Areas of consideration:
- H4 1st resistance at 1.227
- H4 1st support at 1.206
USD/CHF:
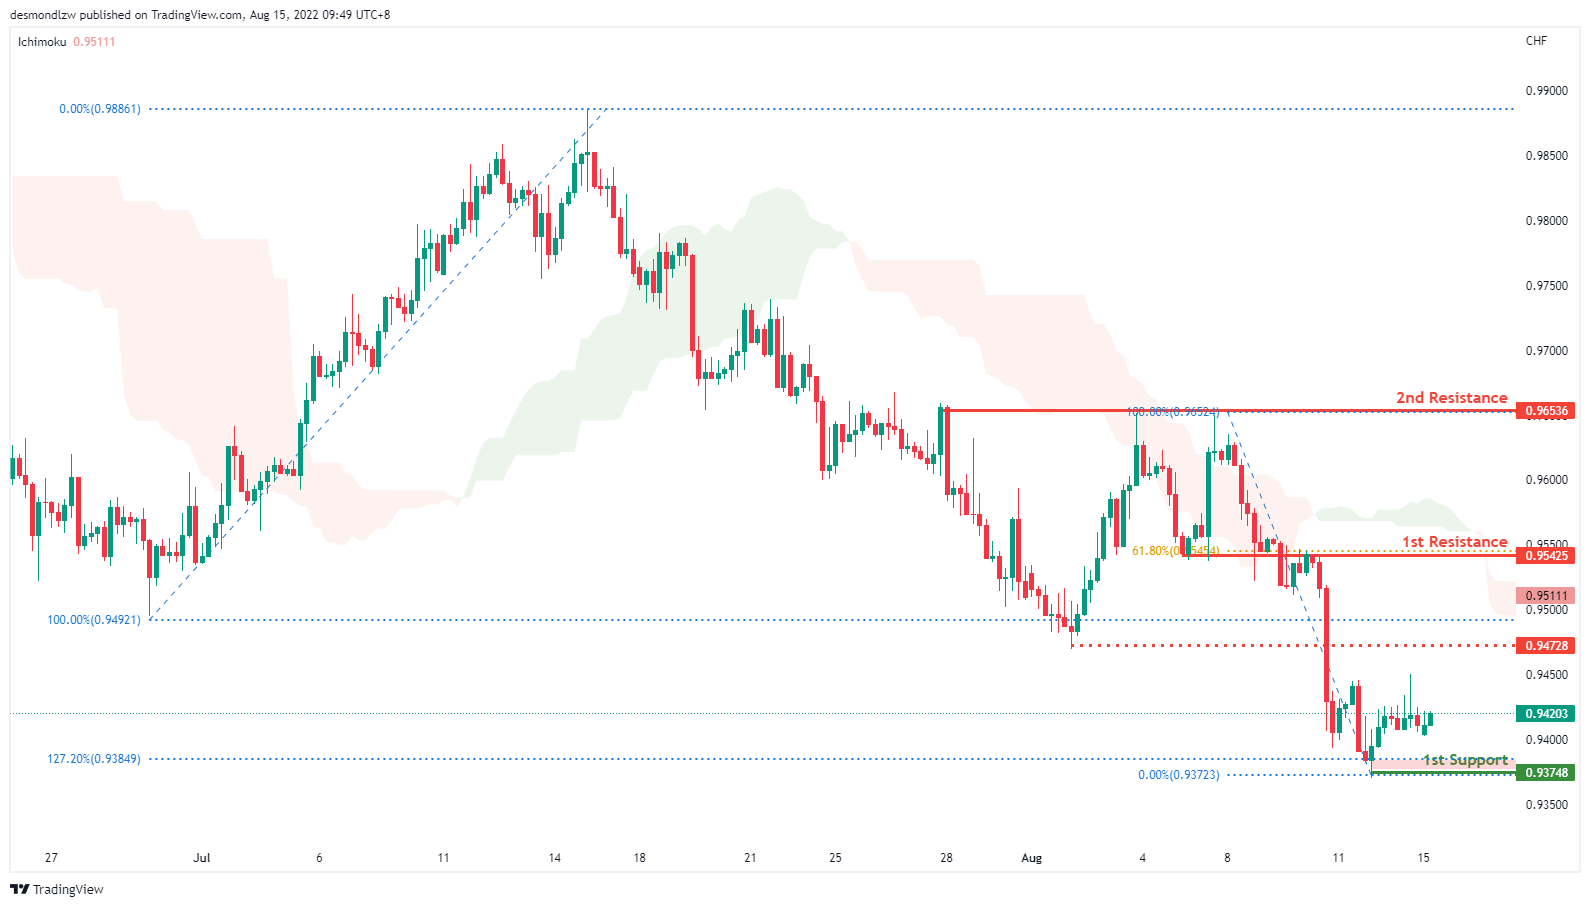
On the H4, with prices moving below the ichimoku cloud and the MACD indicators are below zero, we have a bearish bias that the price will continue with the bearish momentum and pull back to test at the first support 0.937. If prices fail to break first support, it may pull back to test the first resistance at 0.954 where the 61.8% fibonacci retracement and previous swing low sits. If prices continues with bullish momentum, it will then pull back further to test at the second resistance 0.965
Areas of consideration
- H4 1st support at 0.937
- H4 1st resistance at 0.954
XAU/USD (GOLD):
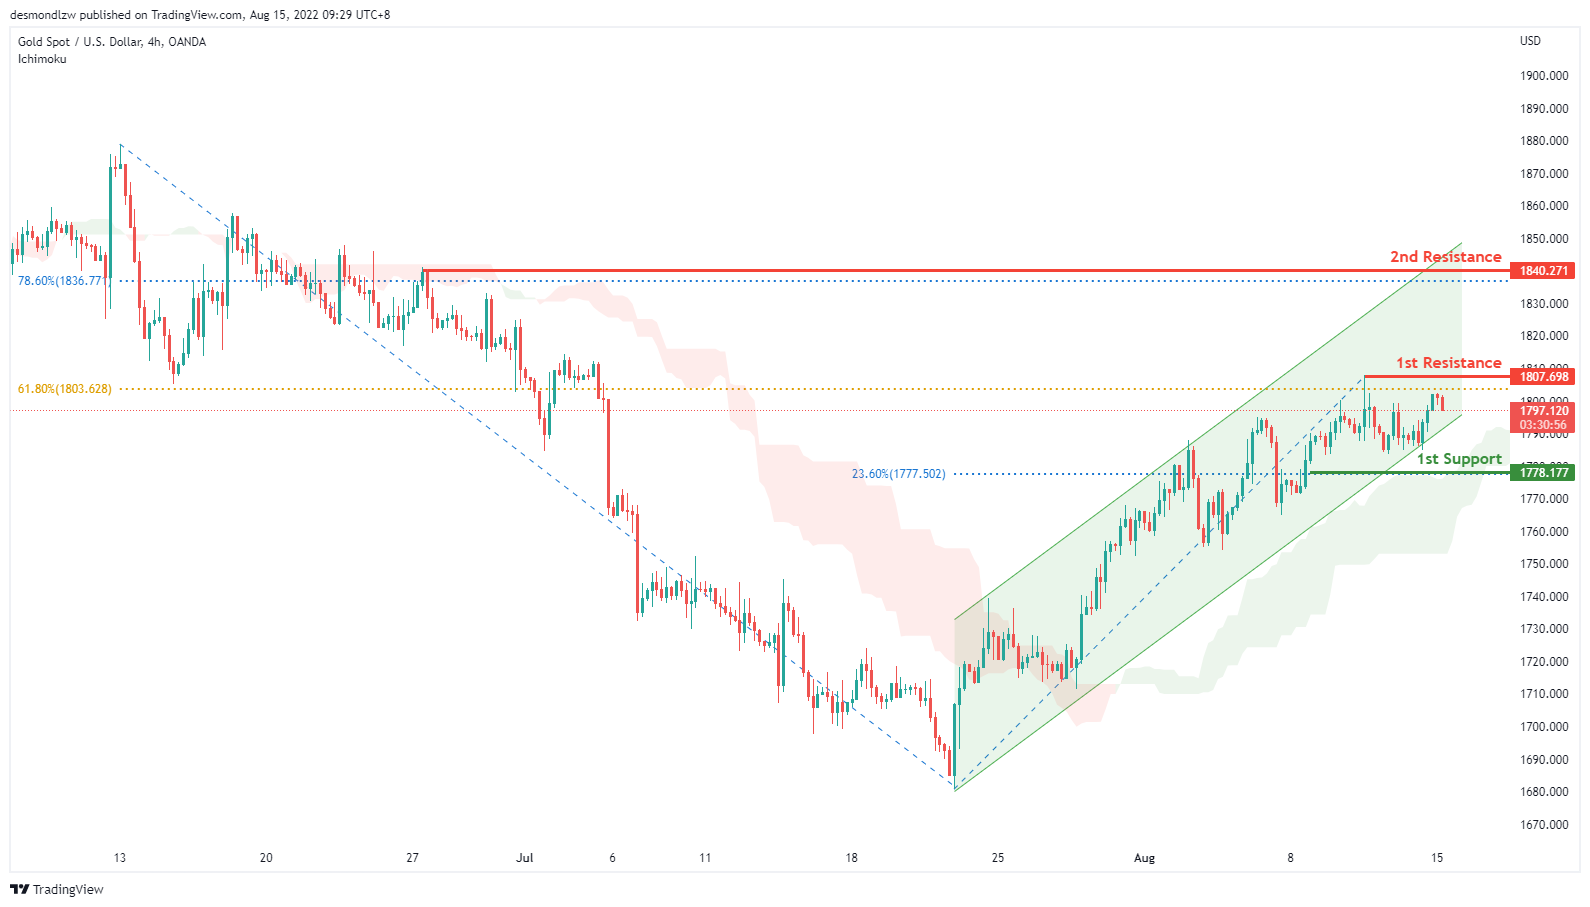
On the H4, with prices going along the ascending channel and moving above the ichimoku cloud, we have a bullish bias that the price may rise from the 1st resistance at 1807.698, which is in line with the swing high and 61.8% fibonacci retracement to the 2nd resistance at 1840.271, which is in line with the 78.6% fibonacci retracement. Alternatively, the price may drop to the 1st support at 1778.177, which is in line with the 23.6% fibonacci retracement.
Areas of consideration:
- H4 time frame, 1st resistance at 1807.698
- H4 time frame, 2nd resistance at 1840.271
AUD/USD:
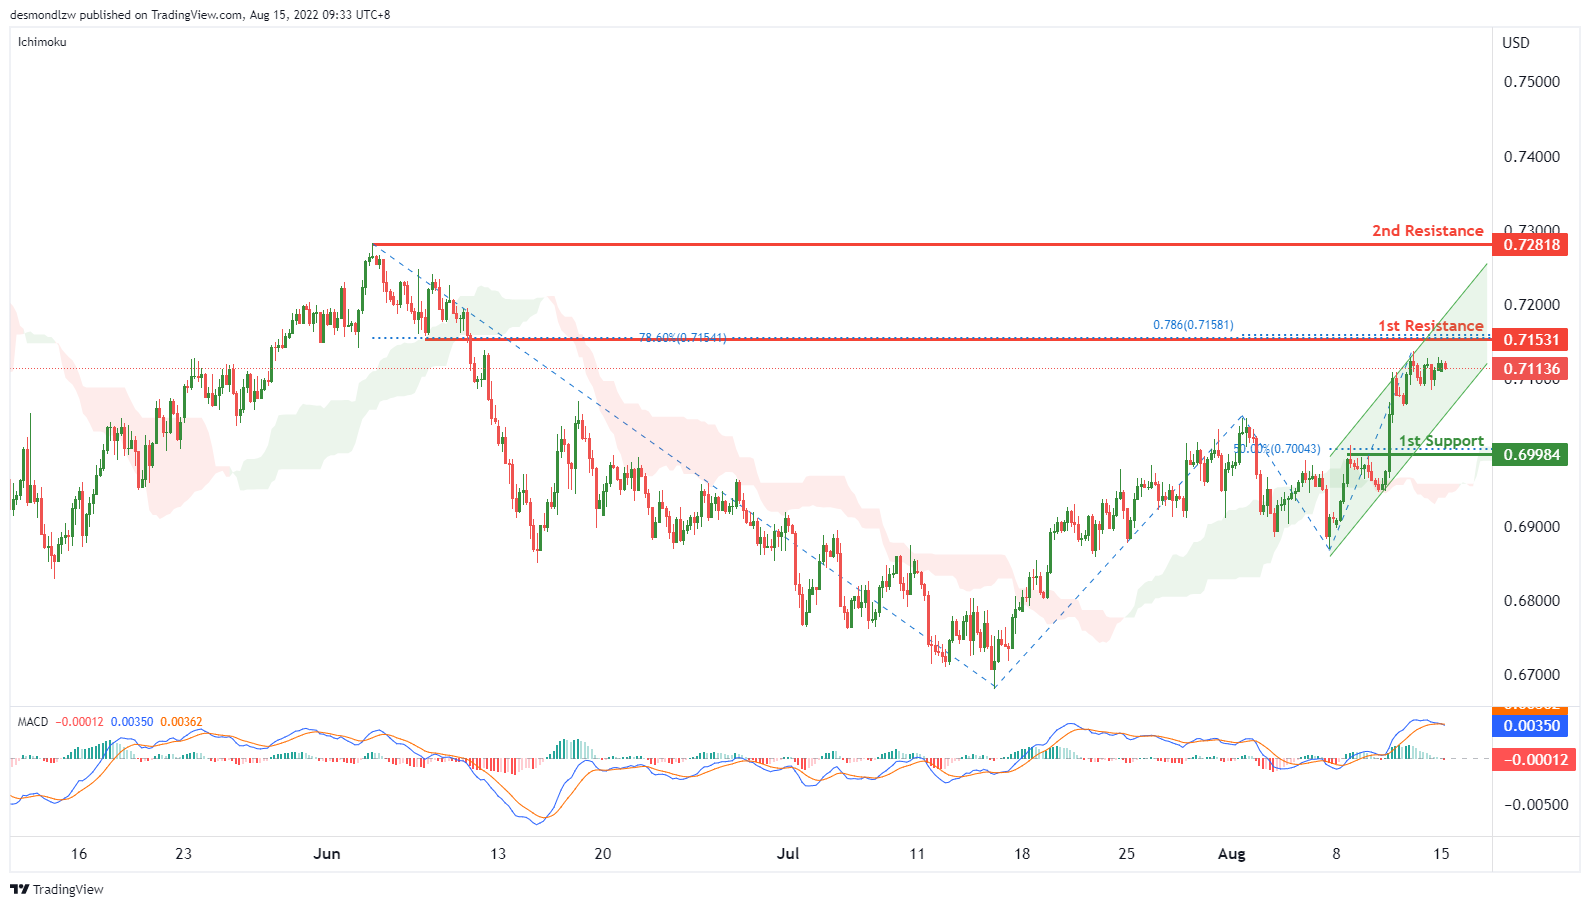
On the H4, with the price is moving within the ascending channel and over ichimoku cloud, we have a bullish bias that price may rise from the 1st resistance at 0.71531, where the 78.6% fibonacci projection, 78.6% fibonacci retracement and swing low are pullback support and 23.6% fibonacci retracement are to the 2nd resistance at 0.72818, which is in line with the swing high. Alternatively,as the MACD histograms are under zero, and DIF is almost crossing the signal line, price may drop to the 1st support at 0.69984 which is in line with 50% fibonacci retracement and pullback support.
Areas of consideration
- H4 1st resistance at 0.71531
- H4 2nd resistance at 0.72818
NZD/USD:
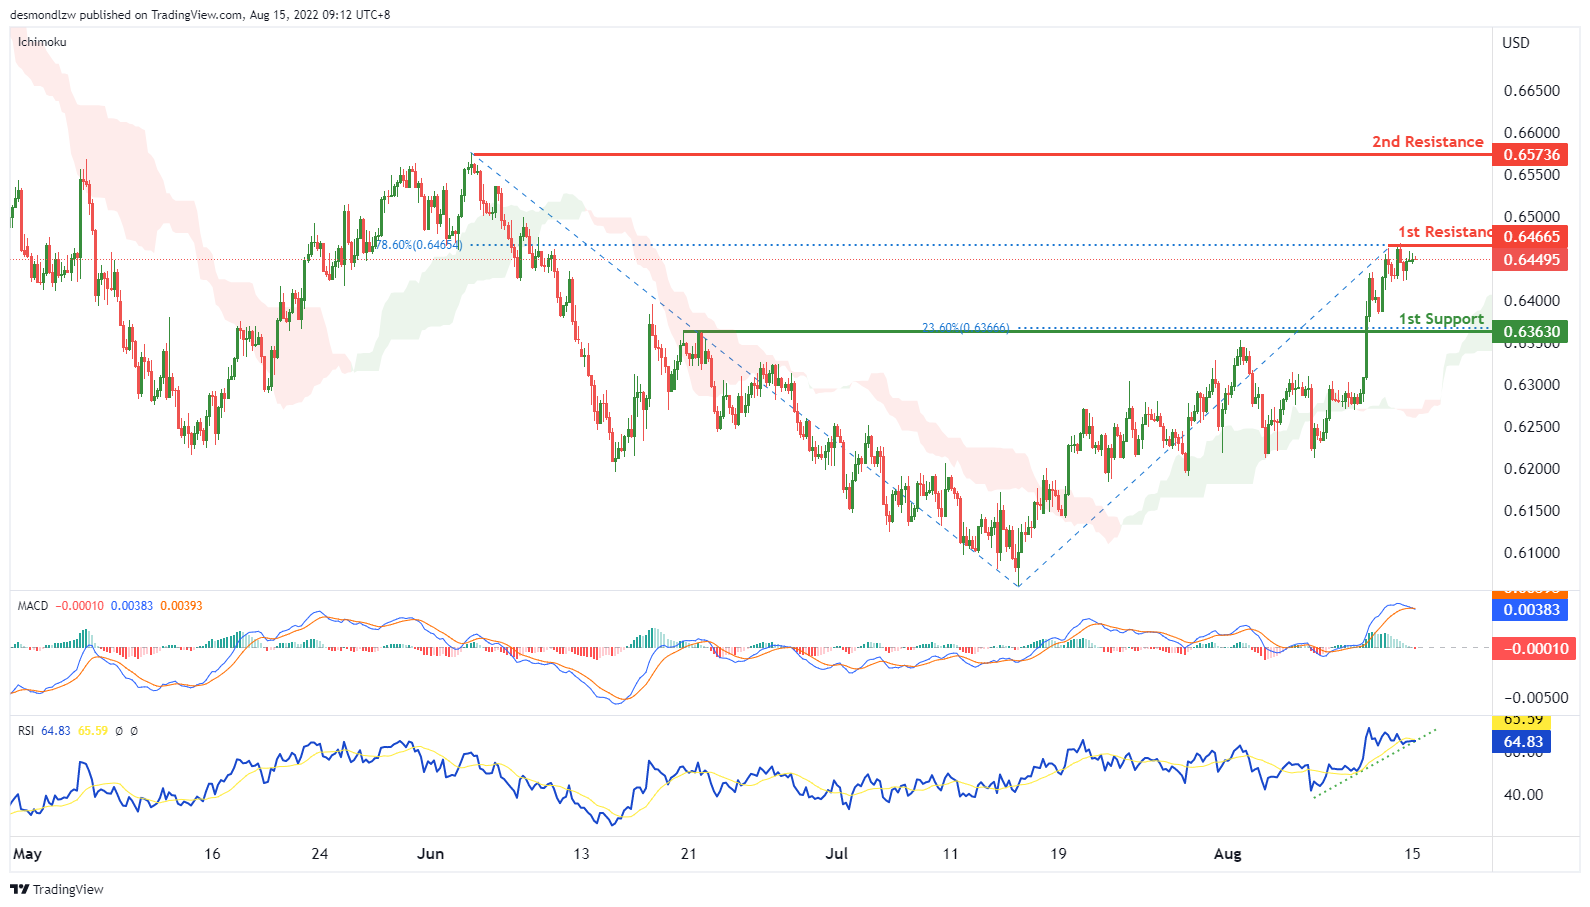
On the H4, with the price is over ichimoku cloud and RSI is moving along the ascending trendline, we have a bullish bias that price may rise from the 1st resistance at 0.64665, where the swing high and 78.6% fibonacci retracement are to the 2nd resistance at 0.65736 where the swing high is. Alternatively, as the MACD histograms are under zero, and DIF is almost crossing the signal line, the price may drop to the 1st support at 0.63630 which is in line with 23.6% fibonacci retracement and overlap support.
Areas of consideration:
- H4 time frame, 1st resistance at 0.64665
- H4 time frame, 2nd resistance at 0.65736
USD/CAD:
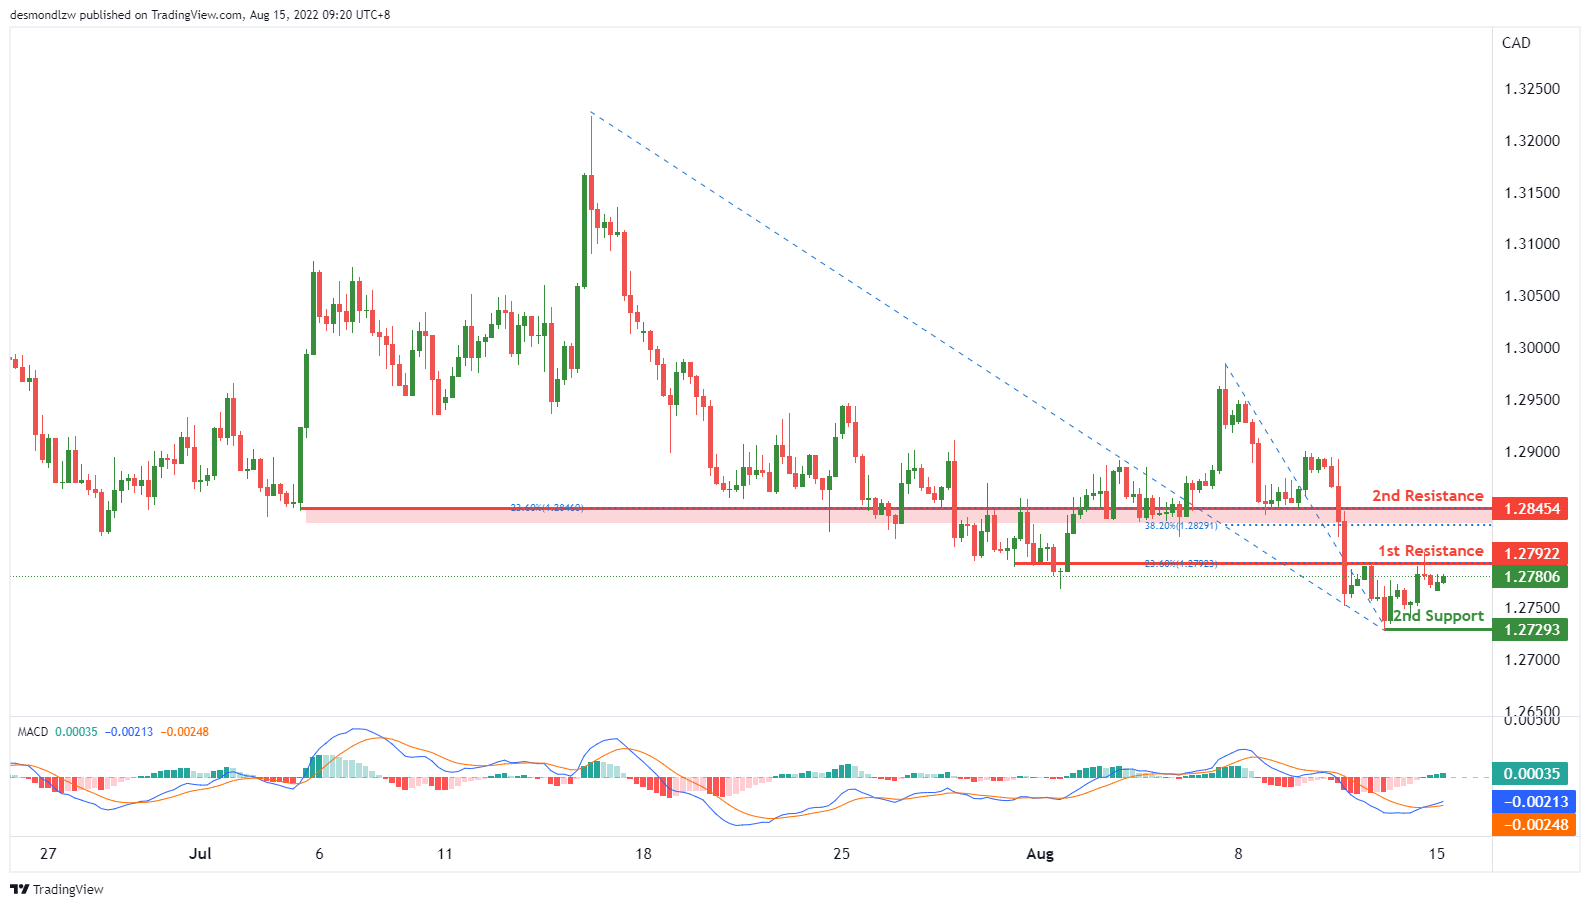
On the H4, in MACD, the DIF is crossing above the signal line, and histograms are above the zero, we have a bullish bias that the price may rise from the 1st resistance at 1.27922, which is in line with the 23.6% fibonacci retracement and overlap resistance to the 2nd resistance at 1.28454, which is in line with the 23.6% fibonacci retracement, 38.2% fibonacci retracement and overlap support. Alternatively, the price may drop to the 1st support at 1.27293, which is in line with the swing low.
Areas of consideration:
- H4 time frame, 1st resistance at 1.27922
- H4 time frame, 2nd resistance at 1.28454
OIL:
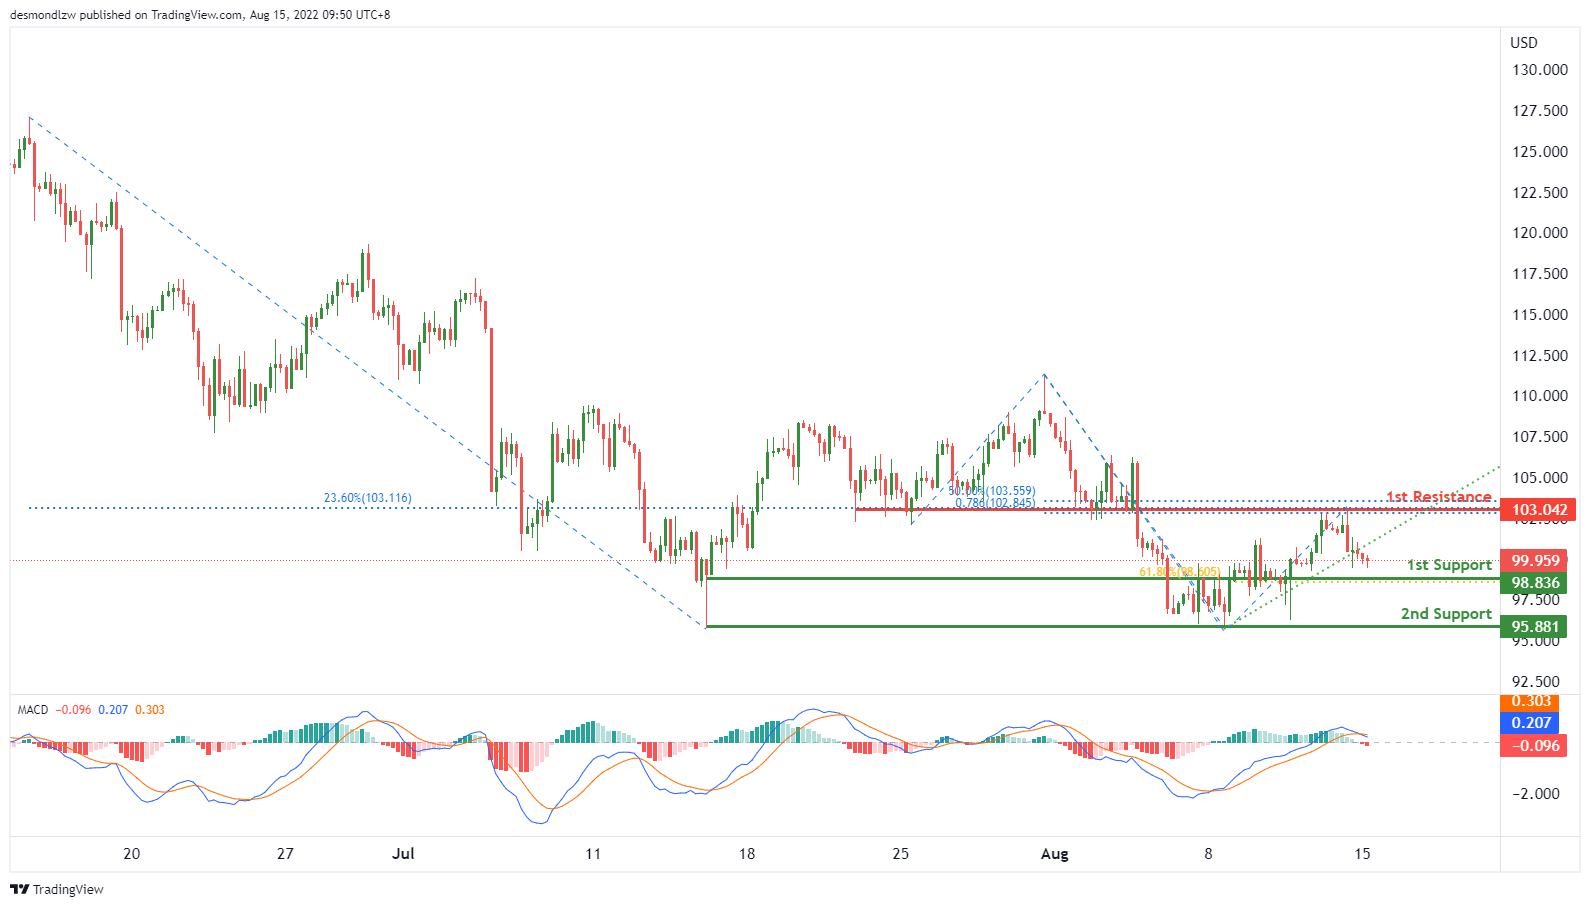
On the H4, with price breaking the ascending trendline and the DIF is crossing below signal line, we have a bearish bias that the price may drop from our 1st support at 98.836, which is in line with the 61.8% fibonacci retracement to the 2nd support at 95.881, which is in line with the swing low support. Otherwise, the price may rise to our 1st resistance at 103.042, which is in line with the overlap support, 50% fibonacci retracement, 23.6% fibonacci retracement and 78.6% fibonacci projection.
Areas of consideration:
- H4 time frame, 1st resistance at 103.213
- H4 time frame, 2nd resistance at 111.768
Dow Jones Industrial Average:
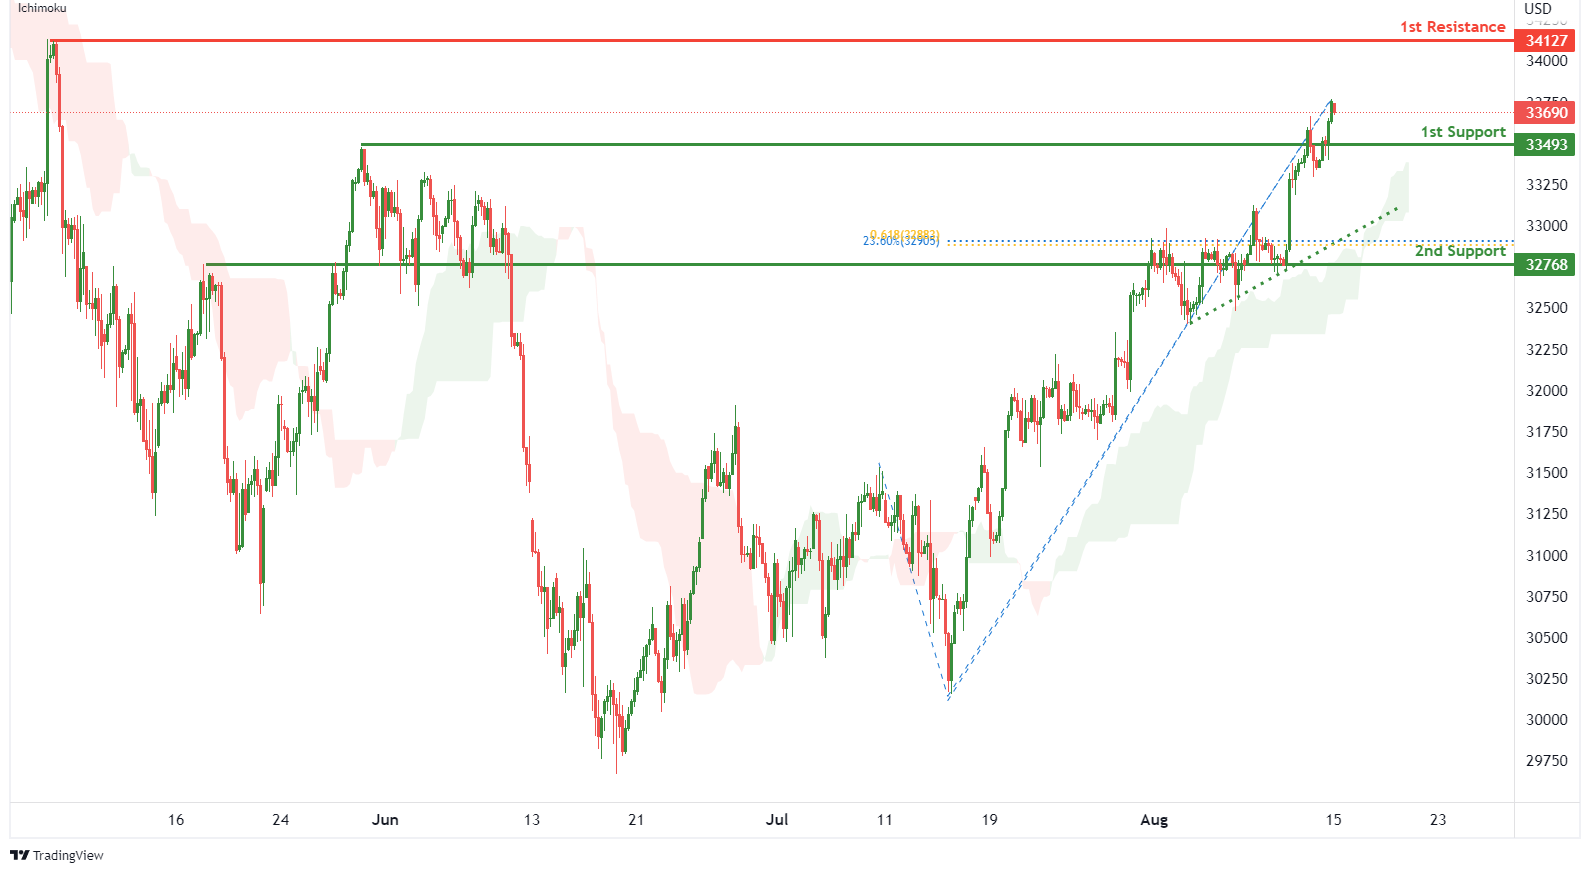
On the H4, with price moving above the ichimoku indicator and along an ascending trendline, we have a bullish bias that price will rise from our 1st support at 33493 where the pullback support is to the 1st resistance at 34127 where the swing high resistance is. Alternatively, price could break 1st support structure and drop to 2nd support at 32768 where the pullback support, 23.6% fibonacci retracement and 61.8% fibonacci projection are.
Areas of consideration:
- H4 time frame, 1st resistance of 34127
- H4 time frame, 1st support at 33493
DAX:
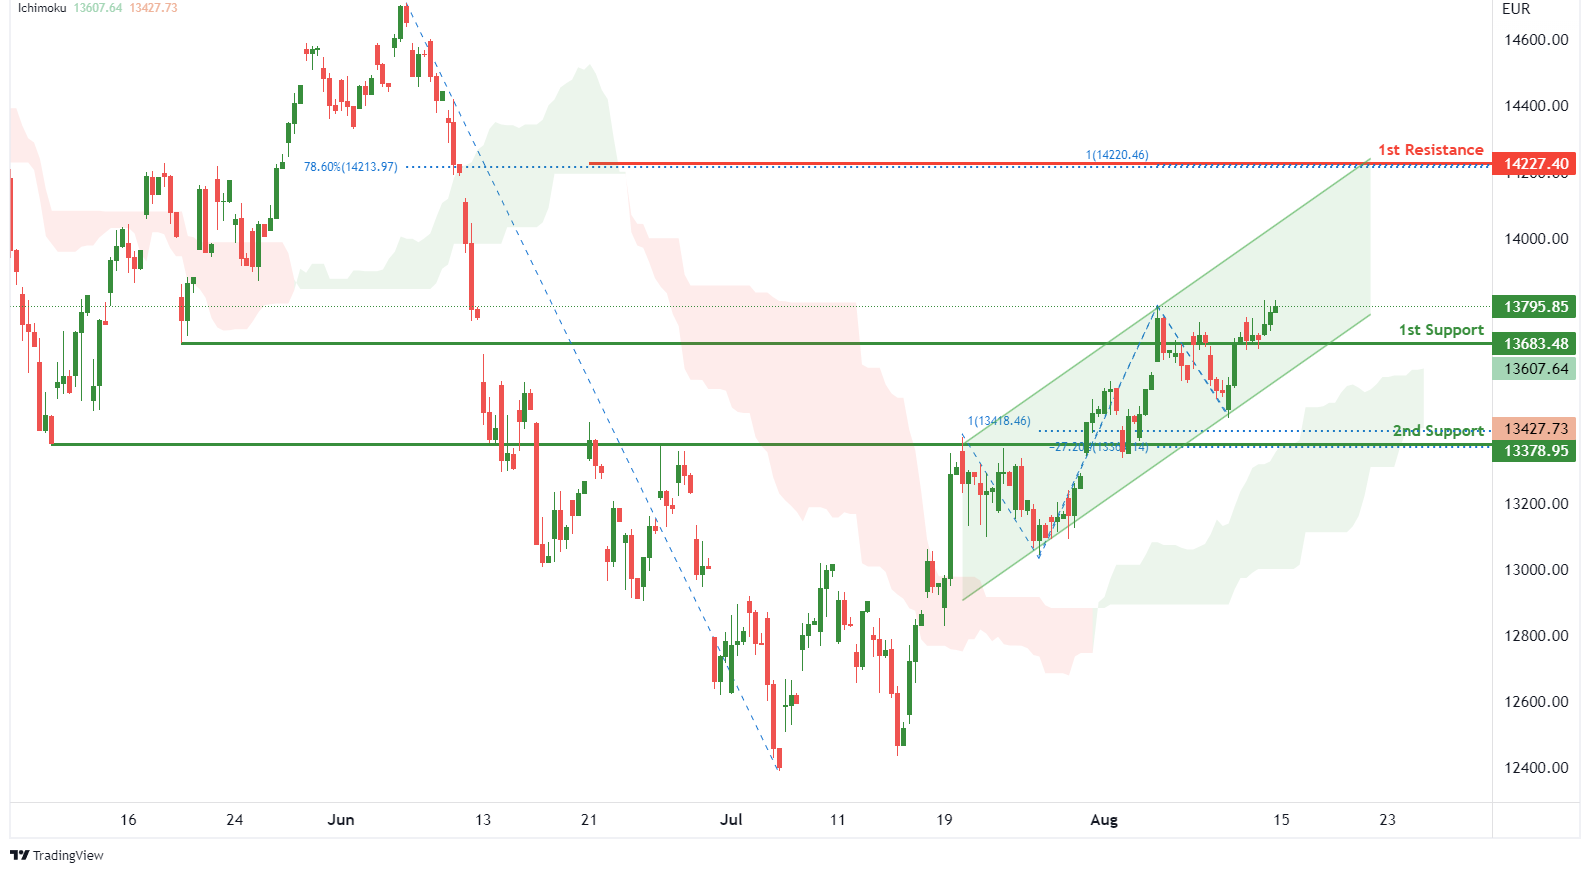
On the H4, with price moving above the ichimoku indicator and within the ascending channel, we have a bullish bias that price will rise from 1st support at 13683.48 where the pullback support is to the 1st resistance at 14227.40 in line with 100% fibonacci projection and 78.6% fibonacci retracement. Alternatively, price could break 1st support and drop to 2nd support at 13378.95 where the overlap support, -27.2% fibonacci expansion and 100% fibonacci projection are.
Areas of consideration:
- H4 time frame, 1st resistance of 14227.40
- H4 time frame, 1st support at 13683.48
ETHUSD:
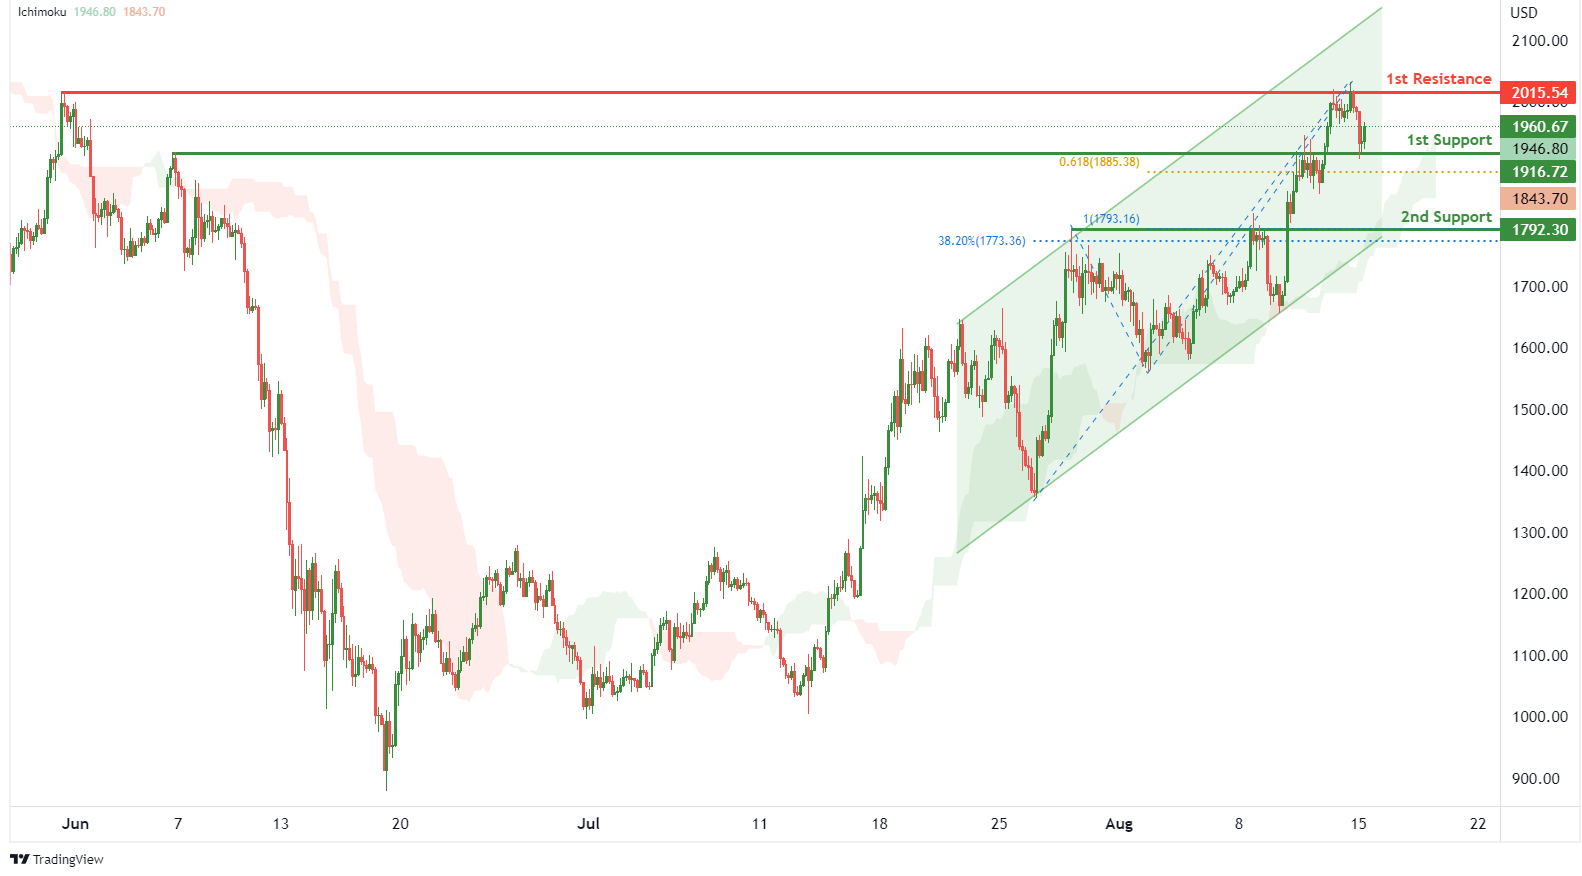
On the H4, with price moving within an ascending channel and above the ichimoku indicator, we have a bullish bias that price will rise from 1st support at 1916.72 where the pullback support and 61.8% fibonacci projection are to the 1st resistance at 2015.54 where the swing high resistance is. Alternatively, price could break 1st support structure and drop to 2nd support at 1792.30 where the overlap support, 38.2% fibonacci retracement and 100% fibonacci projection are.
Areas of consideration:
- H4 time frame, 1st resistance of 2015.54
- H4 time frame, 1st support at 1916.72
BTCUSD:
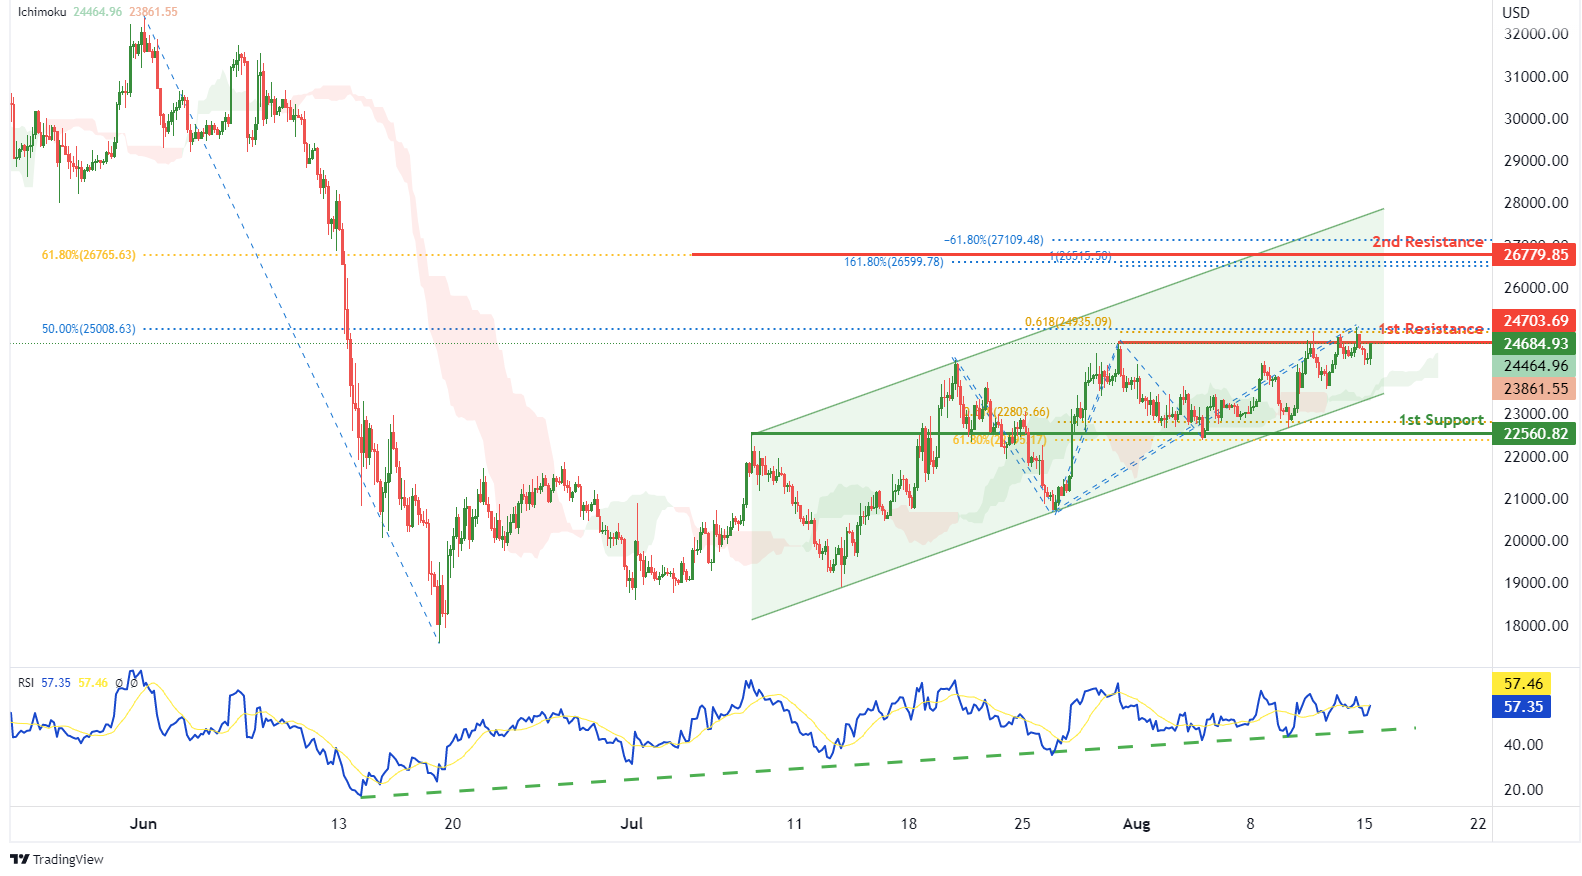
On the H4, with price moving within a bullish channel as well as above the ichimoku indicator and RSI moving along an ascending trendline, we have a bullish bias that price will rise to our 1st resistance at 24703.69 where the swing high resistance, 50% fibonacci retracement and 61.8% fibonacci projection are. Once there is upside confirmation that price has broken 1st resistance structure, we would expect bullish momentum to carry price to 2nd resistance at 26779.85 where the 61.8% fibonacci retracement, -61.8% fibonacci expansion, 161.8% fibonacci extension and 100% fibonacci projection are. Alternatively, price could drop to 1st support at 22560.82 where the pullback support, 61.8% fibonacci retracement and 61.8% fibonacci projection are.
Areas of consideration:
- H4 time frame, 1st resistance of 24703.69
- H4 time frame, 1st support at 22560.82
S&P 500:
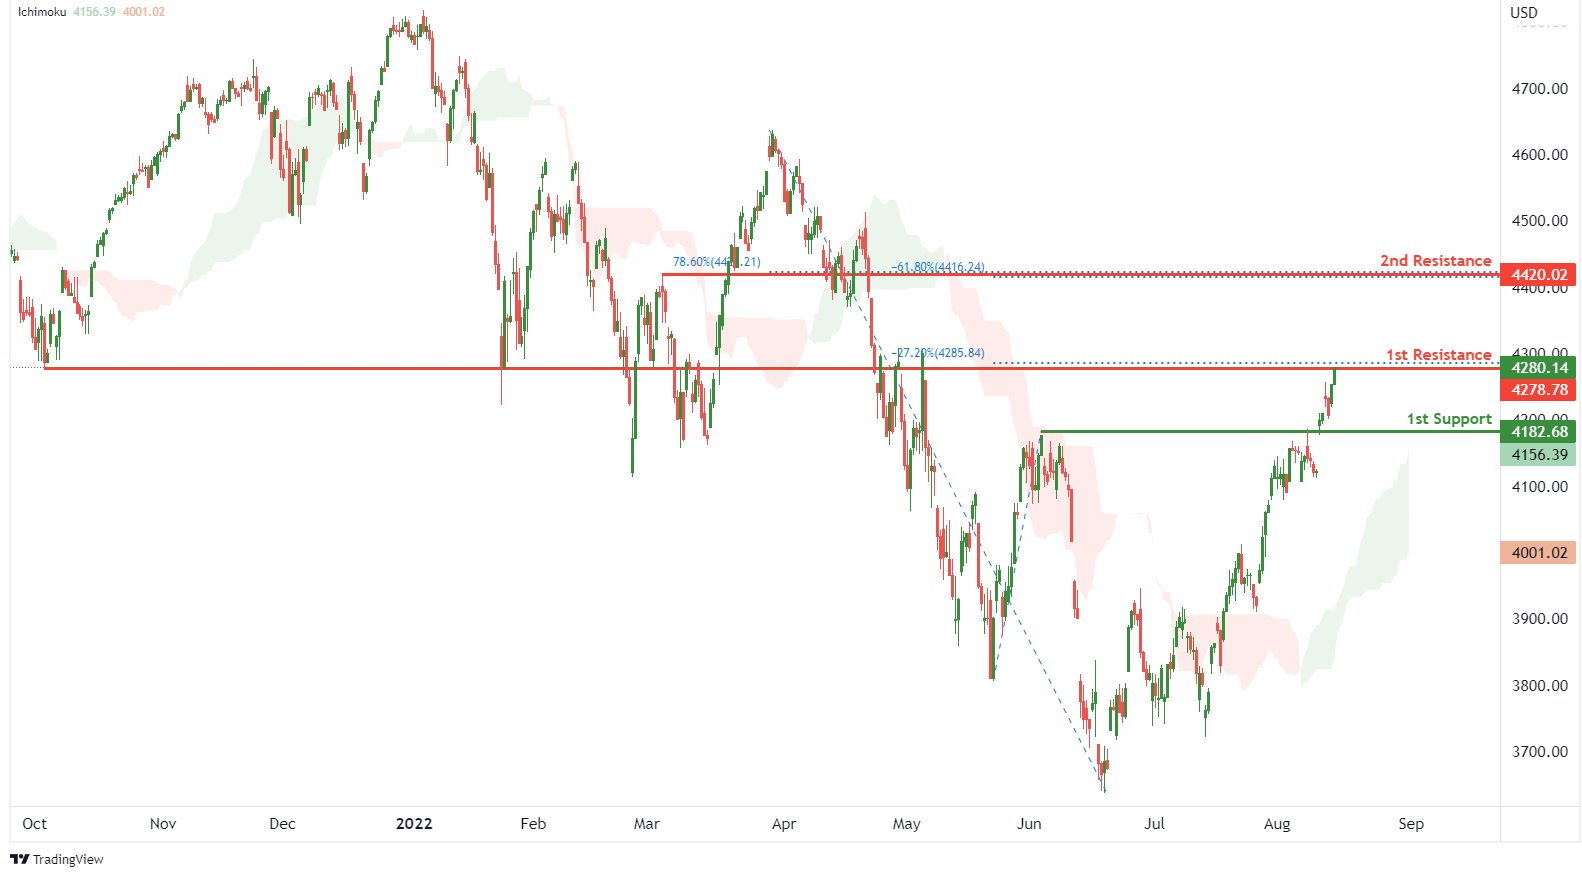
On the H4, with prices moving above the ichimoku indicator, we have a bullish bias that price will rise to 1st resistance at 4278.78 where the overlap resistance and -27.2% fibonacci expansion are. Once there is upside confirmation that price has broken 1st resistance structure, we would expect bullish momentum to carry price to 2nd resistance at 4420.02 where the pullback resistance, 78.6% fibonacci retracement and -61.8% fibonacci expansion are. Alternatively, price could drop to 1st support at 4182.68 where the pullback support is.
Areas of consideration:
- H4 time frame, 1st resistance of 4278.78
- H4 time frame, 1st support at 4182.68
EUR/USD Holds Support, Can Bulls Save The Day?
Key Highlights
- EUR/USD struggled to stay above the 1.0350 pivot zone.
- A major bullish trend line is forming with support near 1.0235 on the 4-hours chart.
- Gold price rallied further above the $1,780 resistance.
- GBP/USD started a downside correction from the 1.2280 resistance zone.
EUR/USD Technical Analysis
The Euro gained pace above the 1.0220 resistance zone against the US Dollar. EUR/USD even cleared the 1.0250 and 1.0300 levels before the bears appeared.
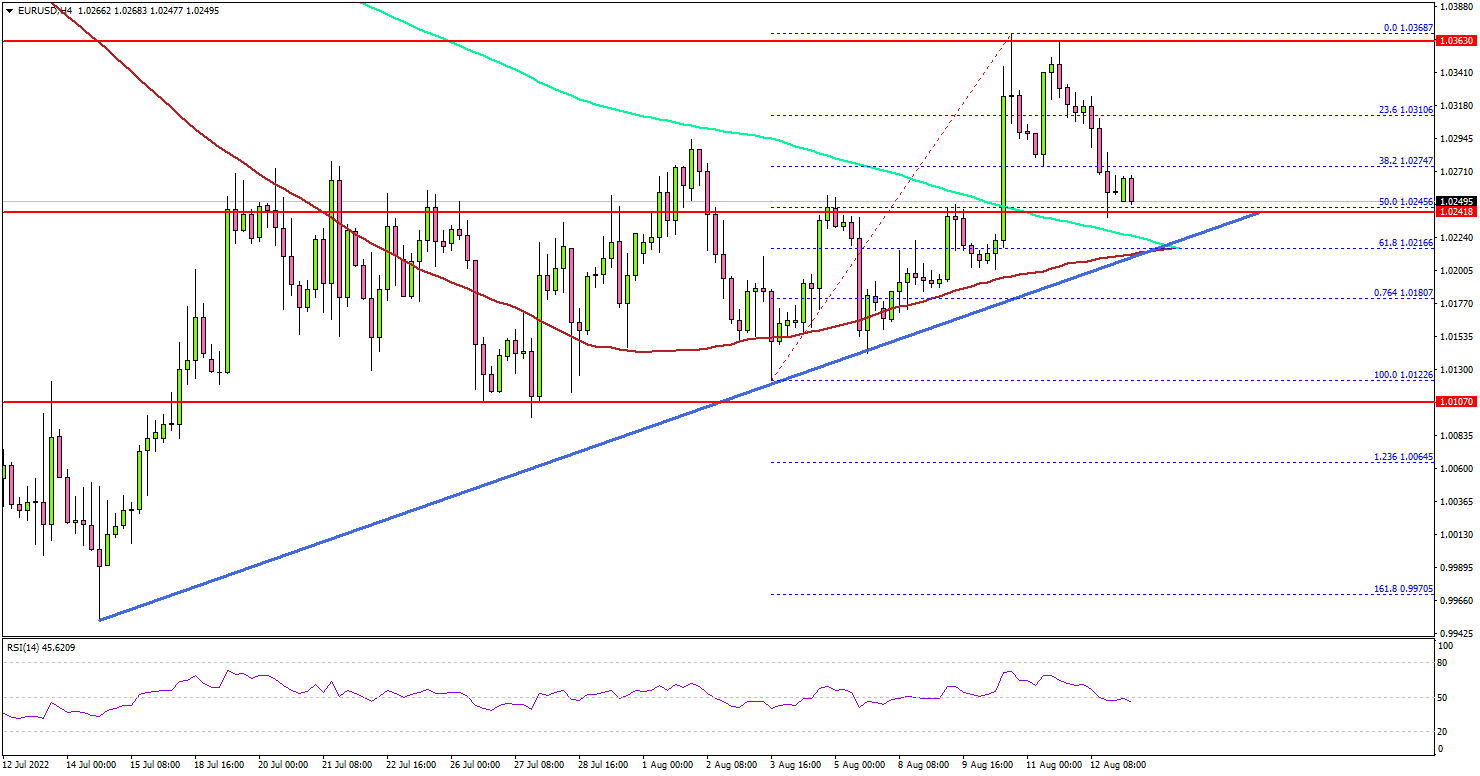
Looking at the 4-hours chart, the pair settled above the 1.0250 level, the 100 simple moving average (red, 4-hours), and the 200 simple moving average (green, 4-hours). There was a spike above the 1.0350 level and the pair traded as high as 1.0368.
The pair is now correcting lower and trading below the 1.0300 level. There was a test of the 50% Fib retracement level of the upward move from the 1.0122 swing low to 1.0368 high.
On the downside, there is a decent support forming near 1.0235 level. There is also a major bullish trend line forming with support near 1.0235 on the same chart.
The main support is now forming near the 1.0200 level. A downside break below the 1.0200 support might spark more losses. The next major support is near the 1.0150 level. Any more losses might send the pair towards the 1.0100 zone.
On the upside, the pair is facing resistance near the 1.0320 level. The next major resistance is near the 1.0350 level. A clear move above the 1.0350 resistance might send the pair higher towards the 1.0400 level.
The next major resistance is 1.0420, above which the pair could accelerate higher. In the stated case, the pair could rise towards the 1.0500 resistance zone in the near term.
Looking at GBP/USD, the pair climbed higher above the 1.2220 resistance level, but it failed to gain strength above the 1.2280 level and corrected lower.
Economic Releases
- NY Empire State Manufacturing Index for August 2022 – Forecast 8.5, versus 11.1 previous.
Eco Data 8/15/22
[php_everywhere instance="1"]
Forex and Cryptocurrencies Forecast
EUR/USD: Weak Inflation Weakens Dollar
EUR/USD has been moving sideways in the 1.0100-1.0270 channel for more than three weeks. Attempts to break through its upper or lower border ended in failure each time. Even very strong data on the US labor market, which came out in the first week of August, did not help the dollar. Recall that unemployment in the US has remained at 3.6% since March, which is a very good indicator. And it became even lower in July, 3.5%. And such an important indicator as NFP, the number of new jobs created outside the agricultural sector, with a forecast of 250K, actually reached 528K. And this despite the fact that it was 372K a month earlier.
The sideways movement continued until Wednesday, August 10, when the pair moved sharply higher, turning the 1.0270 level from resistance to support. And the point here is not the strengthening of the euro, but the weakening of the dollar. The position of the American currency deteriorated after the release of the US inflation report. The consumer price index (CPI) with a forecast of 0.2% in July turned out to be at the level of 0.0% (1.3% a month earlier). It decreased from 9.1% to 8.5% (forecast 8.7%) on an annualized basis. Instead of the expected 0.5%, the base CPI grew by only 0.3% in July (0.7% a month earlier).
All these figures indicate clearly that inflation, the war against which the Fed launched, is declining. Of course, this is not a final victory, but the success of the American Central Bank is obvious. Therefore, it may soften its monetary policy somewhat and not raise interest rates as aggressively as it has done in the past two months.
Speaking at the end of the July meeting of the FOMC (Federal Open Market Committee), Fed Chairman Jerome Powell tried to convince everyone that the regulator is still hawkish. And that, if necessary, the Fed is ready to accelerate the pace of rate hikes. However, even then the markets did not believe Powell and reacted by turning towards the stock market. And now the inflation data has become another argument in favor of the fact that the FOMC may raise the rate not by 0.75%, but only by 0.50% in September, stop raising rates altogether in November, and return to the quantitative easing program altogether in 2023.
Of course, this is just a forecast so far. More precisely, not even a forecast, but just expectations. But it was them that continued to push stock indices S&P500, Dow Jones, Nasdaq up, and did not allow the EUR/USD pair to fall again to the parity of 1.0000. Not yet.
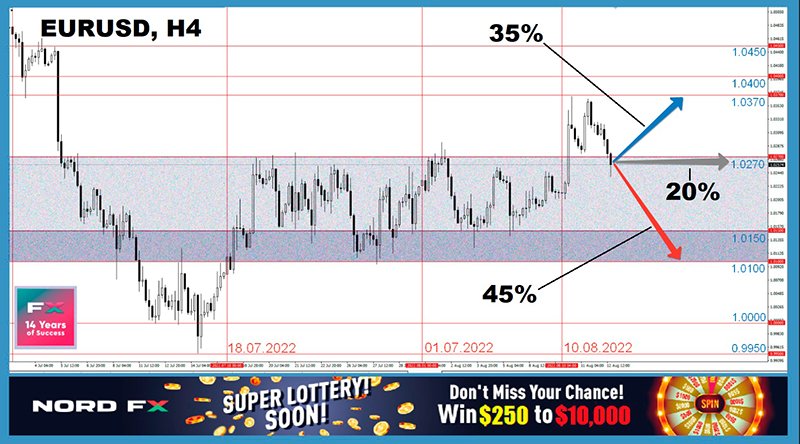
EUR/USD ended the past week at 1.0260, returning to the medium-term sideways channel of 1.0100-1.0270. 45% of experts vote for the fact that it will go further down, and maybe even break through the lower border of the channel. 35% show it the way to the north and 20% - to the east. As for the oscillators on D1, 40% are colored red, 40% are green, and 20% are neutral gray. There is complete balance among the trend indicators: 50% look south and 50% look north.
The nearest support for the pair is the level 1.0220, then there are zones 1.01500-1.0200 and 1.0095-1.0120. The bears' main target is, of course, 1.0000. If this key level is broken, the bears will target the July 14 low at 0.9950, even lower is the strong 2002 support/resistance zone of 0.9900-0.9930. The next serious task of the bulls will be a breakout of the upper border of the channel 1.0270, then there is a high of the past week in the area of 1.0364-1.0368, the next target is a return to the zone 1.0400-1.0450, then there are zones 1.0520-1.0600 and 1.0650-1.0750.
The coming week will be full of all sorts of economic statistics. Thus, the ZEW Economic Sentiment Index in Germany will be published on Tuesday, August 16. there will be preliminary data on Eurozone GDP (Q2) on Wednesday, August 17, as well as data on retail sales in the US. The minutes of the last FOMC meeting will be published on the same day. We are waiting for data on European inflation (CPI) on Thursday, August 18, as well as on the labor market, home sales and manufacturing activity in the United States.
GBP/USD: GDP Falls, Forecasts Remain Gloomy
GBP/USD reacted to the US inflation data released on Wednesday, August 10, with a jump north by almost 200 points to the height of 1.2276. True, it failed to stay there, and the last chord sounded at around 1.2135. Even the global rise in risk sentiment did not help the pound. The main reason is the gloomy economic prospects for the UK economy and no less gloomy forecasts of the Bank of England.
UK GDP data for both June and Q2 were released on Friday, August 12. The June contraction turned out to be less than expected: -0.6%, while the forecast was -1.2%. The fall in GDP in April-June amounted to -0.1% against the expected -0.2% and +0.8% in Q1. Accordingly, the annual figure was 2.9% against the forecasted 2.8% and 8.7% in Q1. All these data turned out to be slightly better than expected. But, despite this, the slide of the economy into recession is an obvious fact, and the only question that remains is the depth and duration of such a fall.
According to 55% of analysts, the last week did not bring anything good to the pound, and therefore the pair will continue its fall. The opposite point of view is also held by only 15% of experts, the remaining 30% remain neutral. The readings of the indicators on D1 are as follows. As for the trend indicators, the ratio is 85% to 15% in favor of the red ones. Only 25% of the oscillators side with the bears, 35% indicate growth, 40% have taken a neutral position.
The nearest support is located at 1.2100, followed by zones and levels 1.2045-1.2065, 1.2000, 1.1875-1.1925 and 1.1800. Below is July 14 low of 1.1759, then 1.1650, 1.1535 and March 2020 lows in the zone 1.1400-1.1450. As for the bulls, they will meet resistance in the zones and at the levels 1.2160-1.2200, 1.2275-1.2325 and 1.2400-1.2430.
The main event of the coming week is likely to be the release of UK inflation data (CPI) on Wednesday August 17. Also noteworthy on the calendar is Tuesday August 16, when UK labor market data comes in, and Friday August 19, when July retail sales in the country become known.
USD/JPY: Yen: Hope for Better but a Very Distant Future
The dynamics of USD/JPY last week was similar to the dynamics of EUR/USD reversed. (This is logical, since here the dollar moves from the position of the base currency to the position of the quote currency). Having started on Monday, August 8 from 135.00, the pair went down sharply on Wednesday, August 10 on the basis of US inflation data, reached the local bottom at 131.72 on August 11, then reversed and finished at 133.45.
Those who are ready to open long-term positions will probably be interested in the forecast of analysts from Westpac, one of the largest banks in Australia, one of the Big Four, and the second largest bank in New Zealand. They believe that the current level of USD/JPY can be justified. Japan is favored by economic growth in Asia and the continuing downward trend in energy prices. And given the possible easing of the monetary policy of the US Federal Reserve, according to Westpac strategists, the pair may fall to 123.00 by the end of 2023.
The end of 2023 is quite far away, more than 16 months. As for the forecast for the near future, the opinions of experts are divided as follows. 45% of analysts expect the pair to rise, another 25% hope for the strengthening of the yen and the continuation of the downtrend, the remaining 30% speak of a side corridor. The readings of indicators on D1 give a bit different picture. Trend indicators have a ratio of 65% to 35% in favor of the red ones. Oscillators are 15% north, 40% south, and the remaining 45% east.
Supports for the pair are located at the levels and in the zones 133.00, 132.50-132.85, 131.75-132.00, 131.00, 130.40, 128.60 and 126.35-127.00. Resistances are 134.00, 134.40-134.60, 135.30-135.60, 136.35-137.00, 137.45, 137.90-138.40, 138.50-139.00, and finally the July 14 high at 139.38.
As for the events of the upcoming week, it is worth paying attention to Monday, August 15, when the preliminary volume of Japan's GDP for Q2 2022 will be known. According to forecasts, it may grow from negative -0.1% to +0.6%. This is the main macroeconomic indicator of market activity, which assesses the rate of growth or decline of the country's economy. Its growth is usually a positive, bullish, factor for the national currency.
CRYPTOCURRENCIES: August 26: a Terrible Day on the Calendar
The crypto community continues to wonder if the crypto market has bottomed out or if a new price collapse awaits us. Before moving on to the next batch of forecasts, let's start with some statistics.
So, the price of bitcoin fell to $17,597 on June 18, which is in line with the level of December 2020 and almost 75% below the all-time high of $68,918. If we measure from the beginning of 2022, the main cryptocurrency started at $47,572 on January 01, and its fall was 63% by June 18. After that, BTC/USD crept up slowly, demonstrating a series of rising lows and highs over 8 weeks. However, as the chart shows, bearish resistance sharply increased above $24,000 and the upward momentum began to fade rapidly. So, the weekly maximum was at a height of $24.264 on July 20, $24.435 on July 29, and, finally, $24.891 on August 11. That is, growth was only about 2.5% over the past 3 weeks.
At the time of this writing, Friday evening, August 12, the total capitalization of the crypto market is $1.155 trillion ($1.089 trillion a week ago), and the Crypto Fear & Greed Index is still in the fear zone, at a level of 42 points (31 weeks ago). BTC/USD is trading at $24,100, about 50% lower than at the beginning of the year.
Despite this price reduction, the number of addresses with a balance of 1 BTC has grown by 9.4% since the beginning of 2022. The indicator reached a historical high of 891.009 at the end of July. The situation is even more pronounced with addresses with a balance of more than 1 ETH, the number of which has grown by 15.7% over seven months. This trend indicates the desire of investors to accumulate. For example, according to the analytical resource The Balance, 39% of US investors began to invest more in cryptocurrencies, wanting to keep their savings.
Is it worth buying the flagship cryptocurrency now? Bloomberg Intelligence Senior Strategist Mike McGlone believes bitcoin is currently trading at a significant discount in a sustained bull market. "The first cryptocurrency hit an all-time low in July compared to its 100-week moving average," the expert explained.
Mark Yusko, managing partner of Morgan Creek Digital, also says that the current price of the first cryptocurrency is unfair, and should be around $30,000. And according to Anthony Scaramucci, CEO of SkyBridge Capital, the "fair value" of BTC should now be around $40,000. PlanB, the creator of the once-popular Stock-to-Flow model, has the bar even higher at $55,000.
All these influencers have their own models and their own justifications. However, one must keep in mind that "fair price" is a rather relative concept. And perhaps the fairest is the current market value. That is, how much sellers are ready to sell now, and buyers are ready to buy a particular asset for.
Some on-chain indicators signaled the passing of the capitulation period and an improvement in investor sentiment in July. This is stated in an analytical report by ForkLog. Against the background of consolidation and the subsequent smooth recovery of the price of bitcoin, the Puell Multiple indicator began to exit the deep oversold zone. The Net Unrealized Profit/Loss (NUPL) metric has moved into the hope/fear zone and is heading towards optimism. The MVRV Z-Score crossed the upper boundary of the deep oversold zone at 0.1 on July 28. This is another signal about the passage of the "bottom" of the market cycle.
According to Sam Bankman-Fried, CEO of the FTX crypto exchange, crypto winter is probably coming to an end, and spring is just around the corner. "I think we've seen the worst already," said the multi-billionaire, better known as SBF. "Some bitcoin miners might have some more problems, but I think we are talking about a few hundred million dollars in total pain, not billions."
However, SBF's crypto spring forecast was not without a "but": "If Nasdaq is left to fall another 25%, and if Fed interest rates do rise to 7%, and if we are in recession for two and a half years […] , bitcoin could fall to $15,000 or $10,000," said the CEO of FTX.
Mike McGlone of Bloomberg Intelligence also looks cautiously towards the US Central Bank. The analyst emphasizes the key role of the US Federal Reserve, which is pursuing aggressive rate hikes in 2022. This could potentially create barriers to risky assets, including cryptocurrencies and stocks. At the same time, Mike McGlone urges not to try to fight the Fed.
Risky assets will have to pass the next serious test at the end of August. An analyst with the nickname Guy noted that the release of economic data expected this month could have a significant impact on the crypto markets. According to him, 3 important factors can interrupt the current uptrend. The first is the US Personal Consumption Expenditure Index (PCE). "PCE data for July will be released on August 26. Given that PCE is the Fed's favorite inflation indicator, a high value could lead to markets collapse in anticipation of an aggressive rate hike."
The second factor is the US gross domestic product for the second quarter: "Revised GDP data for the second quarter will also be published on August 26. Pay attention to them. If these figures are revised upwards, that is, in fact, the US will no longer be in a technical recession, this may push the Fed to raise interest rates even more."
And finally, the third factor is the annual economic symposium in Jackson Hole, where US financial authorities discuss global economic problems. The symposium will take place from August 25 to 27, which coincides with the release dates of the two above-mentioned statistics.
These factors could influence the decisions of Fed Chairman Jerome Powell, which will have a cascading effect on the crypto market. "If the statistics turn out to be unimportant, and Powell is not in the best mood, then the crypto market will have a bad time. Although there are chances that he will keep his thoughts to himself long enough for the cryptocurrency market to continue its recovery rally."
A recent Cumberland Institutional Investor Survey found that the majority of respondents expect bitcoin to rise to $32,000 by the end of the year. Mike Novogratz, CEO of Galaxy Digital investment company, named a slightly smaller figure. In his opinion, the coin is unlikely to rise above the $30,000 level in the near future. The billionaire himself "would be happy" if BTC stopped for a while in the range of $20,000 to $30,000.
The most optimistic forecast this time was given by a popular analyst under the nickname InvestAnswers. The American cryptocurrency exchange Coinbase and the largest investment company BlackRock entered into a partnership agreement last week. BlackRock manages over $10 trillion in assets at the moment. Based on this, InvestAnswers believes that the influx of funds in cryptocurrencies from BlackRock clients could push the BTC price to $773,000.
"If BlackRock places 0.5% of its assets in BTC, then, taking into account the leverage, the capitalization of bitcoin will increase by $1.05 trillion, which means the price will rise to $75,000. And this, I think, is very likely. If BlackRock clients stake 1% of their holdings, then the capitalization will increase by $2.1 trillion, and bitcoin will reach $173,000. And if BlackRock places 5% of its assets, the bitcoin rate will reach $773,000. Although I think this is too aggressive, it may be possible within 3-5 years," the analyst wrote. (It should be noted here that InvestAnswers calculations are correct only for investments with a leverage of 1:21 or more).
And in conclusion of the review, a few words about the main altcoin, ethereum, which is recovering much faster than bitcoin. The BTC/USD pair has risen by about 40% over the past eight weeks, while ETH/ USD has grown by almost 120%. Most experts attribute this bull rally to the upcoming change in the consensus algorithm from Proof-of-Work (PoW) to Proof-of-Stake (PoS), which is expected at the end of September. The head of Galaxy Digital, Mike Novogratz, believes that the altcoin can reach the $2,200 mark even before this event. But according to ethereum co-founder Vitalik Buterin, the best is yet to come, after the network transitions to Proof-of-Stake. "Once the merger actually happens, I expect investor sentiment to improve," he said. "In my opinion, […] the main impact on the ETH rate will be provided after the completion of the merger process."
EUR/USD Weekly Outlook
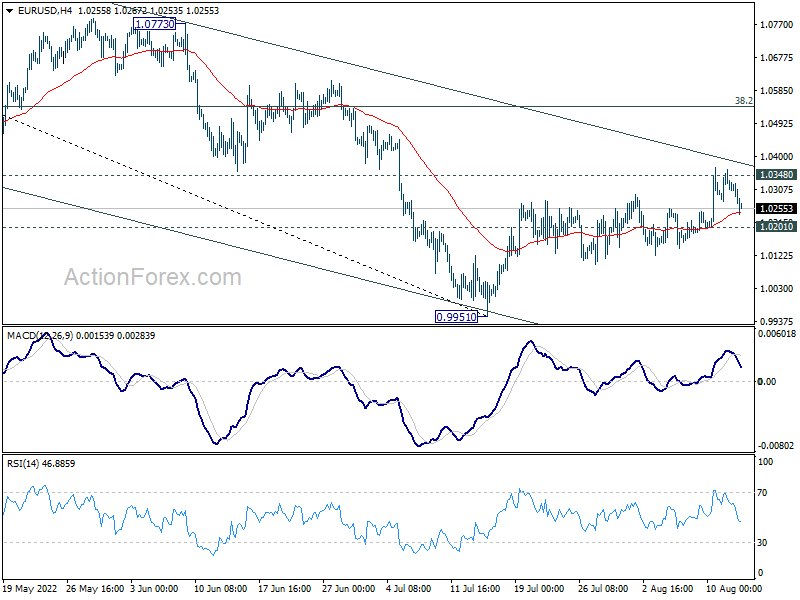
EUR/USD's rebound from 0.9951 resumed last week but failed to sustain above 1.0348 support turned resistance. Initial bias is neutral this week first. On the downside, break of 1.0201 support will argue that such rebound is completed, after rejection by 55 day EMA too. Intraday bias will be back to the downside for retesting 0.9951 low. Nevertheless, firm break of 1.0348 will argue that rally from 0.9951 is at least correcting the fall from 1.1494. Further rise should then be seen to 38.2% retracement of 1.1494 to 0.9951 at 1.0540.
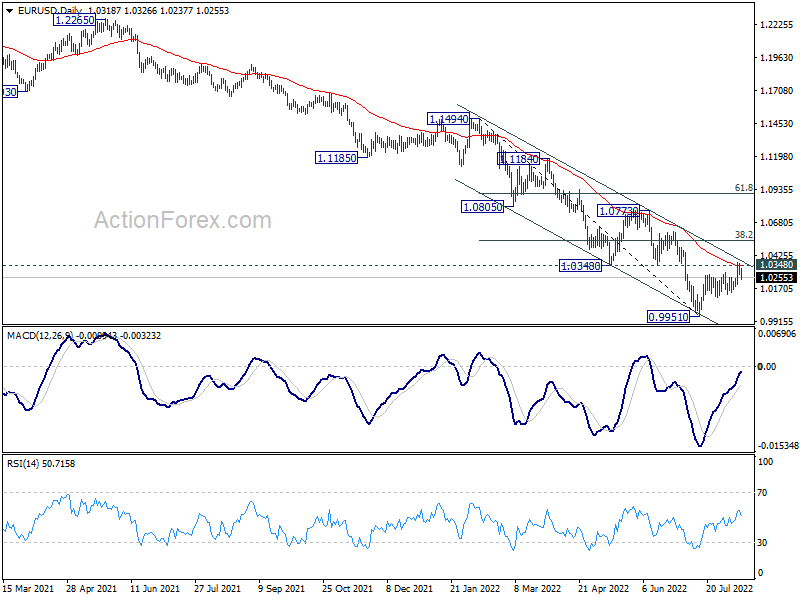
In the bigger picture, down trend from 1.6039 (2008 high) is still in progress. Next target is 100% projection of 1.3993 to 1.0339 from 1.2348 at 0.8694. In any case, outlook will stay bearish as long as 1.0773 resistance holds, in case of strong rebound.
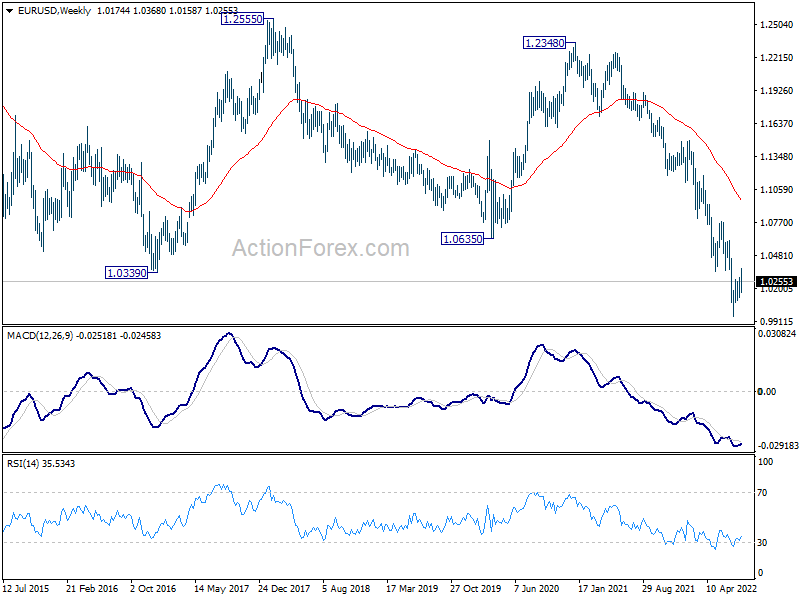
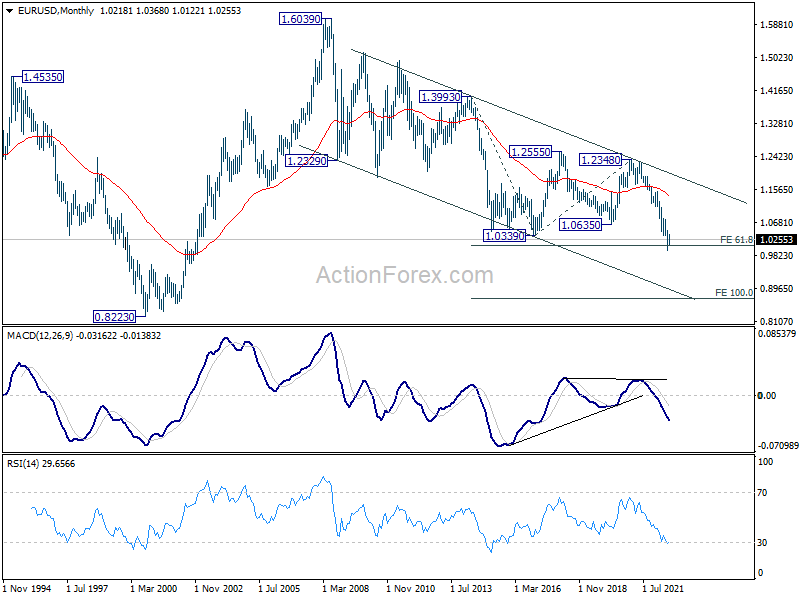
In the long term picture, long term down trend from 1.6039 (2008 high) resuming. Sustained break of 61.8% projection of 1.3993 to 1.0339 from 1.2348 at 1.0090 will pave the way to 100% projection at 0.8694.
USD/JPY Weekly Outlook
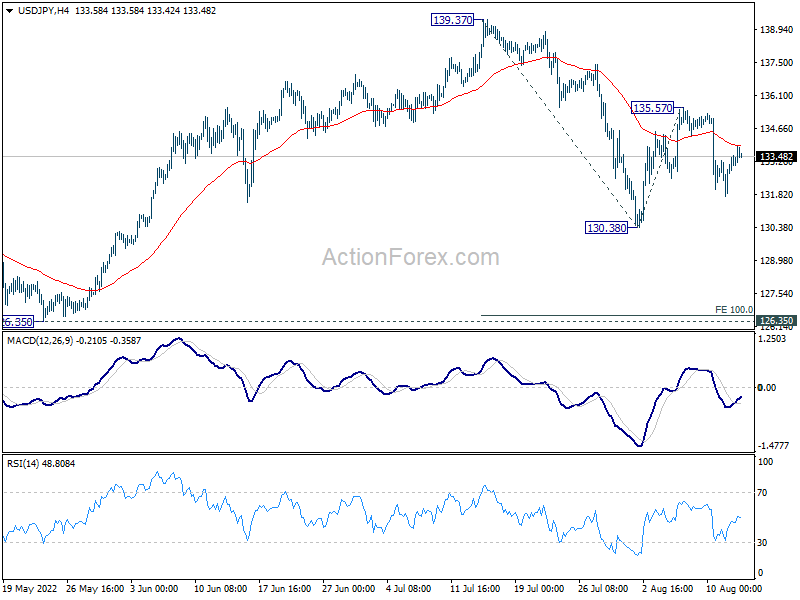
USD/JPY edged higher to 135.57 last week but dropped sharply from there. Yet, downside was contained above 130.38 support. Initial bias stays neutral this week first. Outlook is unchanged that corrective pattern from 139.37 is still unfolding. Range trading between 126.35/139.37 will continue for a while. On the downside, break of 130.38 will target 100% projection of 139.37 to 130.38 from 135.57 at 126.58. On the upside, above 135.57 will resume the rebound form 130.38 to retest 139.37.
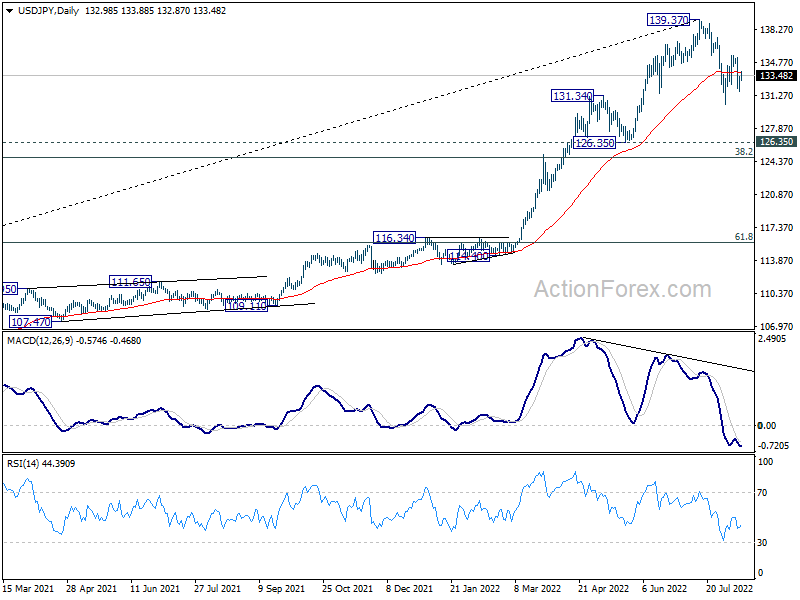
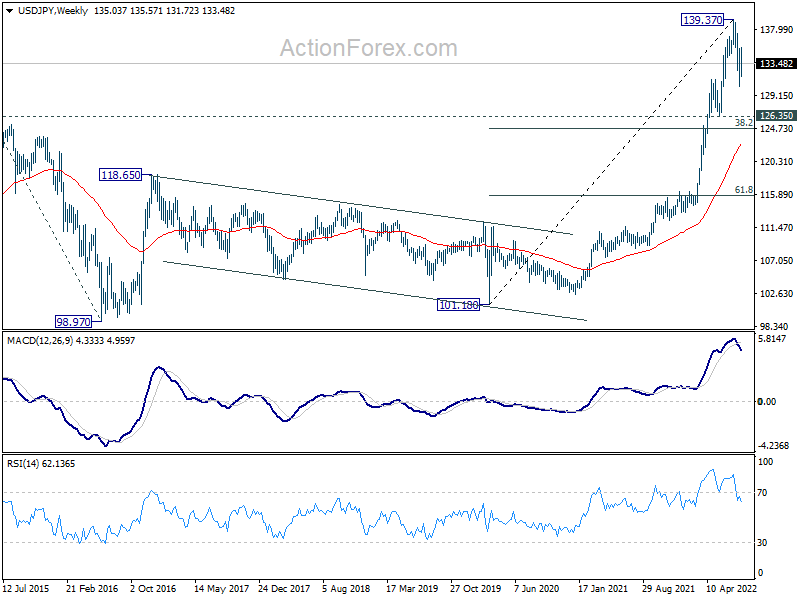
In the bigger picture, fall from 139.37 medium term top is seen as correcting whole up trend from 101.18 (2020 low). While deeper decline cannot be ruled out, outlook will stays bullish as long as 55 week EMA (now at 122.70) holds. Long term up trend is expected to resume through 139.37 at a later stage, after the correction finishes.
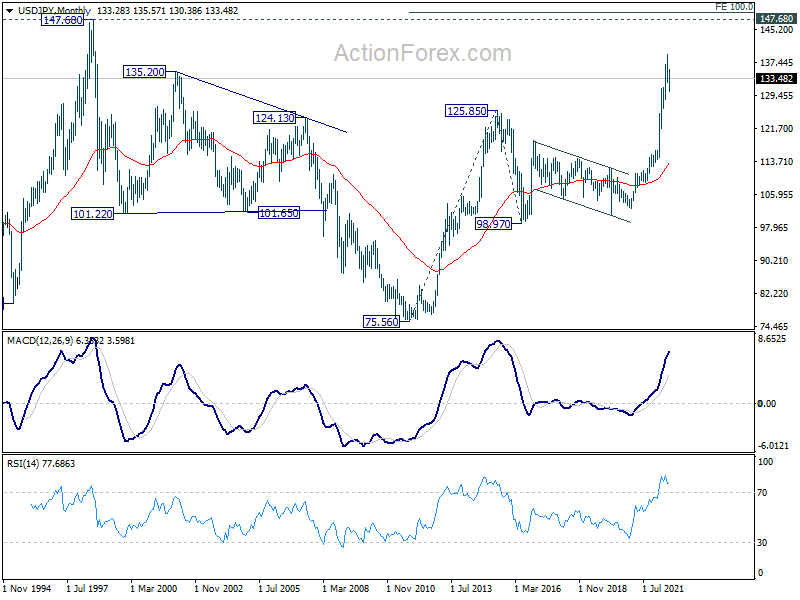
In the long term picture, rise from 101.18 is seen as part of the up trend from 75.56 (2011 low). Further rally is expected to 100% projection of 75.56 (2011 low) to 125.85 (2015 high) from 98.97 at 149.26, which is close to 147.68 (1998 high). This will remain the favored case as long as 55 week EMA (now at 122.70) holds.
GBP/USD Weekly Outlook
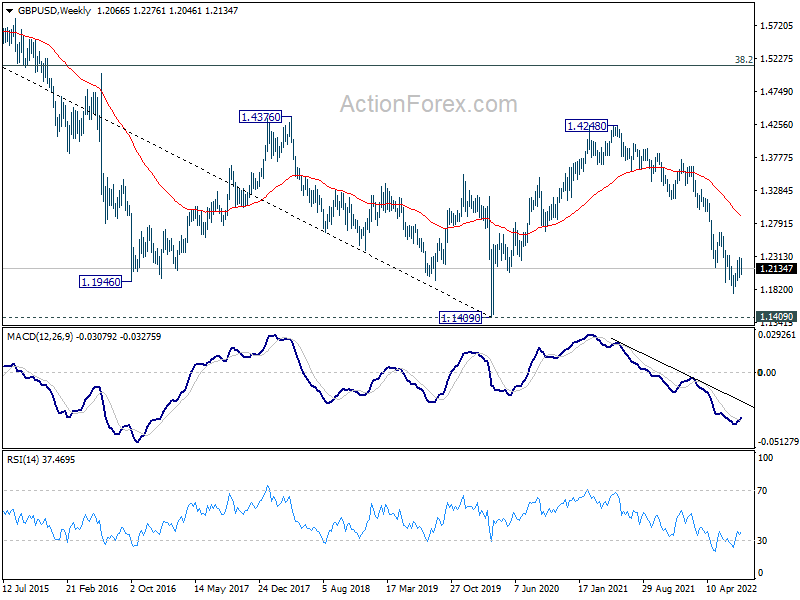
GBP/USD stayed in range below 1.2292 resistance last week and outlook is unchanged. Initial bias will remain neutral this week first. On the upside, decisive break of 1.2292 resistance will complete a head and shoulder bottom pattern (ls: 1.1932; h: 1.1769; rs: 1.2002). Further rally should then be seen to 1.2666 key resistance next. On the downside, however, break of 1.2002 will bring deeper fall back to retest 1.1759 low.
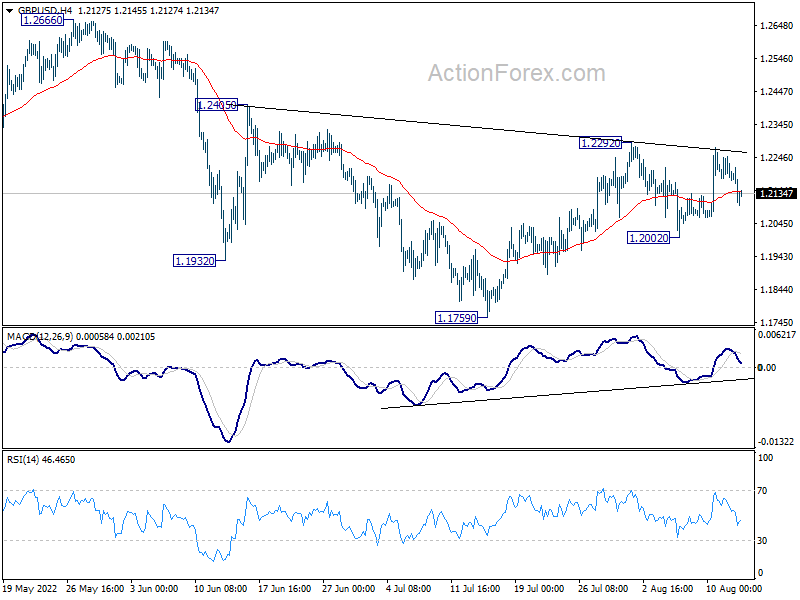
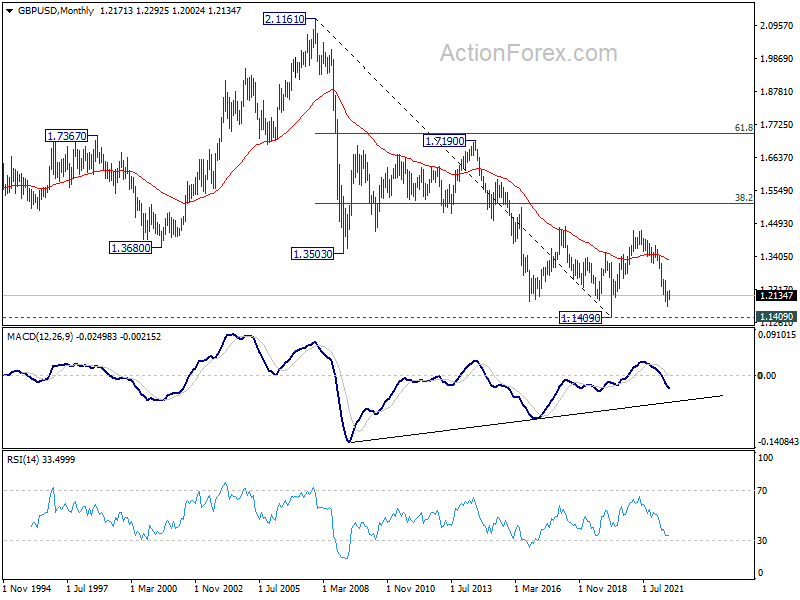
In the bigger picture, fall from 1.4248 (2018 high) could be a leg inside the pattern from 1.1409 (2020 low), or resuming the longer term down trend. Deeper decline is expected as long as 1.2666 resistance holds. Next target is 1.1409 low. However, firm break of 1.2666 will bring stronger rise back to 55 week EMA (now at 1.2897).
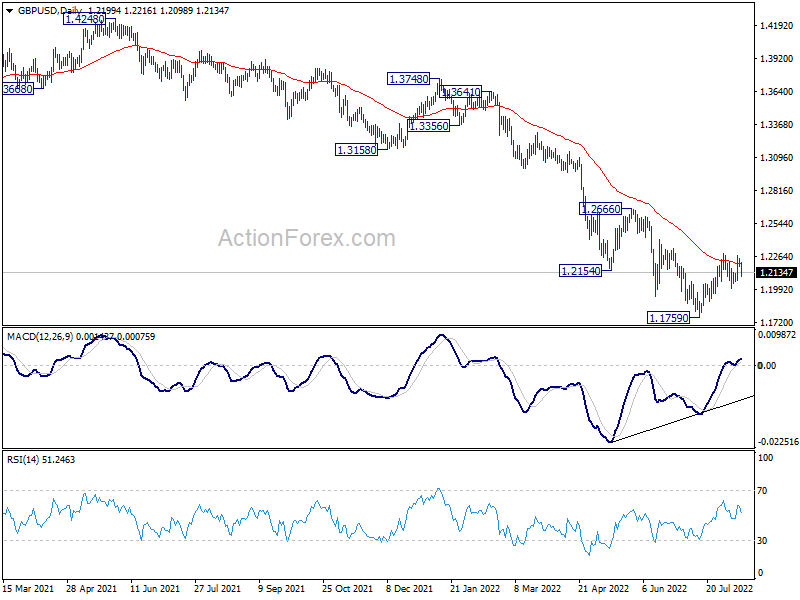
In the longer term picture, rebound from 1.1409 long term bottom should have completed at 1.4248 already, well ahead of 38.2% retracement of 2.1161 to 1.1409 at 1.5134. The development argues that price actions from 1.1409 are developing into a corrective pattern only. That is, long term bearishness is retained for resuming the down trend from 2.1161 (2007 high) at a later stage.