Sample Category Title
USD/CHF Mid-Day Outlook
Daily Pivots: (S1) 0.9366; (P) 0.9455; (R1) 0.9517; More...
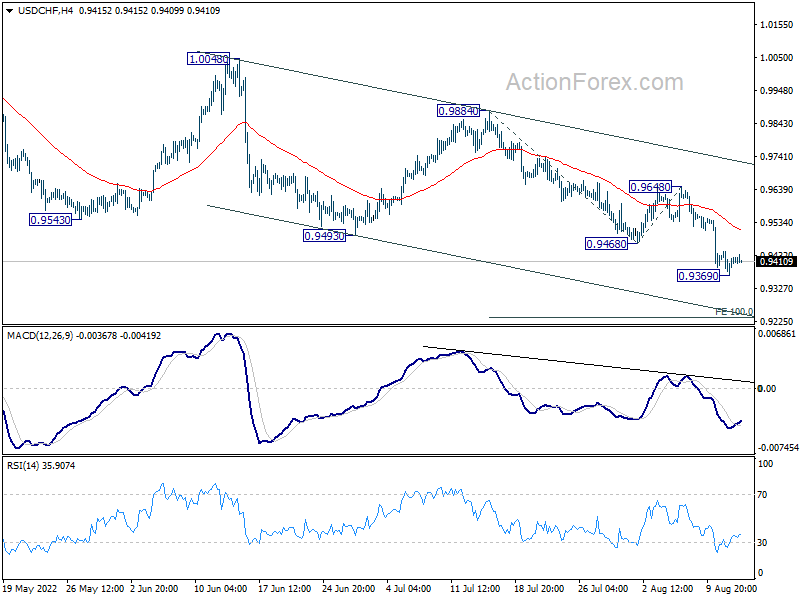
Intraday bias in USD/CHF remains neutral for consolidation above0.9369 temporary low. Upside of recovery should be limited below 0.9648 resistance to bring another decline. Break of 0.9369 will resume larger fall to 100% projection of 0.9884 to 0.9468 from 0.9648 at 0.9232.
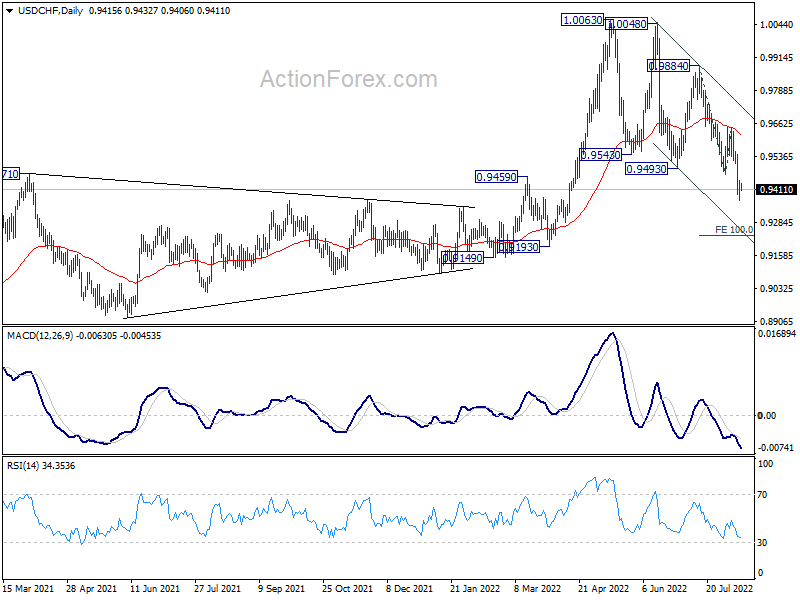
In the bigger picture, break of 0.9471 support turned resistance argues that medium term up trend from 0.8756 has completed with three waves up to 1.0063. Long term sideway pattern might have started another falling leg. Deeper decline would now be in favor as long as 0.9648 resistance holds, to 0.9149 structural support. Sustained break there could pave the way back to 0.8756.
EUR/USD Mid-Day Outlook
Daily Pivots: (S1) 1.0275; (P) 1.0320; (R1) 1.0363; More...
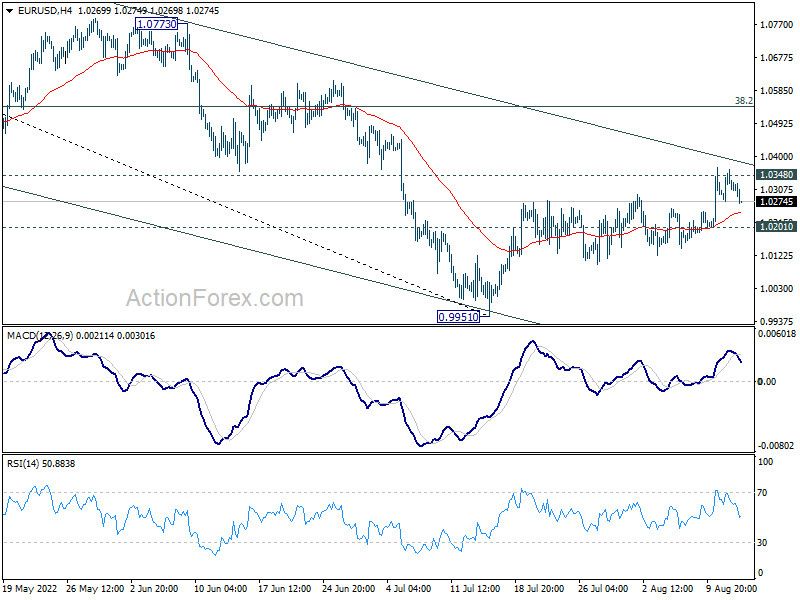
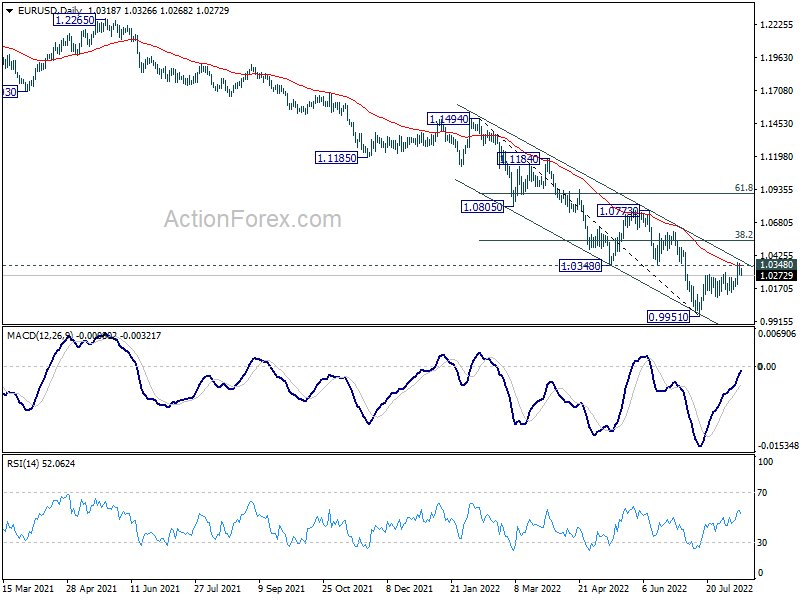
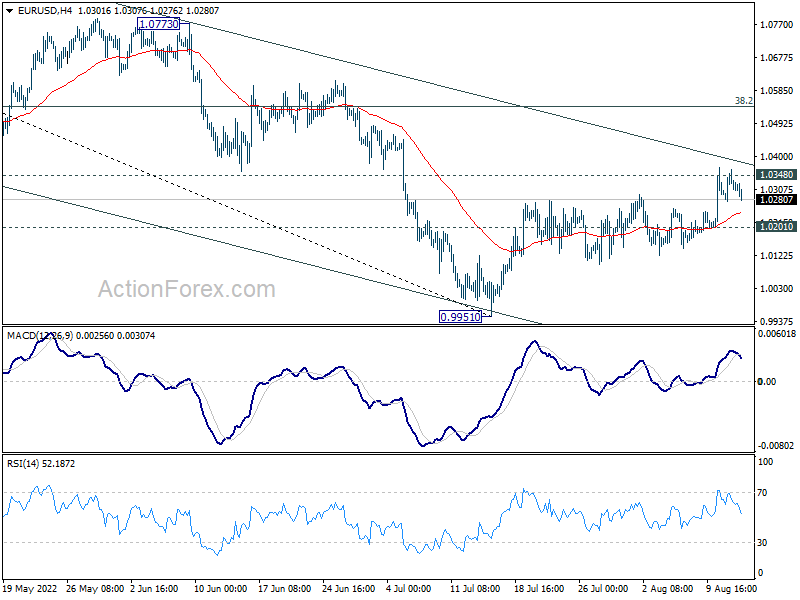
Intraday bias in EUR/USD remains neutral first, with focus staying on 1.0348 support turned resistance, which is close to 55 day EMA (now at 1.0346). Decisive break there argue that rally from 0.9951 is at least correcting the fall from 1.1494. Further rise should then be seen to 38.2% retracement of 1.1494 to 0.9951 at 1.0540. On the downside, break of 1.0201 minor support will suggest that such rebound has completed and bring retest of 0.9951 low instead.
In the bigger picture, down trend from 1.6039 (2008 high) is still in progress. Next target is 100% projection of 1.3993 to 1.0339 from 1.2348 at 0.8694. In any case, outlook will stay bearish as long as 1.0773 resistance holds, in case of strong rebound.
GBP/USD Mid-Day Outlook
Daily Pivots: (S1) 1.2173; (P) 1.2212; (R1) 1.2240; More...
GBP/USD dips notably today but stays in range of 1.2002/2292 and intraday bias stays neutral. On the upside, decisive break of 1.2292 resistance will complete a head and shoulder bottom pattern (ls: 1.1932; h: 1.1769; rs: 1.2002). Further rally should then be seen to 1.2666 key resistance next. On the downside, however, break of 1.2002 will bring deeper fall back to retest 1.1759 low.
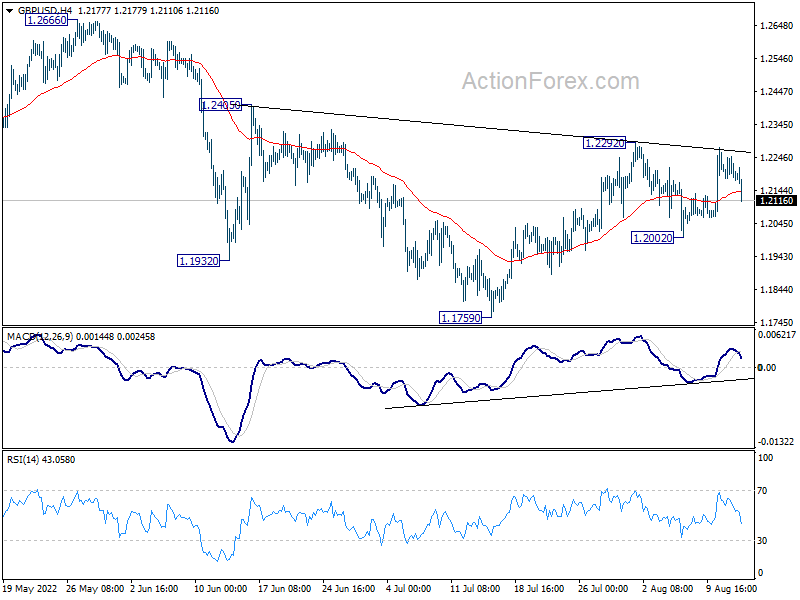
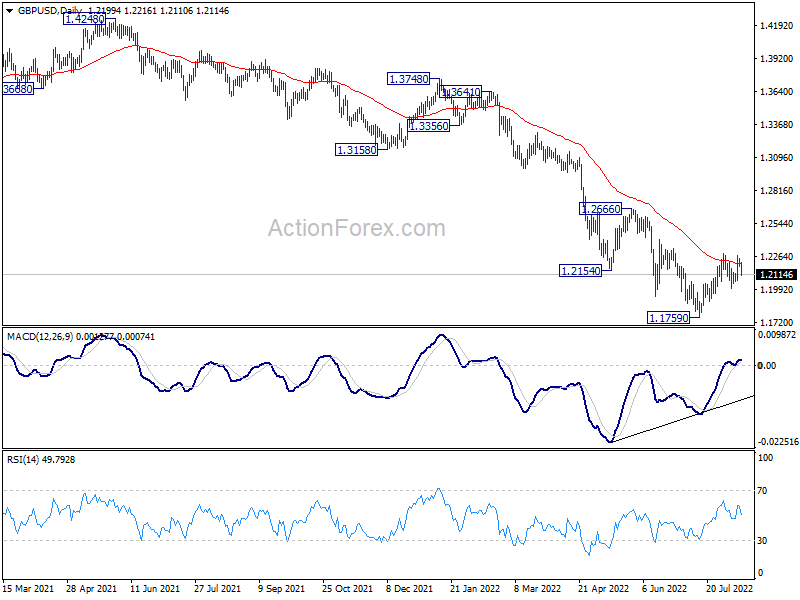
In the bigger picture, fall from 1.4248 (2018 high) could be a leg inside the pattern from 1.1409 (2020 low), or resuming the longer term down trend. Deeper decline is expected as long as 1.2666 resistance holds. Next target is 1.1409 low. However, firm break of 1.2666 will bring stronger rise back to 55 week EMA (now at 1.2925).
Sterling Falls Broadly after GDP, Dollar Paring Losses
Sterling falls broadly today while smaller than expected GDP contraction didn't ease recession worry. Euro is also weak following decline in Germany benchmark yield, but Yen was worse. Dollar, on the other hand, is trying to reverse this week's losses, with help from the strong rebound in 10 year yield. But upside of the greenback is capped, especially against commodity currencies, on risk-on sentiment.
Technically, for now, it appears that EUR/USD struggles to break through 1.0348 support turned resistance with conviction. Rejection by this level, followed by break of 1.0201 support, will argue that recent rebound from 0.9951 has completed. And, larger down trend is ready to resume. This will be the focus from now till the early part of next week.
In Europe, at the time of writing, FTSE is up 0.32%. DAX is up 0.56%. CAC is up 0.23%. Germany 10-year yield is down -0.0001 at 0.973. Earlier in Asia, Nikkei rose 2.62%. Hong Kong HSI rose 0.46%. China Shanghai SSE dropped -0.15%> Singapore Strait Times dropped -0.99%. Japan 10-year JGB yield dropped -0.0037 to 0.189.
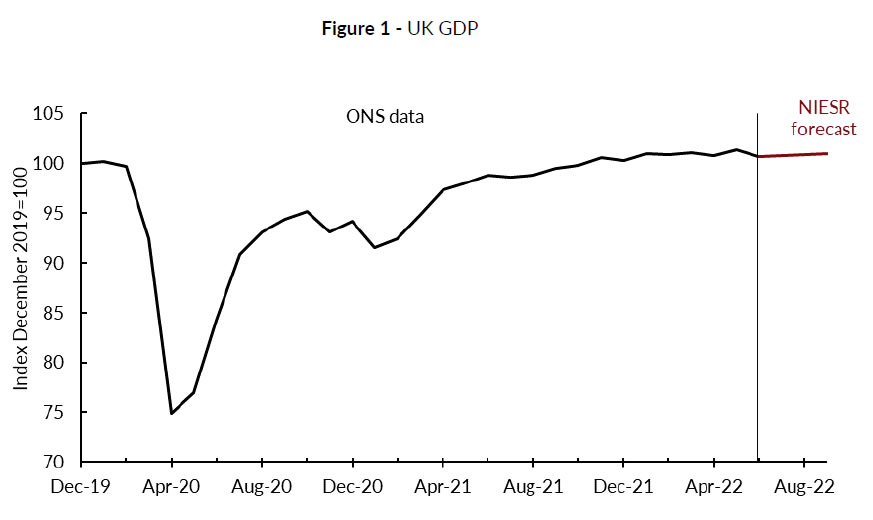
NIESR: UK economy entered recession in Q2, to stay there until Q1
NIESR projects the UK economy to contract -0.1% in Q2, with growth likely to slow further as inflation drags on consumer demand. UK appears to have entered a recession in Q2 already. It expects the recession to last until Q1 of 2023.
GDP growth is estimated at 3.5% in 2022 and 0.5% in 2023. It expects CPI inflation to peak close to 11% in Q3, and return to around 3% a year later, resulting from "slowing in energy price inflation, a tightening in monetary policy and falls in real incomes leading to falling demand".
"It now looks like the UK economy entered a recession in the second quarter of this year as GDP fell by 0.1 per cent, and we expect output to continue falling over the next three quarters. On the expenditure side, the fall in Q2 was driven by a 0.2 per cent fall in consumption; on the output side, by a 0.4 per cent fall in services, particularly, health and social work. GDP fell by 0.6 per cent in June after a revised rise of 0.4 per cent in May as the Platinum Jubilee celebrations affected the monthly profiles." Stephen Millard, Deputy Director for Macroeconomic Modelling and Forecasting, NIESR.
UK GDP down -0.6% mom in Jun, -0.1% qoq in Q2
UK GDP contracted -0.6% mom in June, better than expectation of -1.3% mom. All main sectors contributed negatively to the monthly GDP estimate. Services was the main contributor, down -0.5%. Production dropped -0.9% mom. while construction also fell by -1.4% mom. Monthly GDP was still 0.9% above its pre-coronavirus levels in February 2020.
For the whole of Q2, GDP contracted -0.1% qoq, above expectation of -0.2% qoq. The level of GDP was 2.9% yoy higher than Q2 2021. Also, compared with the same quarter a year ago, the implied GDP deflator rose by 6.0%, primarily reflecting the 7.3% increase in the price of household consumption expenditure, which is the fastest annual household deflator growth rate since 1991.
Eurozone industrial production rose 0.7% mom in June, EU up 0.6% mom
Eurozone industrial production rose 0.7% mom in June, above expectation of 0.0% mom. Production of capital goods rose by 2.6% mom and energy by 0.6% mom, while production of intermediate goods fell by -0.1% mom, durable consumer goods by -0.6% mom and non-durable consumer goods by -3.2% mom.
EU industrial production rose 0.6% mom. Among Member States for which data are available, the highest monthly increases were registered in Ireland (+6.7%), Malta (+4.8%) and Greece (+3.4%). The largest decreases were observed in Romania (-3.9%), Belgium (-2.2%), Italy and Latvia (both -2.1%).
GBP/USD Mid-Day Outlook
Daily Pivots: (S1) 1.2173; (P) 1.2212; (R1) 1.2240; More...
GBP/USD dips notably today but stays in range of 1.2002/2292 and intraday bias stays neutral. On the upside, decisive break of 1.2292 resistance will complete a head and shoulder bottom pattern (ls: 1.1932; h: 1.1769; rs: 1.2002). Further rally should then be seen to 1.2666 key resistance next. On the downside, however, break of 1.2002 will bring deeper fall back to retest 1.1759 low.
In the bigger picture, fall from 1.4248 (2018 high) could be a leg inside the pattern from 1.1409 (2020 low), or resuming the longer term down trend. Deeper decline is expected as long as 1.2666 resistance holds. Next target is 1.1409 low. However, firm break of 1.2666 will bring stronger rise back to 55 week EMA (now at 1.2925).
Economic Indicators Update
| GMT | Ccy | Events | Actual | Forecast | Previous | Revised |
|---|---|---|---|---|---|---|
| 22:30 | NZD | Business NZ PMI Jul | 52.7 | 49.7 | ||
| 06:00 | GBP | GDP M/M Jun | -0.60% | -1.30% | 0.50% | |
| 06:00 | GBP | GDP Q/Q Q2 P | -0.10% | -0.20% | 0.80% | |
| 06:00 | GBP | Industrial Production M/M Jun | -0.90% | -0.80% | 0.90% | 1.30% |
| 06:00 | GBP | Industrial Production Y/Y Jun | 2.40% | 1.60% | 1.40% | 1.80% |
| 06:00 | GBP | Manufacturing Production M/M Jun | -1.60% | -1.70% | 1.40% | 1.70% |
| 06:00 | GBP | Manufacturing Production Y/Y Jun | 1.30% | 1.30% | 2.30% | 2.60% |
| 06:00 | GBP | Index of Services 3M/3M Jun | -0.40% | -0.40% | 0.10% | 0.00% |
| 06:00 | GBP | Goods Trade Balance (GBP) Jun | -22.8B | -22.3B | -21.4B | |
| 08:00 | EUR | Italy Trade Balance (EUR) Jun | -2.17B | 0.35B | -0.01B | -0.06B |
| 09:00 | EUR | Eurozone Industrial Production M/M Jun | 0.70% | 0.00% | 0.80% | 2.10% |
| 12:30 | USD | Import Price Index M/M Jul | -1.40% | -0.50% | 0.20% | 0.30% |
| 14:00 | USD | Michigan Consumer Sentiment Index Aug P | 52.3 | 51.5 |
NIESR: UK economy entered recession in Q2, to stay there until Q1
NIESR projects the UK economy to contract -0.1% in Q2, with growth likely to slow further as inflation drags on consumer demand. UK appears to have entered a recession in Q2 already. It expects the recession to last until Q1 of 2023.
GDP growth is estimated at 3.5% in 2022 and 0.5% in 2023. It expects CPI inflation to peak close to 11% in Q3, and return to around 3% a year later, resulting from "slowing in energy price inflation, a tightening in monetary policy and falls in real incomes leading to falling demand".
"It now looks like the UK economy entered a recession in the second quarter of this year as GDP fell by 0.1 per cent, and we expect output to continue falling over the next three quarters. On the expenditure side, the fall in Q2 was driven by a 0.2 per cent fall in consumption; on the output side, by a 0.4 per cent fall in services, particularly, health and social work. GDP fell by 0.6 per cent in June after a revised rise of 0.4 per cent in May as the Platinum Jubilee celebrations affected the monthly profiles." Stephen Millard, Deputy Director for Macroeconomic Modelling and Forecasting, NIESR
A $66 Slump Could Follow Oil’s Ironic Rebound
WTI crude has gained more than 6.5% this week, and this strengthening has a pinch of irony.
Stock indices managed to surpass the highs of the previous week’s pullback and the weak inflation report’s main driver of increased risk appetite.
A sharp slowdown in price growth and a reduction in the fuel component fuelled speculation that the Fed would slow policy tightening. But oil is a risky asset, so the rest of the market enjoyed a rise. The implication is that oil rose this week because the economy showed the effects of its decline in the previous two months.
It is also interesting that the reversal of stock indices from decline to rising was only a few days after oil reached its peak.
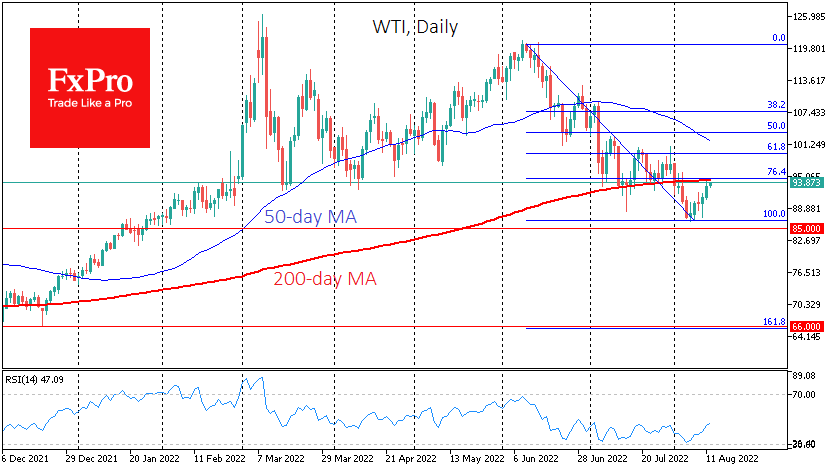
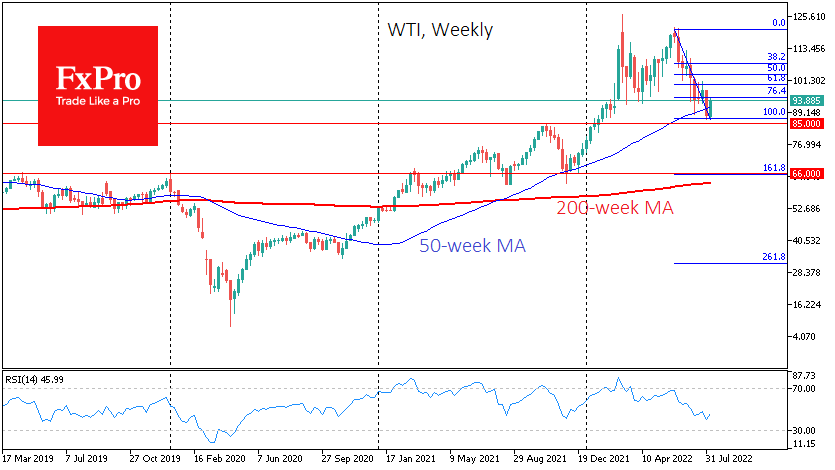
WTI crude oil took the initial setback at the beginning of August and is now testing its 200-day MA, a significant long-term trend line, from the downside. We considered the dip below it on the first day of August as an additional confirmation of the trend reversal to bearish.
However, we would venture to guess that under macroeconomic pressure, the current rebound in oil is a short-term correction after oversold conditions and that the primary trend of the last two months will remain predominant.
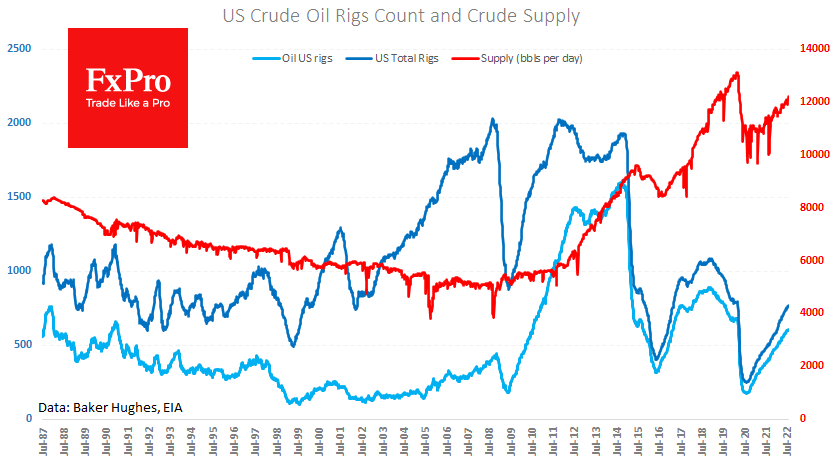
The latest weekly estimates have marked a rise in US oil production to 12.2 million BPD – a new high since April 2020 and a return to a rising trend. Besides, recently, the IEA and OPEC revised their forecasts to a less profound fall in Russian crude production, with cartel output rising. A small production surplus over consumption is forecast, adding pressure on prices.
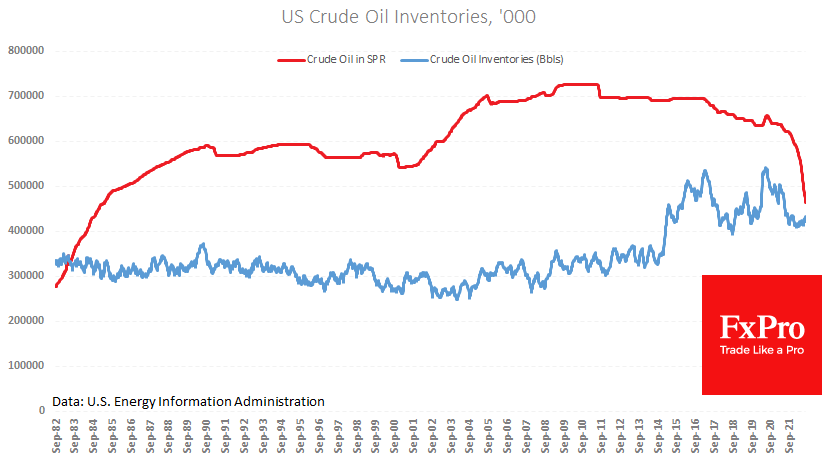
Meanwhile, the US continues to sell off strategic stocks, despite stabilisation and a moderate increase in commercial inventories. US policymakers are now focused on bringing the price of oil down as much as possible and are not prepared to stop. The intention to return to restocking only in 2023 works to encourage US companies to invest in production, as the government will have an increased demand for their raw materials in the future.
In addition, we note that the monetary policy tightening that has taken place over the past few months around the world is only beginning to work to slow demand.
The world could find itself in a stagnant or falling demand situation with continued production growth in addition to the surplus production already in the market and the sell-off from reserves.
The price rally of the past week fits into a corrective rebound picture. If the bulls do not find a new fundamental reason to buy at current levels near $94 for WTI in the next few days, we should expect a bear market recovery.
Short-term downside targets include the October 2021 highs near $85, which the price almost missed last week. A decisive move below that level would make the $66 target relevant. It includes 161.8% of the anti-rally of the past two months, the November and August retracement lows of last year, and the 2019-2020 highs.
Natural Gas Futures Tick Higher as Bullish Forces Linger
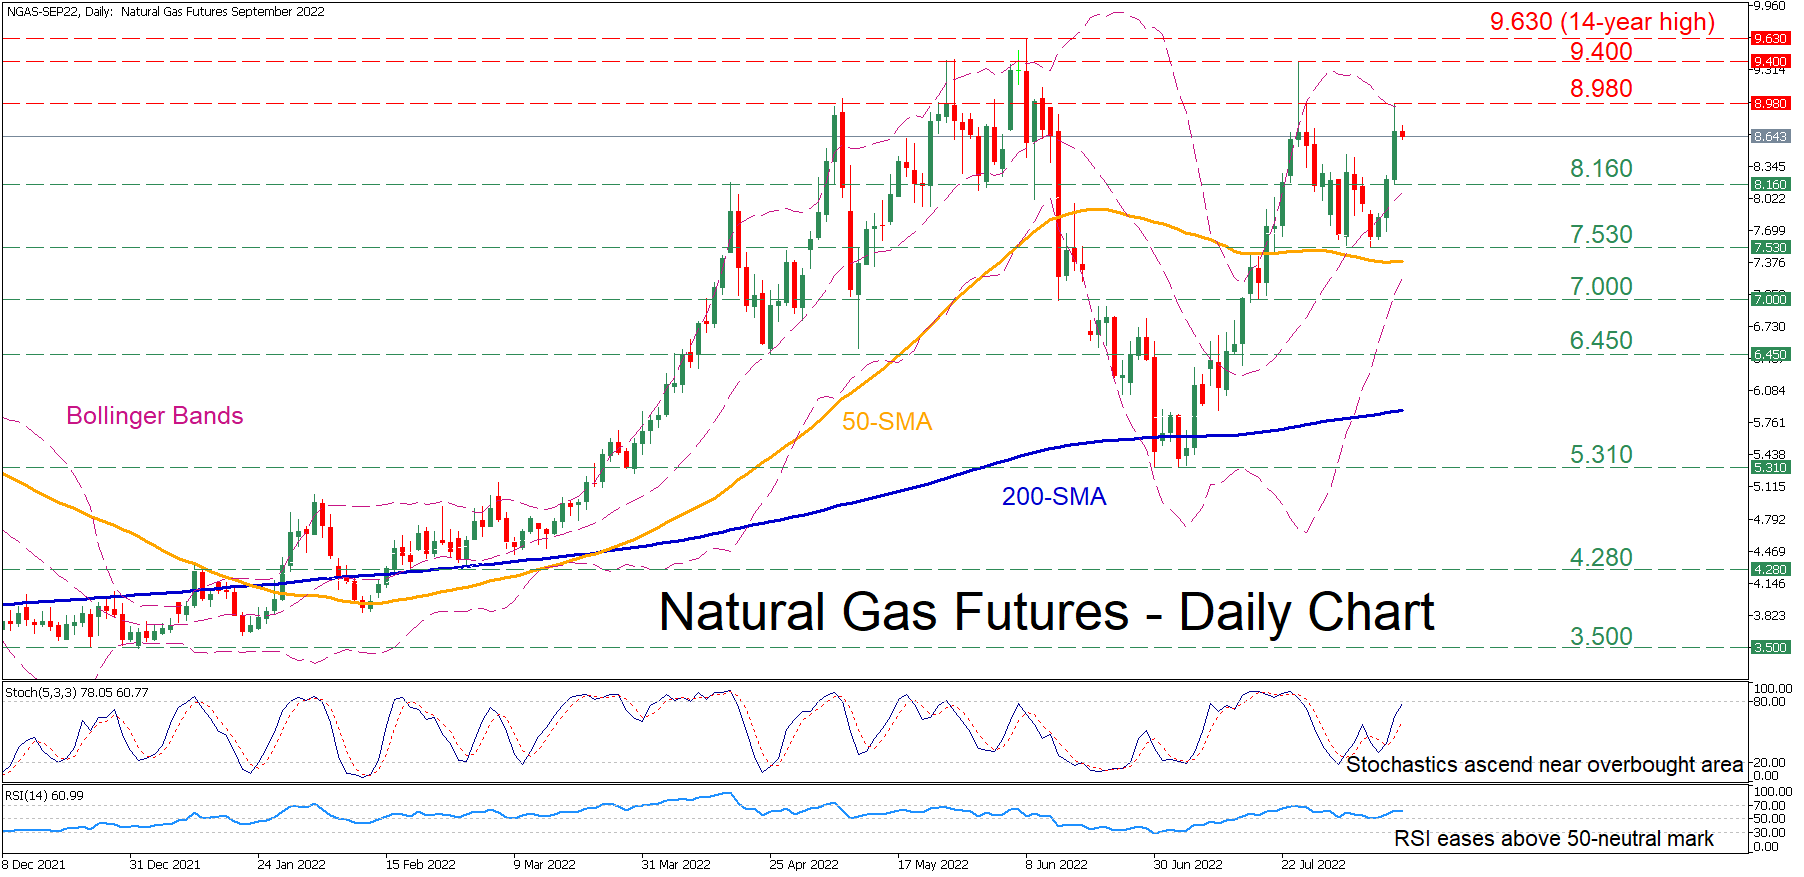
Natural gas futures (September 2022 delivery) have drifted higher again after their recent downside correction faltered. Even though the latest spike seems to have encountered resistance at the upper Bollinger band, the commodity continues to retain a bullish near-term picture.
The momentum indicators suggest that buyers have regained the upper hand. Specifically, the stochastic oscillator is climbing near the 80-overbought territory, while the RSI is flatlining comfortably above the 50-neutral threshold.
In the positive scenario, the price could ascend to test its recent high of 8.980. Piercing through this region, the spotlight may turn to the 9.400 barrier. An upside violation of the latter could open the door for the 14-year high of 9.630.
On the flipside, should the positive momentum fade and the price reverses down, the 8.160 hurdle could act as the first line of defence. Dipping beneath that region, the bears could aim for the crucial 7.530 support before the attention shifts to the 7.000 psychological mark. Failing to halt there, 6,.450 could prove to be a tough obstacle for the price to overcome.
Overall, natural gas futures appear to have the necessary momentum to push even higher. Nevertheless, a break below the 7.530 and the 50-day moving average might alter their short-term picture back to negative.
GBP/USD Slips on GDP, US Confidence Data Next
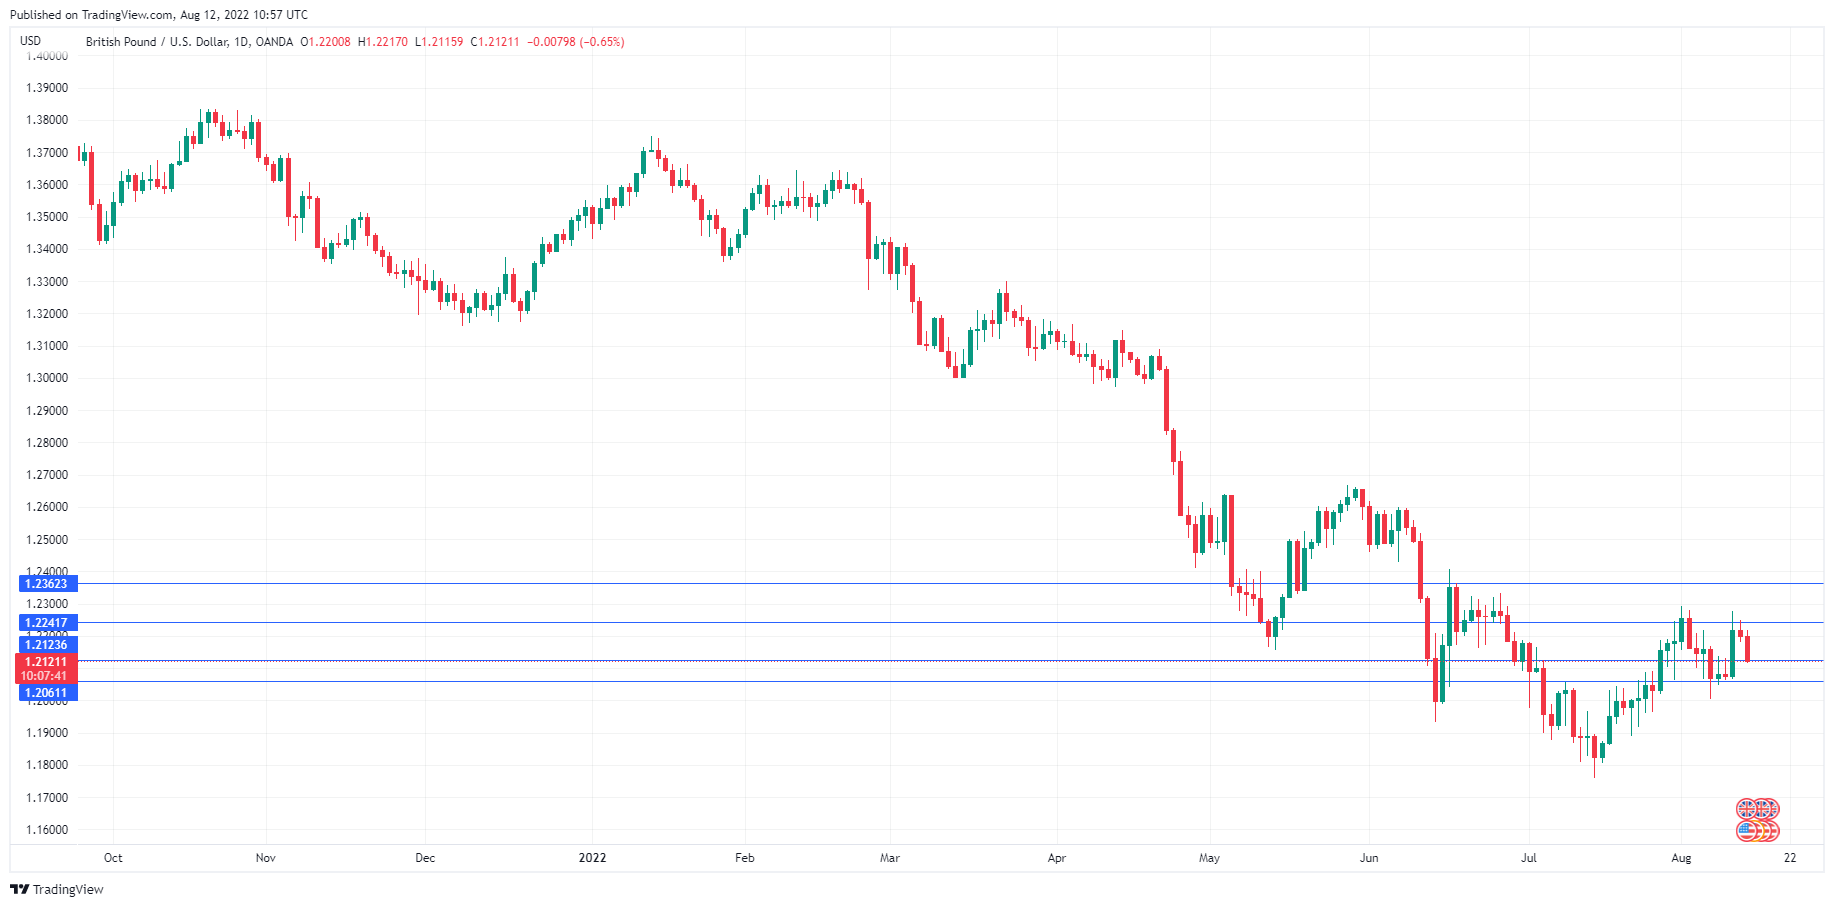
The British pound is in negative territory today, after a contraction in UK GDP. In the European session, GBP/USD is trading at 1.2126, down 0.61% on the day.
British economy declines in Q2
The British pound posted dazzling gains on Wednesday, surging 1.19%. The impressive climb was, however, a case of US dollar weakness, rather than any newfound strength in the pound. Inflation in the US was unexpectedly weaker than forecast, which raised market hopes that the Fed will ease policy. This led to the US dollar being less attractive and the currency took a nasty spill against all the majors.
Sterling hasn’t fared as well after the UK posted the second-quarter GDP report. The economy fell in July by -0.1% QoQ, following a 0.8% gain in June (-0.2% exp). On an annualized basis, GDP growth slowed to 2.9%, within expectations but sharply down from 8.7% in Q1. The outlook does not look good as we head towards winter, with UK households about to be hit with sharp increases in energy prices. Consumers are already struggling with a nasty cost of living crisis, and as they tighten the purse strings, the spectre of a recession will become that much more likely.
Another key indicator, Manufacturing Production, came in at -1.6% MoM, down from a 1.7% gain in May (-1.8% exp). This was the fourth decline in five months, pointing to a worrying downtrend in manufacturing.
The week wraps up with UoM Consumer Sentiment, a key confidence indicator. With the cost of living crisis in the US, it’s no surprise that the index has tumbled – falling from 65.7 in March to just 51.5 in June. This points to weak expansion, just above the neutral 50.0 line. The July forecast calls for a slight improvement to 52.5 points.
GBP/USD Technical
- GBP/USD continues to test resistance at 1.2241. Next, there is resistance at 1.2361
- There is support at 1.2123 and 1.2061
UK Economy Slows Slightly Less than Expected
The UK monthly statistics package showed that the economy lost 0.1% in the second quarter (0.2% expected), and the annual growth rate collapsed from 8.7% to 2.9% (2.8% expected). For the month, the decline was 0.6%, half the forecasts.
A similar “better than might have been” is evident in the other indicators released today. Industrial production fell 0.9% against an expected 1.3% and left something from the last month’s gain. Construction dipped 1.4%, against a forecasted 2.0%. The service sector lost 0.4% of its volume, the first contraction since last March.
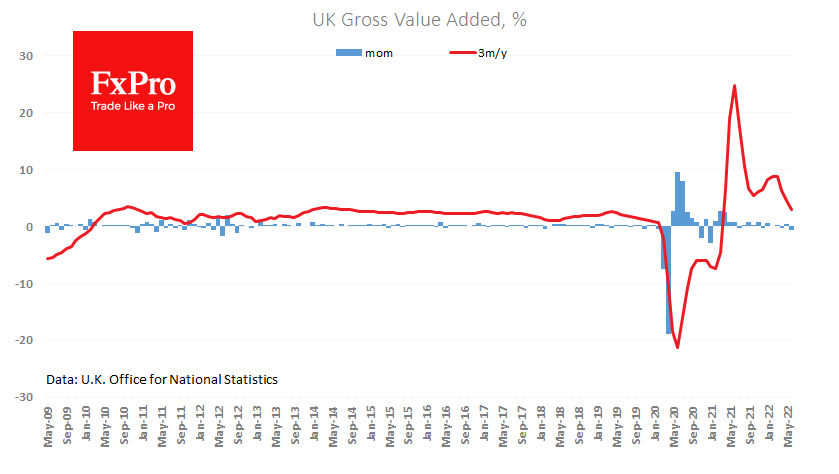
While this data is better than forecast, it is unlikely to inspire buyers of the pound or investors in the stock market. We see more market sensitivity to price data than the economy.
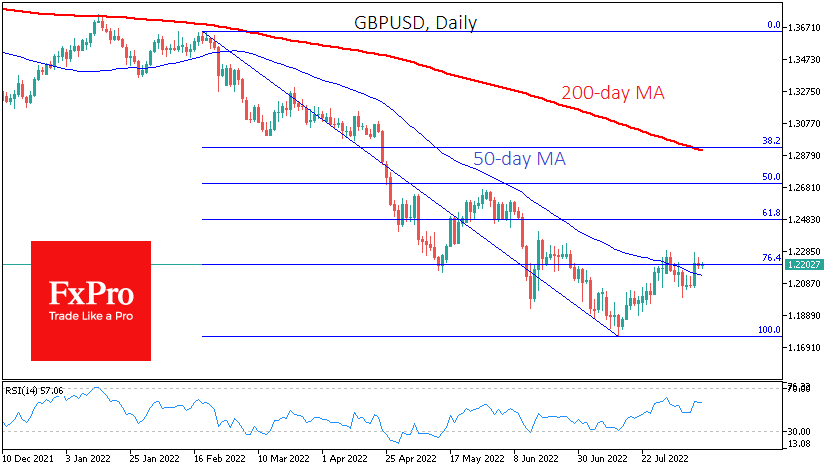
The GBPUSD is now struggling with downtrend resistance in the form of the 50-day moving average, trying to consolidate higher. On Wednesday, it formally succeeded, but the pound failed to develop the offensive, which might be the first worrying signal that the bears retain control of the markets.
Whether GBPUSD closes the day above 1.22 or below that mark may determine next week’s performance. An ability to stay near or rewrite the local highs would be a bullish signal, sending the sterling further into the 1.25-1.2650 range.
A close on a weak note or a move under 1.2140 would indicate that the recent rebound was only a temporary correction as part of a long-term downtrend. And in this case, GBPUSD could head down with an intermediate target below 1.2000 and a potential next target around 1.1800.
USDCAD Plummets But 200-Day SMA Caps Downside
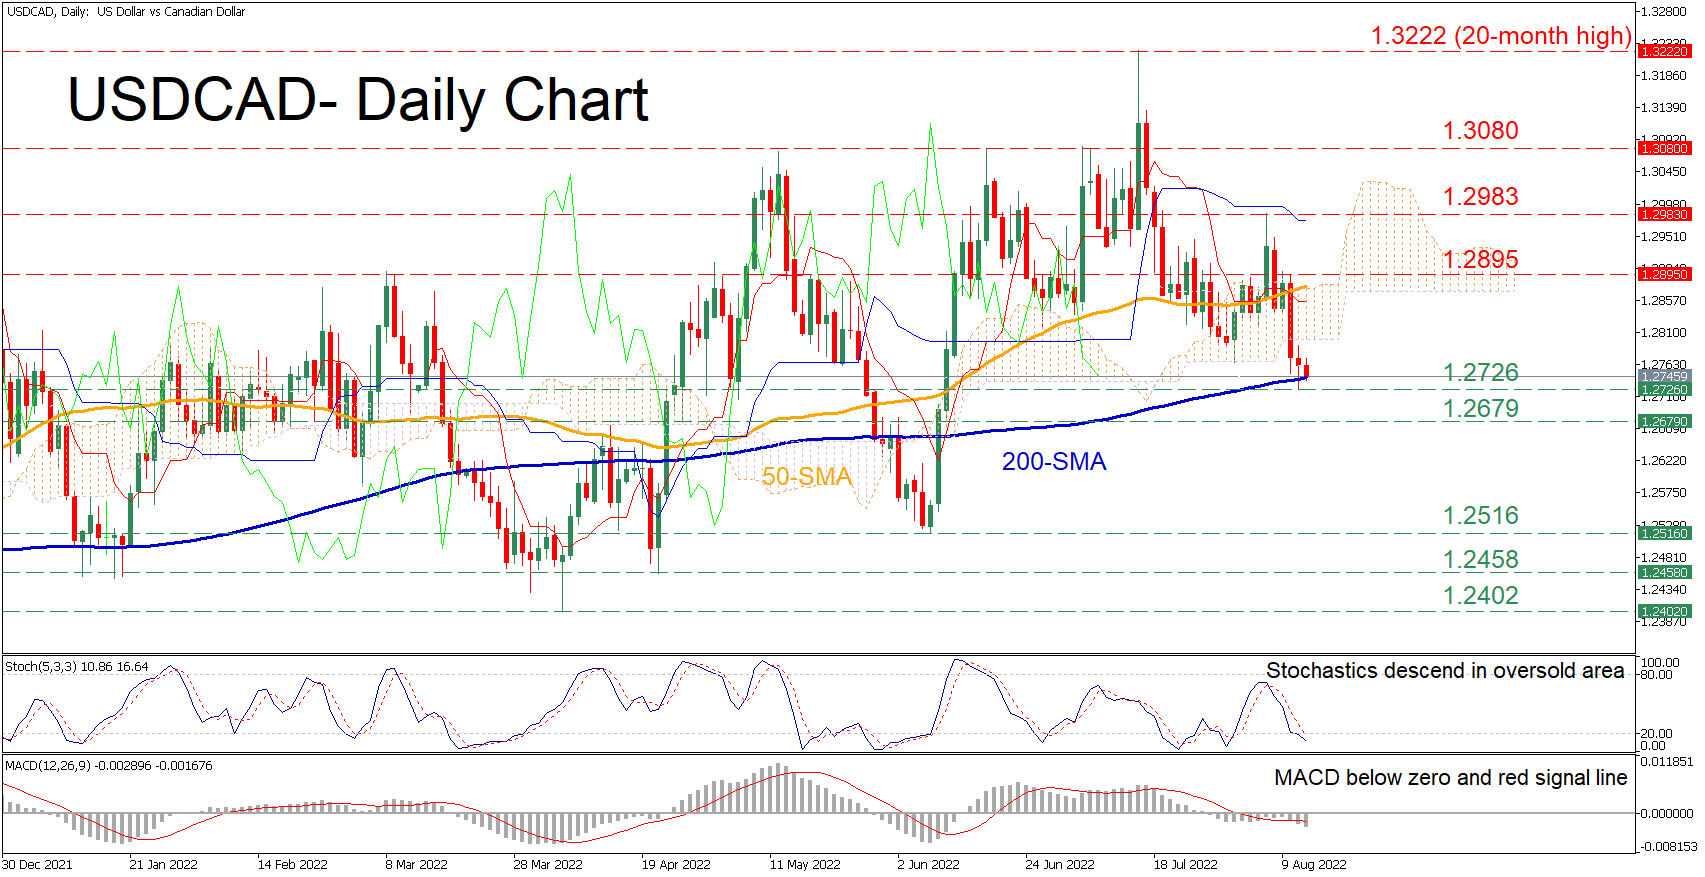
USDCAD has been losing ground in the short term since it peaked at the 20-month high of 1.3222 in mid-July. Moreover, in the last few sessions, the technical picture has deteriorated further, with the price crossing below both its 50-day simple moving average (SMA) and the Ichimoku cloud.
The momentum indicators are reflecting that the latest downside move could resume as near-term risks are tilted to the downside. Specifically, the stochastic oscillator is sloping downwards in the 20-oversold zone, while the MACD histogram is currently beneath both zero and its red signal line.
To the downside, should the price dive below crucial 200-day SMA, immediate support could be encountered at the recent low of 1.2726. Sliding beneath that floor, the 1.2679 barrier may come under examination before the pair challenges the June low of 1.2516. Any further price declines could then cease at the 1.2458 hurdle.
Alternatively, bullish actions might meet initial resistance at the 1.2895 region. Conquering this barricade, the bulls could aim for the recent peak of 1.2983. Failing to stop there, the price could ascend towards 1.3080 or higher to test the 20-month high of 1.3222.
In brief, even though USDCAD has been experiencing a sharp decline, the 200-day SMA appears to be acting as a strong floor. Hence, a violation of the latter could accelerate the downfall.