Sample Category Title
OPEC Monthly Report: Does it Mean Crude is Coming Down?
Yesterday, OPEC and the IEA provided their monthly reports on the oil industry. What got quite a bit of headlines was OPEC's forecast that crude demand would decrease during the remainder of the year. With both Brent and WTI below the $100/bbl mark, does this mean triple digit crude prices are a thing of the past?
Not necessarily, because the IEA and OPEC are somewhat contradicting themselves in their reports. While OPEC cut its outlook for demand, the IEA raised its outlook. So, who's right? Well, it could have more to do with the initial assessment and converging on a realistic number. And that's rather important, because it appears to coincide with expected supply, even with OPEC raising production.
Where this is going
The IEA had a more pessimistic outlook for crude demand this year, setting it at 99M bpd, while OPEC had a more optimistic assessment of over 101M bpd. Since then, however, both have been converging on the 100M bpd mark, with the IEA raising demand forecasts and OPEC lowering. But both agree in their forecast that production will be around 100.1M bpd.
Why the disagreement on one and agreement on the other? Because tracking production capacity is a lot easier. It's just a matter of counting all the wells and how much they produce. But how much people will decide to spend in a changing environment is a much harder thing to do. Furthermore, as the IEA noted in their report, there can be surprises. For example, Russian production has remained much higher than anticipated despite sanctions. Re-balancing shipments to take into account the sanctions appears to have been easier than anticipated, and happened quicker.
Figuring out the price direction
This has two implications for prices. One, the expectation for the price to fall once the infrastructure is set up for Russia to export around the sanctions might not pan out. Simply because is already managing to do that. And secondly, as Europe slowly weans itself off Russian supply, the potential for increasing price pressures might not materialize. This is because there appears to be more elasticity in global supply that allows for shifting demand.
Speaking of which, high prices are pushing down consumer demand. A study by the AAA in the US, for example, showed that most Americans are cutting back on their driving. So much, in fact, that demand for gasoline has slipped below to the levels it was in 2020 during the pandemic. American drivers are the largest group of crude products consumers in the world. And it's not just fuel prices that are keeping them from driving, a majority said they were shopping less, as well. Suggesting that higher inflation overall, and not just strictly higher fuel prices, is contributing to slowing demand.
So recession?
With the BOE warning of a recession, and the US having two quarters of negative growth by the White House insisting it isn't a recession, that could be the key to potentially crude continuing its downward trajectory. Daimler Trucks, for example, is already setting up for lowering energy consumption ahead of potential supply shortages in Europe during the winter. Meaning that supply interruptions might not necessarily lead to higher demand, but simply less consumption.
While demand might be waning, it still doesn't eliminate the possibility of a surprise on the supply side. Such as a rise in geopolitical tensions, or a natural event. So far, hurricanes in the Gulf of Mexico have been relatively scarce this year, but the season lasts for another four months.
USD/CAD Daily Outlook
Daily Pivots: (S1) 1.2728; (P) 1.2762; (R1) 1.2797; More...
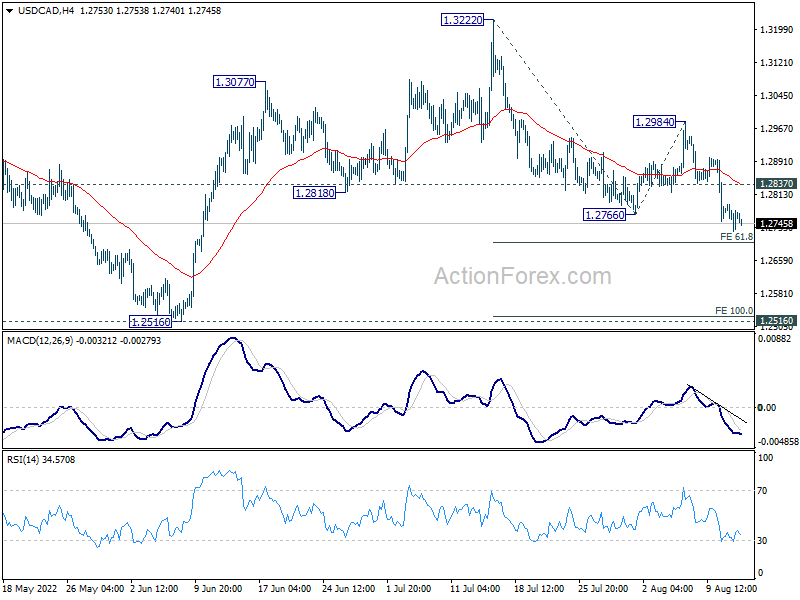
Intraday bias in USD/CAD stays on the downside. Fall from 1.3222 is in progress to 61.8% projection of 1.3222 to 1.2766 from 1.2984 at 1.2702. Firm break there will target 100% projection at 1.2528, which is close to 1.2516 key support. On the upside, above 1.2837 minor resistance will turn intraday bias neutral first. But further decline will remain in favor as long as 1.2984 resistance holds, in case of recovery.
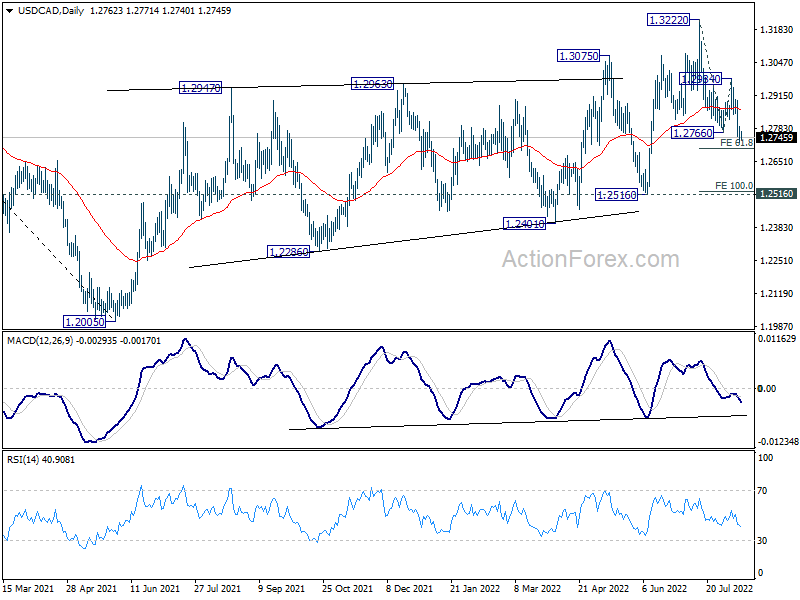
In the bigger picture, down trend from 1.4667 (2020 high) should have completed at 1.2005, after defending 1.2061 long term cluster support. Rise from there should target 61.8% retracement of 1.4667 to 1.2005 (2021 low) at 1.3650. This will remain the favored case now as long as 1.2516 support holds.
AUD/USD Daily Report
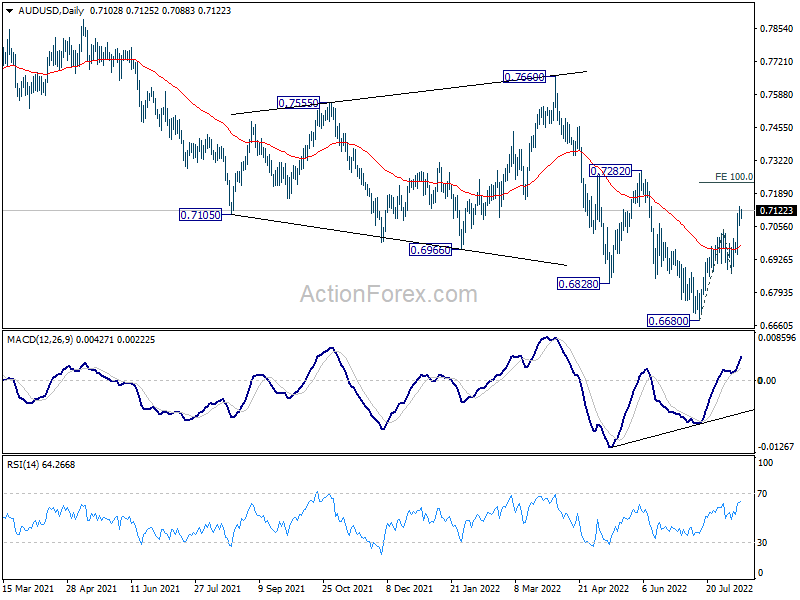
Daily Pivots: (S1) 0.7067; (P) 0.7102; (R1) 0.7141; More...
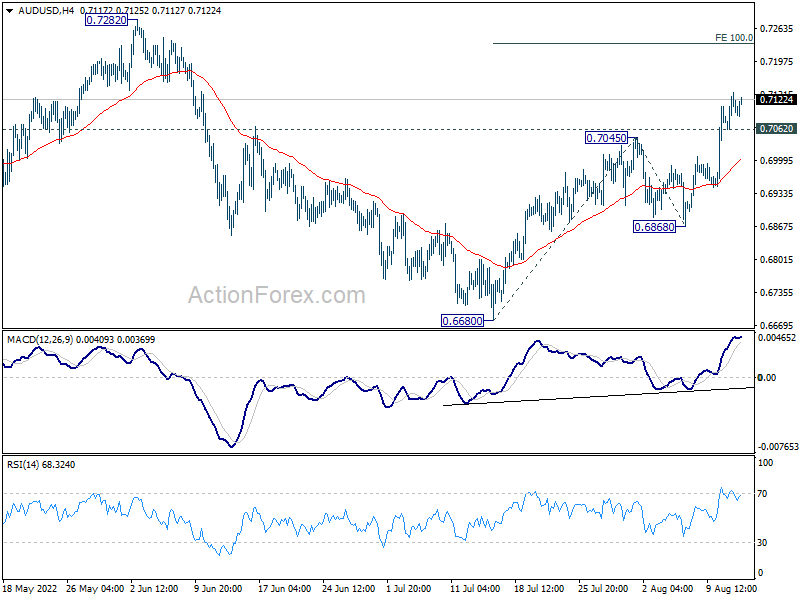
Intraday bias in AUD/USD stays on the upside as rise from 0.6680 is in progress. Next target is 100% projection of 0.6680 to 0.7045 from 0.6868 at 0.7233. On the downside, below 0.7062 minor support will turn intraday bias neutral first. But further rally will remain in favor as long as 0.6868 support holds, in case of retreat.
In the bigger picture, price actions from 0.8006 (2021 high) is seen more as a corrective pattern to rise from 0.5506 (2020 low). Or it could be a bearish impulsive move. In either case, outlook will remain bearish as long as 0.7282 resistance holds. Next target is 61.8% retracement of 0.5506 to 0.8006 at 0.6461.
EUR/USD Daily Outlook
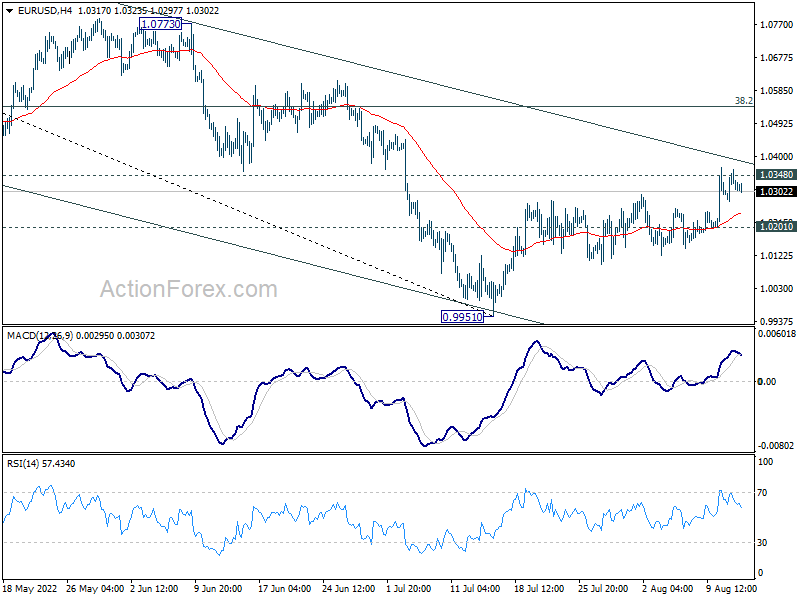
Daily Pivots: (S1) 1.0275; (P) 1.0320; (R1) 1.0363; More...
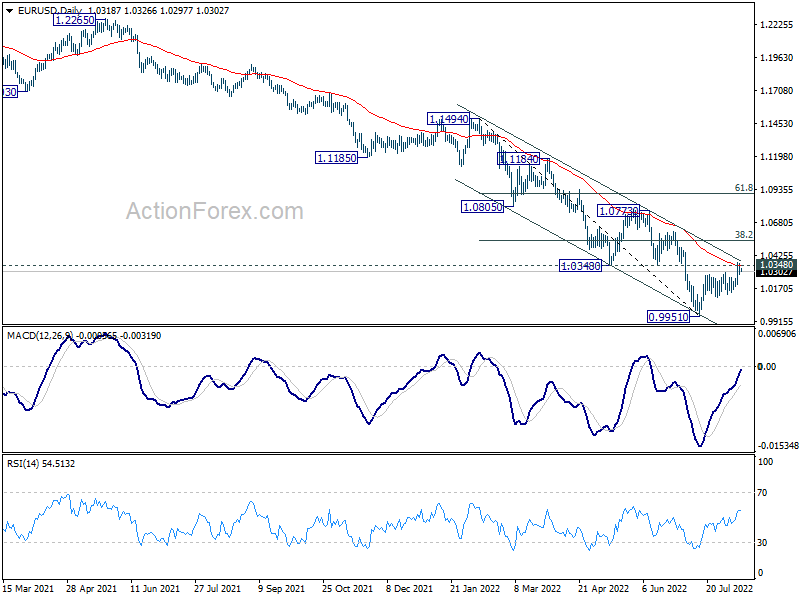
Intraday bias in EUR/USD is turned neutral, but focus stays on 1.0348 support turned resistance, which is close to 55 day EMA (now at 1.0346). Decisive break there argue that rally from 0.9951 is at least correcting the fall from 1.1494. Further rise should then be seen to 38.2% retracement of 1.1494 to 0.9951 at 1.0540. On the downside, break of 1.0201 minor support will suggest that such rebound has completed and bring retest of 0.9951 low instead.
In the bigger picture, down trend from 1.6039 (2008 high) is still in progress. Next target is 100% projection of 1.3993 to 1.0339 from 1.2348 at 0.8694. In any case, outlook will stay bearish as long as 1.0773 resistance holds, in case of strong rebound.
GBP/USD Daily Outlook
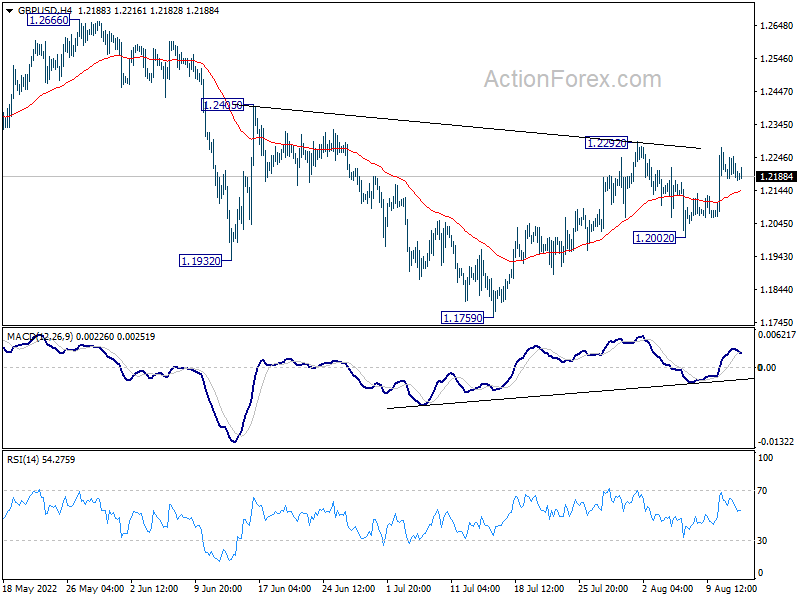
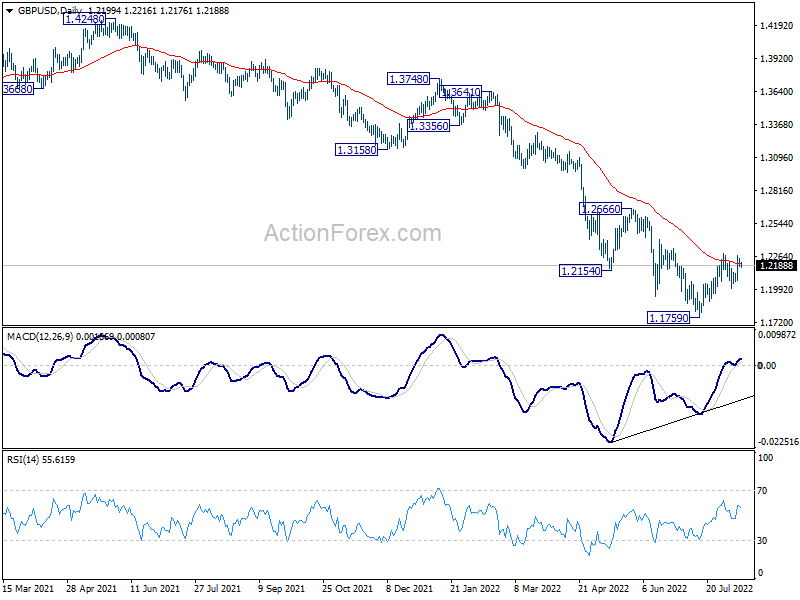
Daily Pivots: (S1) 1.2173; (P) 1.2212; (R1) 1.2240; More...
Range trading continues in GBP/USD and intraday bias remains neutral. On the upside, decisive break of 1.2292 resistance will complete a head and shoulder bottom pattern (ls: 1.1932; h: 1.1769; rs: 1.2002). Further rally should then be seen to 1.2666 key resistance next. On the downside, however, break of 1.2002 will bring deeper fall back to retest 1.1759 low.
In the bigger picture, fall from 1.4248 (2018 high) could be a leg inside the pattern from 1.1409 (2020 low), or resuming the longer term down trend. Deeper decline is expected as long as 1.2666 resistance holds. Next target is 1.1409 low. However, firm break of 1.2666 will bring stronger rise back to 55 week EMA (now at 1.2925).
USD/CHF Daily Outlook
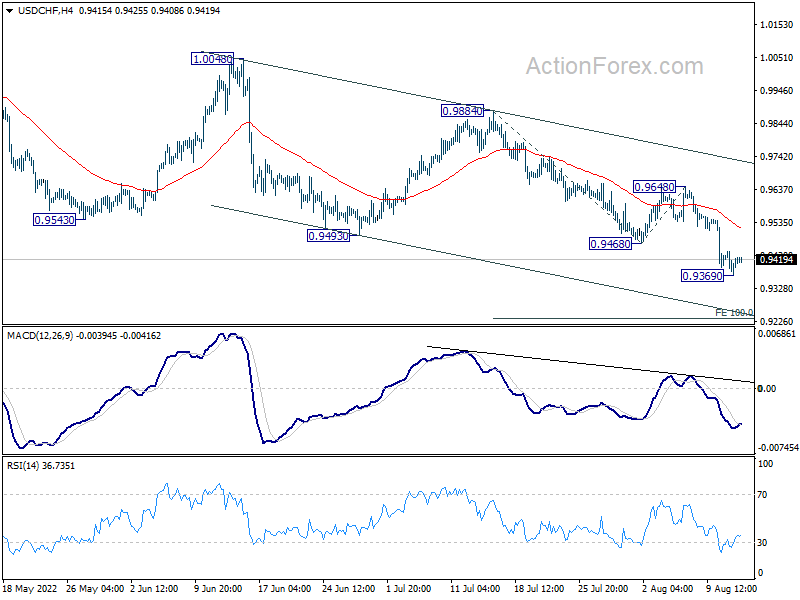
Daily Pivots: (S1) 0.9366; (P) 0.9455; (R1) 0.9517; More...
A temporary low is formed at 0.9369 in USD/CHF and intraday bias is turned neutral for some consolidations. Upside of recovery should be limited below 0.9648 resistance to bring another decline. Break of 0.9369 will resume larger fall to 100% projection of 0.9884 to 0.9468 from 0.9648 at 0.9232.
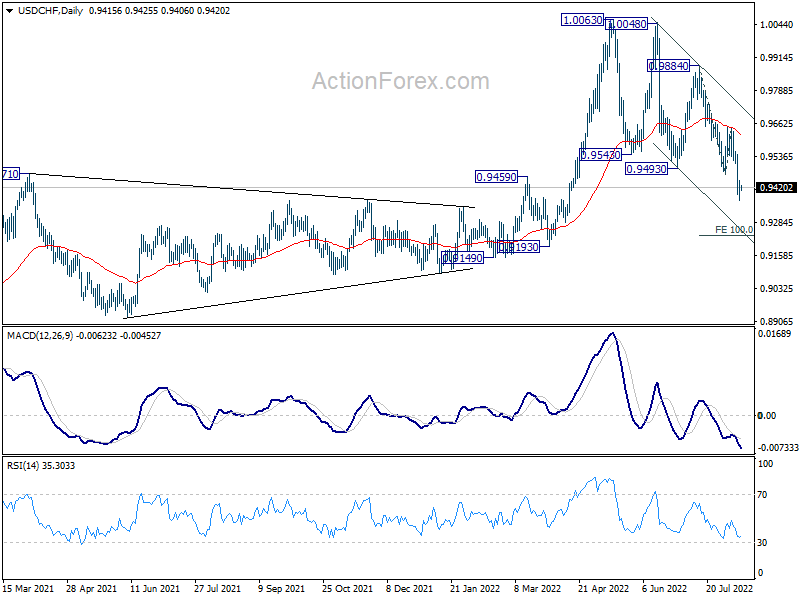
In the bigger picture, break of 0.9471 support turned resistance argues that medium term up trend from 0.8756 has completed with three waves up to 1.0063. Long term sideway pattern might have started another falling leg. Deeper decline would now be in favor as long as 0.9648 resistance holds, to 0.9149 structural support. Sustained break there could pave the way back to 0.8756.
FOMO into Cryptocurrencies Not Coming Back Anytime Soon
Market picture
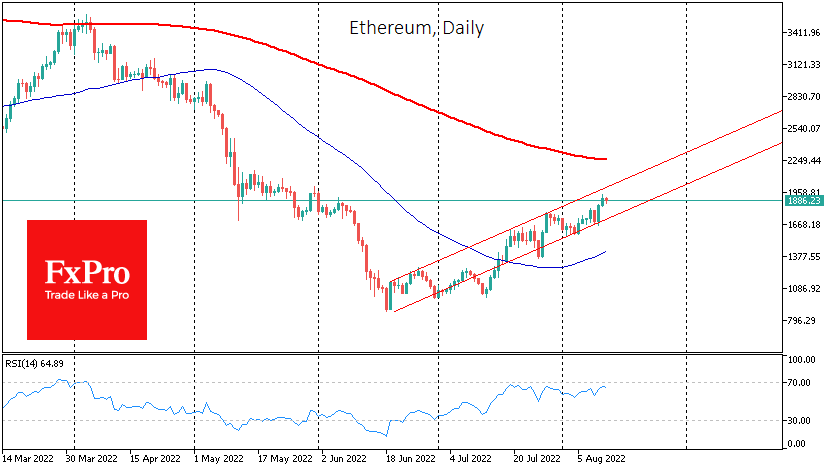
Bitcoin rose close to $25K on Thursday but failed to hold on to those heights, pulling back precisely to $24K on Friday morning and losing 2.4% overnight. Ethereum continues to outperform the market, losing 0.2% to $1900. Other top altcoins are losing between 1.5% (XRP, Dogecoin) and 3% (Polkadot).
Total crypto market capitalisation, according to CoinMarketCap, fell 1.4% to $1.15 trillion overnight.
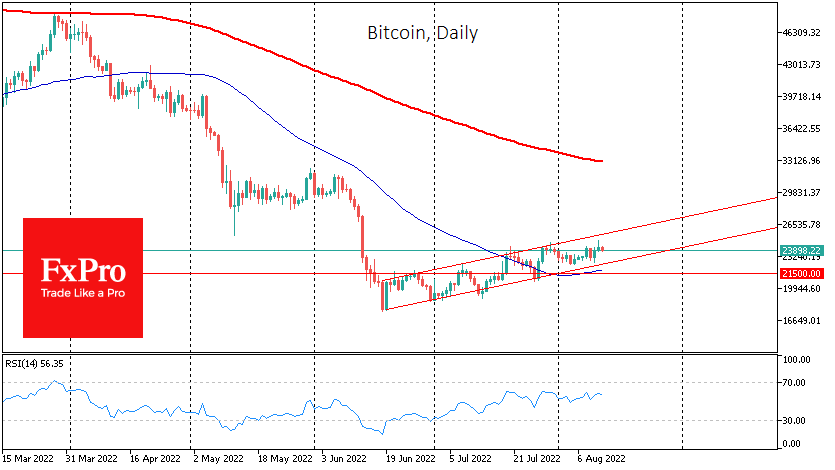
Bitcoin failed to accelerate its rise on Thursday, rewriting two-month highs but failing to hold on to them. This bullish indecision was probably linked to a similar pullback in US stock markets, where buyers are also very timid and unsure.
Investors and traders should prepare themselves that the market will stick to such a pattern in the coming months, and the recovery trend will bear little resemblance to the FOMO-filled rallies rattling the crypto market.
Instead, it will be a period of foundation work, during which the market, stripped of its easy money, will leave the most talented and passionate enthusiasts. They see cryptocurrencies as more than just easy money and hype.
News background
In this regard, many eyes are on Ethereum, where developers have announced the successful migration of the third and largest Goerli test network to the PoS algorithm. The next step will be the merger of the core network, scheduled for September.
The world’s largest investment firm, BlackRock, has launched its first bitcoin-based product targeting institutional clients. It sounds encouraging, but so far, it is difficult to isolate any net positive effect in quotes.
At the same time, regulatory pressure on the industry is intensifying. Coinbase has reported that the US Securities and Exchange Commission (SEC) sought through the courts’ information on listing the company’s crypto-assets and proprietary products.
The UN Conference on Trade and Development (UNCTAD) called on world governments to impose additional taxes on cryptocurrency transactions and restrict their advertising.
The CFTC and SEC have proposed requiring significant cryptocurrency hedge funds with more than $500 million in assets under management to report risks associated with digital assets.
Daily Technical Analysis
EUR/USD
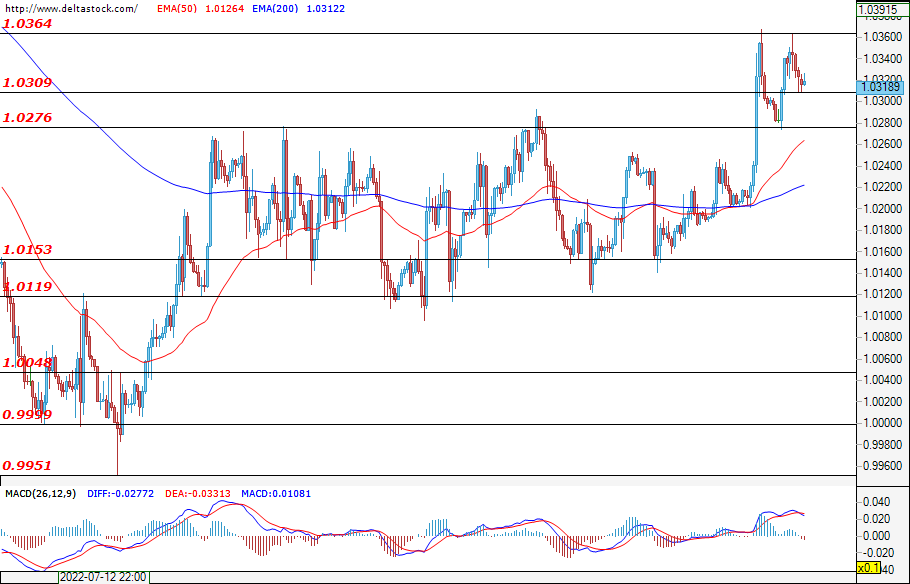
On Thursday this week, the single European currency was moving erratically. The day started low, but at the European open, the bulls took control and reached the same price as Wednesday, namely 1.0364. The reaction of the bears after the release of the U.S. manufacturing inflation data was swift and they brought the currency down from its double top and so the market closed at around 1.0317. Today, between 6:45 and 09:00 GMT, we will see a set of data that may give the euro a clear direction. Whether Tuesday's move will be further corrected or if we see a new wave of uptrend movements will depend on traders' reaction to today's data.
USD/JPY
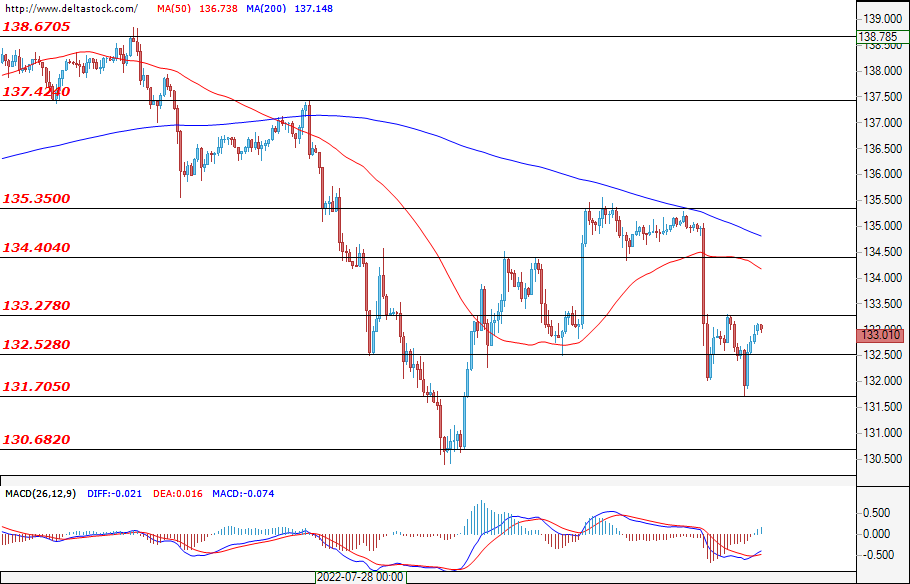
The Ninja is still hesitant about which direction to take after several extremely volatile trading sessions. In the early hours, we saw attempts to breach the key 133.27 level, but the bulls gave up, and in the next few hours, we saw a bottom deeper than the one reached yesterday. The price of 131.70 played the role of support and the USD/JPY managed to end the day with a bounce of nearly 30 pips from the mentioned bottom. Today, the data at 14:00 GMT on the current state of consumer sentiment in the U.S. may have an effect on the currency pair. Whether the corrections will deepen or if we will see a reversal of the trend remains to be seen.
GBP/USD
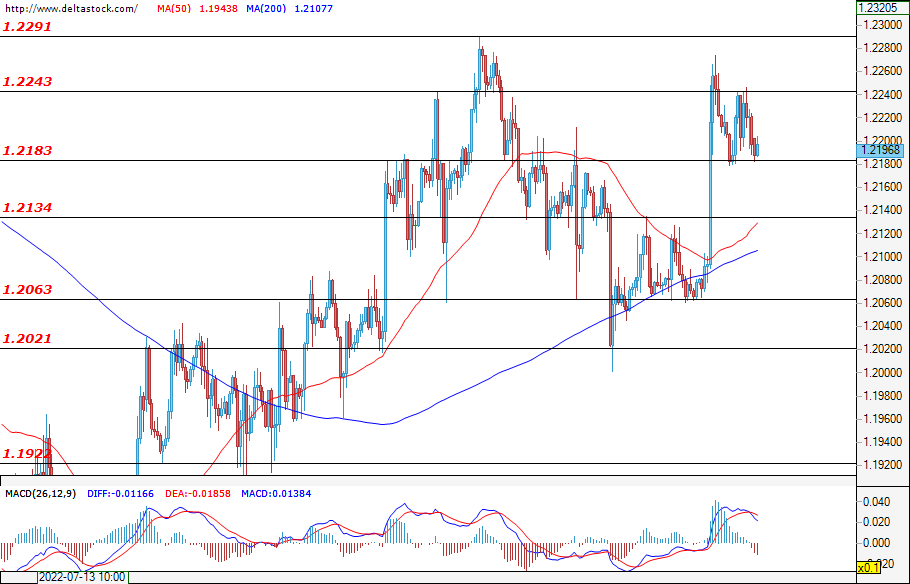
Yesterday, the Cable’s situation was akin to that of the euro. It started low, followed by a bull attack, but after reaching the 1.2243 resistance, the pair began moving in a narrow 40-pip range. We saw some slight buying at the 1.2183 levels, but everyone seems to be holding their breath as they await today’s data releases. At 6:00 GMT, we'll gain more insights into the UK gross domestic product on a monthly basis, as well as the preliminary count of quarterly GDP. Along with this, we also expect a report showing whether the production slowdown is continuing or deepening. If the results are negative, then the probability of the GBP/USD going down would be high because of the political crisis on the island and the lack of clarity about who will take over the role of Boris Johnson.
EUGERMANY40
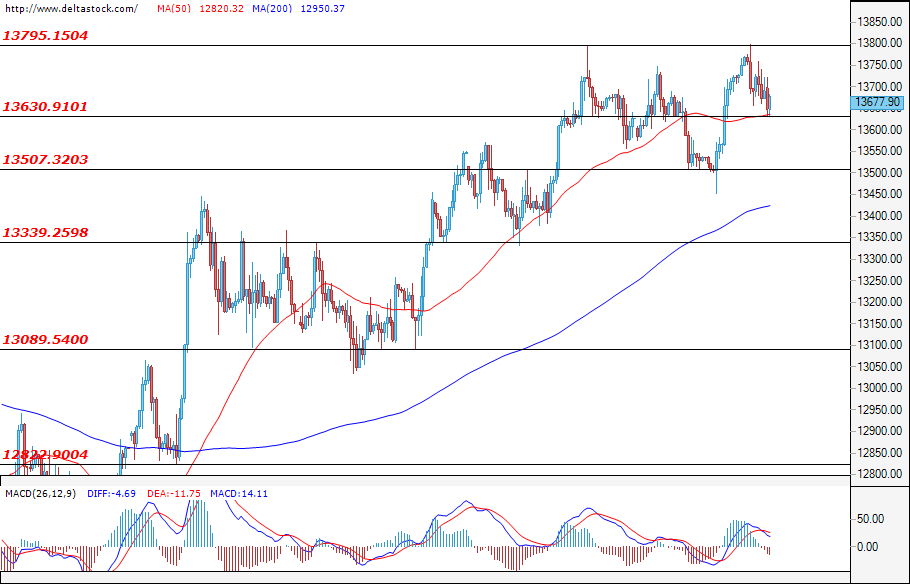
Yesterday, with the opening of the European session, we saw a failed second attempt to breach last week's level of 13795. This, of course, denied the bulls a follow-up attack, and by the end of the day, the German index was under the firm grasp of the bears and headed back to the key prices at around 13630, where the day ended. Whether the EUGERMANY40 will be able to secure a new monthly high will depend on whether we will see a successful breakout of the abovementioned level. A deepening of the correction should not be ruled out as well because of the still ongoing energy crisis in the EU.
US30
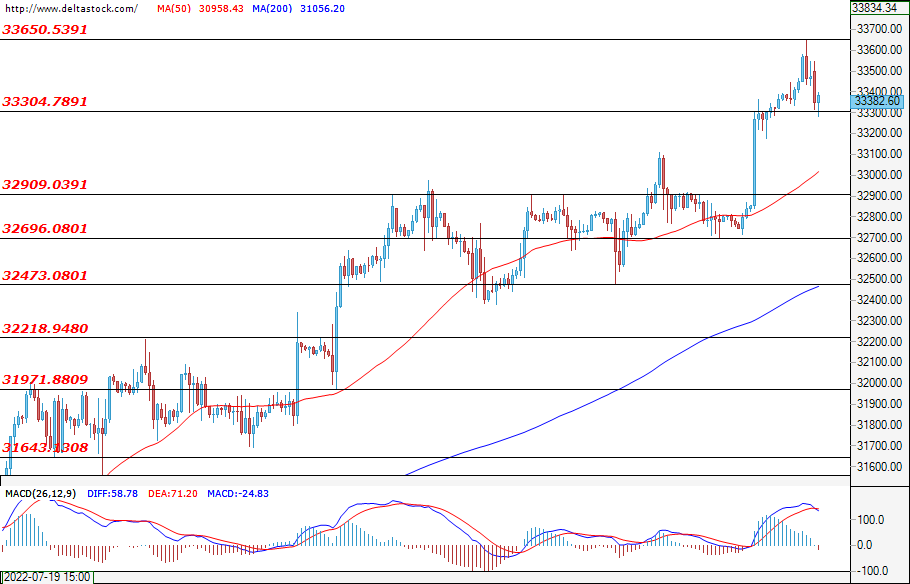
In the European session, the blue-chip index moved in a convincing uptrend and managed to reach a new monthly and weekly high of 33650. When Wall Street opened at 13:30 GMT, the bears found a good entry point at this price and took control of the index by the end of the day. They managed to get it back to 33300, where the index found support. Given the weakening of the dollar this week, it is fully expected to see an increase in the U.S. indices’ prices. The likelihood of this trend continuing will depend on the reaction to the current state of the U.S. consumer sentiment for the month of July due today at 14:00 GMT.
S&P 500 Pulls Lower
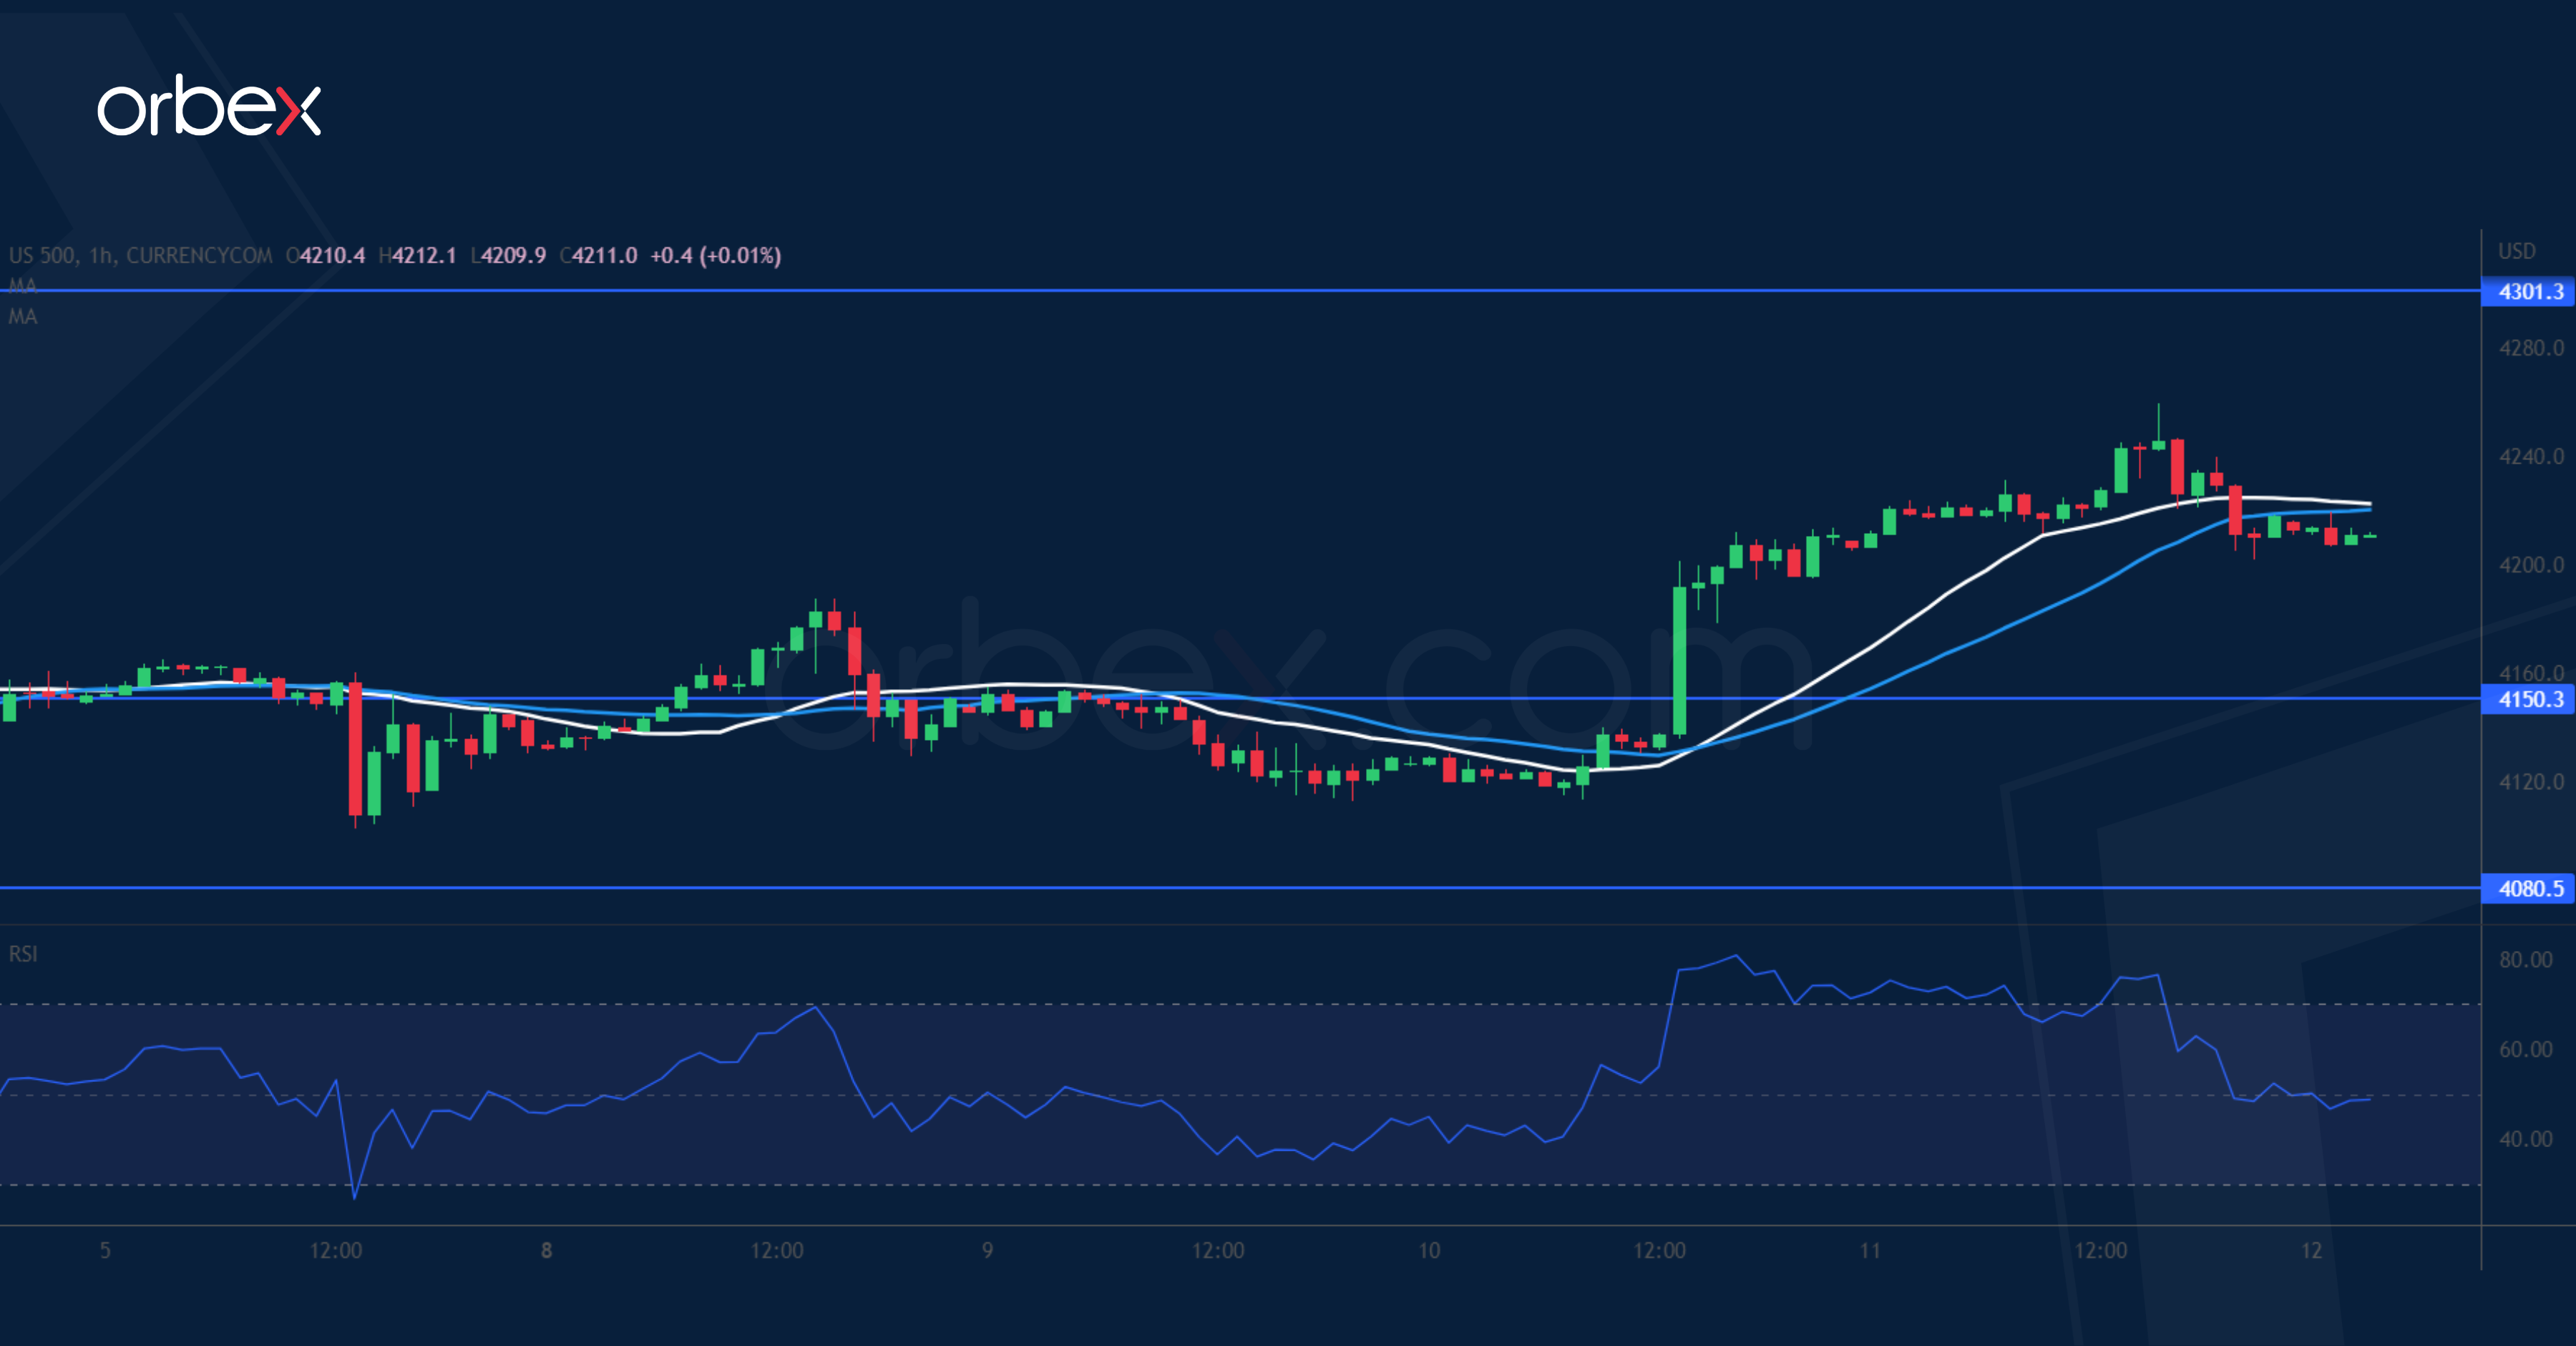
The S&P 500 falls back over concerns that inflation is yet to peak. Divergence between the 20 and 30-day moving averages indicates an acceleration to the upside. The current recovery may have gained traction after a break above June’s peak at 4200. Along with medium-term bears rushing to avoid a squeeze, momentum buying may continue to support the index. May’s high at 4300 would be the next target. An overbought RSI may cause a limited pullback, If this occurs, 4150 is a new support level.
EUR/GBP Tests Resistance
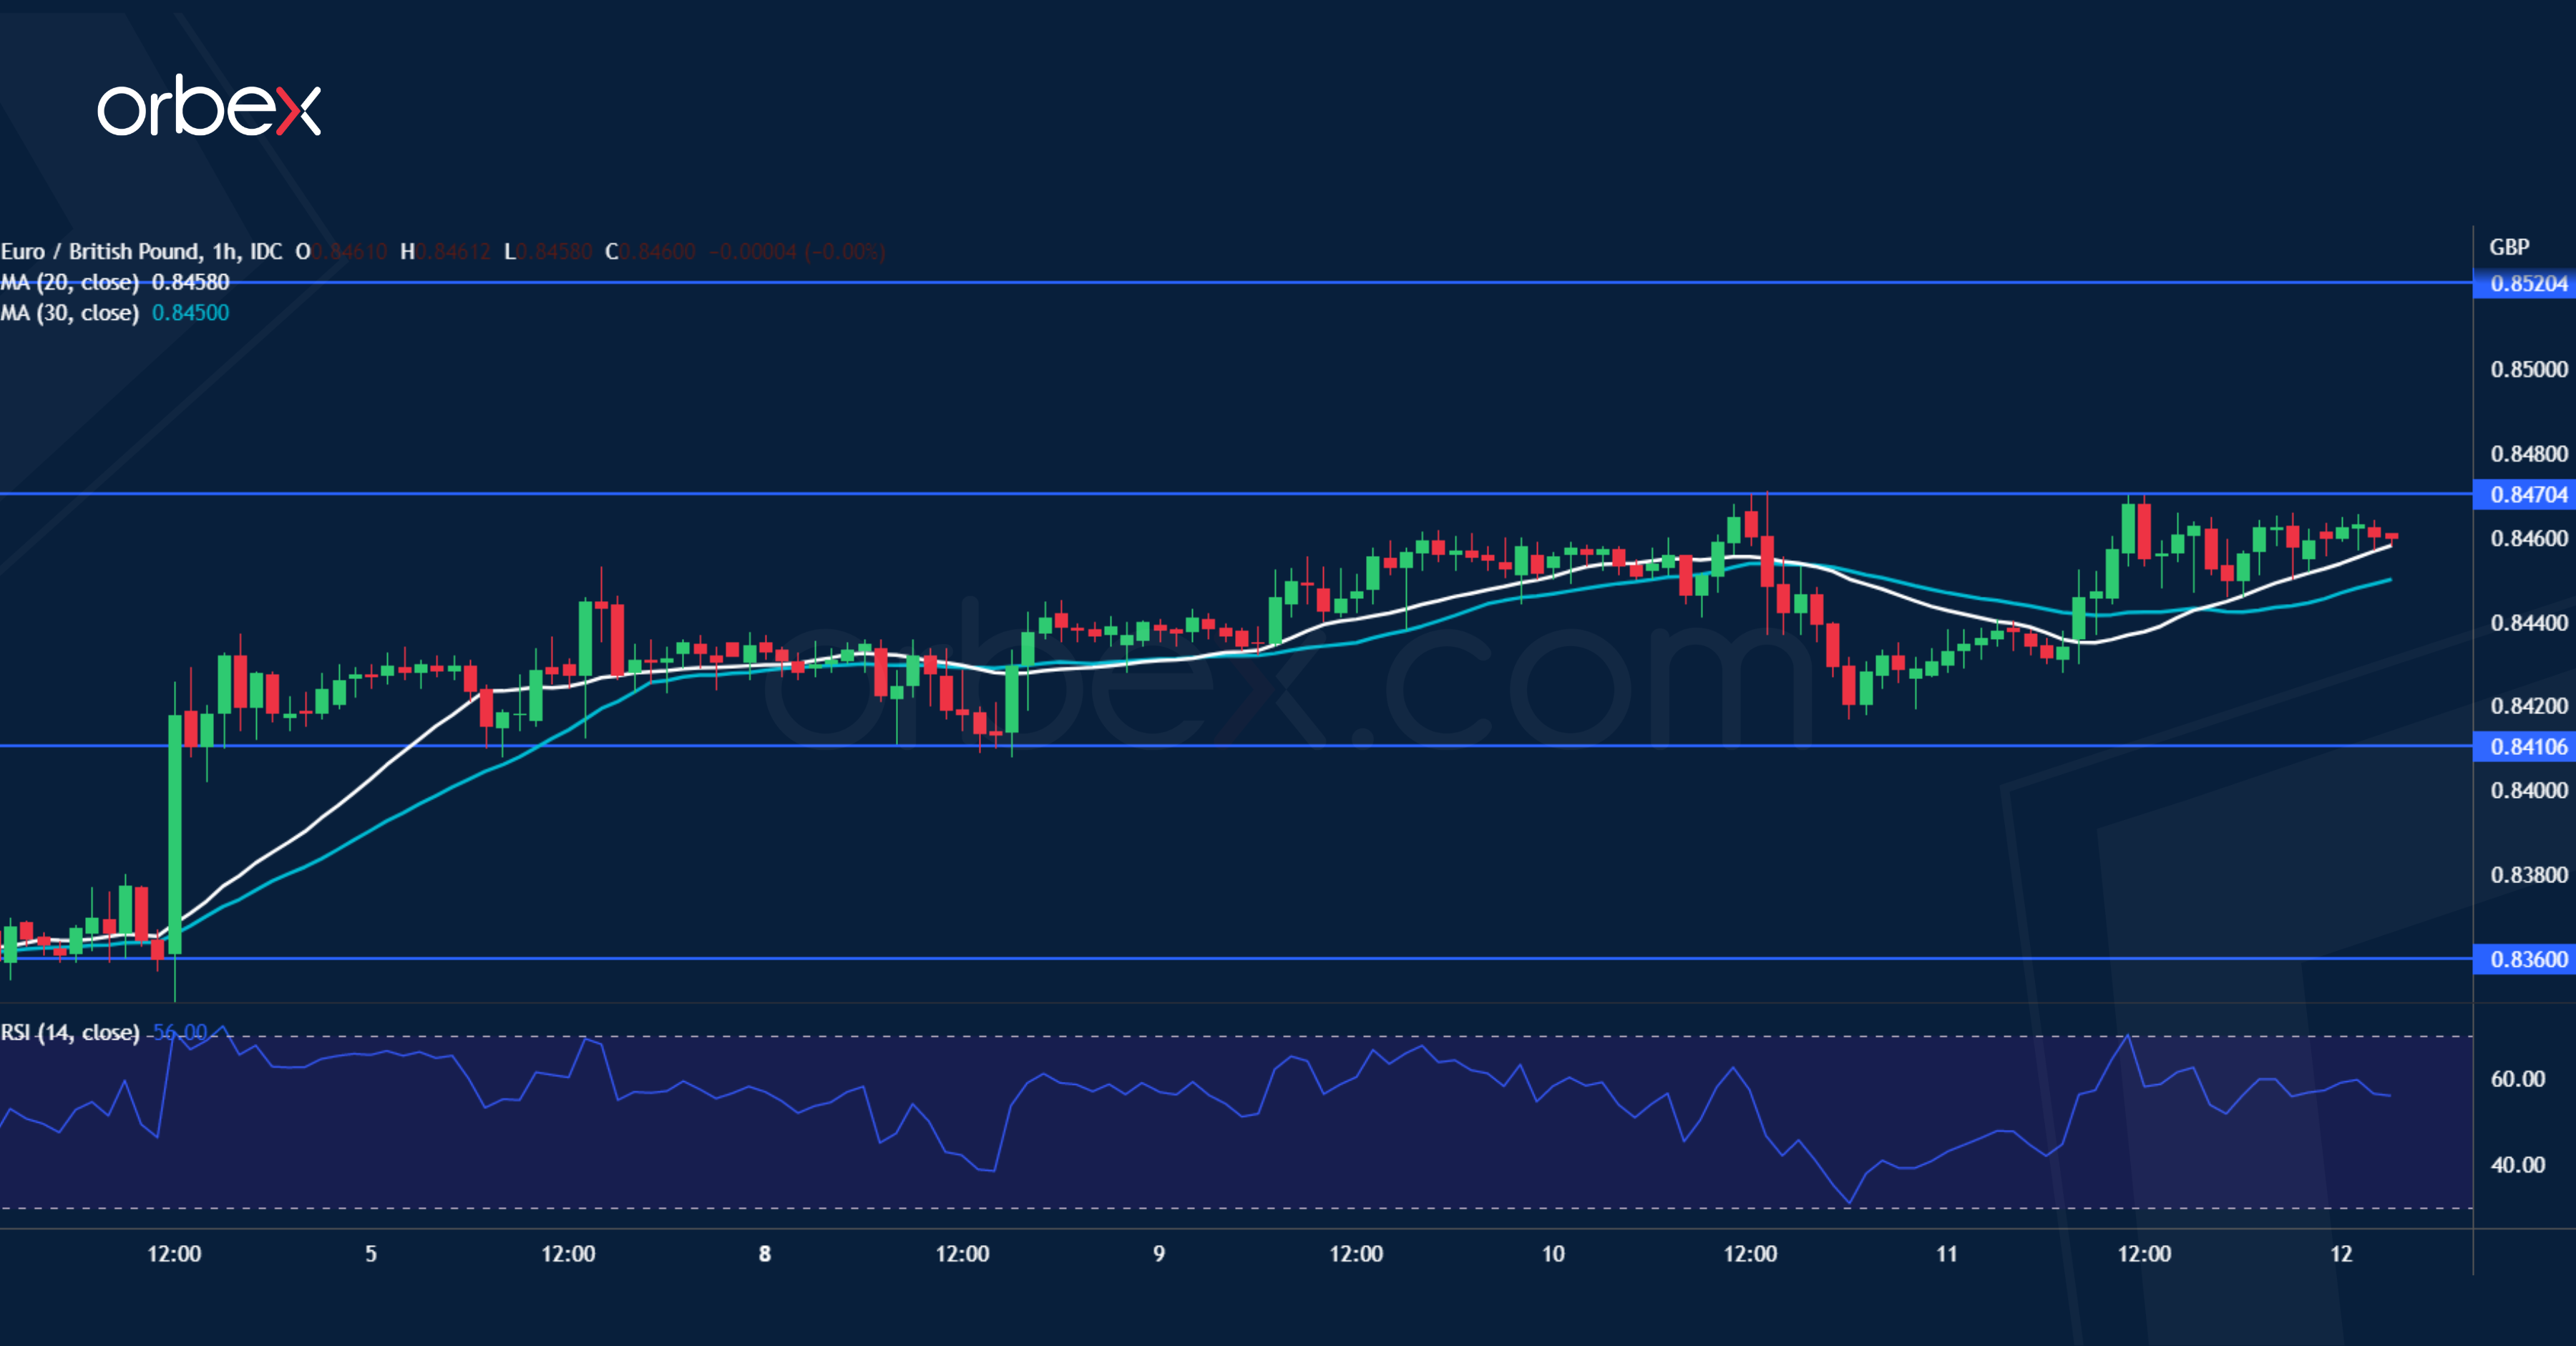
Sterling treads water as the market expects a contraction in the UK’s Q2 GDP. The latest rebound came under pressure near the support-turned-resistance at 0.8470 which sits on the 30-day moving average. A bounce off 0.8410 showed solid interest in keeping the single currency afloat. A close above 0.8470 would send the pair to 0.8520 where a breakout could prompt more sellers to cover their bets, laying the groundwork for a rally to June’ highs next to 0.8580. 0.8410 is the first support in case of hesitation.