Sample Category Title
GBP/AUD breaks out from medium term range, EUR/AUD to follow
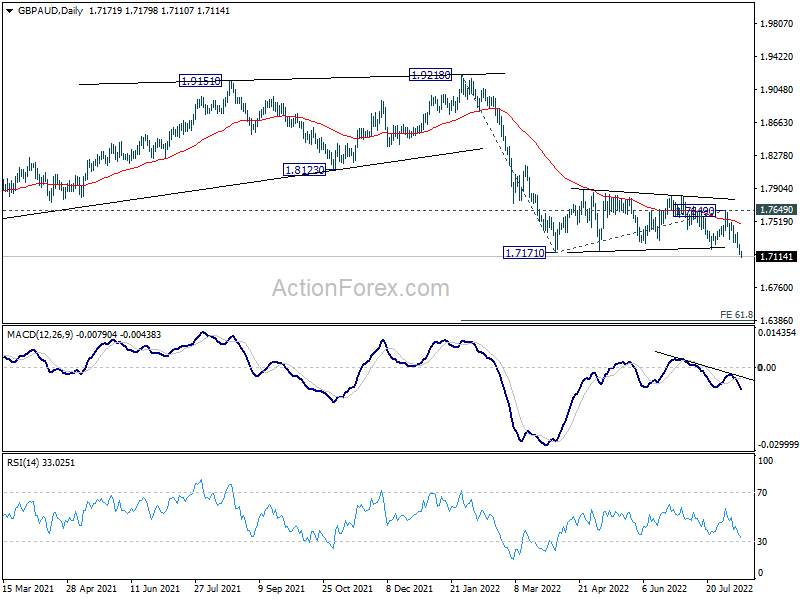
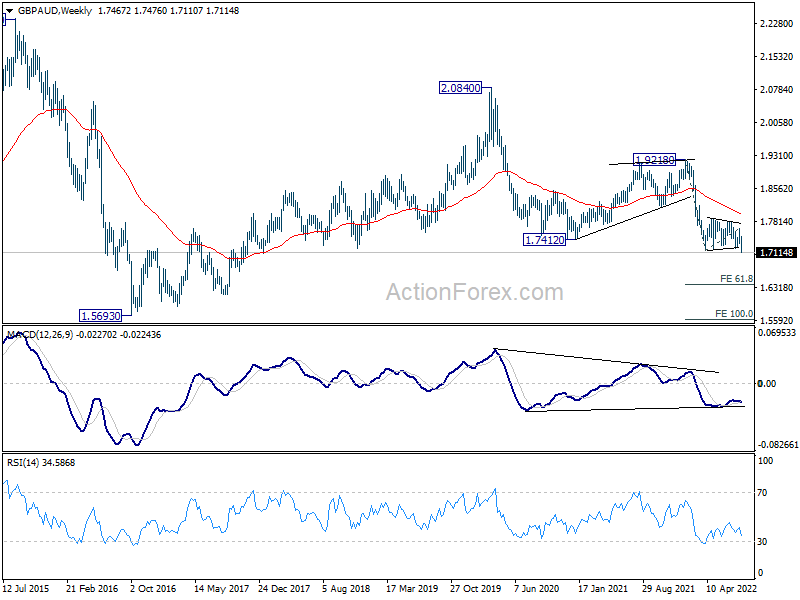
GBP/AUD finally broke out from medium term consolidation and resume down trend this week. EUR/AUD is also following and look ready for down trend resumption too. The development came as commodity currencies generally responded better to receding expectation of another 75bps Fed hike, than European majors.
GBP/AUD's fall is seen as part of the down trend from 1.9218, as well as that from 2.0840 (2020 high). Both near term and medium term bearishness are maintained well with the cross capped by falling 55 day and 55 week EMA. Next target is 61.8% projection of 1.9218 to 1.7171 from 1.7649 at 1.6384.
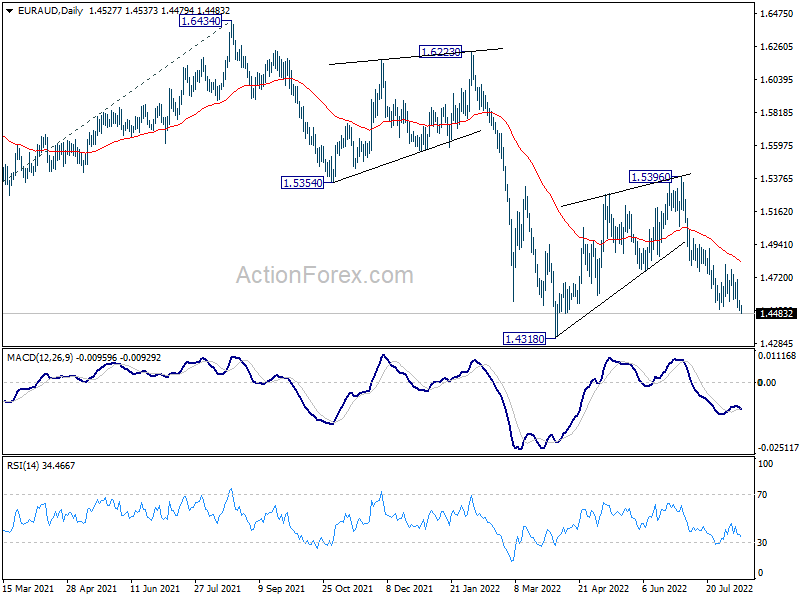
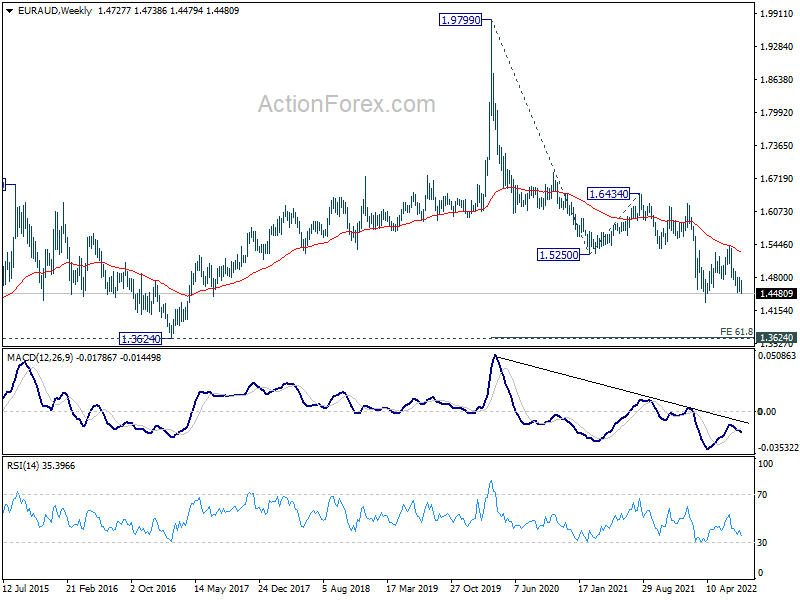
EUR/AUD also resumed the fall from 1.5396 through 1.4580 support. It's now targeting 1.4318 low (corresponding to GBP/AUD's 1.7171 support). Firm break there will resume whole down trend from 1.9799 (2020 high), and target 61.8% projection of 1.9799 to 1.5250 from 1.6434 at 1.3623, which is close to 1.3624 long term support (2017 low).
Fed Daly: 50bps is the case for Sep FOMC meeting
San Francisco Fed President Mary Daly told Bloomberg TV overnight that 50bps rate hike "is the case" for September FOMC meeting. But added, "I am open to 75 should the data evolve differently."
Daly didn't expect rate cuts to quickly follow the current tightening cycle once inflation is conquered. "I don't see this hump-shaped part where we raise interest rates to really high rates and then bring them down," she said. "I think of raising them to a level that we think is going to be appropriate and then holding them there."
Technical Outlook and Review
USD/JPY:
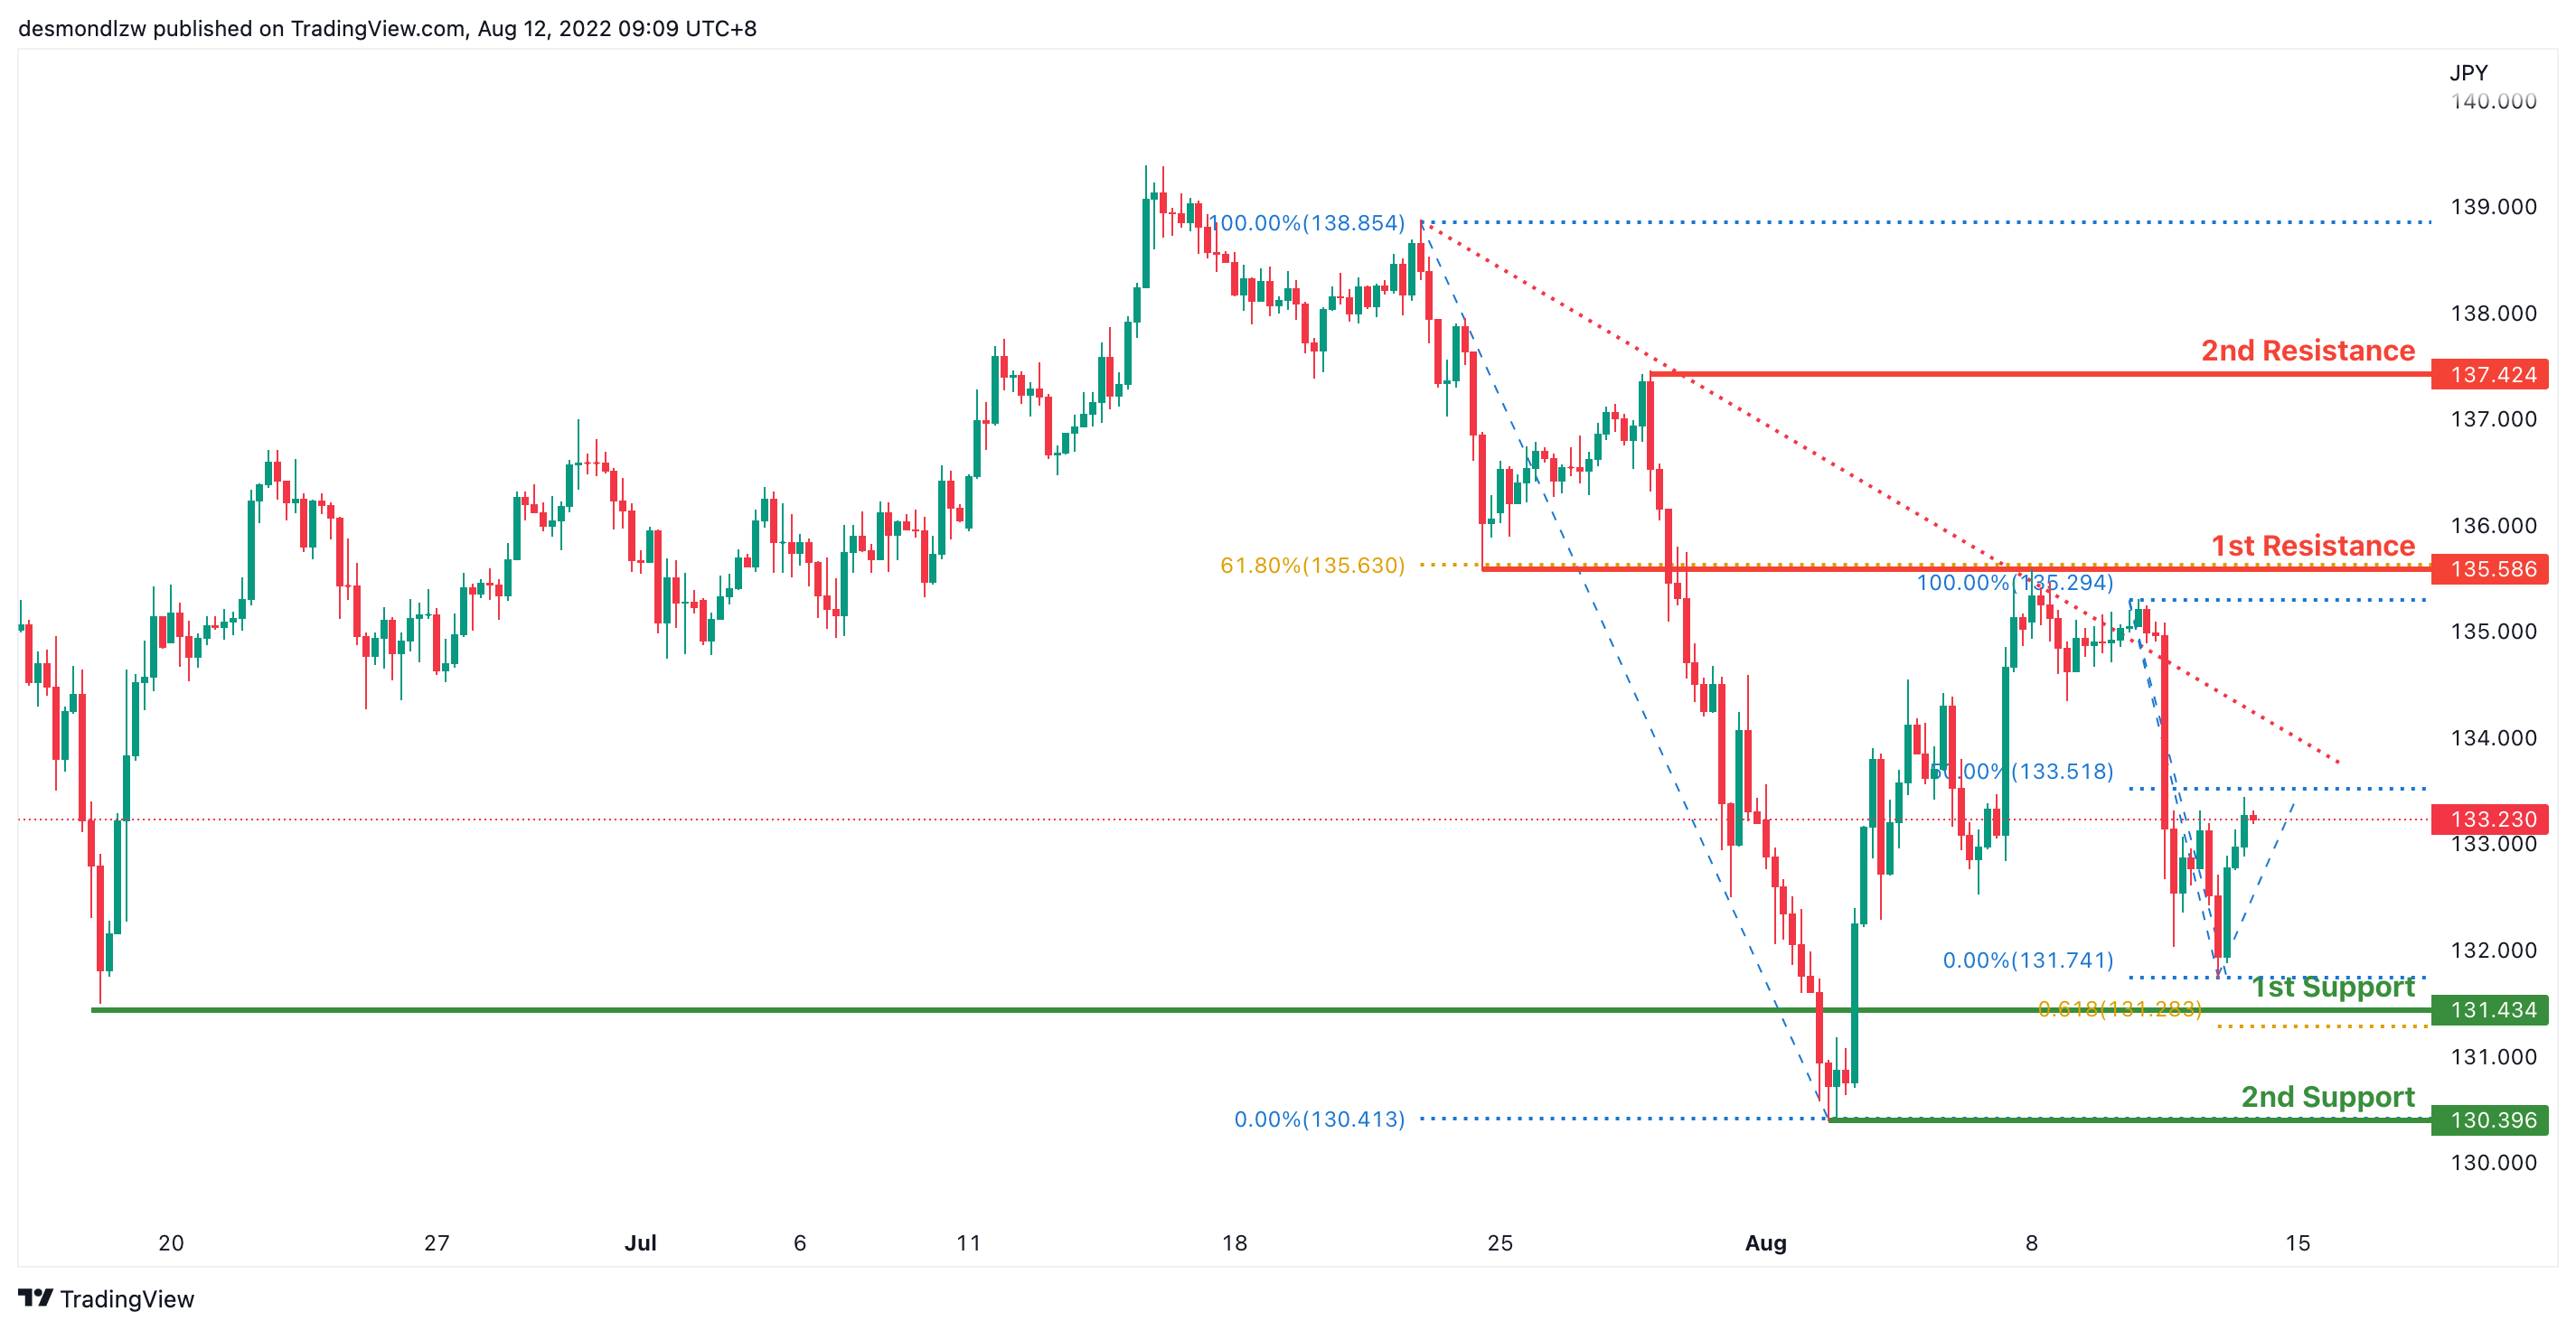
On the H4, prices are still respecting the descending trend and are testing the 50% fibonacci retracement. If prices continues with the bearish momentum, we are looking at price pulling back to test at the first support 131.434 where the fibonacci projection as well as the previous swing low sits. If prices goes into a bullish momentum, we are expecting prices to test at the first resistance 135.586 where the 61.8% fibonacci retracement sits.
Areas of consideration:
- H4 time frame, 1st resistance at 135.586
- H4 time frame, 1st support at 131.434
DXY:
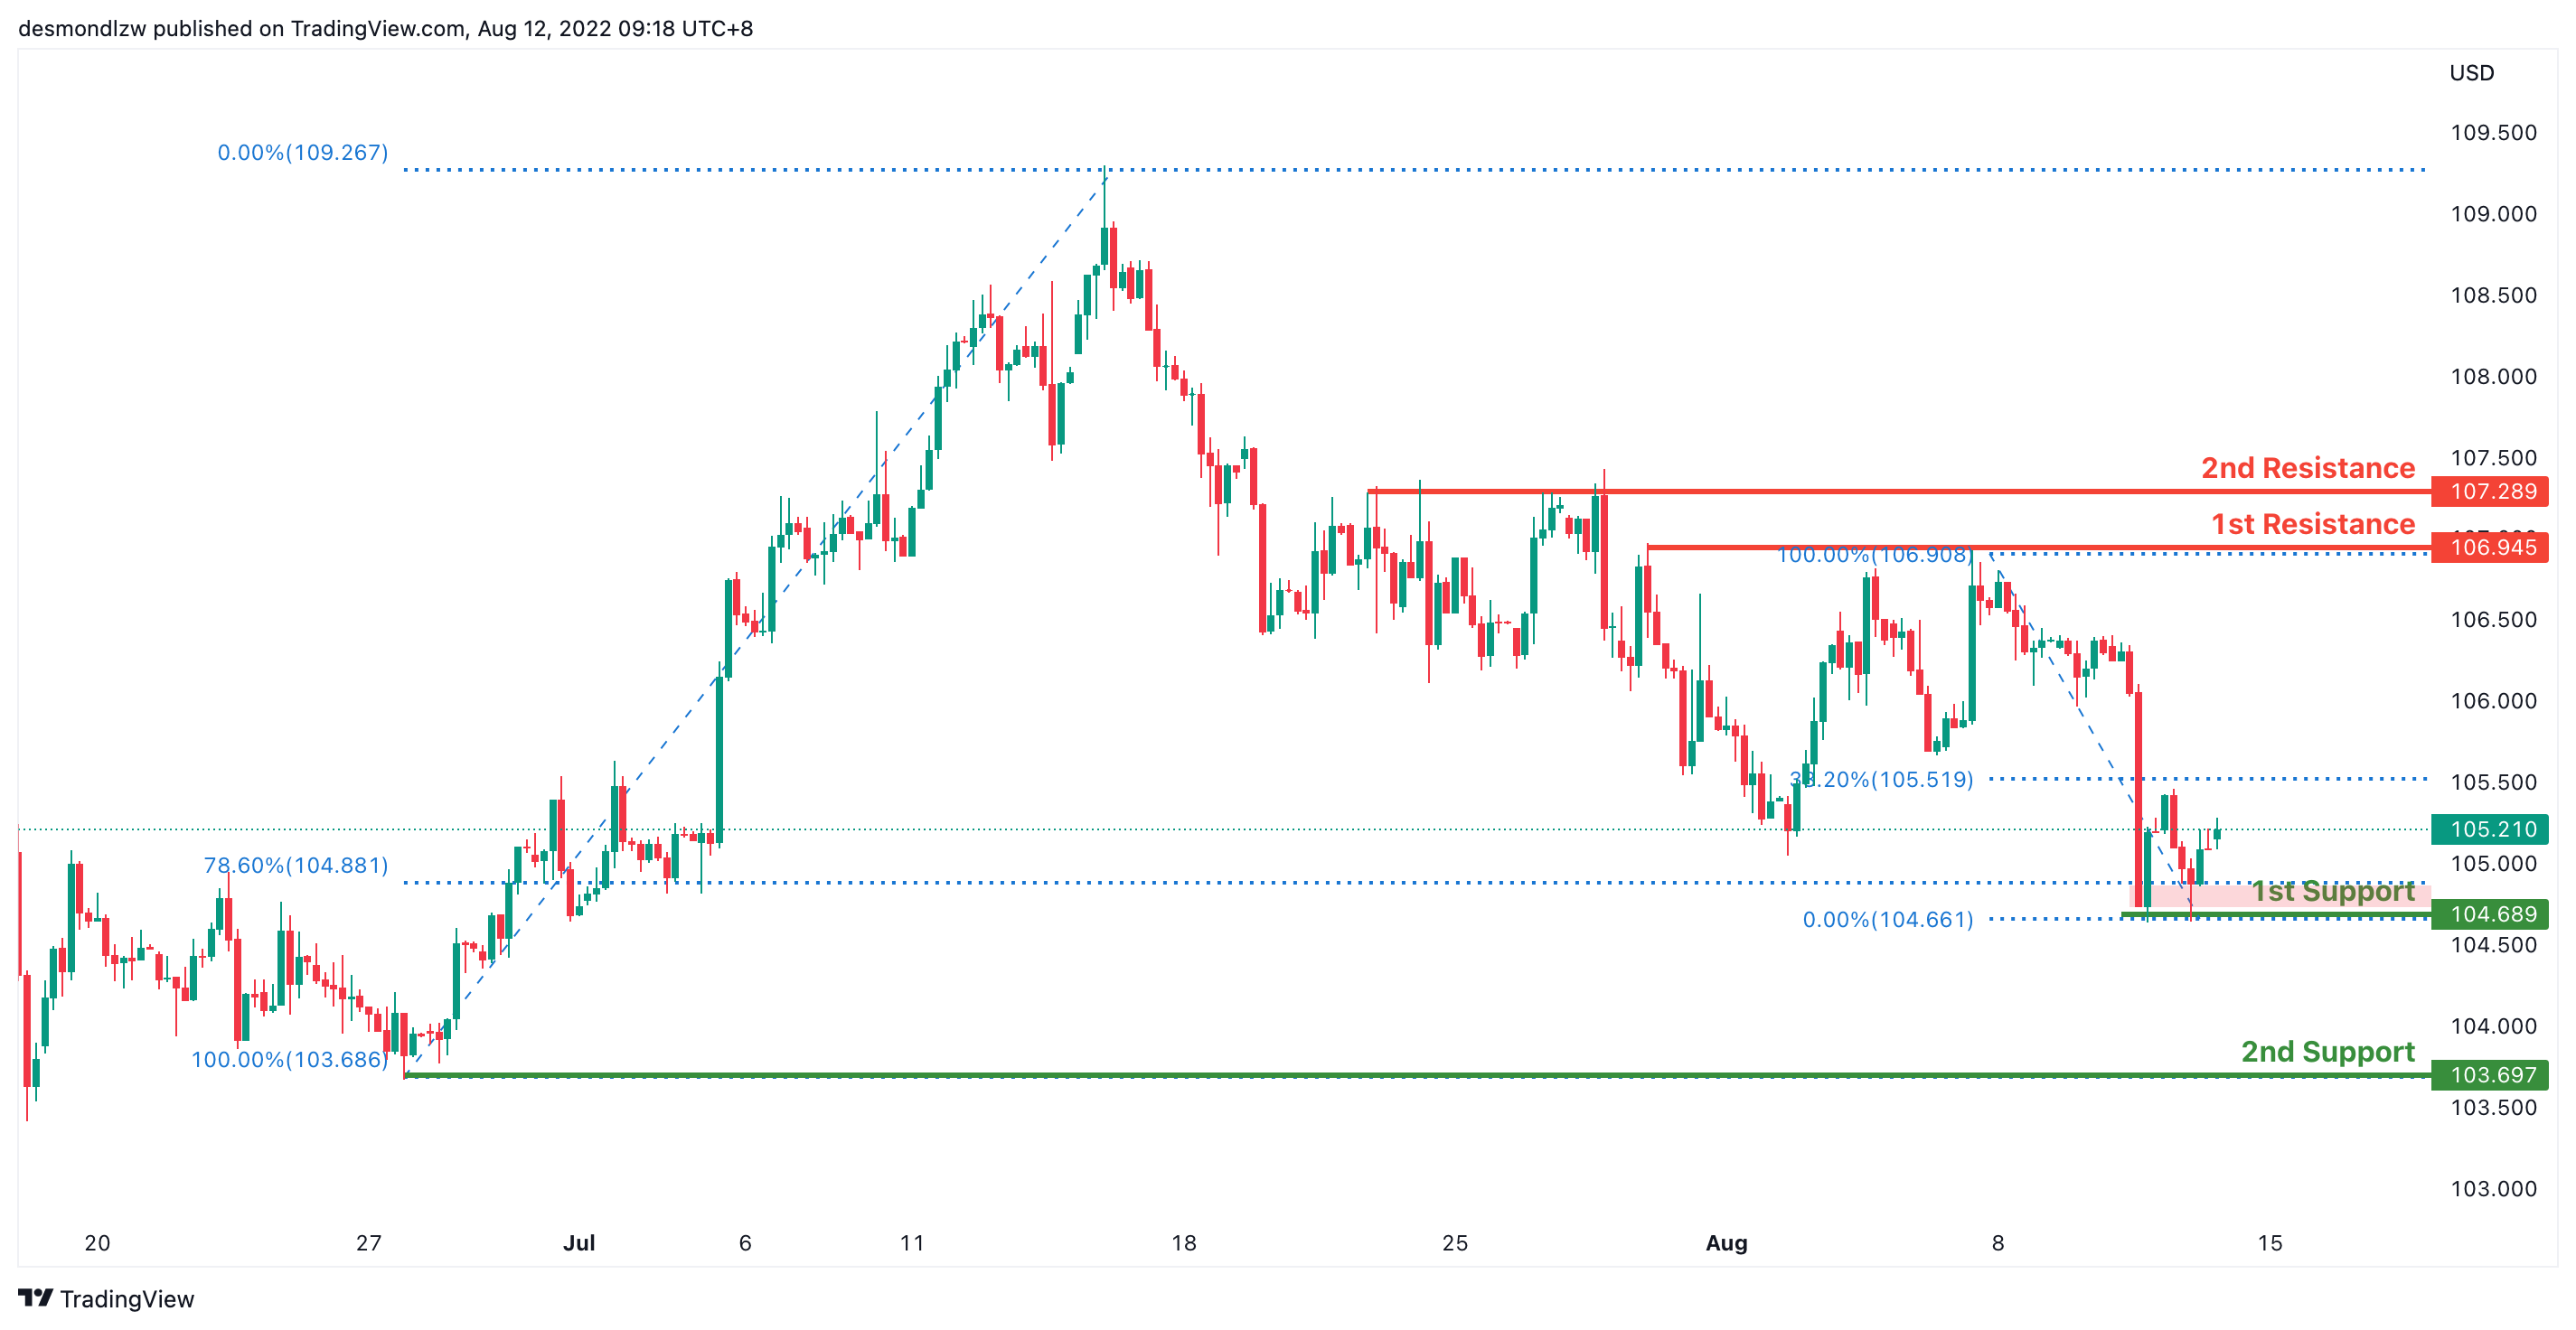
On the H4, price is moving in a descending trend and has confirmed a bearish momentum. It is now testing around the 104.689 level where the first support sits and 78.6% fibonacci retracement sits. If price continues the bearish momentum, it will bring price down to 103.697 where the previous swing low sits.. Alternatively, prices might pull back to test the first resistance at 106.945
Areas of consideration:
- H4 time frame, 1st resistance at 106.945
- H4 time frame, 1st support at 104.689
EUR/USD :
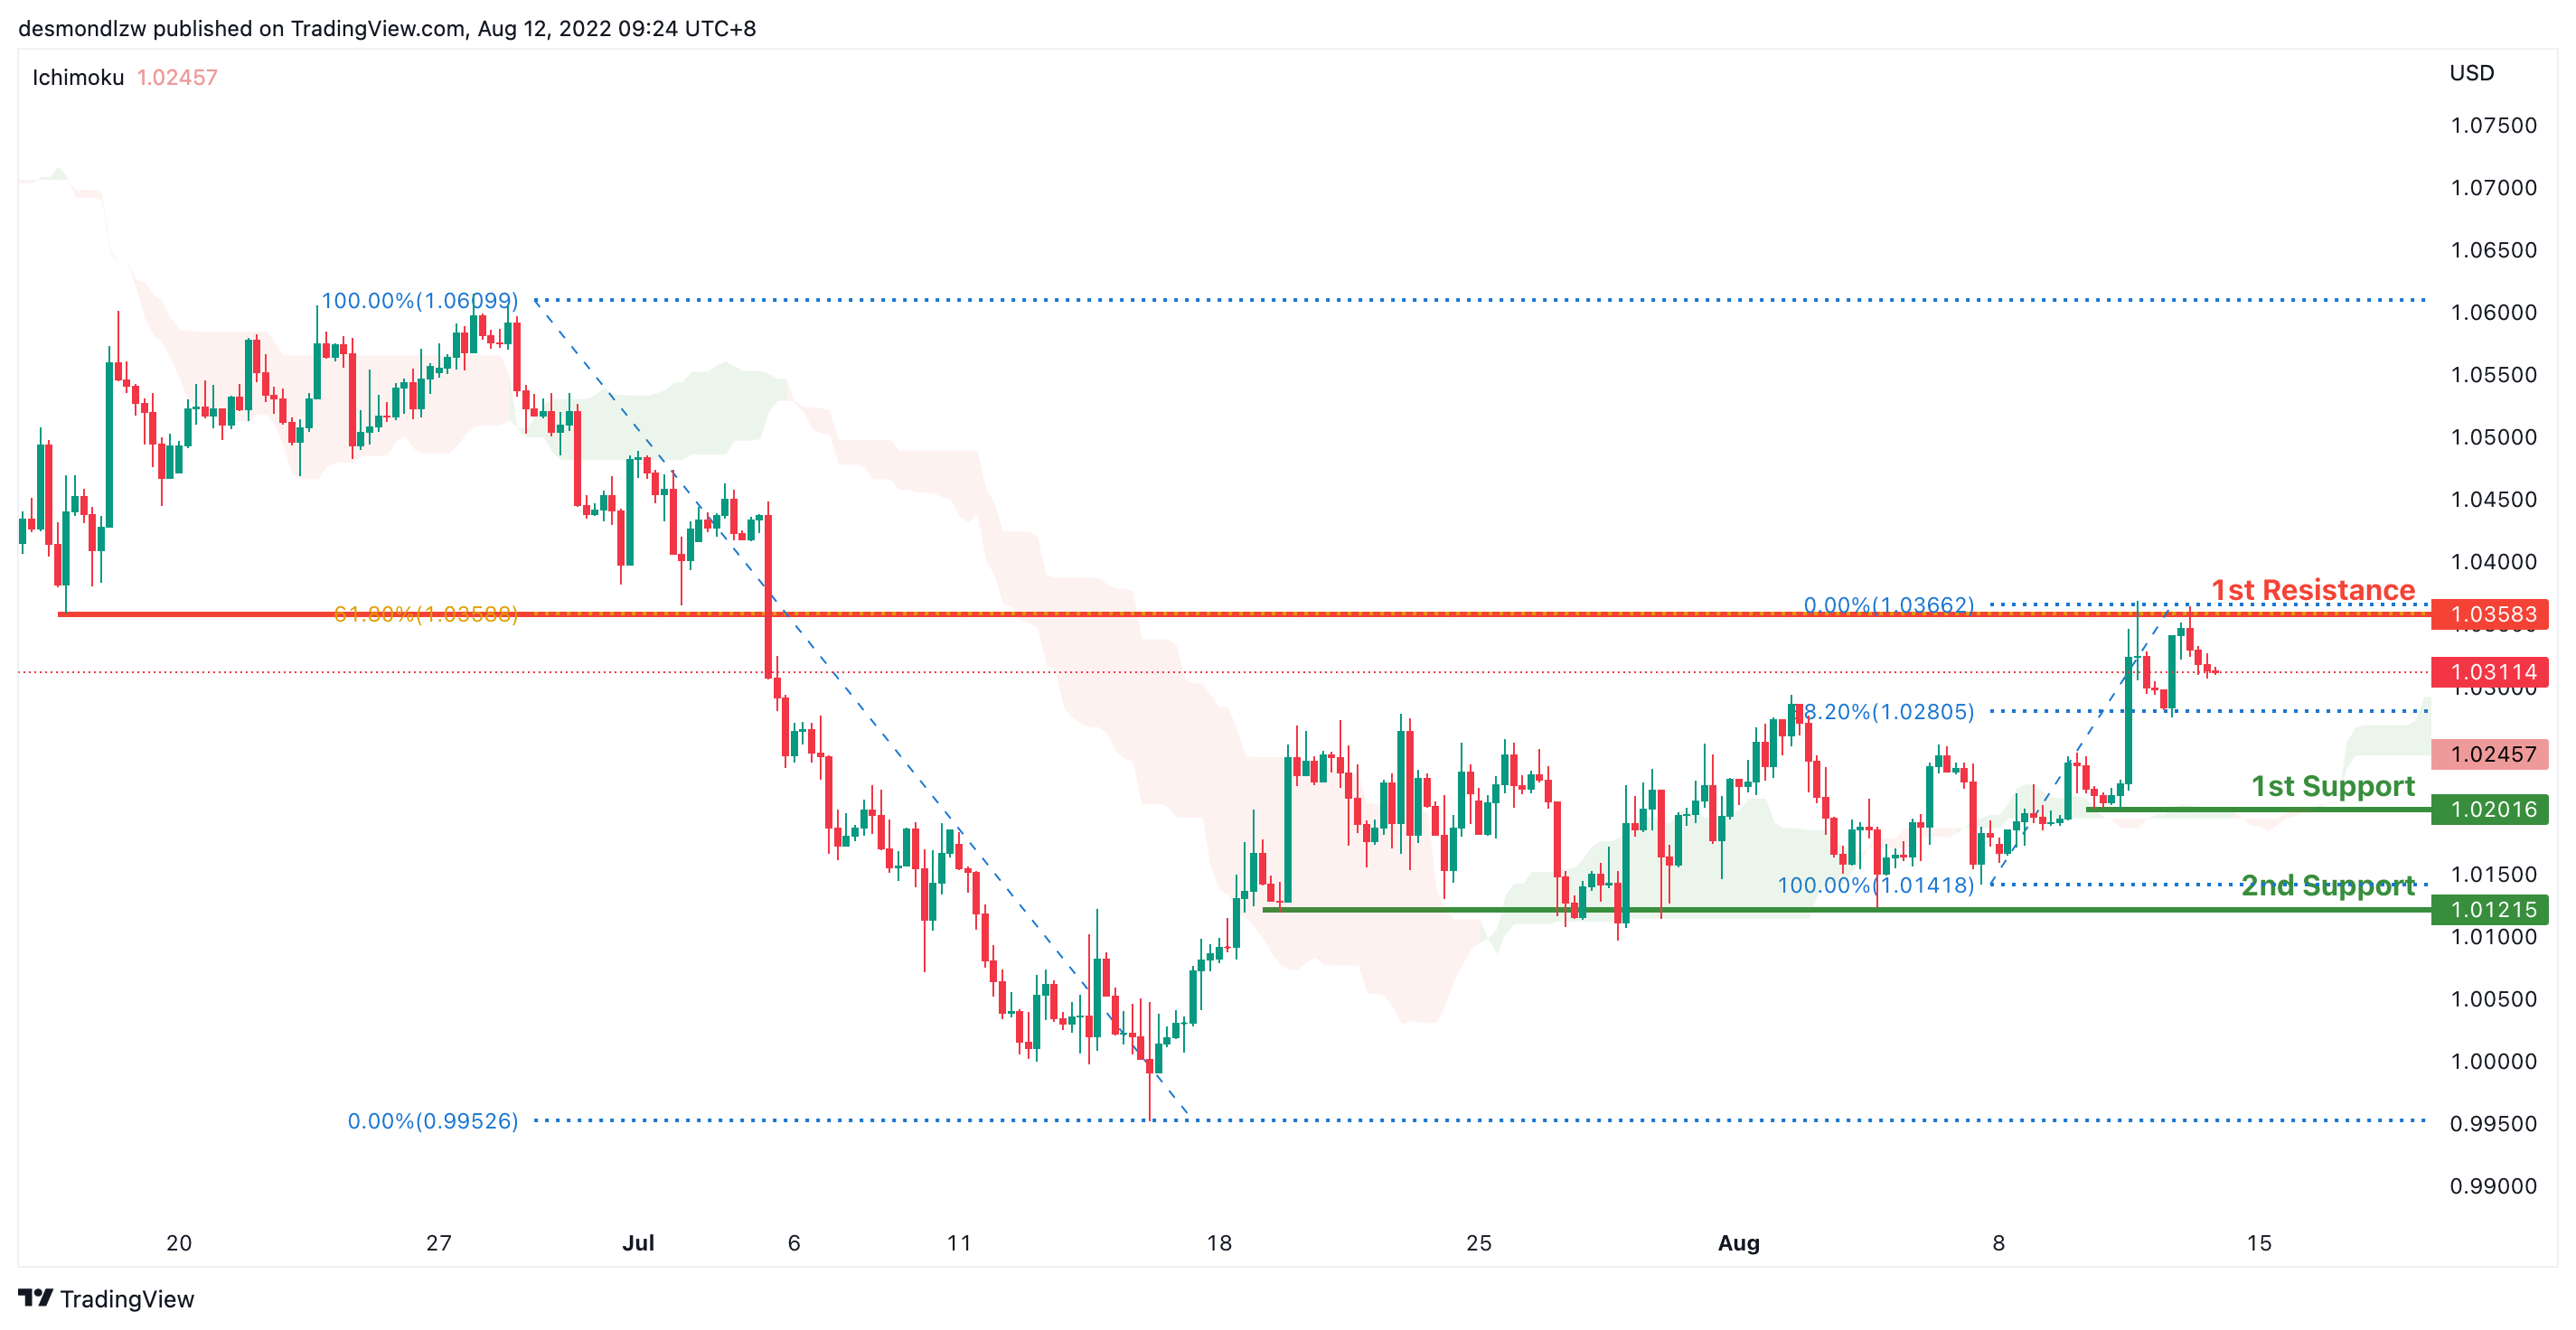
On the H4, with prices moving along the ascending trend and above the ichimoku indicator, we are bullish bias. Prices have tested the first resistance at 1.03583 where the 61.8% fibonacci retracement sits and is pulling back slightly. If prices fails to break the first resistance, it will pull back further to test at the first support 1.020 where the previous swing low sits and subsequently the second support at 1.012 level
Areas of consideration :
- H4 1st resistance at 1.035
- H4 1st support at 1.020
GBP/USD:
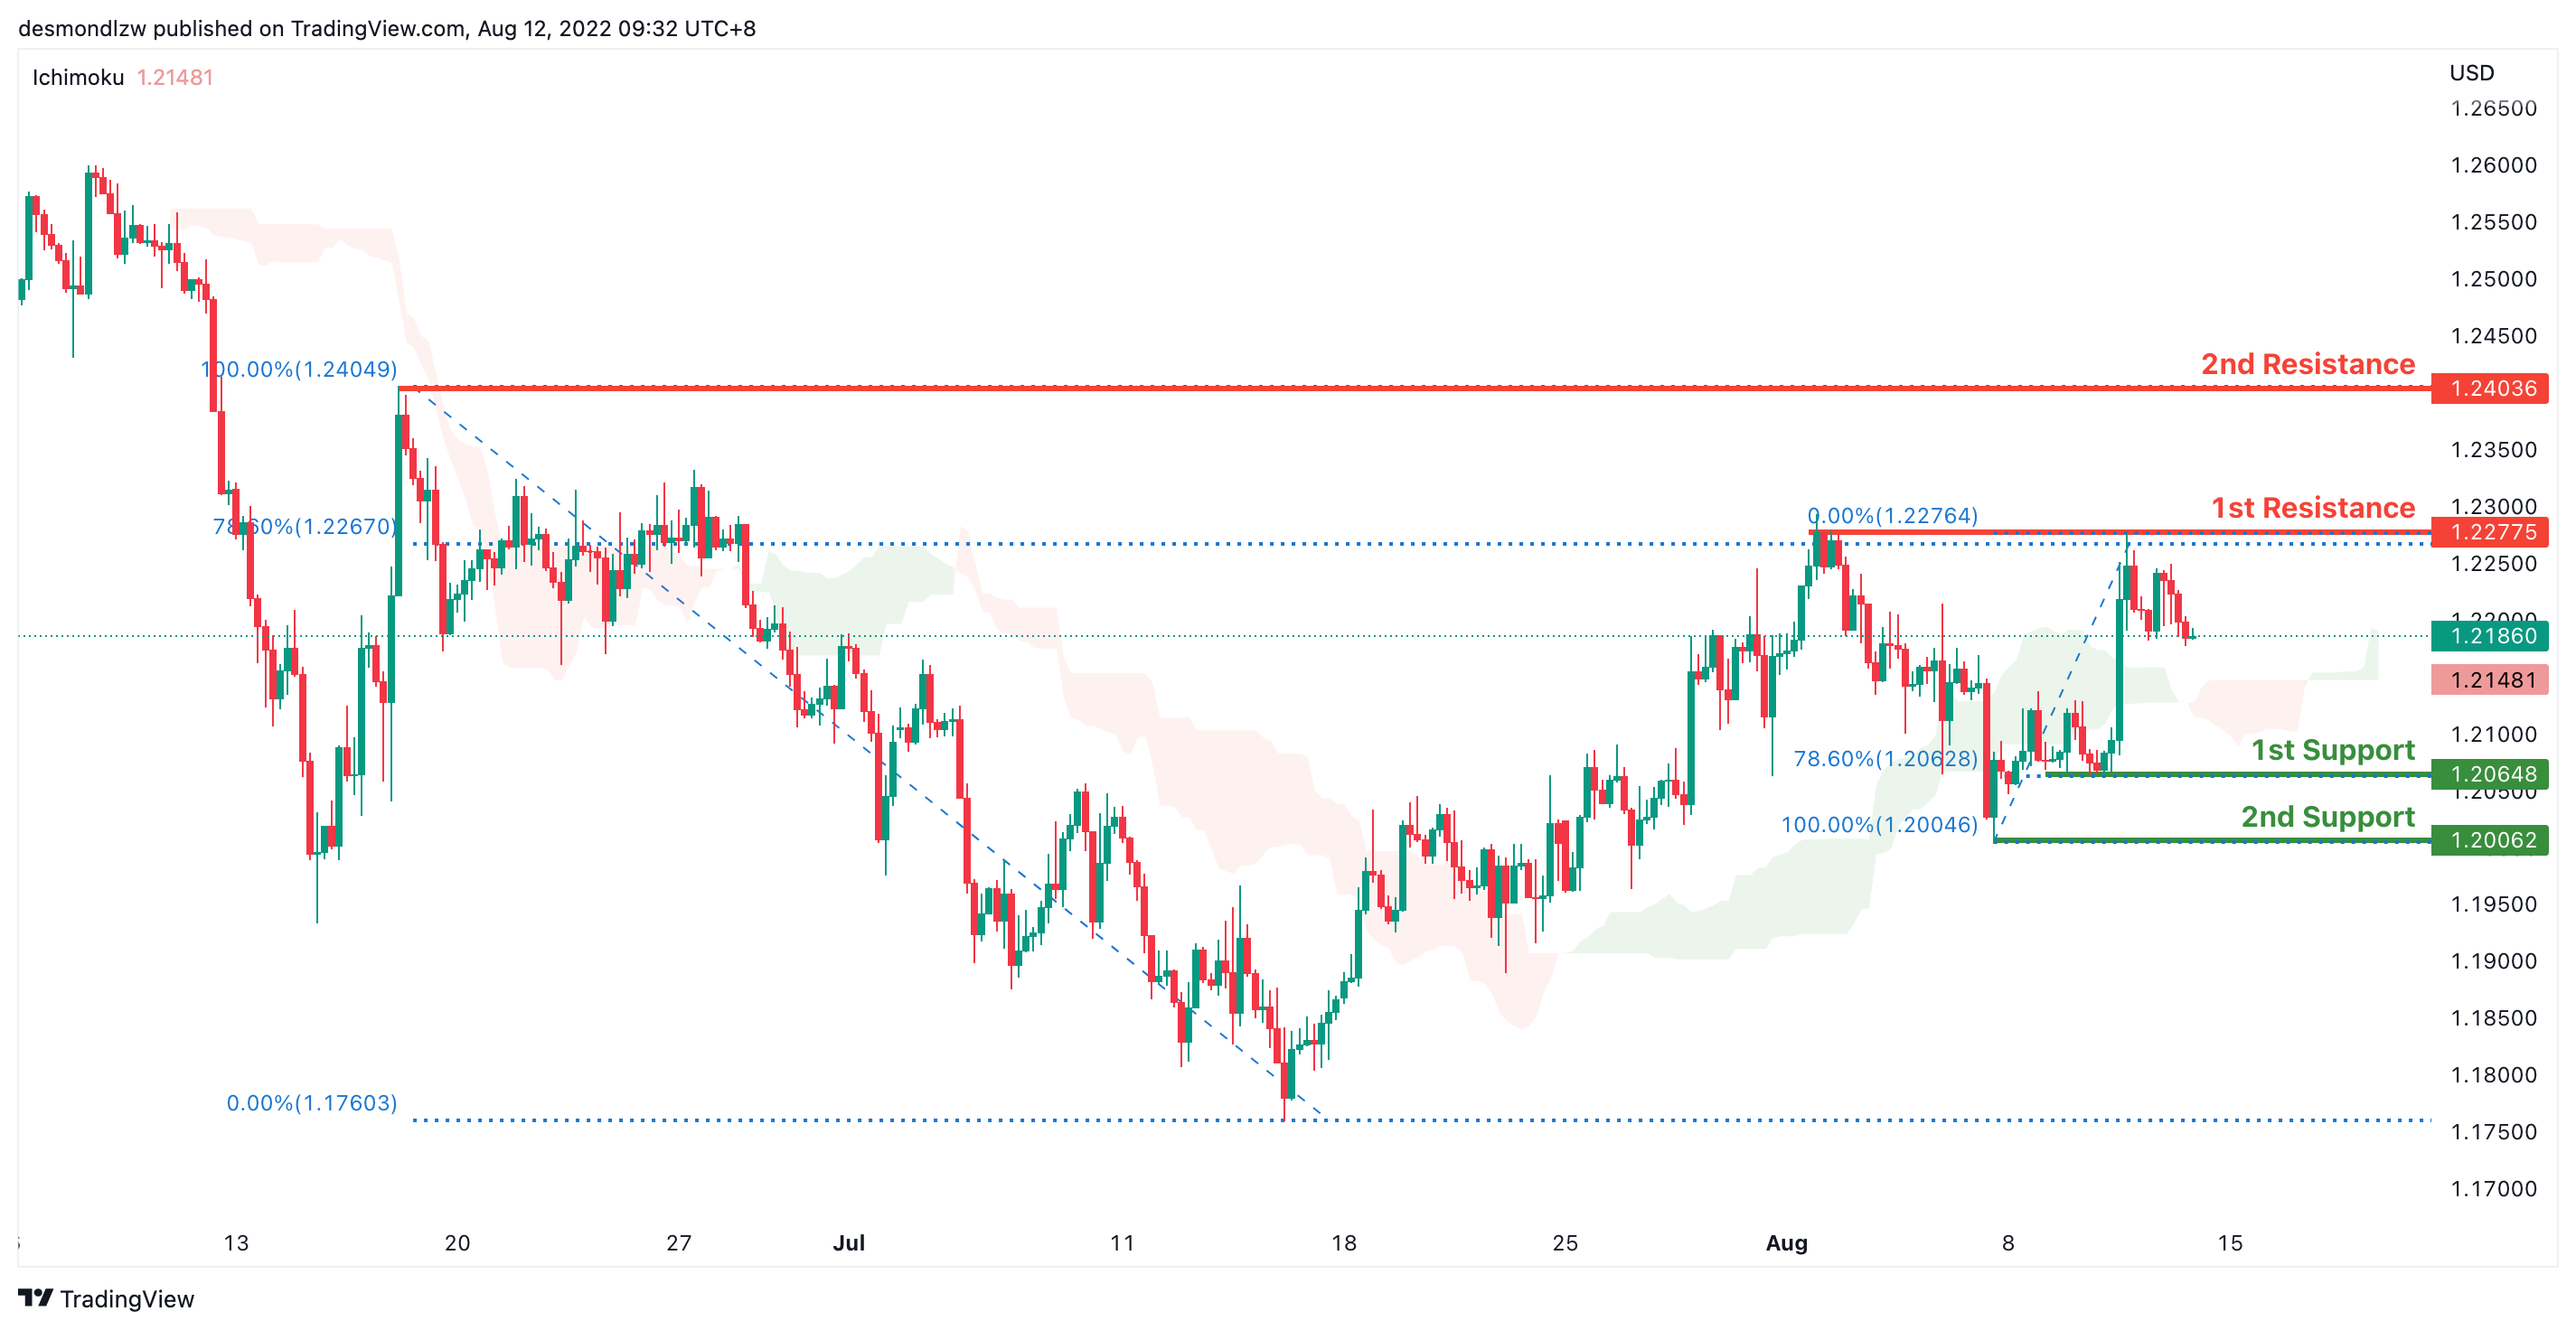
On the H4, with price moving within an ascending trend and above the ichimoku indicator, we have a bullish bias that price will rise to test the first resistance at 1.227 where the 78.6% fibonacci retracement sits and subsequently the second resistance at 1.240. If prices fail to break the first resistance, we can confirm a bearish momentum where prices will pull back and test the first support at 1.206 where the 78.6% fibonacci retracement sits
Areas of consideration:
- H4 1st resistance at 1.227
- H4 1st support at 1.206
USD/CHF:
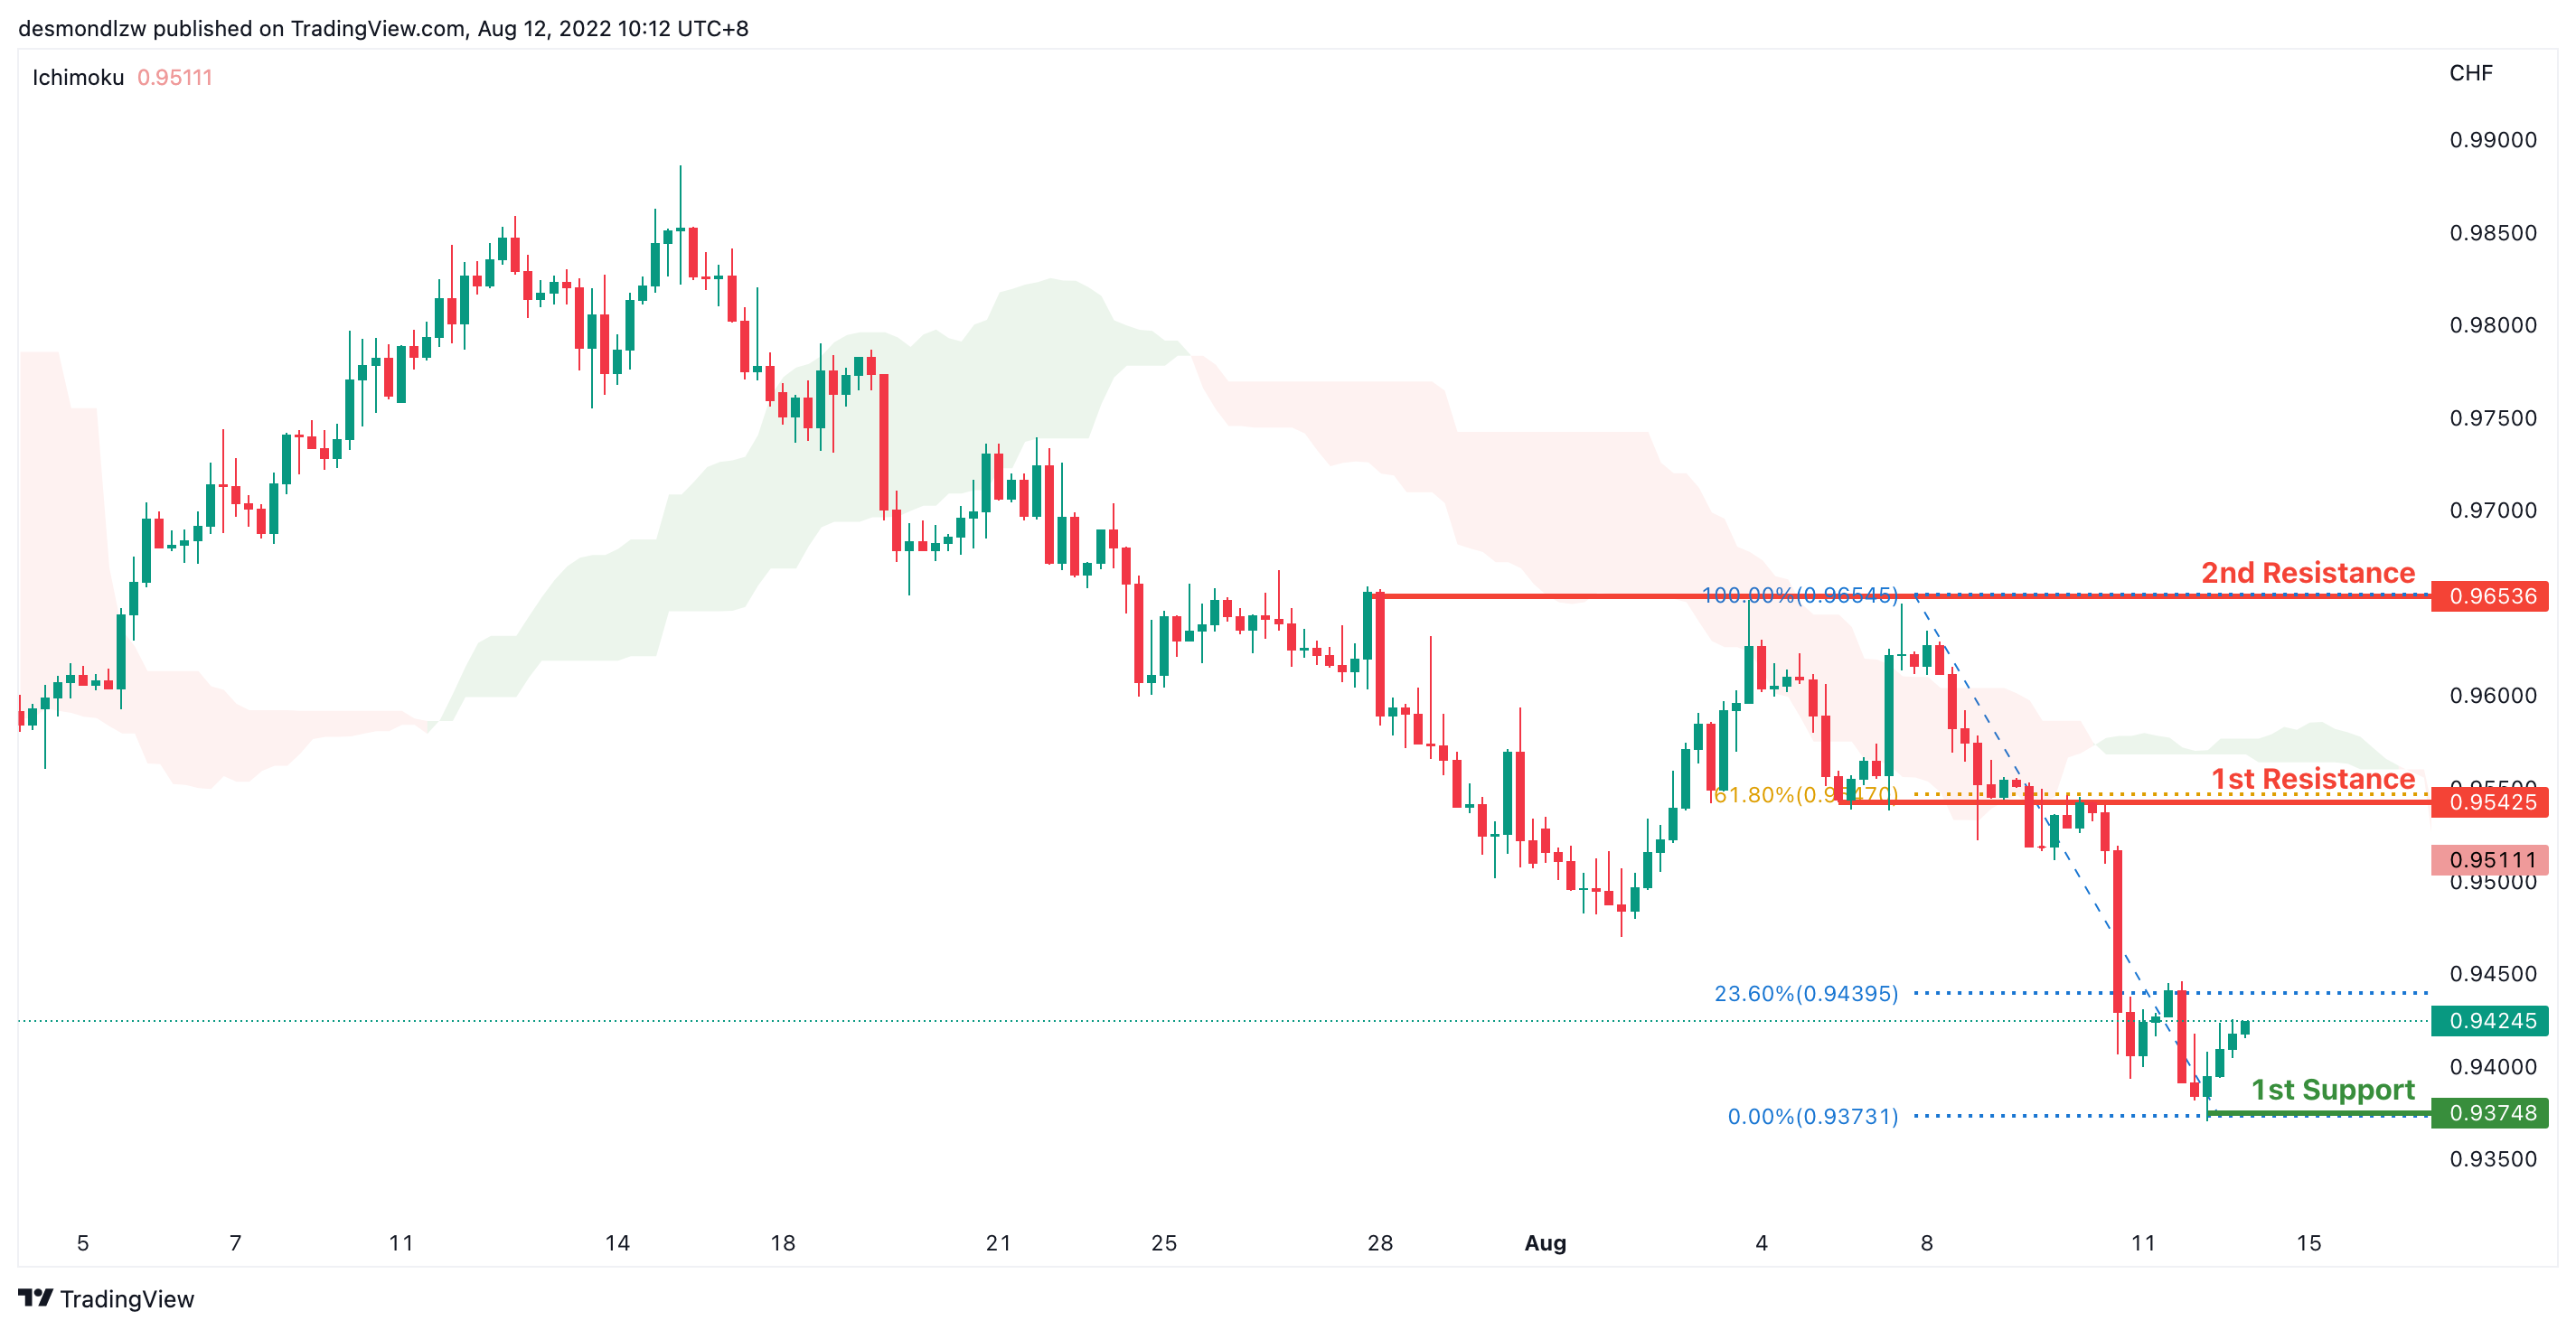
On the H4, with prices moving below the ichimoku cloud and the MACD indicators are below zero, we have a bearish bias that the price will continue with the bearish momentum and pull back to test at the first support 0.937. If prices fail to break first support, it may pull back to test the first resistance at 0.954 where the 61.8% fibonacci retracement and previous swing low sits. If prices continues with bullish momentum, it will then pull back further to test at the second resistance 0.965
Areas of consideration
- H4 1st support at 0.937
- H4 1st resistance at 0.954
XAU/USD (GOLD):
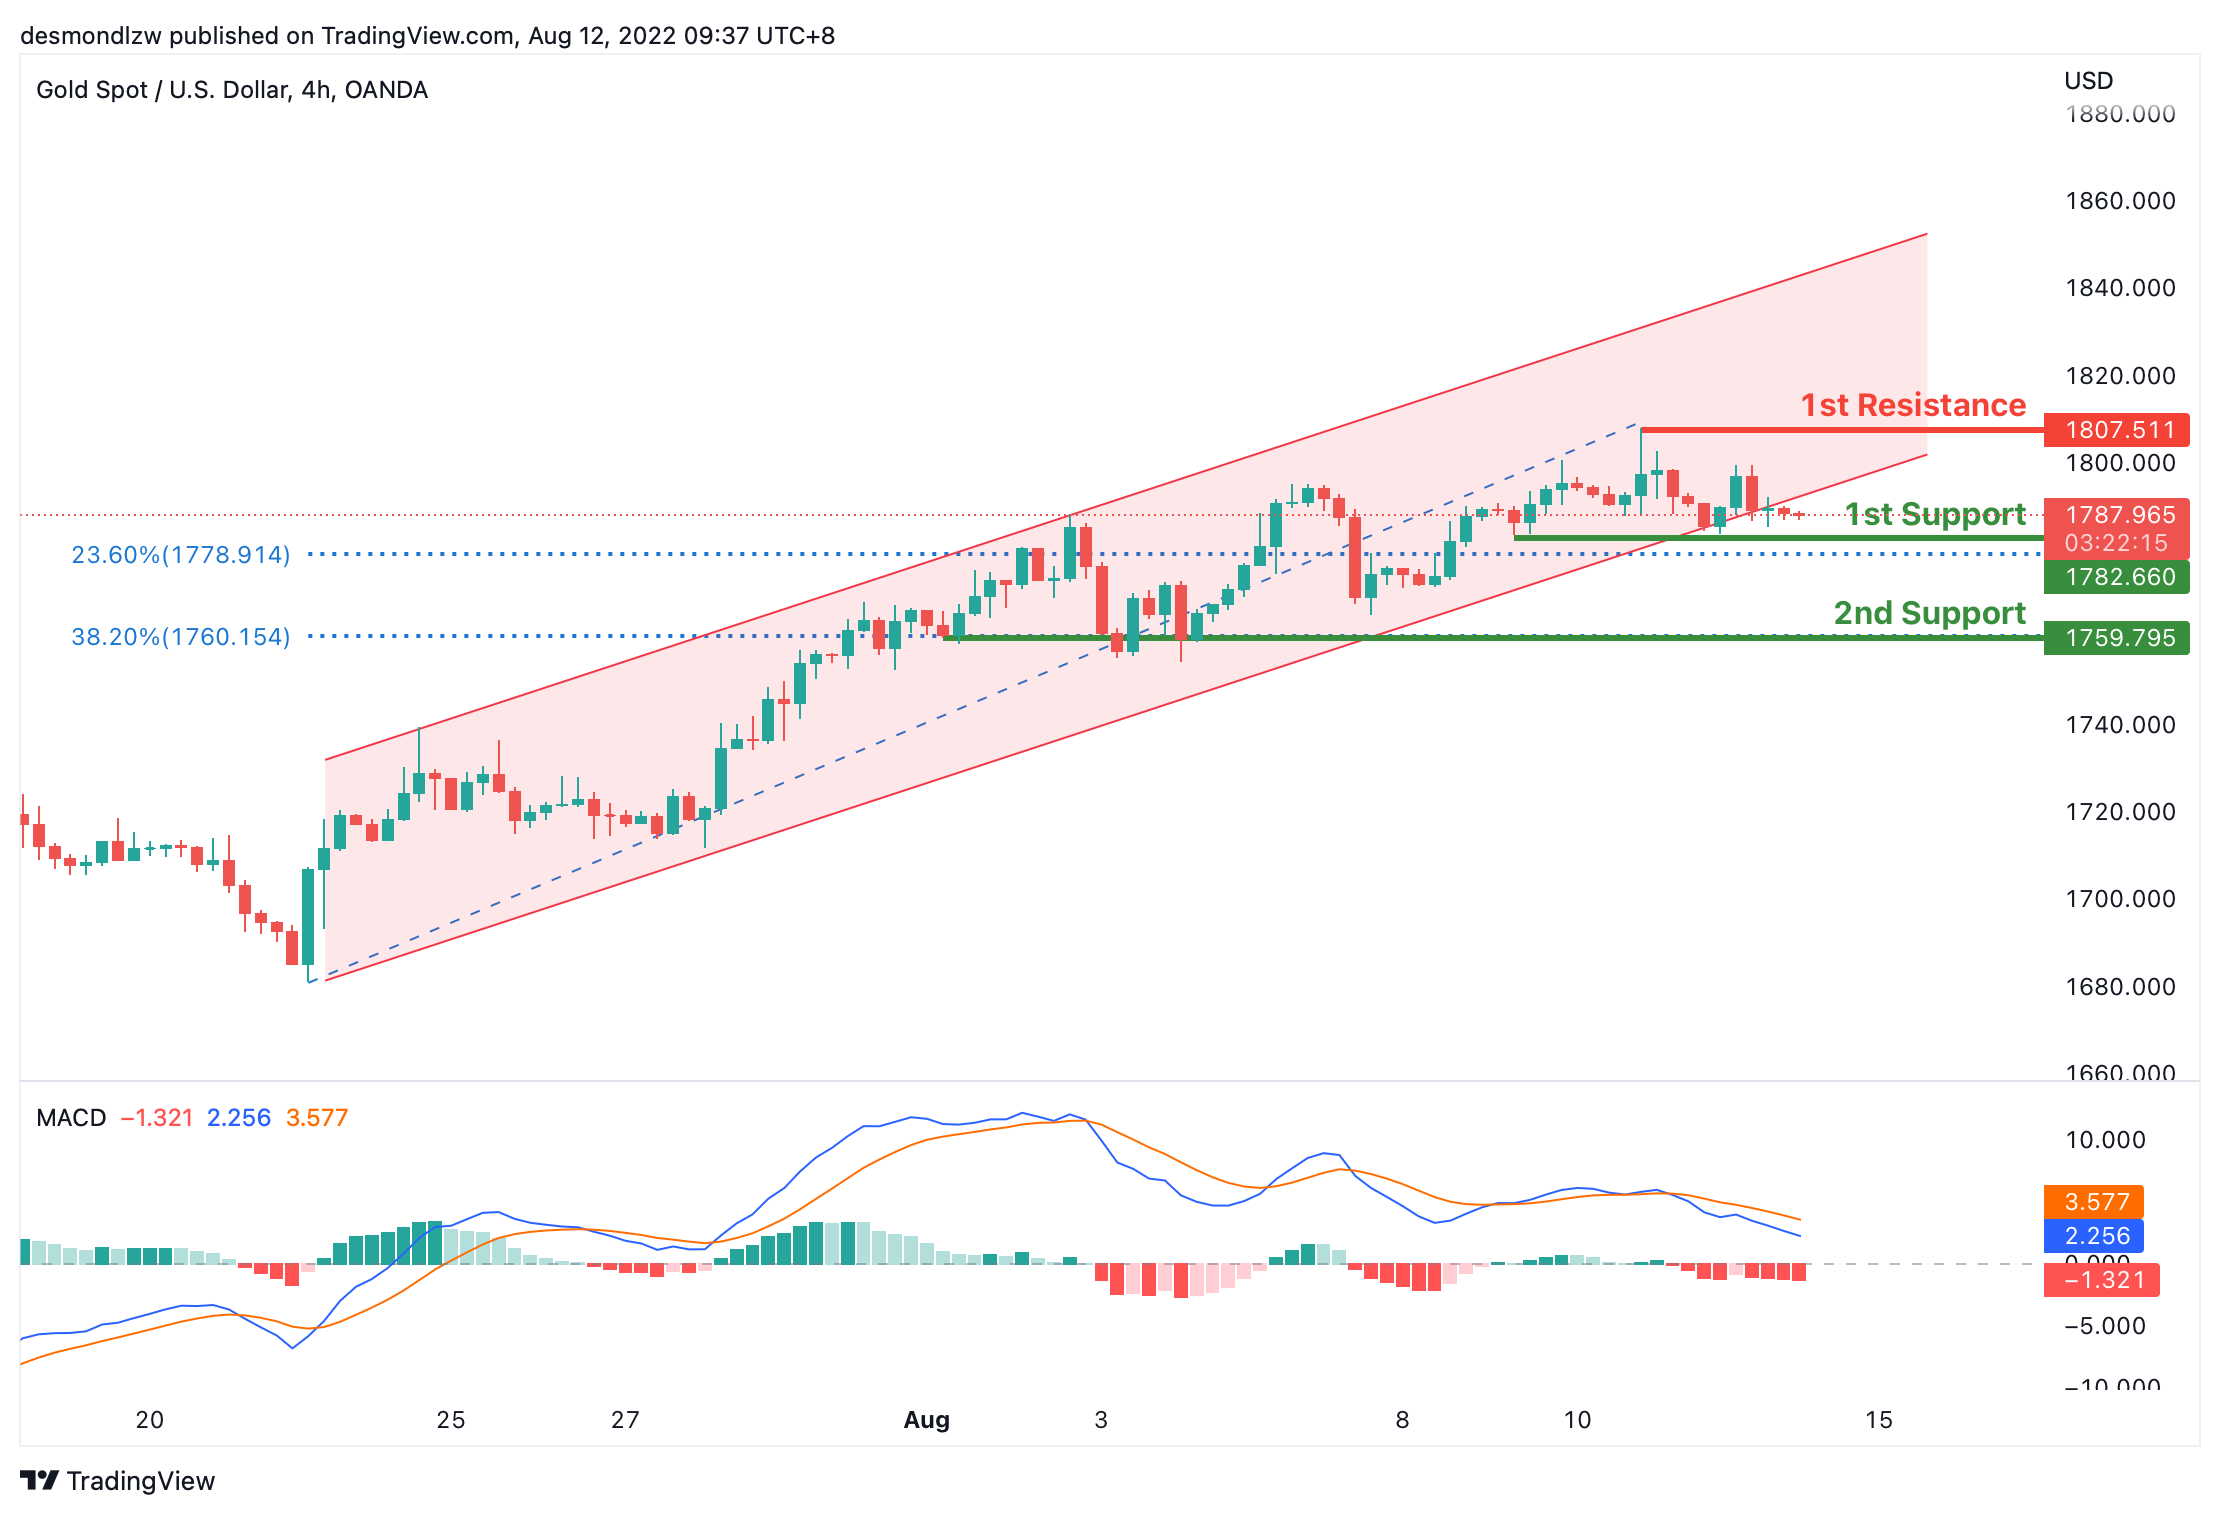
On the H4, with prices breaking the ascending trendline and MACD histograms are expanding below zero axis, we have a bearish bias that the price may drop from the 1st support at 1782.660, which is in line with the overlap support and 23.6% fibonacci retracement to the 2nd support at 1759.795, which is in line with the overlap support and 38.2% fibonacci retracement. Alternatively, the price may rise back to the ascending channel and rise to the 1st resistance at 1807.511, which is in line with the swing high.
Areas of consideration:
- H4 time frame, 1st support at 1782.660
- H4 time frame, 2nd support at 1759.79
AUD/USD:
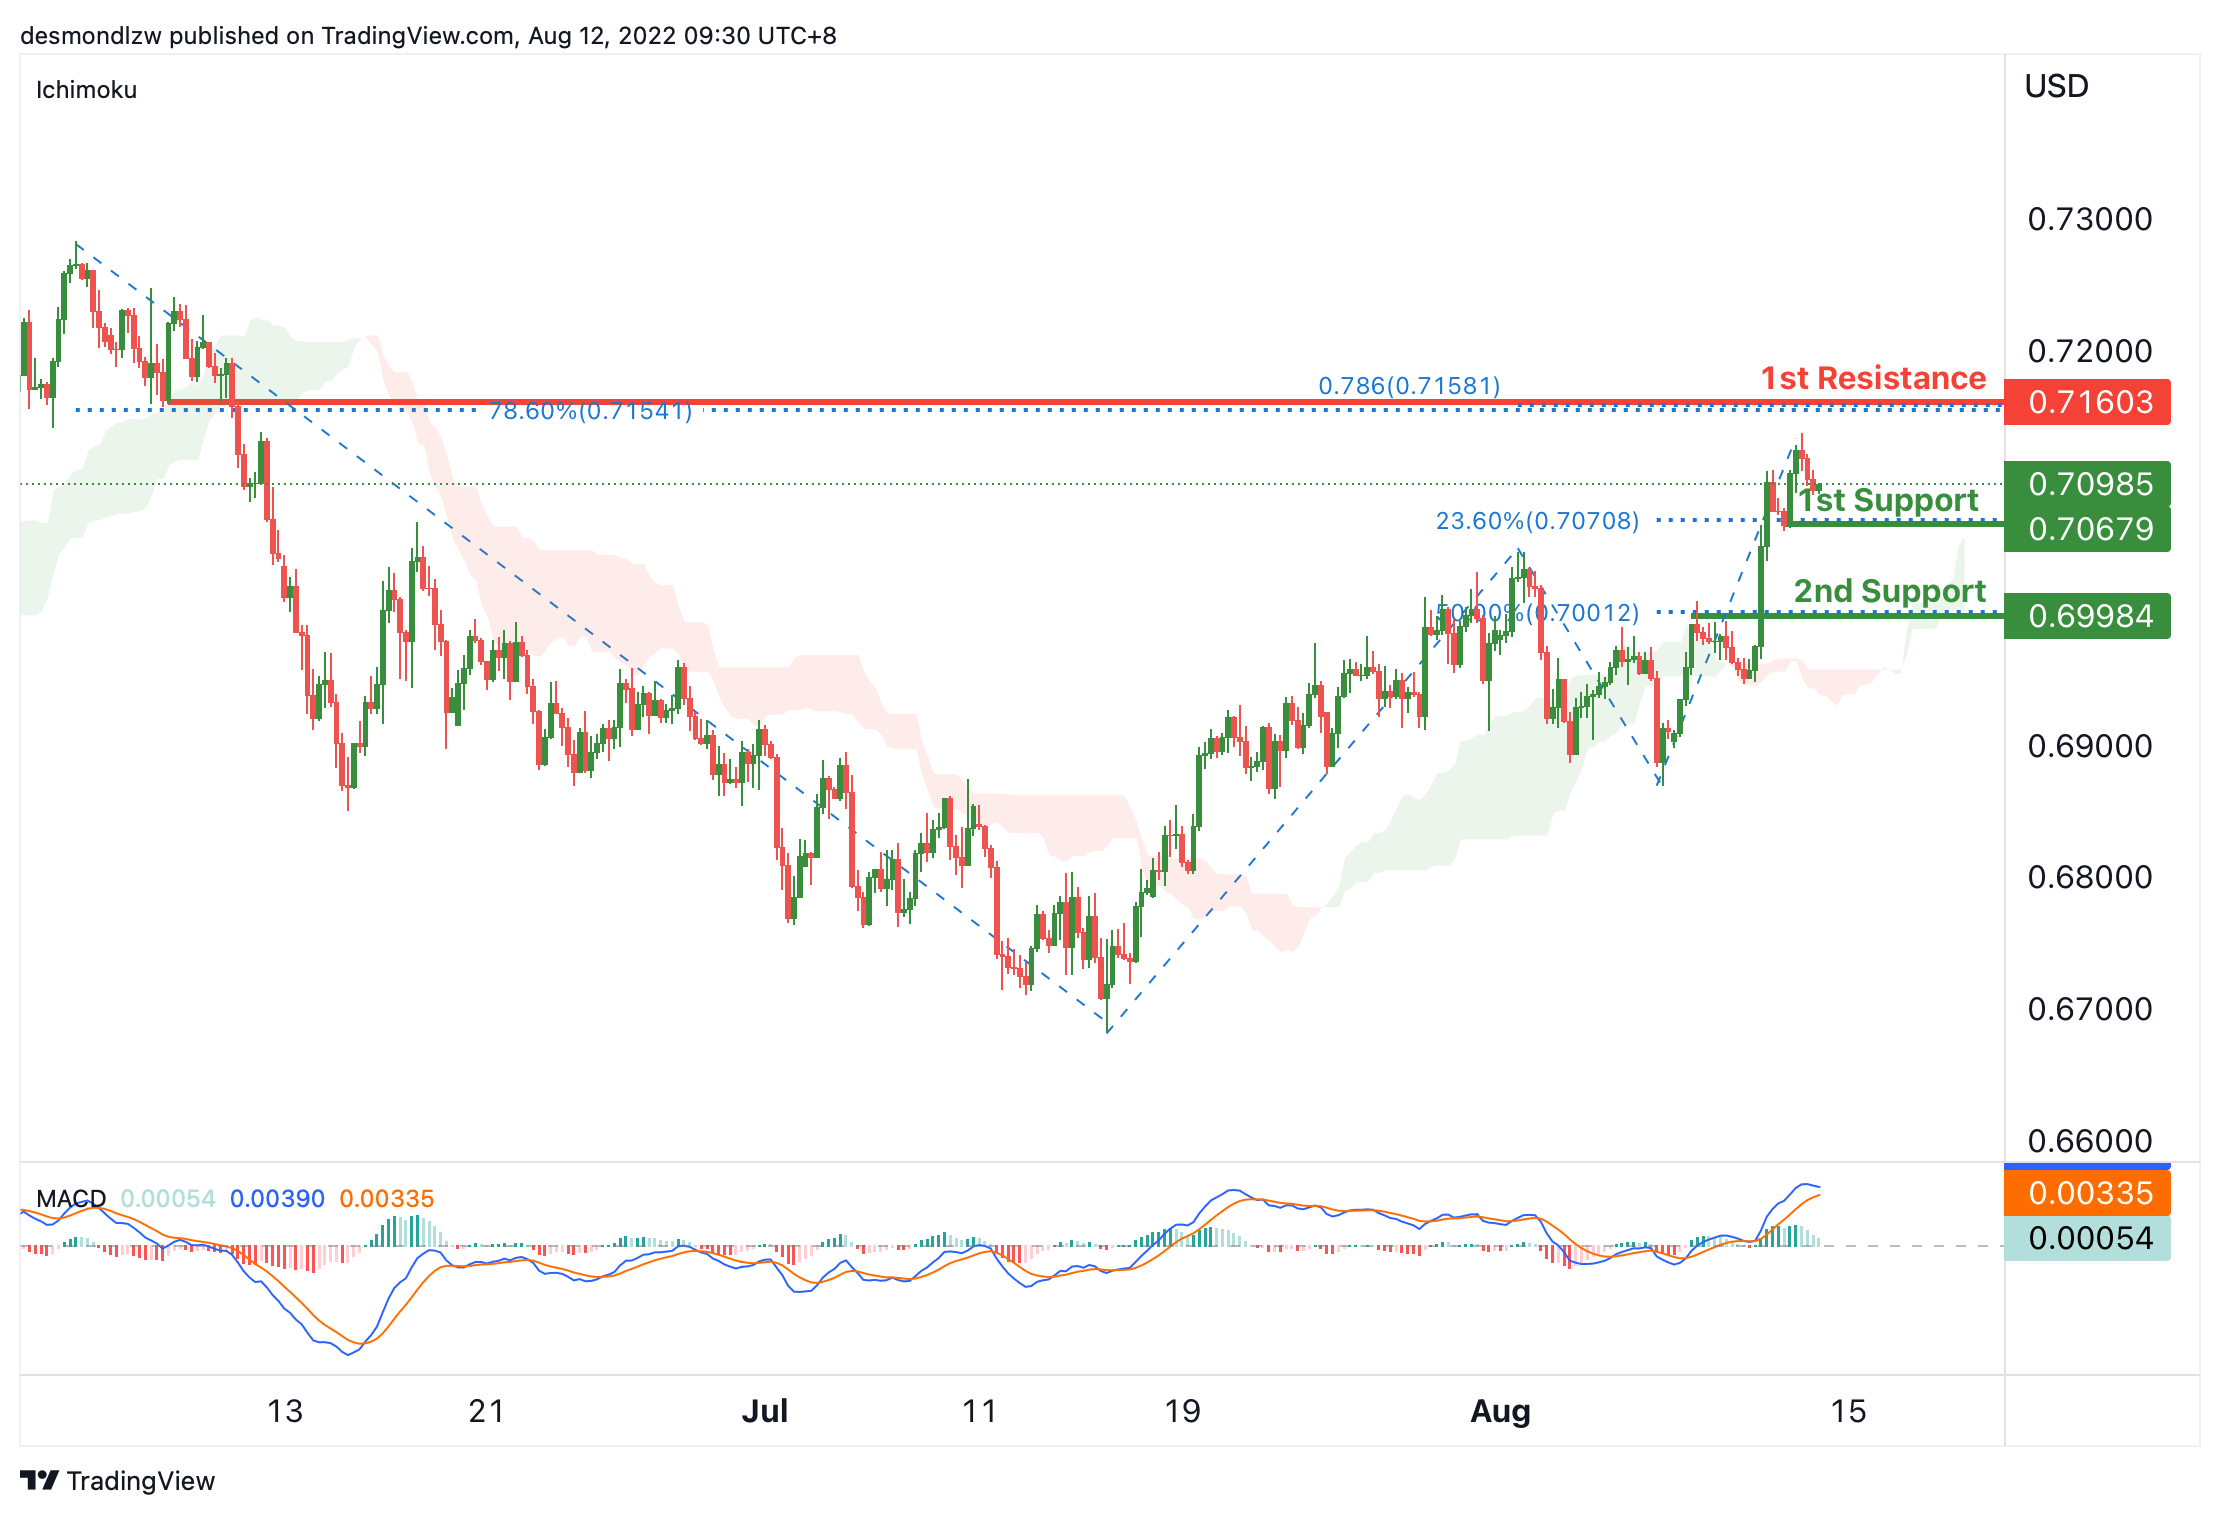
On the H4, with the price is over ichimoku cloud and MACD histograms are above zero axis, we have a bullish bias that price may rise from the 1st support at 0.70679, where the pullback support and 23.6% fibonacci retracement are to the 1st resistance at 0.71603 where the 78.6% fibonacci projection, 78.6% fibonacci retracement and swing low are. Alternatively, price may drop to the 2nd support at 0.69984 which is in line with 50% fibonacci retracement and pullback support.
Areas of consideration
- H4 1st support at 0.70679
- H4 1st resistance at 0.71603
NZD/USD:
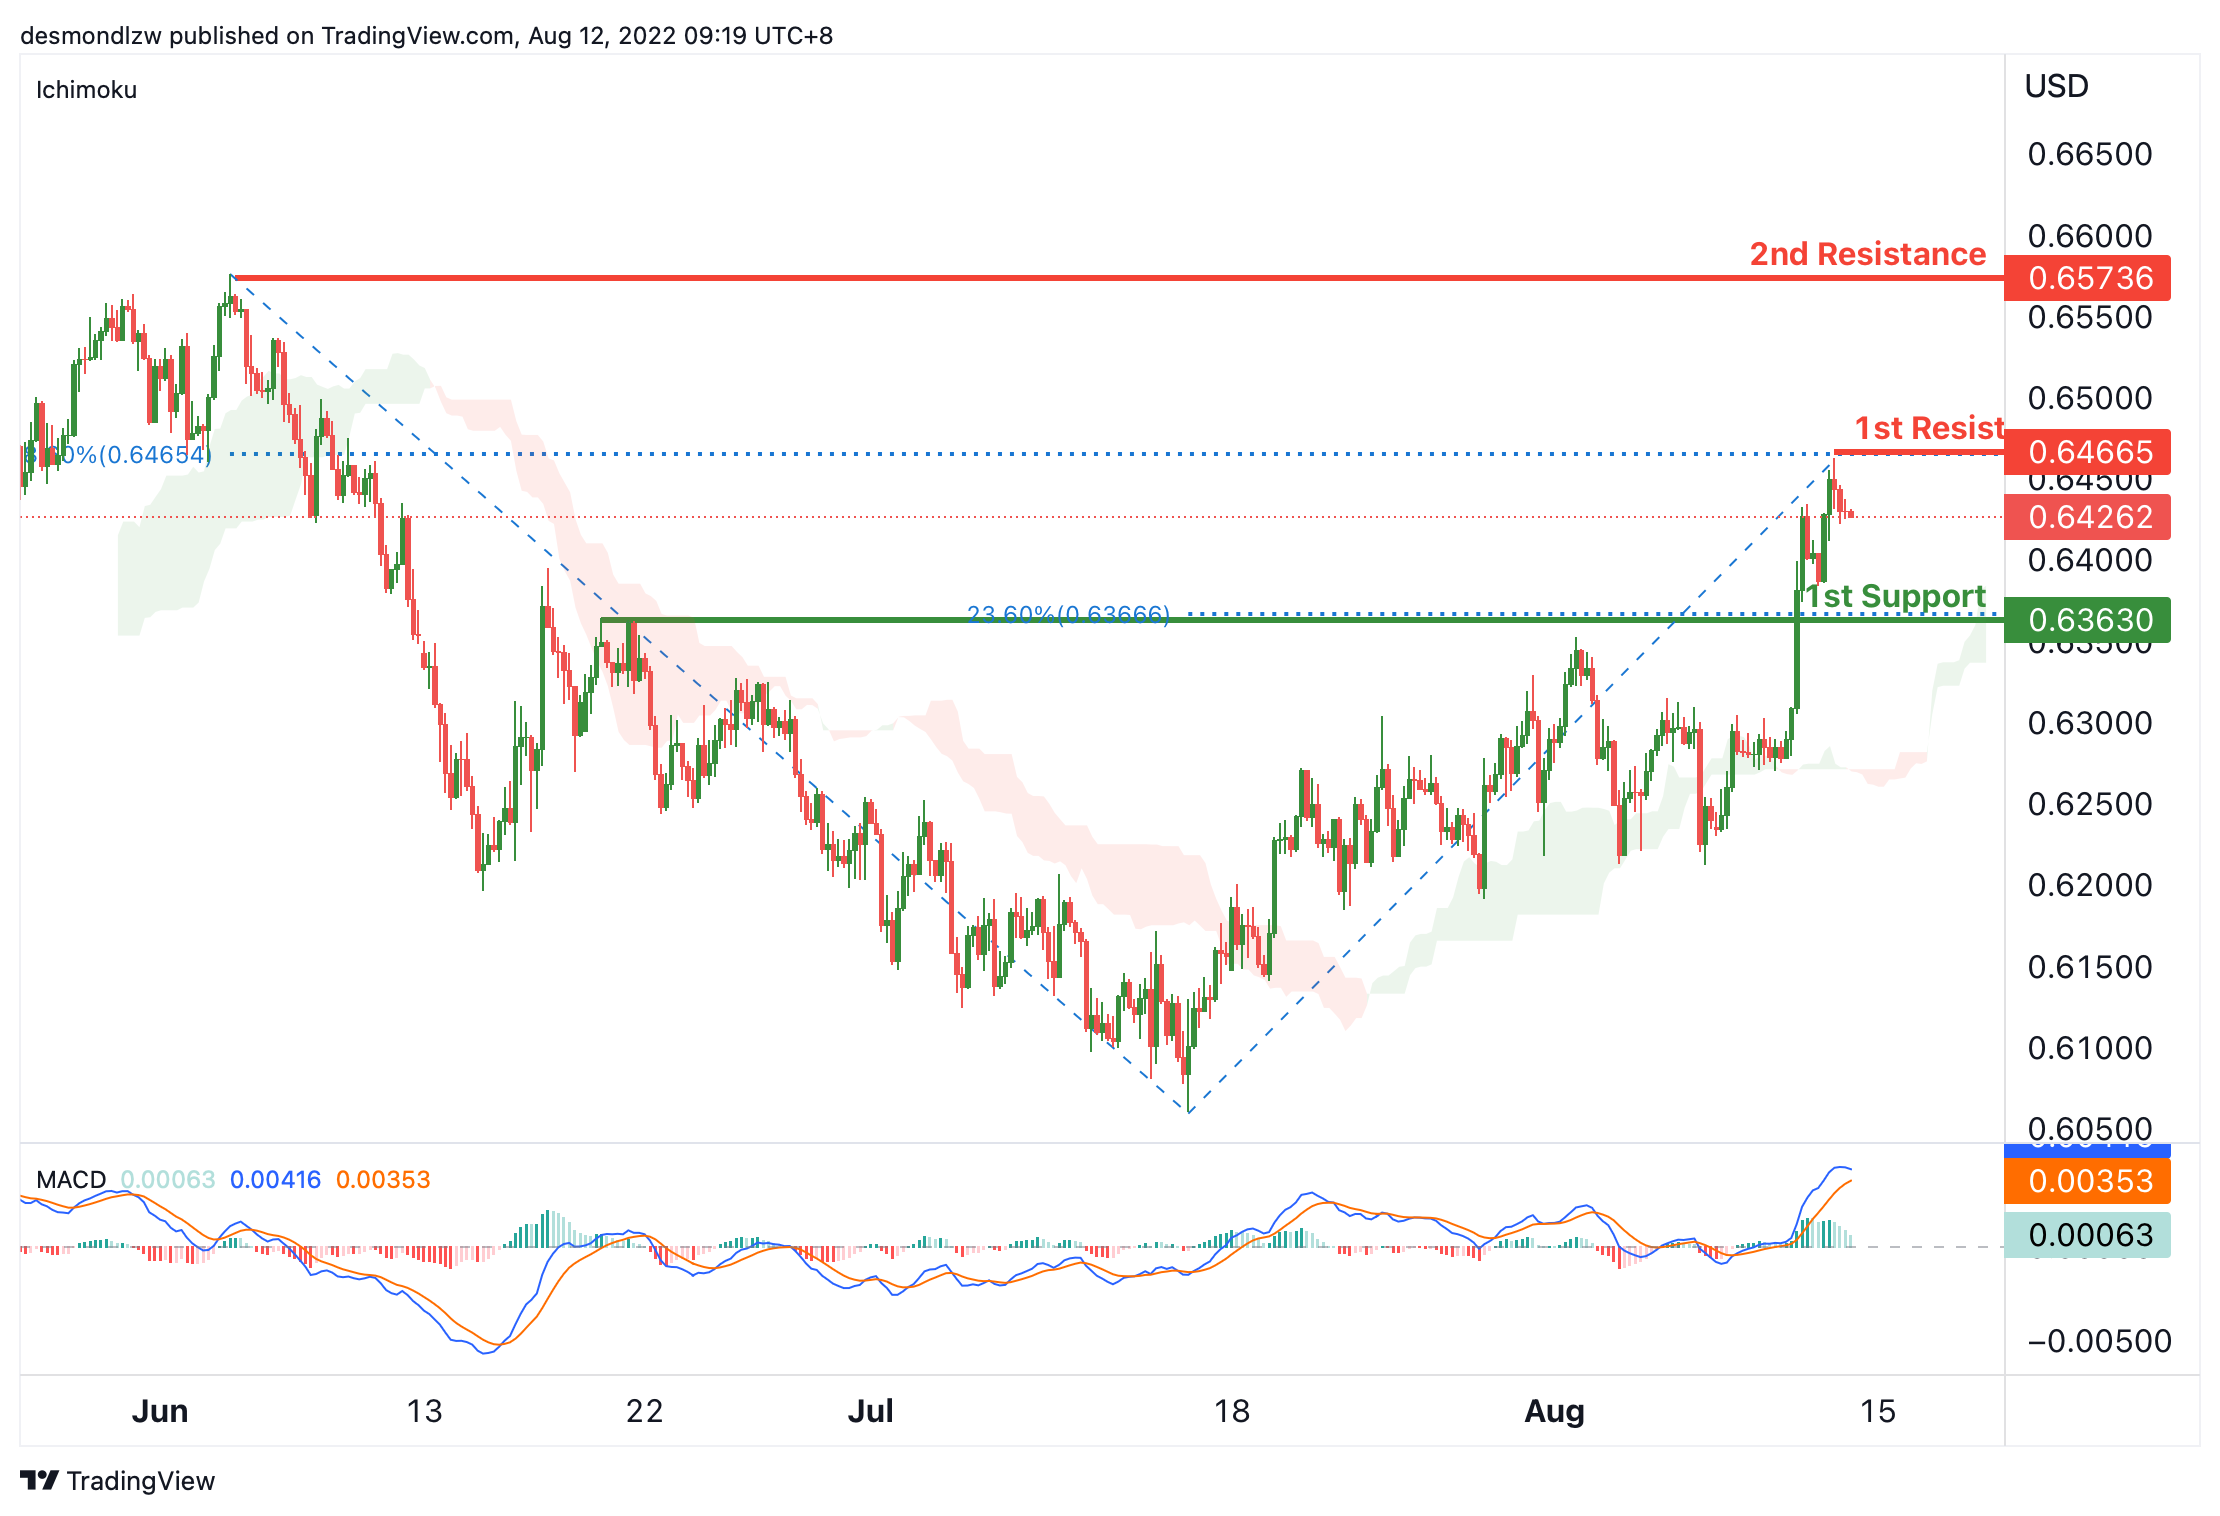
On the H4, with the price is over ichimoku cloud and MACD histograms are above zero axis, we have a bullish bias that price may rise from the 1st resistance at 0.64665, where the swing high and 78.6% fibonacci retracement are to the 2nd resistance at 0.65736 where the swing high is. Alternatively, price may drop to the 1st support at 0.63630 which is in line with 23.6% fibonacci retracement and overlap support.
Areas of consideration:
- H4 time frame, 1st resistance at 0.64665
- H4 time frame, 2nd resistance at 0.65736
USD/CAD:
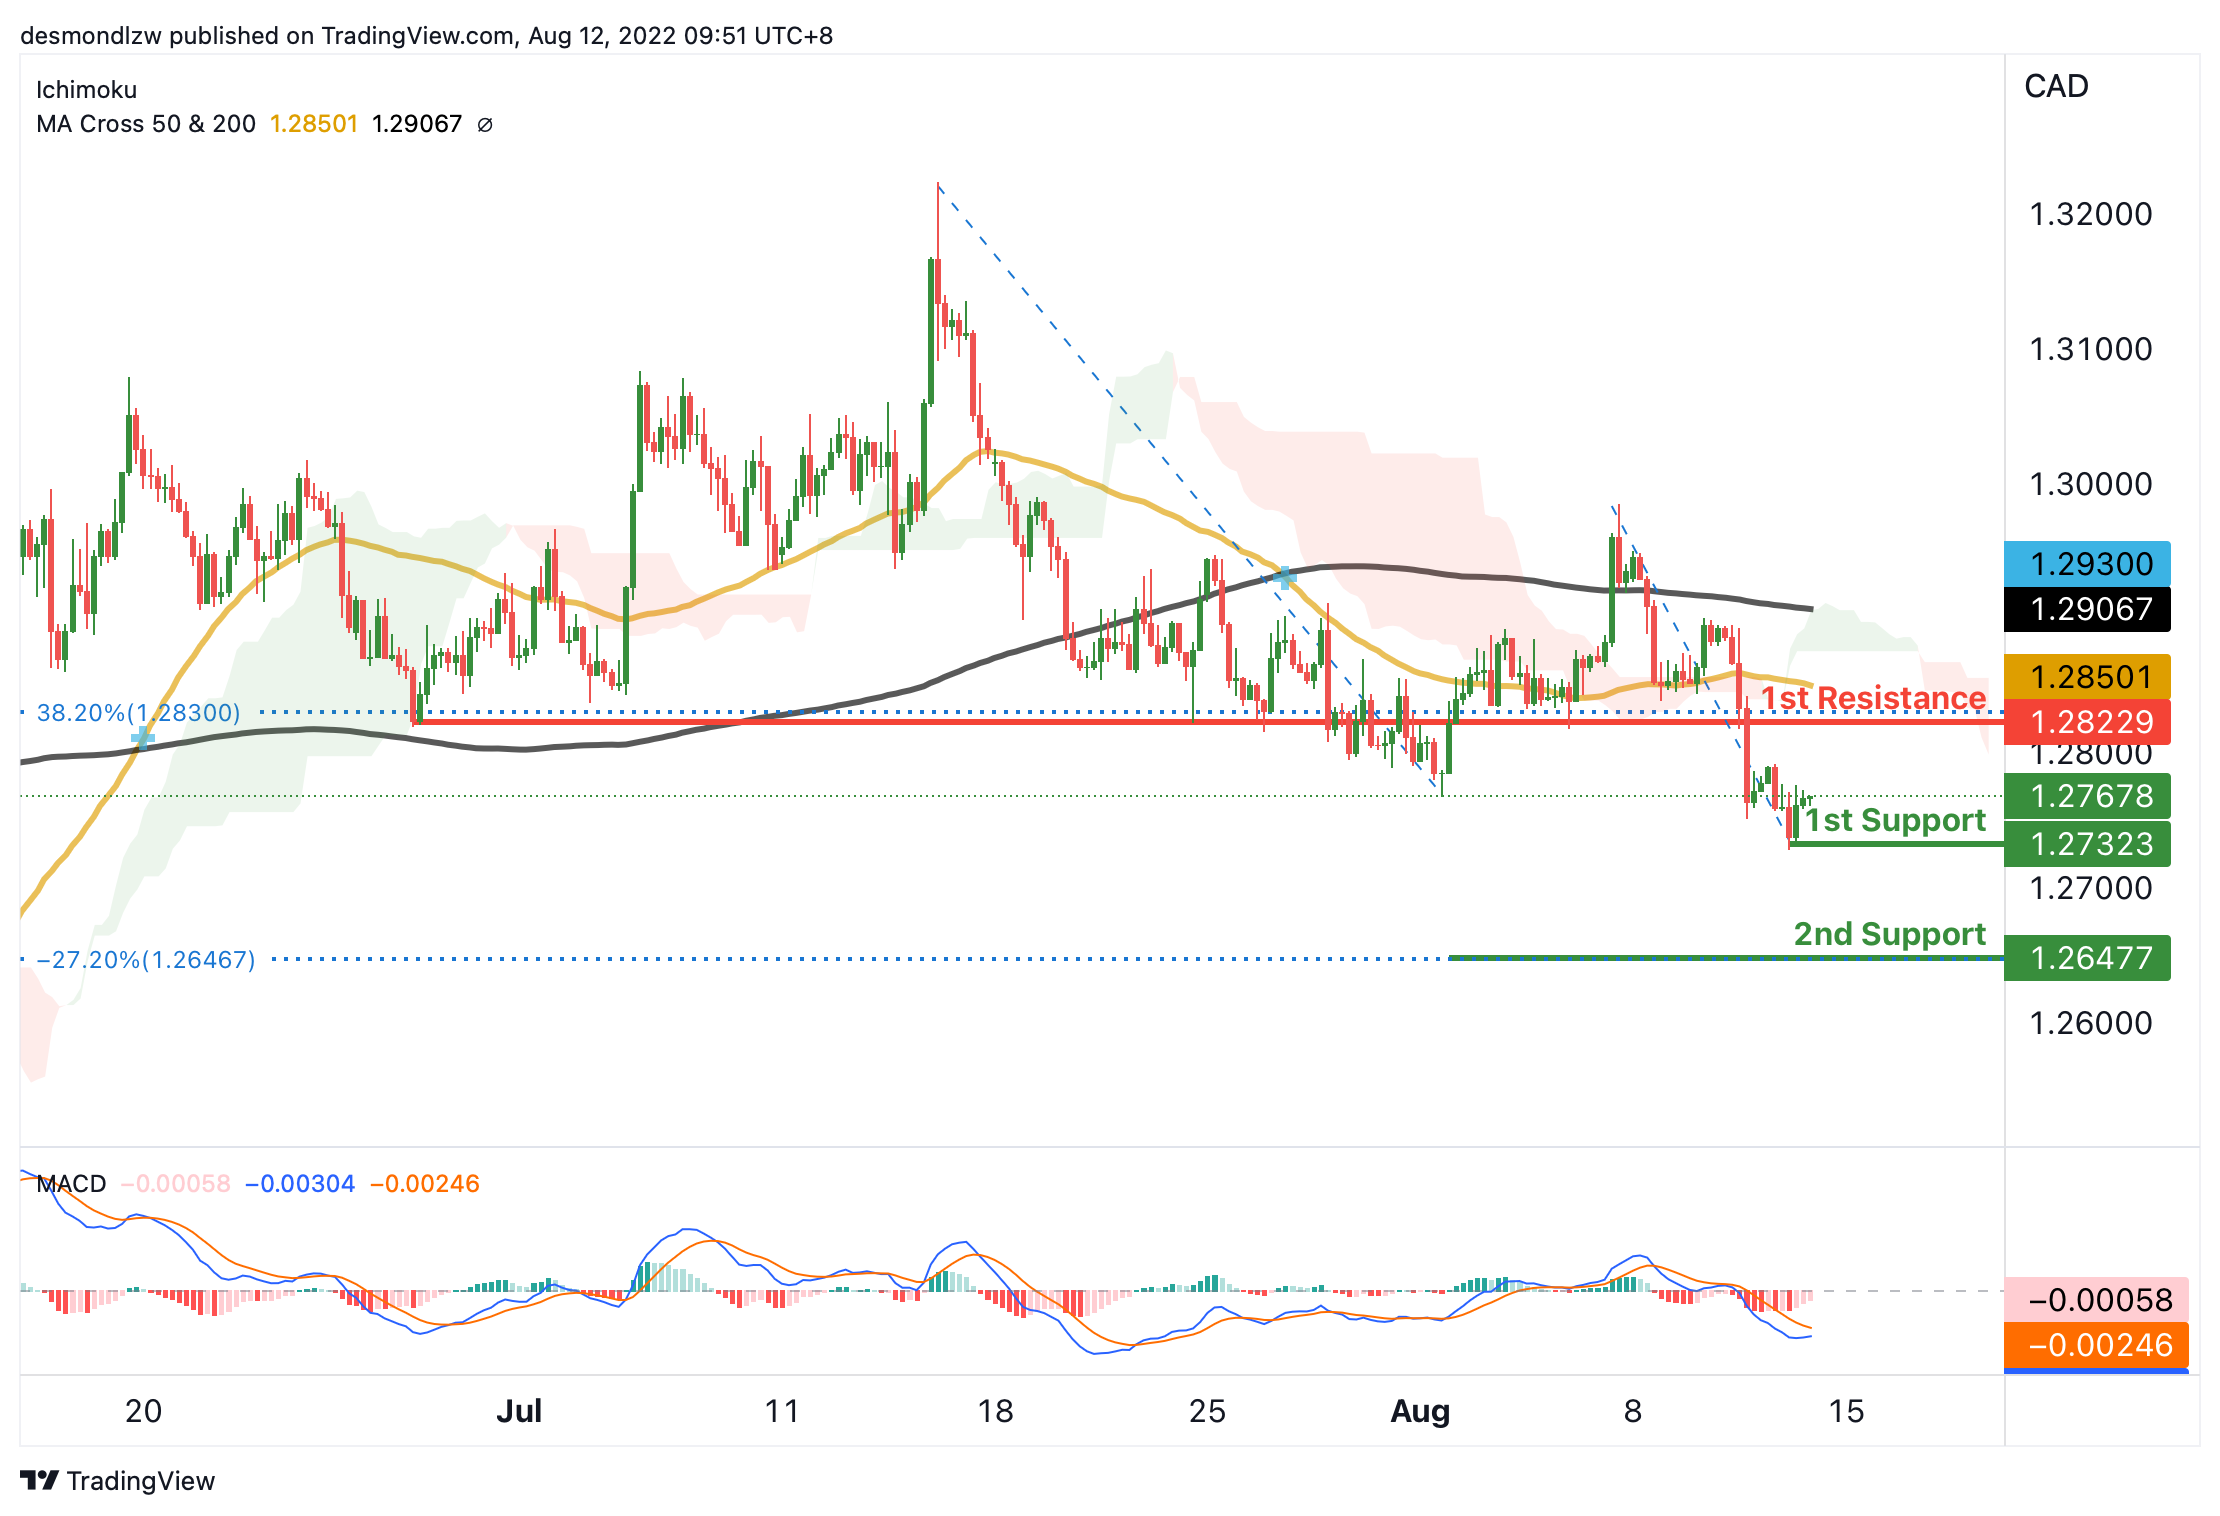
On the H4, with the price going below ichimoku cloud, and falling below 50&200 MA, MACD histograms are below zero axis , we have a bearish bias that the price may drop from our 1st support at 1.27323, which is in line with the swing low to our 2nd support at 1.26477, which is in line with the -27.2% fibonacci expansion. Alternatively, as the histograms are shrinking to zero, the price may rise to the 1st resistance at 1.28229, which is in line with 38.2% fibonacci retracement and swing low.
Areas of consideration:
- H4 time frame, 1st support at 1.27323
- H4 time frame, 2nd support at 1.26477
OIL:
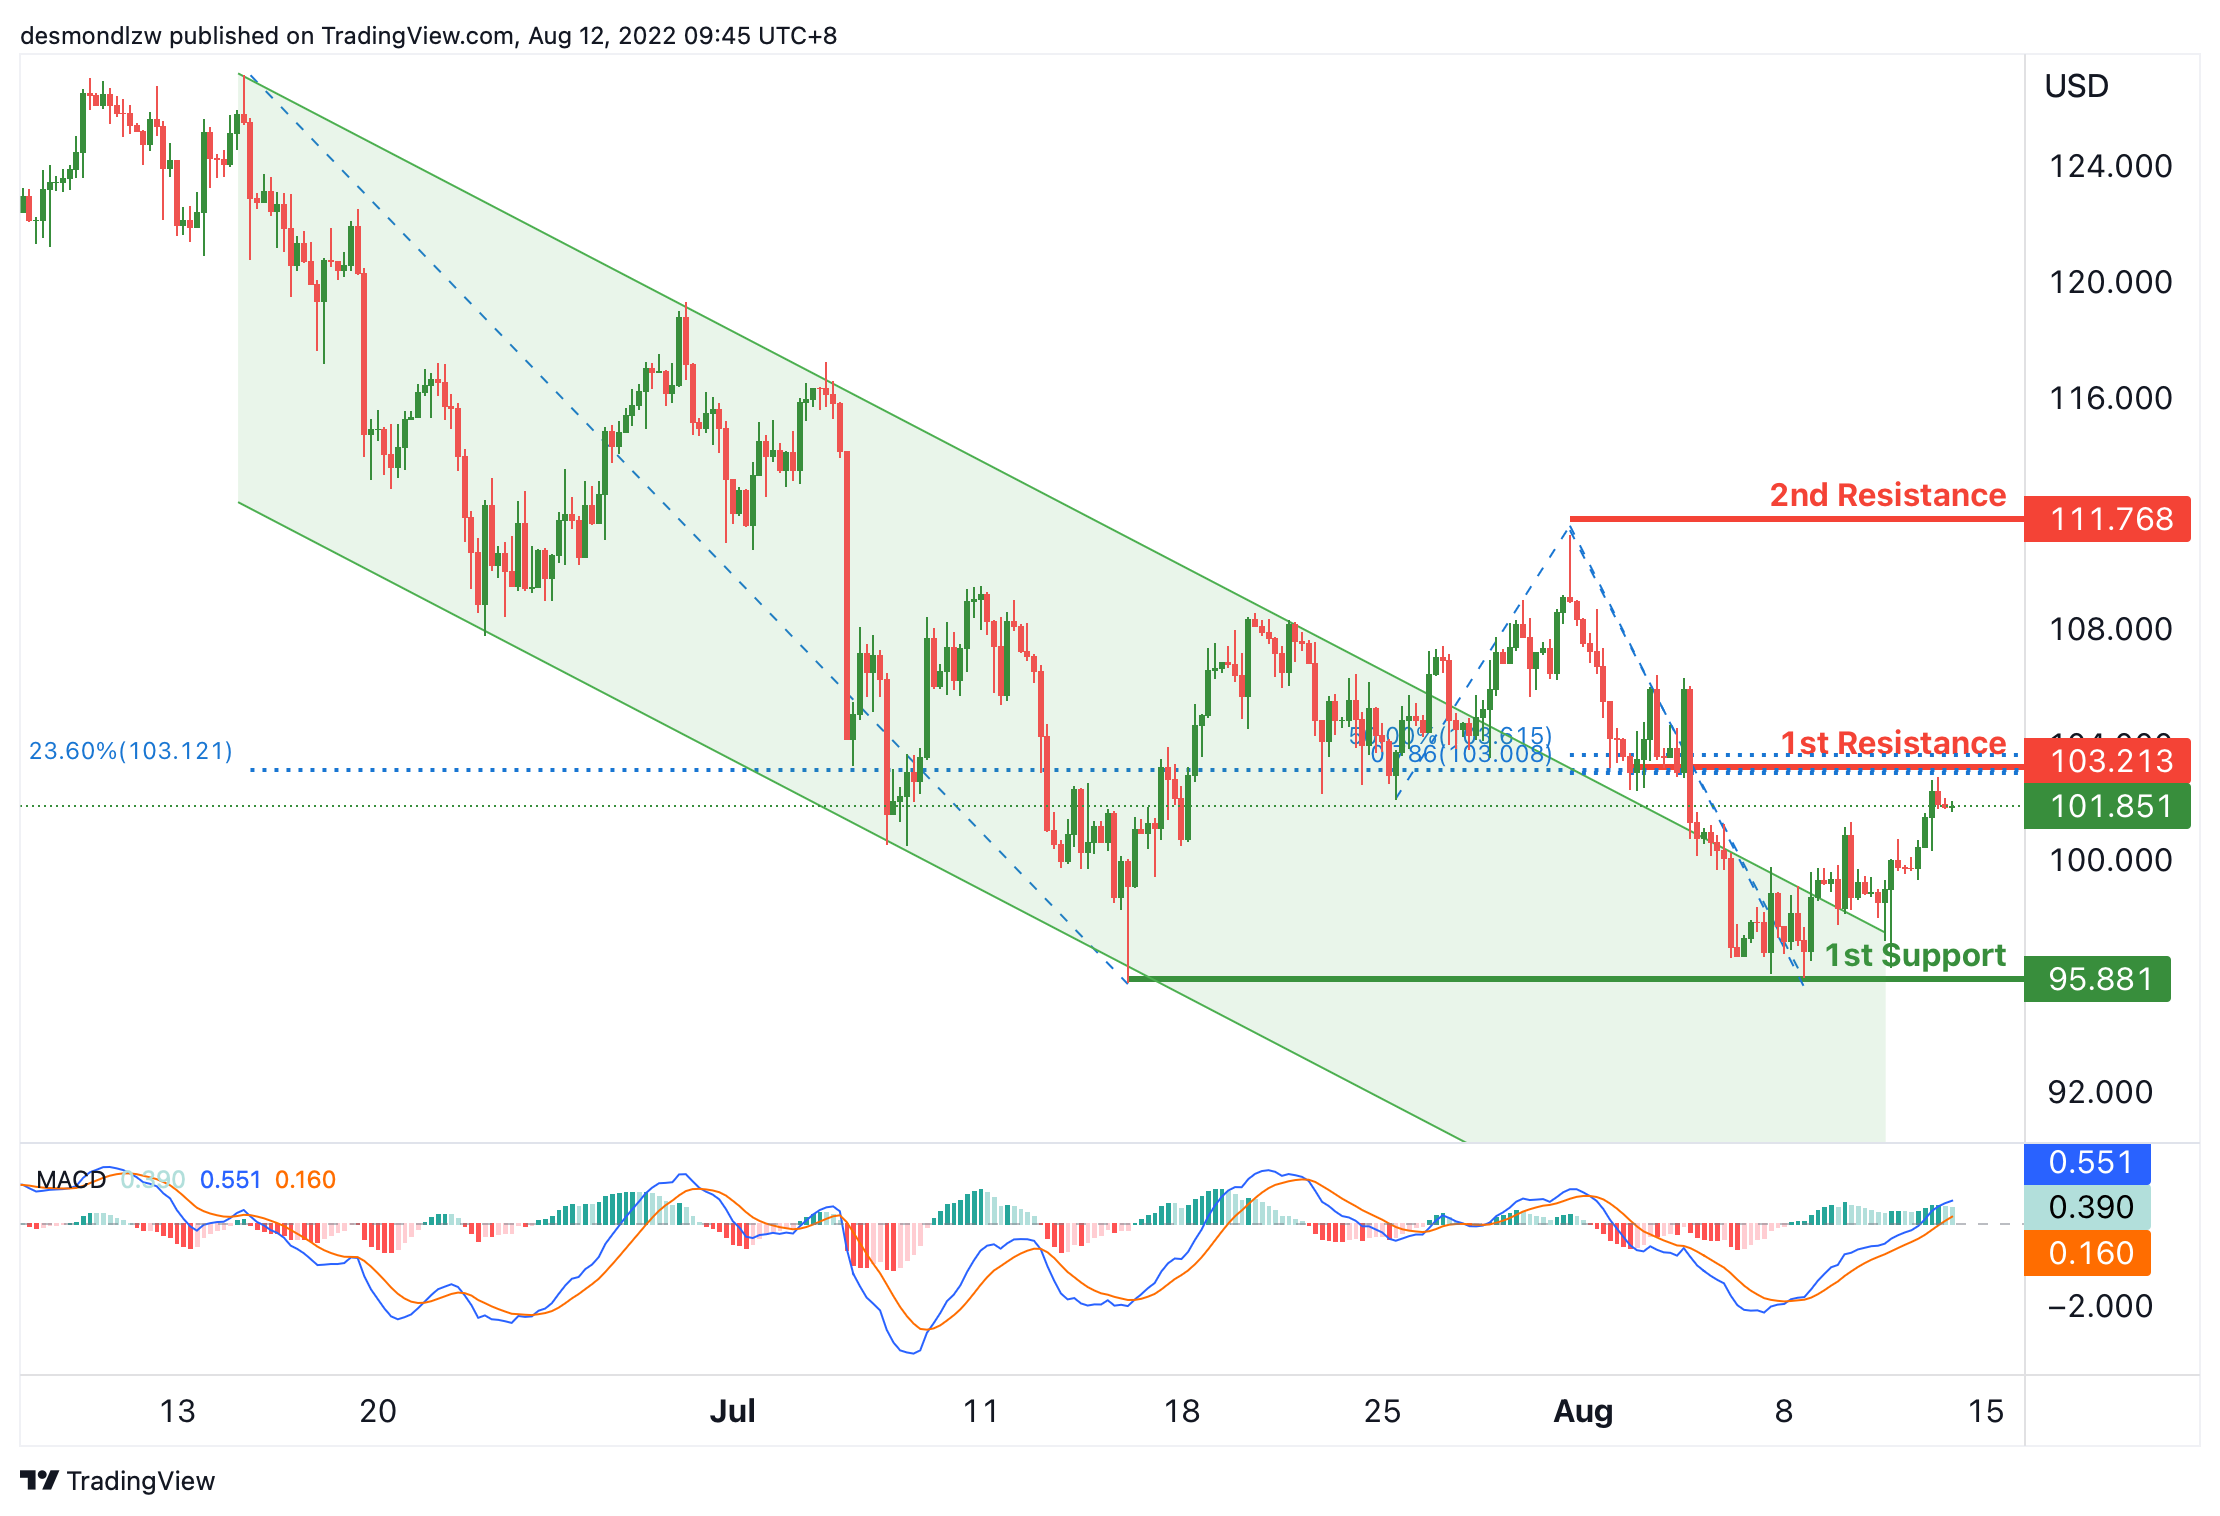
On the H4, with price braking the descending trendline, and the histograms of MACD are above zero axis, we have a bullish bias that the price may rise from our 1st resistance at 103.213, which is in line with the 23.6% fibonacci retracement, overlap resistance, 50% fibonacci retracement and 78.6% fibonacci projection to the 2nd resistance at 111.768, which is in line with the swing high. Otherwise, the price may drop to our 1st support at 95.881, where the swing low support is.
Areas of consideration:
- H4 time frame, 1st resistance at 103.213
- H4 time frame, 2nd resistance at 111.768
Dow Jones Industrial Average:
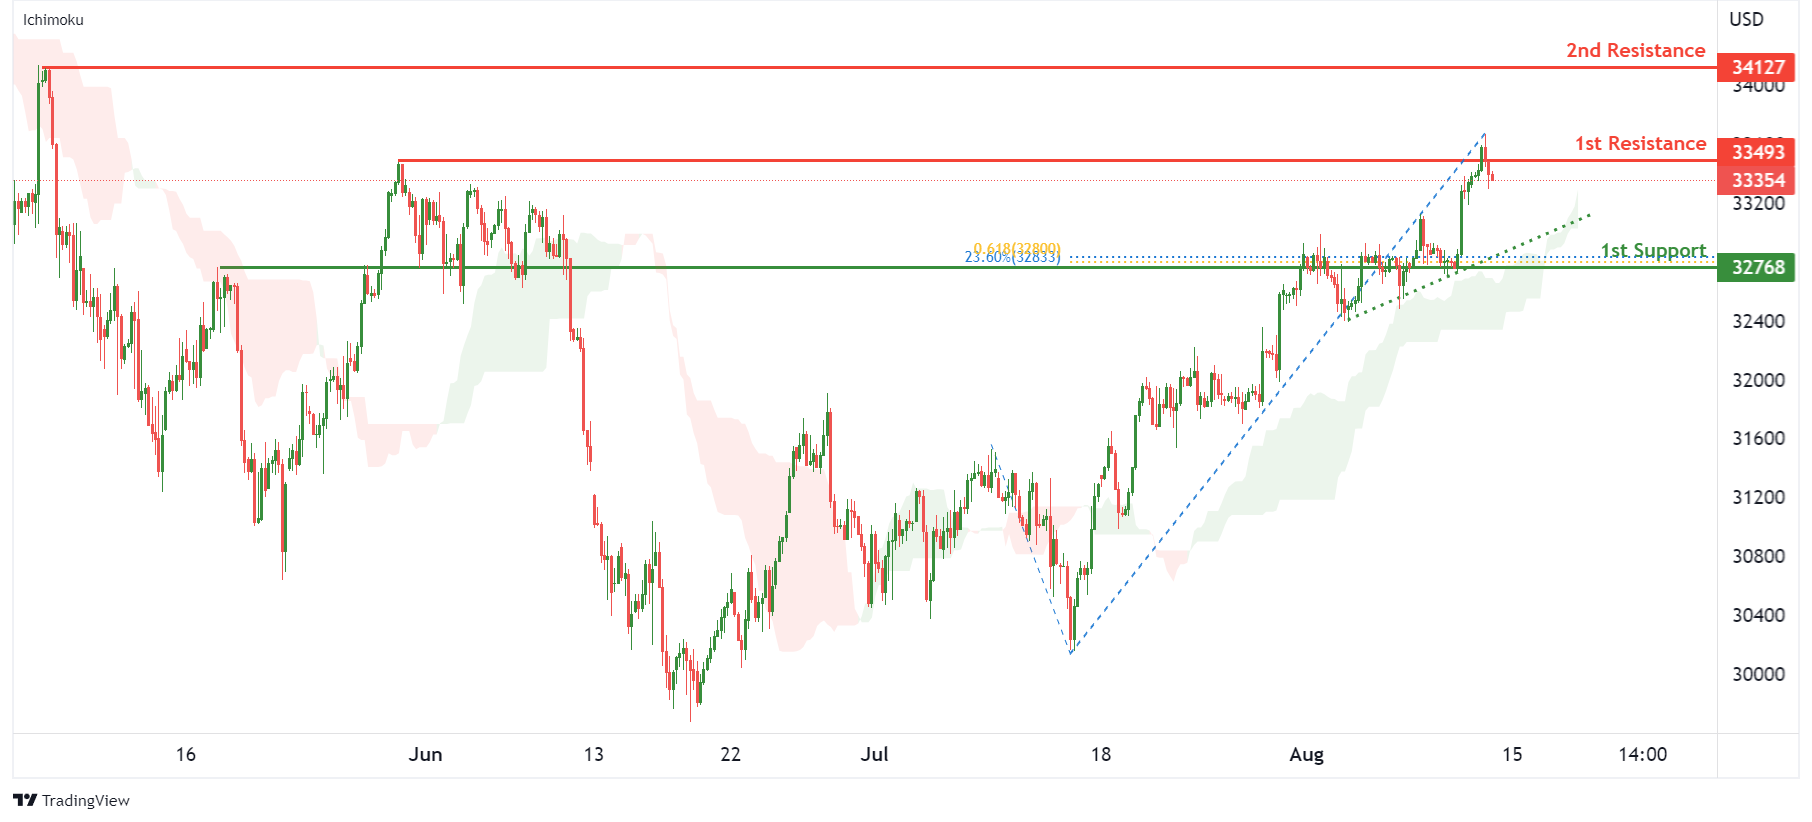
On the H4, with price moving above the ichimoku indicator and along an ascending trendline, we have a bullish bias that price will rise to 1st resistance at 33493 where the pullback resistance is. Once there is upside confirmation that price has broken 1st resistance structure, we would expect bullish momentum to carry price to 2nd resistance at 34127 in line with swing high resistance. Alternatively, price could drop to 1st support at 32768 where the pullback support, 23.6% fibonacci retracement and 61.8% fibonacci projection are.
Areas of consideration:
- H4 time frame, 1st resistance of 33493
- H4 time frame, 1st support at 32768
DAX:
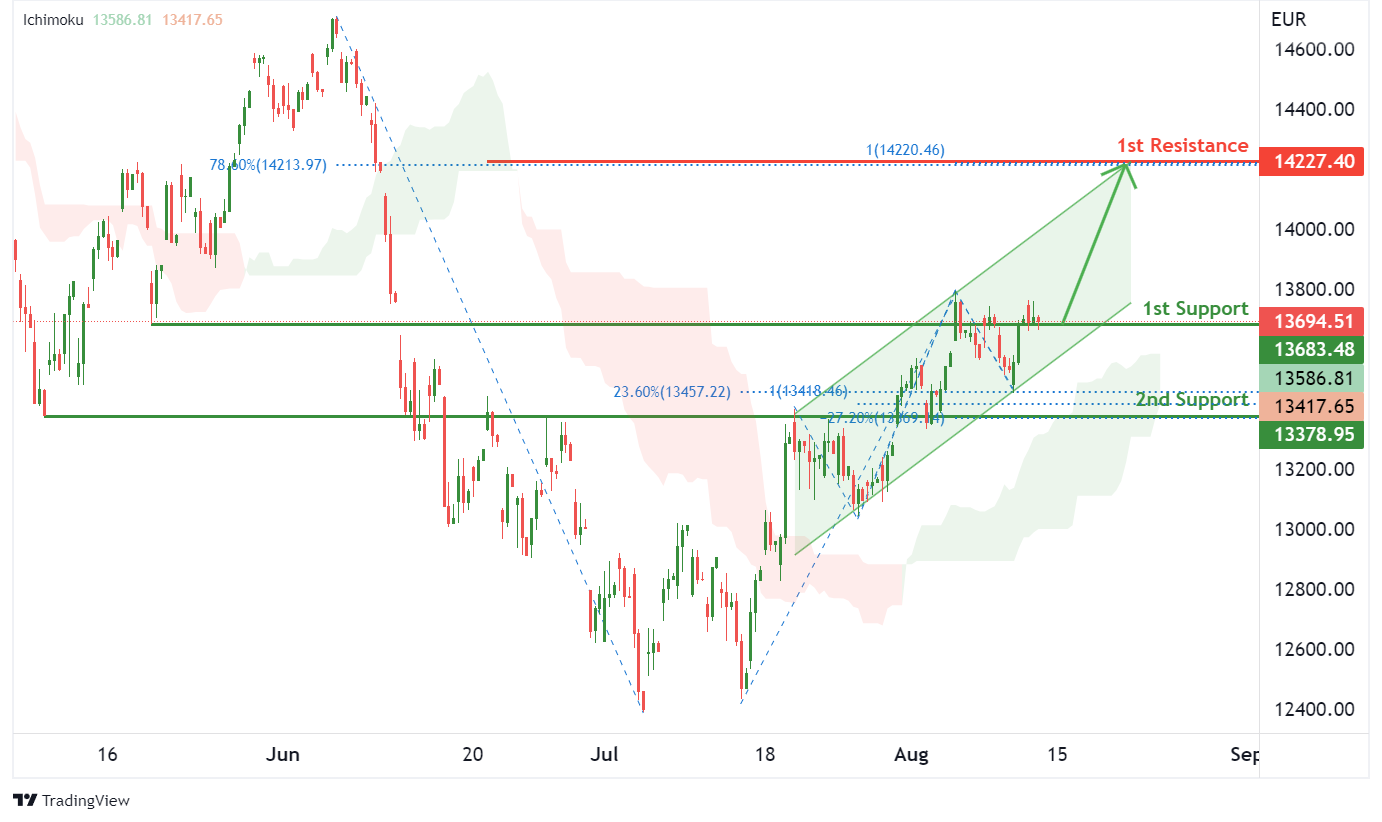
On the H4, with price moving above the ichimoku indicator and within the ascending channel, we have a bullish bias that price will rise from 1st support at 13683.48 where the pullback support is to the 1st resistance at 14227.40 in line with 100% fibonacci projection and 78.6% fibonacci retracement. Alternatively, price could break 1st support and drop to 2nd support at 13378.95 where the overlap support, -27.2% fibonacci expansion, 100% fibonacci projection and 23.6% fibonacci retracement are.
Areas of consideration:
- H4 time frame, 1st resistance of 14227.40
- H4 time frame, 1st support at 13683.48
ETHUSD:
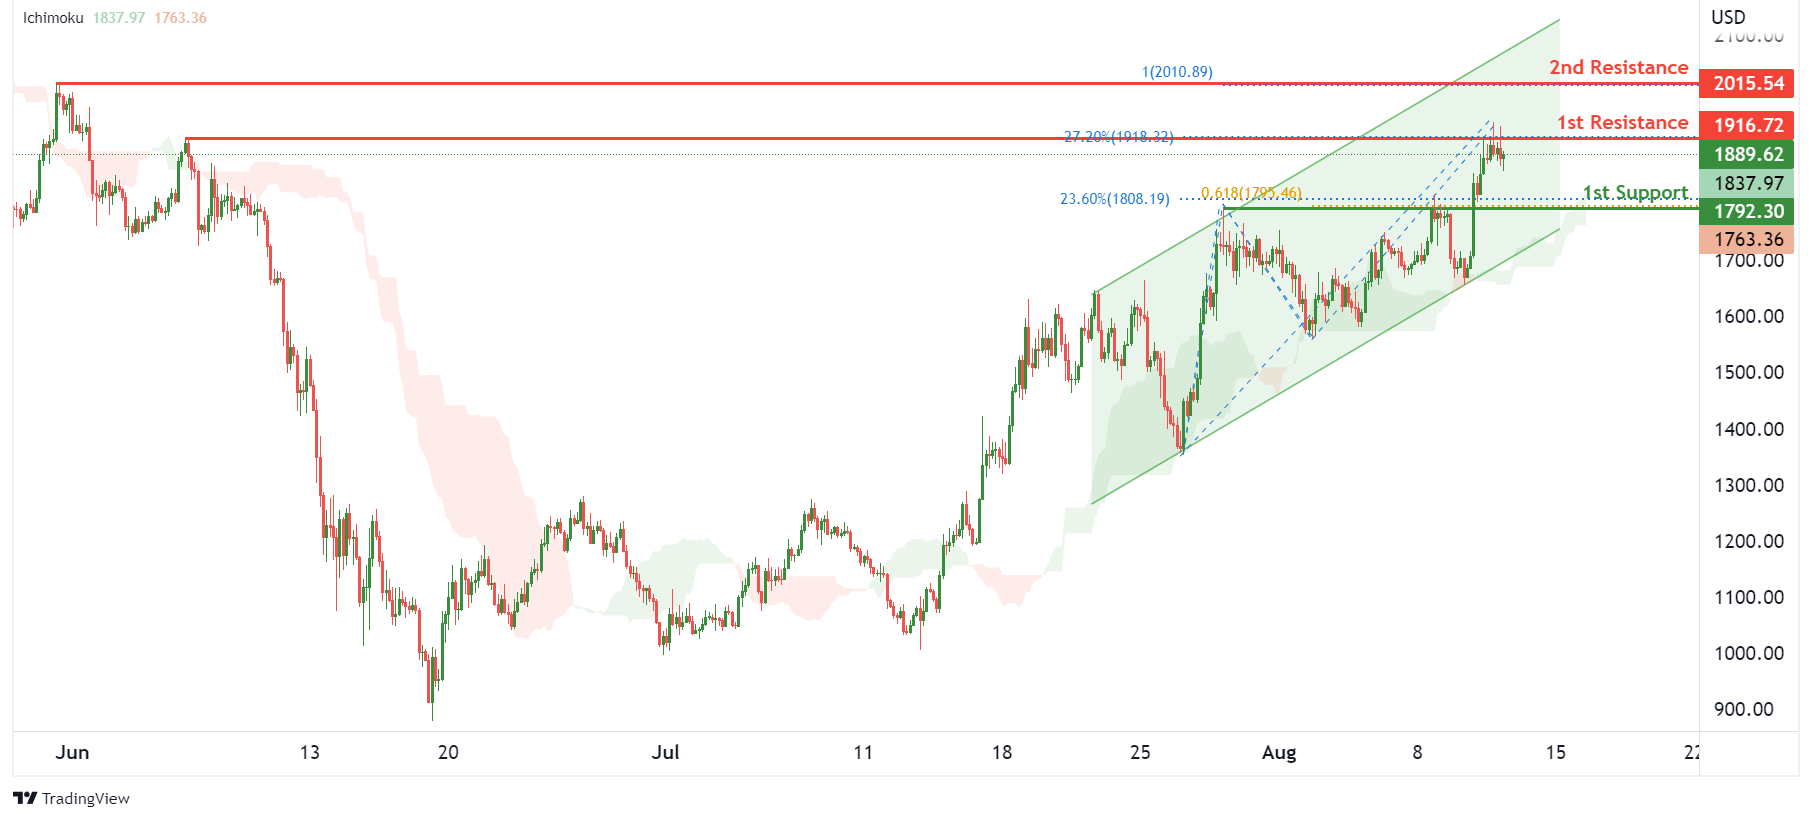
On the H4, with price moving within an ascending channel and above the ichimoku indicator, we have a bullish bias that price will rise to 1st resistance at 1916.72 where the -27.2% fibonacci expansion and swing high resistance are. Once there is upside confirmation that price has broken 1st resistance structure, we would expect bullish momentum to carry price to 2nd resistance at 2015.54 in line with swing high resistance and 100% fibonacci projection. Alternatively, price could drop to 1st support at 1792.30 where the overlap support, 23.6% fibonacci retracement and 61.8% fibonacci projection.
Areas of consideration:
- H4 time frame, 1st resistance of 1916.72
- H4 time frame, 1st support at 1792.30
BTCUSD:
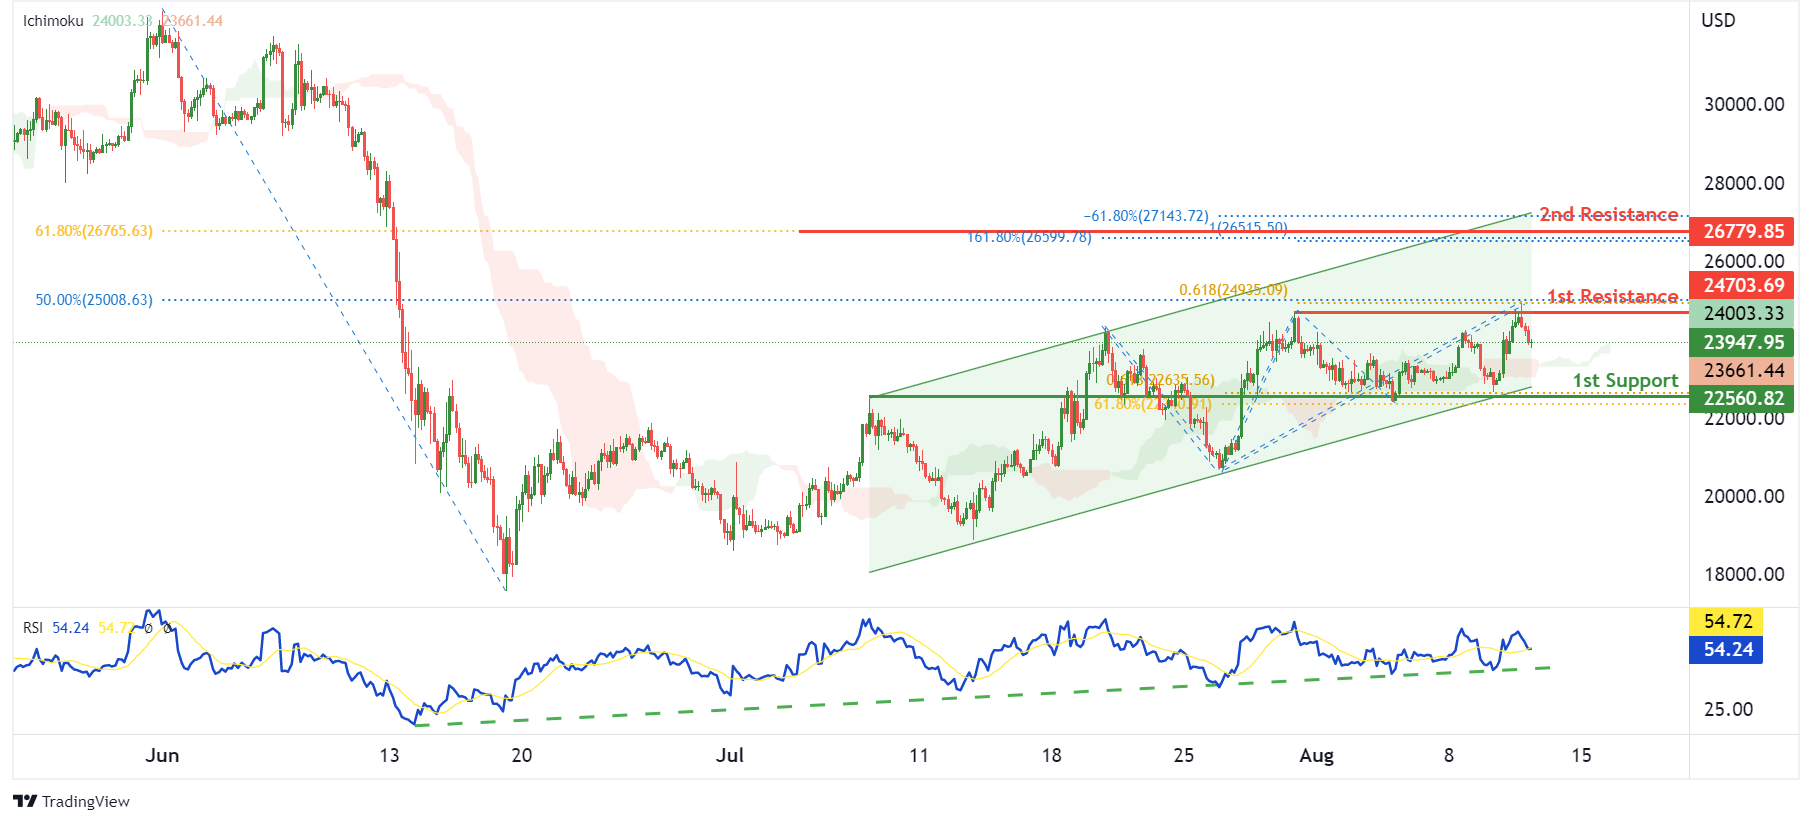
On the H4, with price moving within a bullish channel as well as above the ichimoku indicator and RSI moving along an ascending trendline, we have a bullish bias that price will rise to our 1st resistance at 24703.69 where the swing high resistance, 50% fibonacci retracement and 61.8% fibonacci projection are. Once there is upside confirmation that price has broken 1st resistance structure, we would expect bullish momentum to carry price to 2nd resistance at 26779.85 where the 61.8% fibonacci retracement, -61.8% fibonacci expansion, 161.8% fibonacci extension and 100% fibonacci projection are. Alternatively, price could drop to 1st support at 22560.82 where the pullback support, 61.8% fibonacci retracement and 61.8% fibonacci projection are.
Areas of consideration:
- H4 time frame, 1st resistance of 24703.69
- H4 time frame, 1st support at 22560.82
S&P 500:
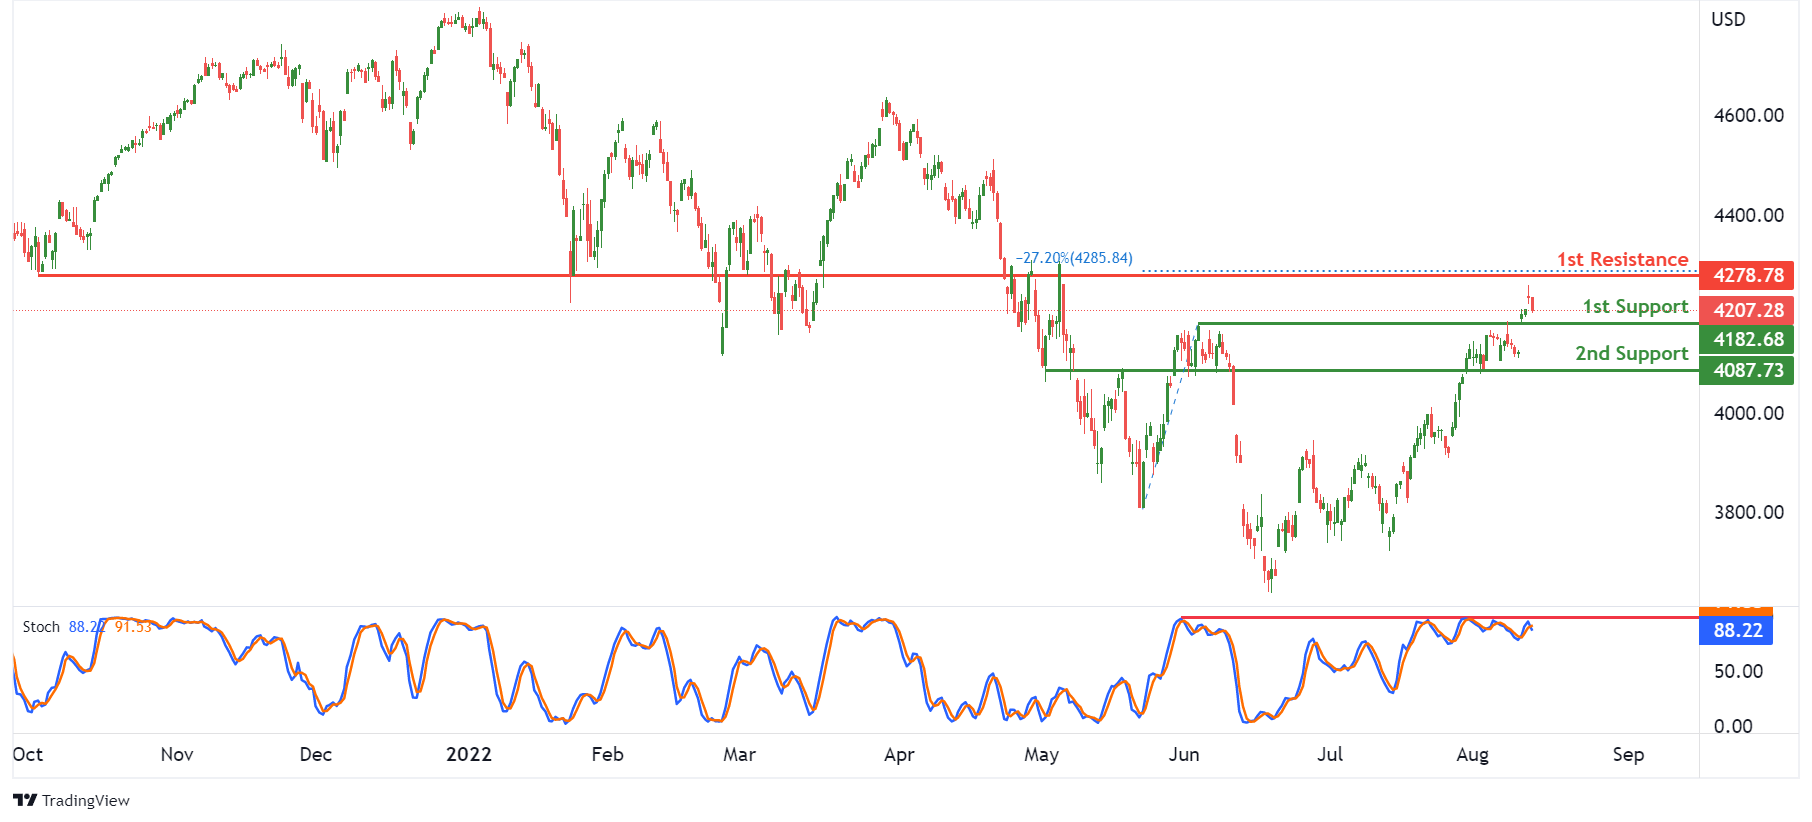
On the H4, with price reversing off the stochastic resistance, we have a bearish bias that price will drop to our 1st support at 4182.68 where the pullback support is. Once there is downside confirmation that price has broken the 1st support structure, we would expect bearish momentum to carry price to 2nd support at 4087.73 where the pullback support is. Alternatively, price could rise to 1st resistance at 4278.78 where the overlap resistance and -27.2% fibonacci expansion are.
Areas of consideration:
- H4 time frame, 1st resistance of 4278.78
- H4 time frame, 1st support at 4182.68
Cliff Notes: Conflicting Opinions on the State of the Economy
Key insights from the week that was.
This week provided cause for optimism over US inflation and global equity markets rallied as a result. Domestically, strength was seen in business conditions and confidence, but consumer sentiment weakened further under the weight of real income loss and rising interest rates.
Beginning with Australian consumer sentiment. Our Westpac-MI consumer sentiment survey fell another 3% in August, taking the index down to 81.2, almost 23% below its November 2021 peak. Driving this decline has been a marked deterioration in views over the economy’s prospects for the year ahead and consumer spending on ‘major household items’, with both sub-indexes now around 30% below their prior peak. Notably this is despite confidence in the labour market remaining near record highs. While the outlook for nominal household income growth is robust, rapid inflation and rising interest rates have hit consumers’ discretionary spending capacity hard. Arguably the pace and scale of change is creating additional anxiety.
Another key theme discussed by Chief Economist Bill Evans after the release of the latest consumer sentiment survey is the hit to housing market expectations. Clearly, households have been unnerved by the acceleration in house price declines across Australia, the Westpac-MI ‘time to buy a dwelling’ index down another 2.3% in August to be 41% below its prior peak and 34% below average. House price expectations meanwhile slumped 7.5% in August to also be 41% below its prior peak and 23% below average. For a detailed view of the outlook for housing, see our latest Market Outlook in Conversation podcast.
The strength evident in business conditions and confidence in July is a stark contrast to the state of the economy according to the consumer. Consistent with our view of the economy, the NAB business survey indicates Australian businesses experienced a strong start to Q3. Tailwinds from earlier policy stimulus and the burst in activity associated with re-opening look to not only be supporting strong conditions and capacity utilisation now but also robust growth in new orders. Business confidence also showed strength in the month, although the intensification of cost pressures and ongoing labour market tightness points to a degree of fragility. Confidence and conditions will be tested further over the coming months as the RBA’s tightening cycle impacts end demand and capacity constraints continue to be felt.
Moving offshore, it has been a particularly interesting week for the US. Last Friday, nonfarm payrolls surprised materially to the upside, with 528k jobs reportedly created in July. Hourly earnings also beat expectations in the month, gaining 0.5%. These outcomes were seen by the market as potential concerns for the FOMC because strong growth in employment and wages has the potential to prolong the current historic inflation episode. But, as discussed in Market Outlook in Conversation, other data for the labour market conflict with nonfarm payrolls, instead indicating a material deterioration in conditions is underway.
Of late, job openings and the hiring rate have turned down, and initial claims have begun to edge higher. But most importantly, whereas nonfarm payrolls suggest almost 1.7 million jobs have been added to the US economy over the past four months, the household survey indicates 170k people have lost or left their jobs over the same period. In part, this is a matter of timing, with the household survey stronger in 2021; but it is also a consequence of nonfarm payrolls counting the number of jobs not the people employed – with the cost of living having risen as much as it has and wage outcomes disparate, there is currently good reason for an individual to seek a second or third job. We also have to recognise that the payrolls count assumes new businesses are always being established and begin hiring immediately, with the validity of the assumption not tested until data becomes available a year later.
A slower pace of job creation and household income would be a challenging headwind for the US economy to face currently given the state of consumer confidence and the rapid pace of inflation. On the latter at least, this week brought some good news, with the detail of the July CPI report providing strong evidence that the US is past peak inflation. On a 6-month annualised basis, the inflation that came as a result of pandemic supply disruptions looks to be coming to an end; and, in the past two months, clear evidence has emerged of prices pressures from service sector re-opening beginning to dissipate. Further, that wage growth is materially below the pace of inflation and, on some measures, is slowing faster points to little-to-no support for a new wave of demand-driven inflation over the coming year. We therefore remain of the view that US inflation will slow further into end-2022 and be back near the FOMC’s 2.0%yr target by end-2023, allowing the FOMC to conclude their rate hike cycle at 3.375% this December and then begin a sequence of rate cuts from December quarter 2023.
Finally on China. The trade data beat expectations yet again in July, with annual growth in exports holding around 18%yr. While annual CPI inflation lifted in the month, at 2.7%yr it is low versus the developed world; further, the deceleration in the PPI in July points to limited upside risk ahead. The primary economic concern for China therefore remains the spread of COVID-19 within its borders. The virus is seemingly under control in key production regions. But outbreaks in prime tourist regions such as Hainan raise the risk of the virus spreading more broadly across the nation, and consumers consequently deciding to delay or cancel planned domestic holidays. We continue to highlight that the key risk to growth in H2 2022 is the recovery in consumer spending. While early days, recent developments clearly raise the risks around this sector.
USD/JPY Turns Red, Why It Could Decline Below 130
Key Highlights
- USD/JPY started a fresh decline below the 135.00 support zone.
- A connecting bearish trend line is forming with resistance near 134.20 on the 4-hours chart.
- GBP/USD is eyeing more gains above the 1.2300 resistance zone.
- The UK GDP could contract 0.2% in Q2 2022 (QoQ) (Prelim).
USD/JPY Technical Analysis
The US Dollar started a major decline from well above the 138.00 level against the Japanese Yen. USD/JPY declined below the 135.00 support to move into a bearish zone.
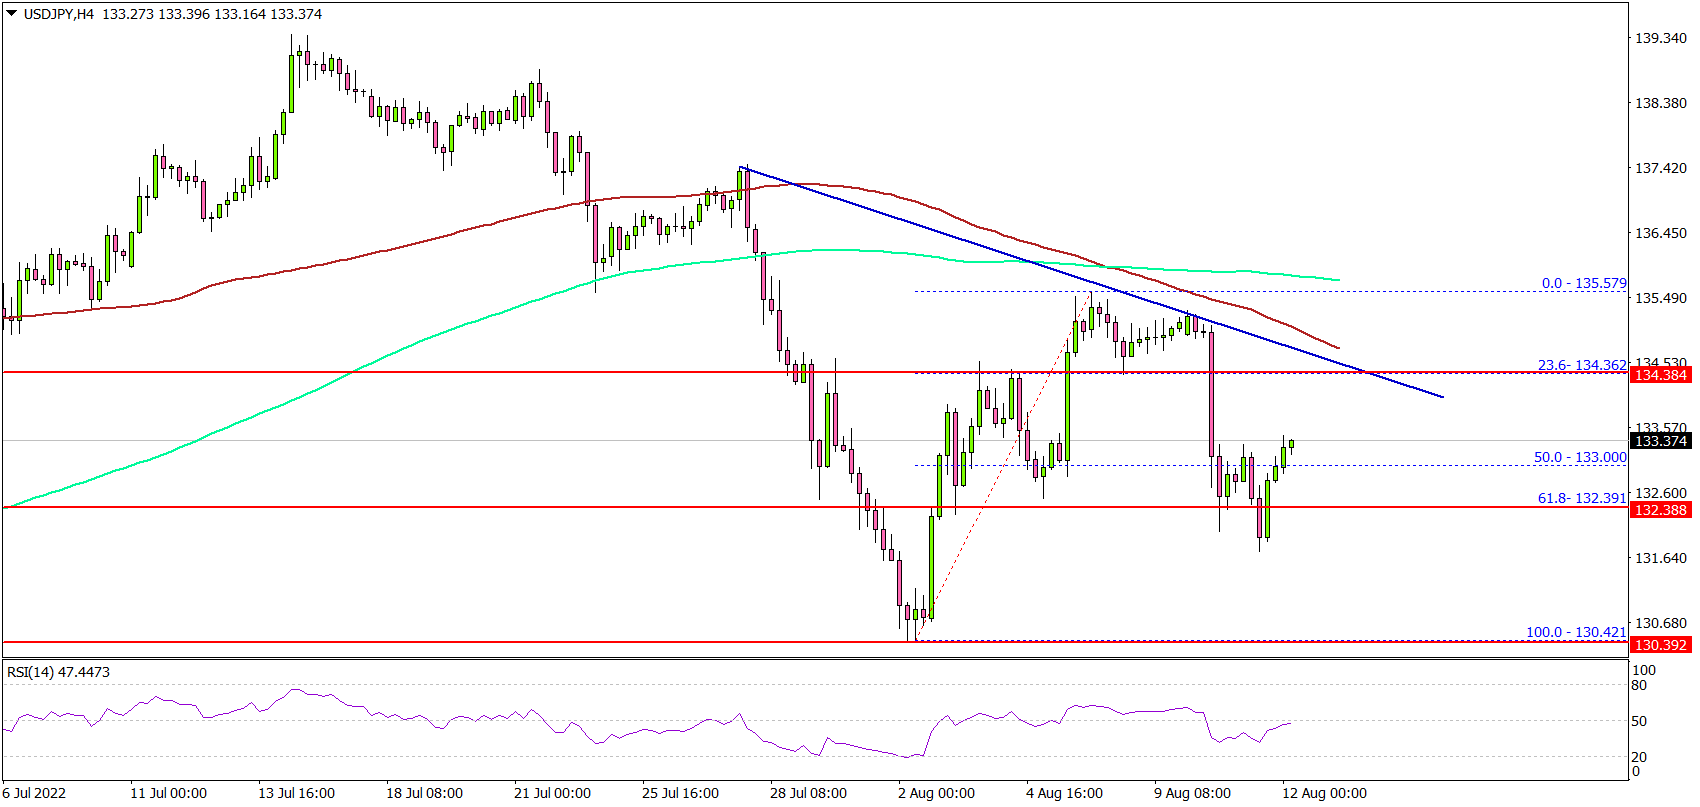
Looking at the 4-hours chart, the pair declined below the 132.00 level before it found support near the 130.40 level. This past week, there was an upside correction above the 132.00 level.
The pair climbed above the 134.00 level, but it stayed below the100 simple moving average (red, 4-hours) and the 200 simple moving average (green, 4-hours). There is also a connecting bearish trend line forming with resistance near 134.20 on the same chart.
On the downside, the first major support is near the 131.75 level. The main support is now forming near the 130.50 level. A downside break below the 130.50 support might spark more losses.
The next major support is near the 130.00 level. Any more losses might send the pair towards the 128.00 zone. On the upside, the pair is facing resistance near the 133.75 level. The next major resistance is near the 134.40 level and the trend line.
A clear move above the trend line resistance might send the pair higher towards the 136.00 level. The next major resistance is 136.80, above which the pair could accelerate higher. In the stated case, the pair could rise towards the 138.00 resistance zone in the near term.
Looking at GBP/USD, the pair remained well bid above the 1.2100 level and seems to be aiming a decent increase above the 1.2300 resistance zone.
Economic Releases
UK GDP for Q2 2022 (QoQ) (Prelim) - Forecast -0.2%, versus +0.8% previous.
AUDUSD Wave Analysis
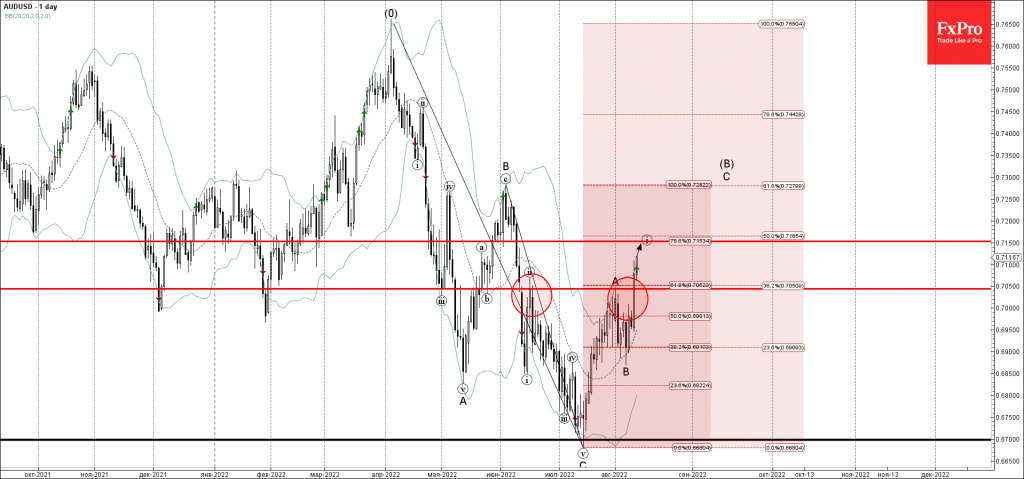
- AUDUSD broke resistance level 0.7050
- Likely to rise to resistance level 0.7150
AUDUSD currency pair recently broke the key resistance level 0.7050 (top of the earlier wave A from the start of August).
The breakout of the resistance level 0.7050 coincided with the breakout of the Fibonacci cluster made out of the 50% Fibonacci correction of the downward impulse from April and the 38.2% Fibonacci correction of the downward wave from June.
AUDUSD can be expected to rise further toward the next resistance level 0.7150 (target price for the completion of the active impulse wave (i)).
S&P 500 Wave Analysis
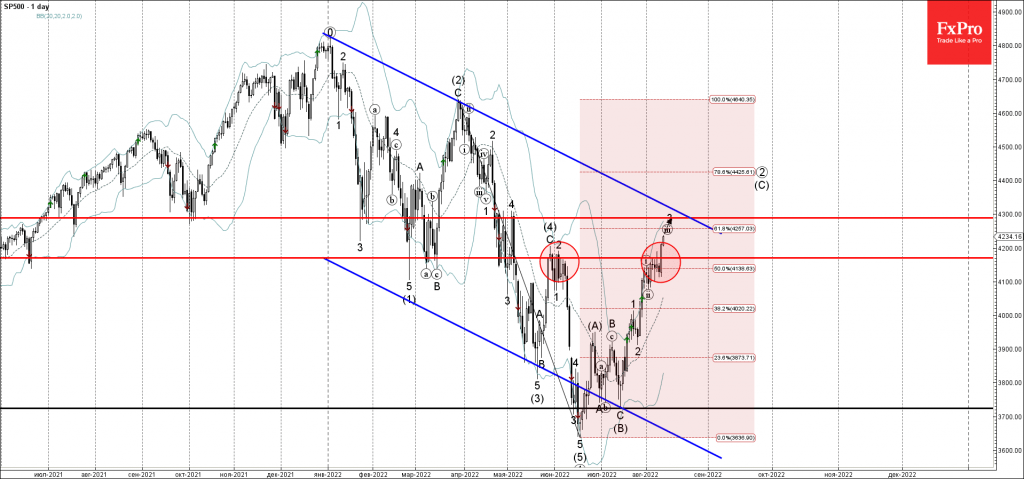
- S&P 500 rising inside impulse waves (iii) and 3
- Likely to rise to resistance level 4300.00
S&P 500 index recently broke the resistance level 4170.00 (which stopped the earlier waves (4) and 2 in May and June).
The breakout of the resistance level 4170.00 continues the active short-term impulse waves (iii) and 3 – which belong to the sharp intermediate impulse wave (C) from last month.
S&P 500 index can be expected to rise further toward the next resistance level 4300.00 (forecast price for the completion of the active impulse 3).
Eco Data 8/12/22
[php_everywhere instance="1"]
UK Prelim Q2 GDP and Recession Outlook
After their last meeting, the BOE warned that 5 quarters of negative growth were coming. The consensus of expectations shows that there could be starting with data reports from tomorrow. There is an avalanche of data before the market opens, as is customary for the UK, but naturally GDP is likely to be the main focus, particularly given the context.
The battle for leadership of the Tory party also continues, with whomever winning the vote in September becoming Prime Minister. The leader in the race so far, Liz Truss, has spoken repeatedly about intervening in the BOE to broaden its mandate. Many question whether this will hurt the bank's credibility. More importantly, a change in the mandate in the middle of an inflationary spiral could make things more difficult. On the other hand, one of the measures that Truss is proposing includes offering a rate outlook forecast, similar to the Fed's dot-plot matrix, which could help reassure markets.
It's all about the trends
Since many attributes are slowing economic growth, tightening monetary policy to fight inflation, how the BOE could react will also factor into the market's reaction to the data. If GDP is growing, then the BOE has more room to keep hiking. If GDP is starting to contract, then the presumption is that inflation will start to turn around, and the BOE will be less likely to tighten.
In this context, the BOE's projection that inflation will peak at 13 sometime later in the year implies that policy will likely remain tight, even if there is a technical move to negative growth. Technical here usually means a couple of decimal points in the red, which, while not good, isn't the same as a full-blown recession such as 2020 or 2008.
What to look out for
There are three bits of data coming out, with different levels of importance to the market. In general, the "faster" the data, the more the market cares about it. By "faster" that means the most recent, shortest interval. So, in order of importance, we will likely have June, quarterly and annual GDP change figures.
June monthly GDP is expected to show -1.3% growth compared to 0.5% prior. Monthly GDP is a lot more volatile thus it's easier to dismiss a large move. But for markets already sensitive to bad news, this could be interpreted as an acceleration to the downside in the near term.
The other market moving points
Quarterly GDP is likely to get the most attention, as it's expected to show -0.2% growth, compared to +0.8% in the prior quarter. If the forecast is met, that could be the first of negative growth of two needed to technically talk about a recession. But it's such a low margin, that a beat of just two decimals could have an important psychological impact on the markets as well. Annual GDP is projected to show 1.3% growth compared to 3.5% prior. While this on the surface appears to be a strong deceleration, this probably has more to do with comparables. Last year's spring was much better for the economy than the winter, which is why there is a bigger difference between Q1 and Q2. It's not as indicative of the move over the first half of this year, as of what happened last year.
Pound Steady ahead of GDP
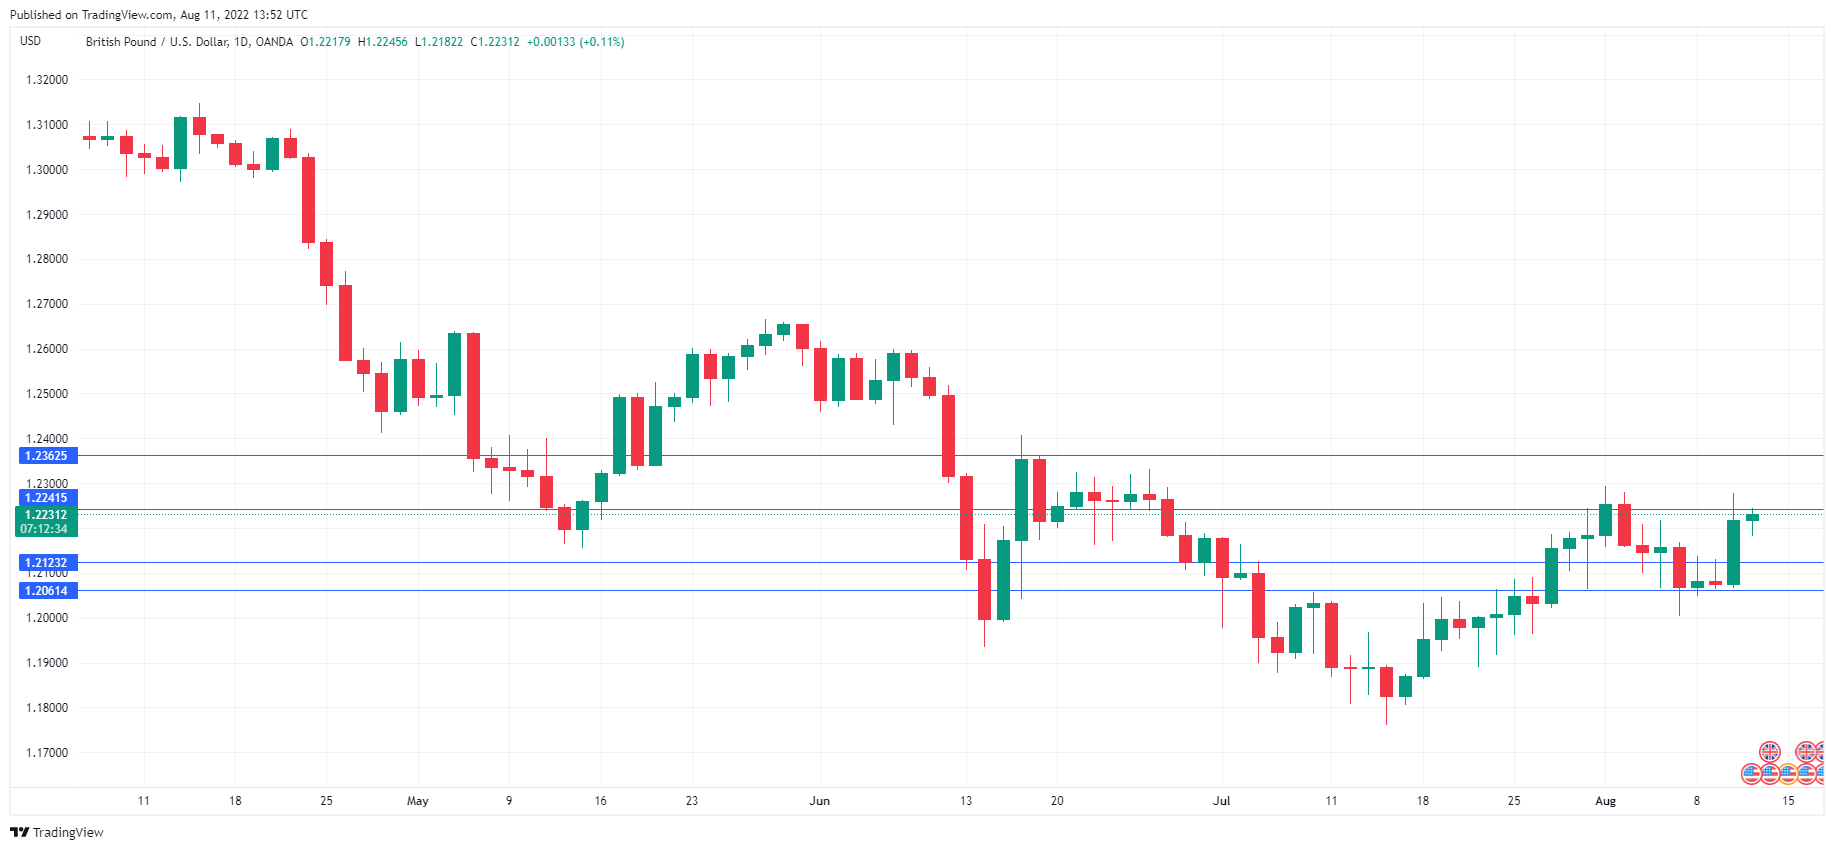
The British pound is trading quietly today, after posting sharp gains on Wednesday. In the North American session, GBP/USD is trading at 1.2220, up 0.02% on the day.
US inflation falls, dollar takes a tumble
US inflation surprised on Wednesday, as both the CPI and the core CPI readings were lower than expected. Headline CPI dropped sharply to 8.5%, down from 9.1% in June and below the estimate of 8.7%. Core CPI remained steady at 5.9%, below the forecast of 6.1%. After months of inflation climbing higher, there was palpable relief in the markets as the headline reading finally broke the upward trend. The US dollar was roughed up, dropping sharply against the major currencies. GBP/USD rose an impressive 1.19% yesterday.
The Federal Reserve is breathing easier as inflation has finally slowed, and it is more likely now than 24 hours ago that the Fed will ease up on rate hikes and deliver a 0.50% increase in September rather than a 0.75% hike. Nevertheless, it would be premature to declare that the inflation dragon has been slayed and the Fed will soon pivot with regard to rate policy. The inflation rate of 8.5%, although lower than last month, is still close to a four-decade high. Inflation fell chiefly due to a drop in gas prices, but with the volatility we are seeing in the oil markets, gasoline could quickly change directions. Perhaps most importantly, inflation remains broad-based; the core reading, which excludes food and energy costs, remained steady at 5.9%.
Fed members left no doubt that despite the positive CPI report, more tightening was on the way. Minneapolis Fed President Kashkari said that the Fed was “far, far away from declaring victory” over inflation, and Chicago Fed President Evans said that inflation remained “unacceptably” high. With the Fed looking to increase the benchmark rate to 4% or higher by the end of 2023, there is plenty of shelf life remaining in the Fed’s rate-tightening cycle.
In the UK, the week wraps up with Friday’s GDP report for Q2. The markets are bracing for a soft release – GDP is expected to slow to 2.8% YoY, down from 8.7% in Q1. On a quarterly basis, GDP is projected at -0.2%, following a 0.8% gain in Q1. The pound received a huge lift on Wednesday courtesy of US inflation. If GDP is weaker than expected, the pound will likely lose ground.
GBP/USD Technical
- GBP/USD continues to test resistance at 1.2241. Next, there is resistance at 1.2361
- There is support at 1.2123 and 1.2061