

Sample Category Title
US initial jobless claims rose 14k to 262k
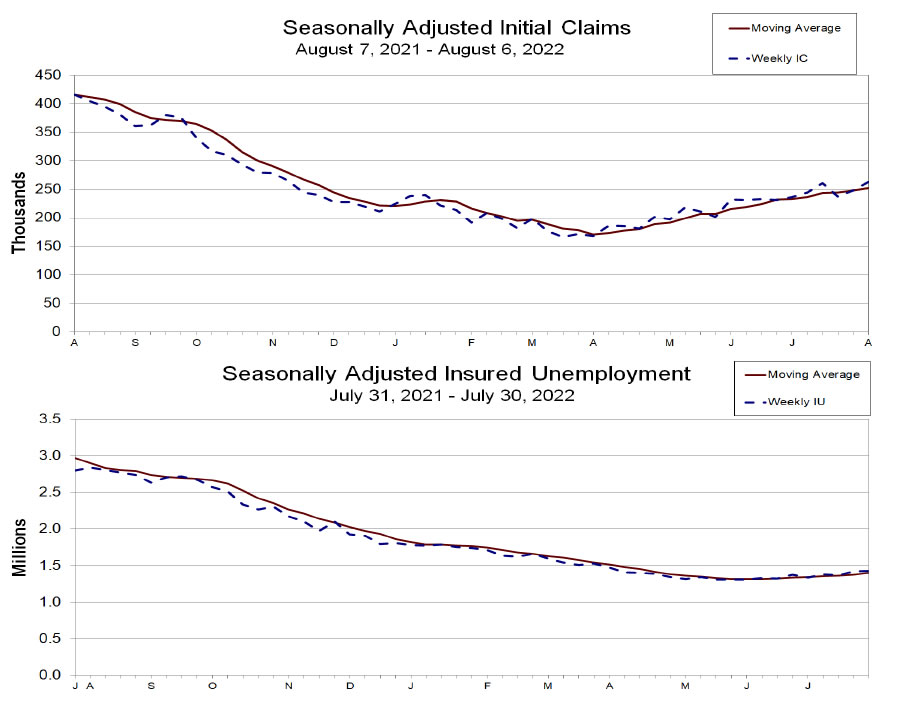
US initial jobless claims rose 14k to 262k in the week ending August 6, slightly below expectation of 265k. Four-week moving average of initial claims rose 4.5k to 252k.
Continuing claims rose 8k to 1428k in the week ending July 30. Four-week moving average of continuing claims rose 24k to 1399k.
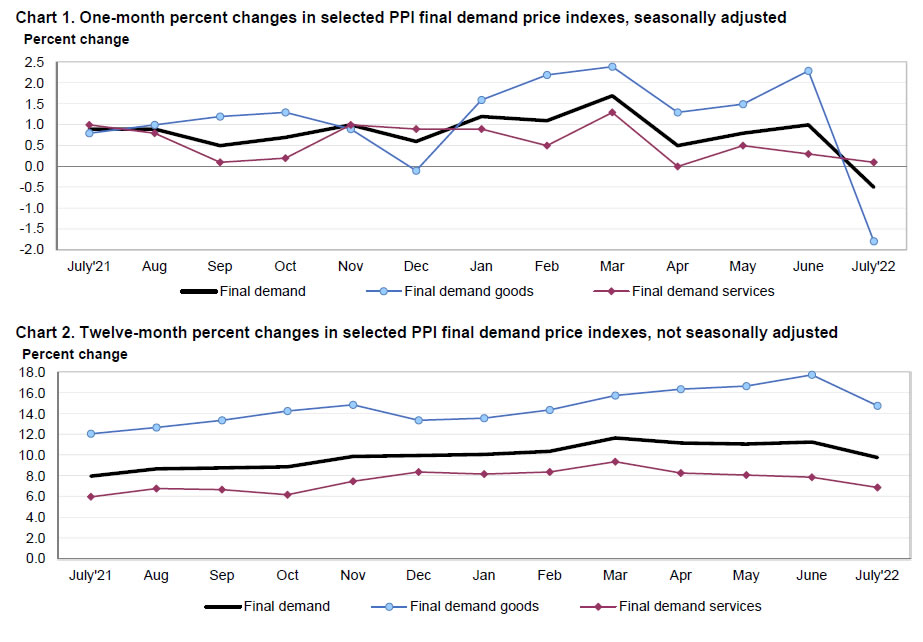
US PPI down -0.5% mom in Jul, slowed to 9.8% yoy
US PPI for final demand dropped -0.5% mom in July, versus expectation of 0.2% mom rise. The decrease is attributable to -1.8% mom decline in goods while services rose 0.1% mom. For the 12-months, PPI rose 9.8% yoy, slowed from June's 11.3% yoy.
Prices for final demand less foods, energy and trade services rose 0.2% mom. For the 12 months, PPI less foods, energy and trade services rose 5.8% yoy.
EURCHF Approaches SNB Flash Crash Low
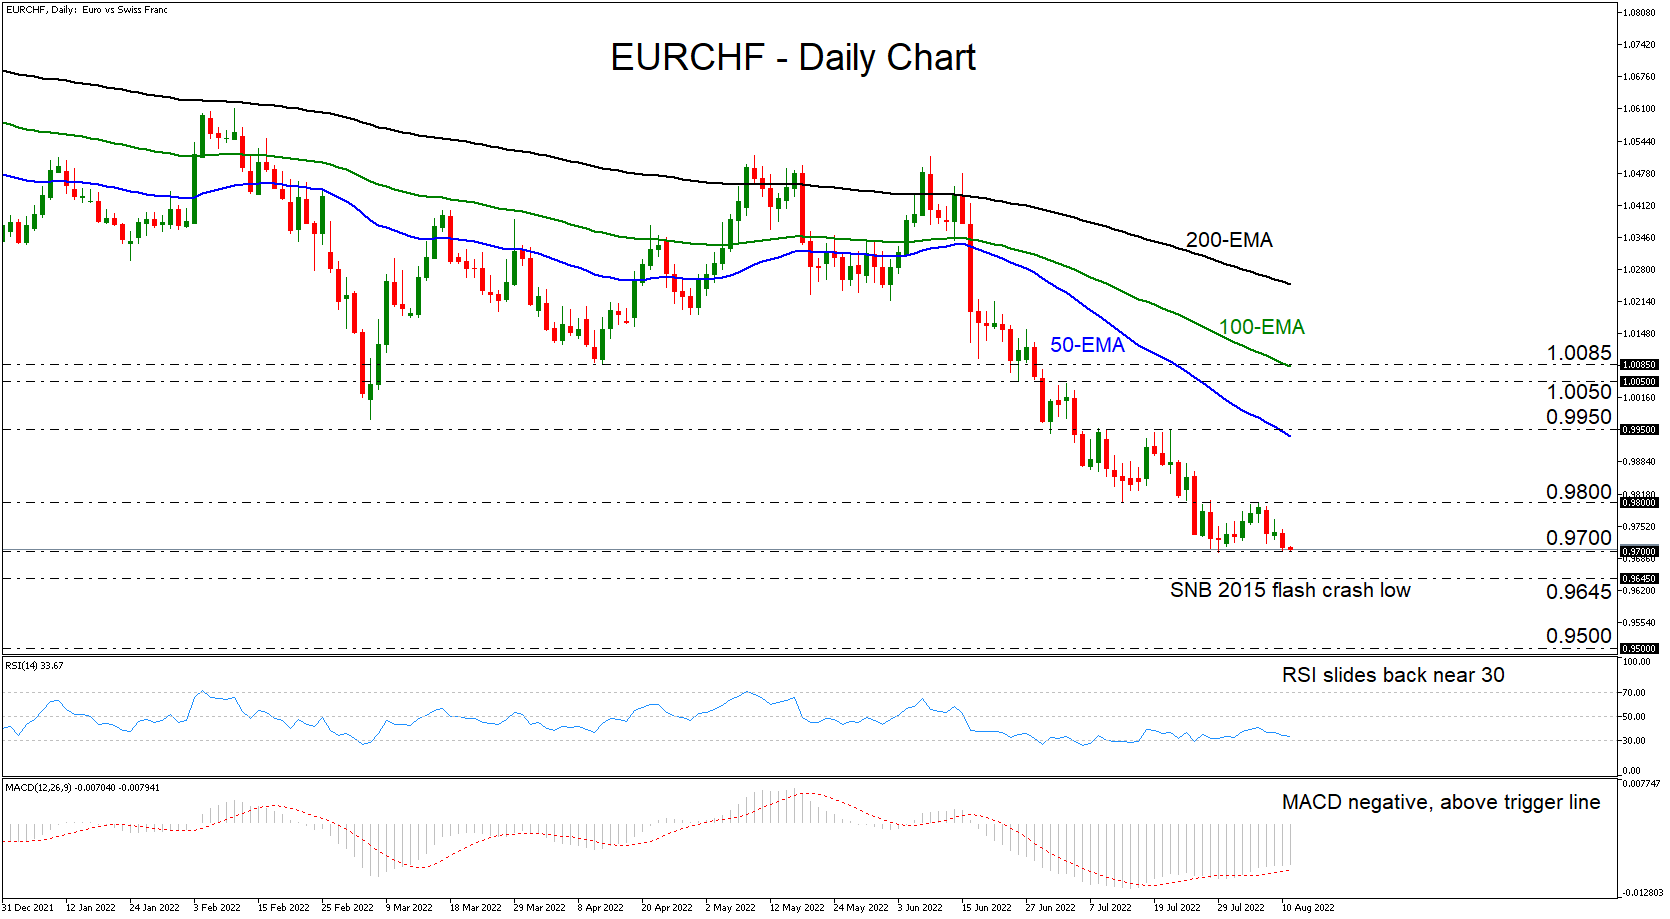
EURCHF entered a sliding mode this week, after hitting 0.9800, and is now hovering near the July 29 low, at 0.9700. Overall, the pair has been trading in a downtrend, staying below all three of the plotted moving averages, since mid-June.
The likelihood for further declines is enhanced by both the RSI and the MACD. The former has turned back down and is now approaching 30 again, while the latter remains well within its negative territory. That said, it lies above its trigger line, pointing up, which could imply another small bounce before an extension of the downtrend.
A break below 0.9700 would confirm a forthcoming lower low on the daily chart, allowing the pair to flirt with its all-time low at 0.9645, which was hit back in 2015 after the SNB removed the 1.20 floor, triggering a massive flash crash. Now, in case the bears do not stop there this time, they will enter uncharted territory, and the next support to consider may be the potentially psychological zone of 0.9500.
On the upside, the move confirming that the bulls have stolen all the bears’ swords – at least for a while – may be a recovery above 0.9800. This could signal the completion of a short-term double bottom and may initially allow advances towards the July 21 high, at 0.9950, near the 50 – exponential moving average (EMA). If there are no sellers to be found near that area either, the bulls could climb to the peak of July 4, at 1.0050.
To wrap up, EURCHF is getting closer to the 2015 flash crash low, where a break will take it into unseen grounds. That said, if the bulls decide to reenter the game and drive the action above 0.9800, a decent recovery may be possible.
BTCUSD Extends Advance, Eyeing $25,000 Mark
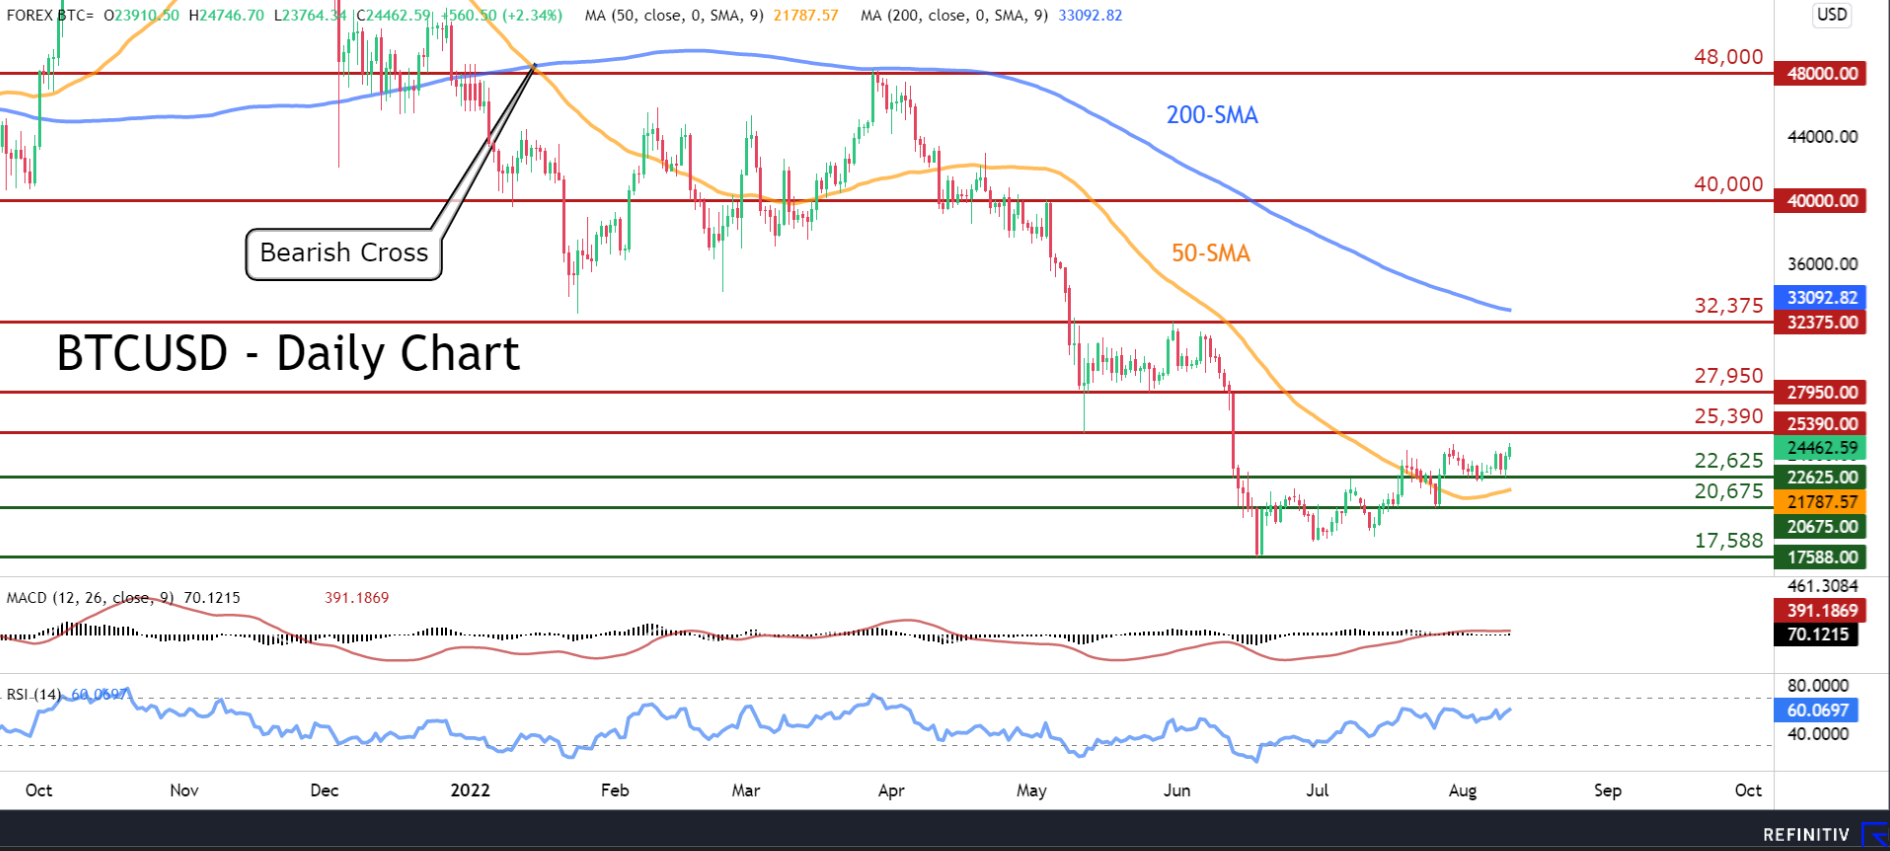
BTCUSD has been in a steady uptrend since it managed to halt its long-term decline at the 2022 low of 17,588. Even though the price is currently standing above its 50-day simple moving average (SMA), endorsing a bullish short-term picture, the road to a complete recovery remains long.
The short-term oscillators suggest a cautiously positive tone. Specifically, the MACD histogram is positive but below its red signal line, while the RSI is sloping upwards above its 50-neutral mark.
Should buyers propel the price higher, the May low of 25,390 could prove to be the first resistance point. Jumping above this zone, the bulls could aim for 27,950 before the spotlight turns to the 32,375 peak. Failing to stop there, the 40,000 psychological mark may halt any further upside moves.
On the flipside, if positive momentum wanes and the price declines, the recent low of 22,625 might act as the first line of defence. Sliding beneath that floor, the price could challenge the 20,675 obstacle. A violation of the latter could open the door for the 19-month low of 17,588.
Overall, Bitcoin is attempting a recovery, but its long-term bearish picture remains intact. Hence, a jump above the 32,375 region is required to initially shift its medium-term outlook to bullish.
Dollar Confirmed Bearish Reversal
The US inflation data published on Wednesday triggered a strong and unequivocal reaction from financial markets, allowing more certainty about starting a new market cycle.
Yesterday’s report showed close to zero price growth for July, while annual CPI growth slowed from 9.1% to 8.5%. An impressive contribution came from the fuel side. The slowdown was faster than forecast, causing markets to revise near-term expectations fundamentally. The main scenario was a 50-point Fed rate hike on 21 September, up from 75.
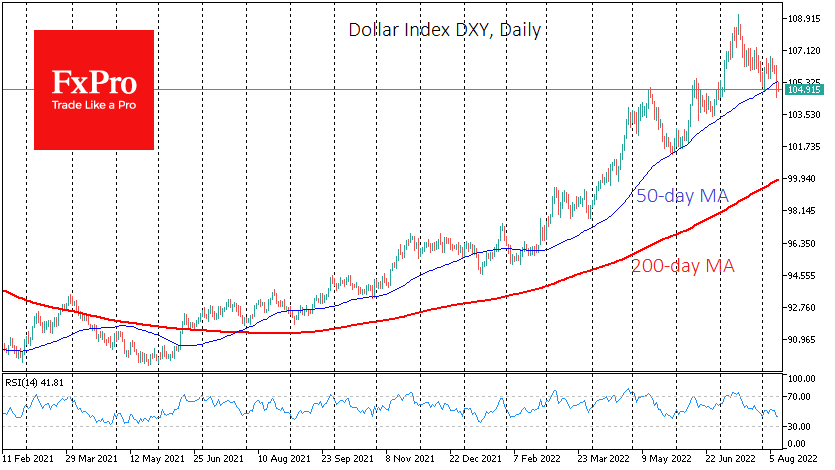
Yesterday’s report pushed the dollar index under 105, where the lows of the pullback to early August were. Thus, a sequence of increasingly lower lows and lower highs is forming in the DXY. The index has fallen below May and June peaks, indicating that the market is ready to move further downwards.
We also note that the Dollar Index closed on Wednesday below the 50-day moving average, which has served as a support line for the uptrend since June last year.
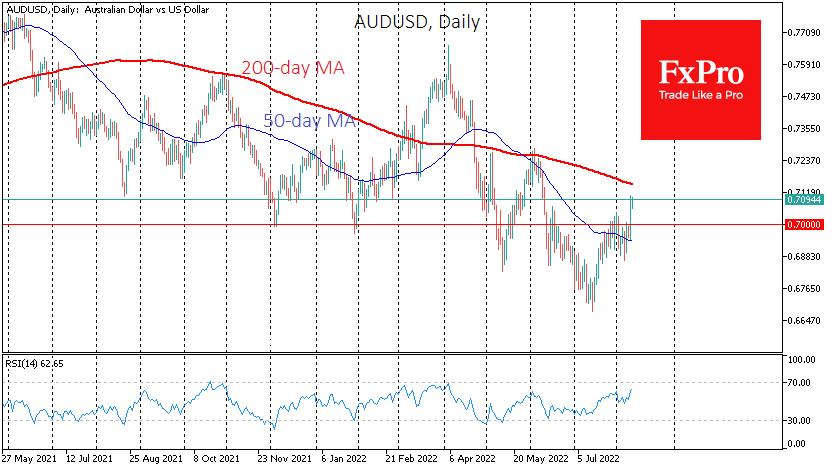
The strength of the most popular currency pairs with the Dollar is also in favour of breaking the trend. AUDUSD gained almost 2% on Wednesday. A powerful wave of growth in the Aussie took it immediately above 0.7000, a multi-year pivot point, and allowed it to rewrite the two-month highs.
New Zealand’s kiwi also proved a break of the medium-term trend by sharply moving up from its 50-day average.
We also saw sharp moves from key levels in the stock market, where the S&P500 and Nasdaq interrupted a sluggish correction and consolidated above previous local highs, thus stopping talk that the current bounce will end where it did in June.
It is also noteworthy that the reversal of the Dollar’s bullish rally is well within the historical pattern whereby the Dollar’s growth momentum starts about six months before the Fed’s policy tightening cycle begins and ends six months after the tightening. The starting point in the policy reversal was a change in the QE, not a rate hike as before when such a tool became common.
However, to speak of an unambiguous and prolonged failure of the Dollar is prevented by the Fed and the stronger initial stance of the US economy.
The Fed has much more room to tighten policy than energy-hit Europe or commodity-exporting countries at risk of falling incomes, considering months of declining prices for their export.
Fed officials, including some of the most dovish, continue to reassure the market that policy easing is not expected in a year and that the cycle of hikes is far from over.
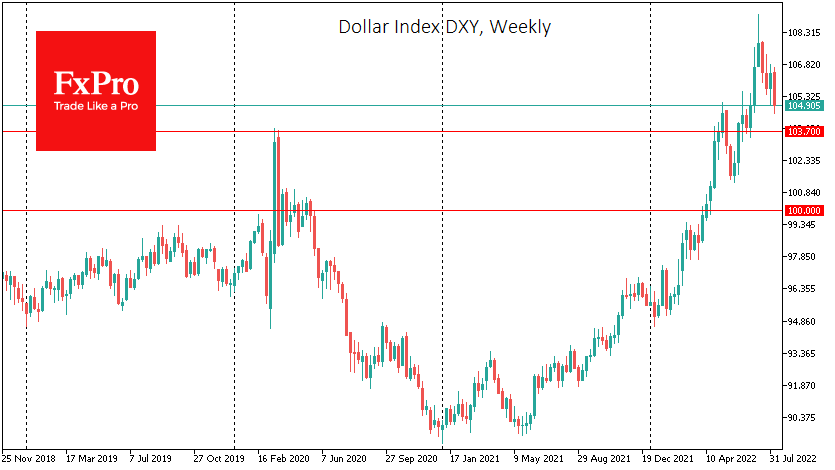
If we are right and the Dollar continues to retreat from recent highs, the next significant area to look out for is 103.7 – the March 2020 peak and the end of the correction in June. If dollar bulls do not return to buying, the road to 100-101 will also open next.
Australian Dollar Rises to 2-Month High
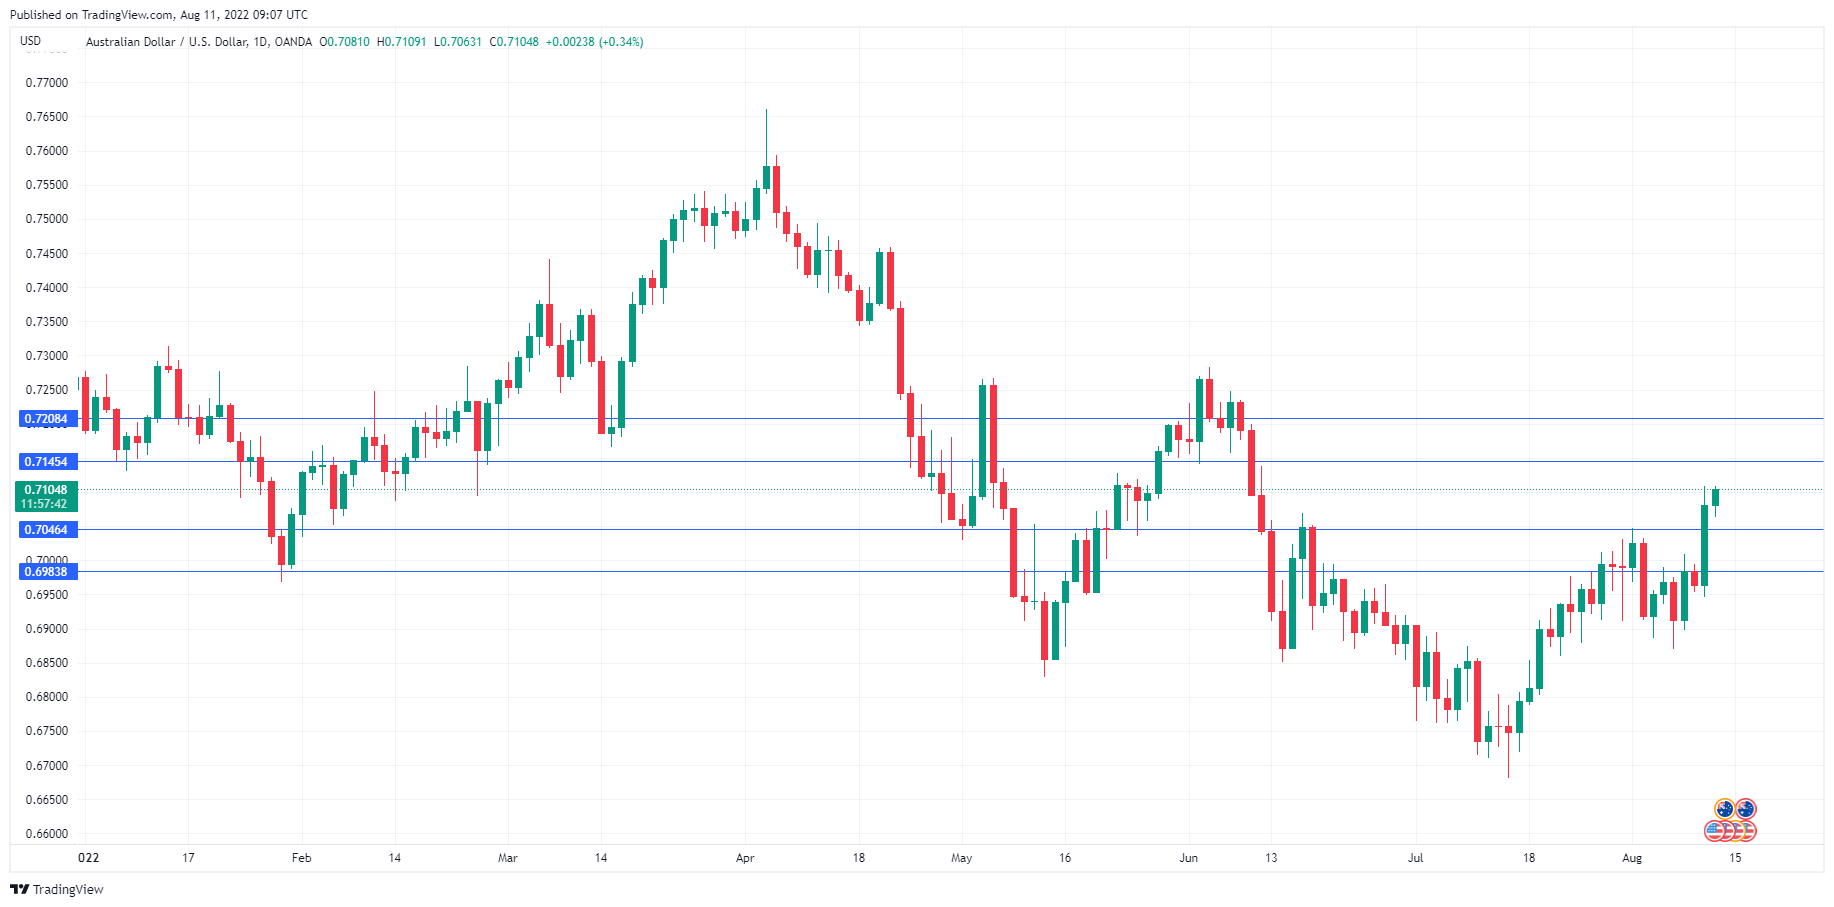
The Australian dollar has extended its gains today, after rising sharply on Wednesday. In the European session, AUD/USD is trading at 0.7099, up 0.26% on the day.
Aussie rockets on US inflation
Spectacular. That says it all about the Australian dollar’s surge on Wednesday. AUD/USD jumped 150 points and briefly punched above the 0.7100 level for the first time since June 10th. The catalyst for the Aussie’s good fortune was the US inflation report, as July inflation fell and took the US dollar on a nasty tumble against the majors.
The US headline and core inflation releases both came in lower than the forecast. Core CPI remained steady at 5.9%, lower than the forecast of 6.1%. However, the real news was the headline reading, which dropped to 8.5%, down sharply from 9.1% in June and below the estimate of 8.7%. The markets jumped all over the report, and “inflation peak fever” is spreading, as hopes rise that inflation is finally receding. This sentiment sent the US dollar reeling, on the assumption that the Fed can breathe easier and ease its hiking – perhaps “only” a 0.50% hike after back-to-back increases of 0.75%.
Before investors celebrate the demise of inflation, an examination of the facts is in order. The inflation rate of 8.5%, although lower than last month, is still close to a four-decade high. Inflation fell chiefly due to a drop in gas prices, but with the volatility we are seeing in the oil markets, gasoline could quickly change directions. Perhaps most importantly, inflation remains broad based – the core reading, which excludes food and energy costs, remained steady at 5.9%. As the Fed has been warning, the fight against inflation remains far from over, and the rate tightening cycle has by no means run its course.
The Reserve Bank of Australia is also in a tough fight against inflation, and is no doubt pleased with today’s MI Inflation Expectations release for July. Inflation Expectations fell to 5.9%, down from 6.3% in June, marking a second straight deceleration. This will likely result in a decline in the forward guidance from the RBA, which would likely weigh on the Australian dollar. The RBA holds its next rate meeting on September 6th.
AUD/USD Technical
- There is weak resistance at 0.7016, followed by resistance at 0.7120
- 0.6943 has switched to support. Below, there is support at 0.6839
Inflation Relief, PBOC, Singapore GDP, Oil, Gold, Bitcoin
Investors are certainly in a more upbeat mood as the relief from the US inflation data ripples through the markets.
Positive surprises have been hard to come by on the inflation front this year and yesterday's report was very much welcomed with open arms. While we shouldn't get too carried away by the data, with headline inflation still running at 8.5% and core 5.9%, it's certainly a start and one we've waited a long time for.
Fed policymakers remain keen to stress that the tightening cycle is far from done and a policy u-turn early next year is highly unlikely. Once again, the markets are at odds with the Fed's assessment on the outlook for interest rates but this time in such a way that could undermine its efforts so you can understand their concerns.
I expect we'll continue to see policymakers unsuccessfully push back against market expectations in the coming weeks while further driving home the message that data dependency works both ways. That said, the inflation report has further fueled the optimism already apparent in the markets and could set the tone for the rest of the summer.
PBOC signals no further easing
Unlike many other central banks, the PBOC has the scope to tread more carefully and continue to support the economy as it contends with lockdowns amid spikes in Covid cases. The country's zero-Covid policy is a huge economic headwind and proving to be a drain on domestic demand.
The PBOC has made clear in its quarterly monetary policy report though that it doesn't want to find itself in the same position as many other countries right now. With inflation close to 3%, further easing via RRR or interest rates looks unlikely for the foreseeable future. Cautious targeted support looks the likely path forward as the central bank guards against inflation risks, despite the data yesterday surprising to the downside.
Singapore trims growth forecasts
A surprise contraction in the second quarter has forced Singapore to trim its full-year growth forecast range from 3-5% to 3-4% as the economy contends with a global slowdown, to which the country is particularly exposed, and Covid-related uncertainty in China. While the MAS has indicated monetary policy is appropriate after tightenings this year, inflation remains high so further pressures on this front may add to the headwinds for the economy.
Oil treading water after volatile 24 hours
Needless to say, it was quite a volatile session in oil markets on Wednesday. A positive surprise on inflation was followed by a huge inventory build reported by EIA and then the highest US output since April 2020. Meanwhile, oil transit via the Druzhba pipeline resumed after a brief pause that jolted the markets. That's a lot of information to process in the space of a couple of hours and you can see that reflected in the price action.
And it keeps coming this morning, with the IEA monthly oil report forecasting stronger oil demand growth as a result of price incentivised gas to oil switching in some countries. It now sees oil demand growth of 2.1 million barrels per day this year, up 380,000. It also reported that Russian exports declined 115,000 bpd last month to 7.4 million from around 8 million at the start of the year.
The net effect of all of this is that oil prices rebounded strongly on Wednesday but are pretty flat today. WTI is back above $90 but that could change if we see progress on the Iran nuclear deal. It's seen plenty of support around $87-88 over the last month though as the tight market continues to keep the price very elevated.
Gold performs handbrake turn after breakout It was really interesting to see gold's reaction to the inflation report on Wednesday. The initial response was very positive but as it turned out, also very brief. Having broken above $1,800, it performed a swift u-turn before ending the day slightly lower. It can be difficult to gauge market reactions at the moment, in part because certain markets seem to portray far too much economic optimism considering the circumstances.
With gold, the initial response looked reasonable. Less inflation means potentially less tightening. Perhaps we then saw some profit-taking or maybe some of that economic optimism crept in and rather than safe havens, traders had the appetite for something a little riskier. Either way, gold is off a little again today but I'm not convinced it's peaked. From a technical perspective, $1,800 represents a reasonable rotation point. Fundamentally, I'm just not convinced the market is currently representative of the true outlook.
Where's the momentum?
Bitcoin took the inflation news very well and it continues to do so. Slower tightening needs and improved risk appetite is music to the ears of the crypto community who will be more confident that the worst is behind it than they've been at any point this year. Whether that means stellar gains lie ahead is another thing. The price hit a new two-month high today but I'm still not seeing the momentum I would expect and want. That may change of course and a break of $25,000 could bring that but we still appear to be seeing some apprehension that may hold it back in the near term.
Gold Abandons Bullish Channel, But Confirmation Required
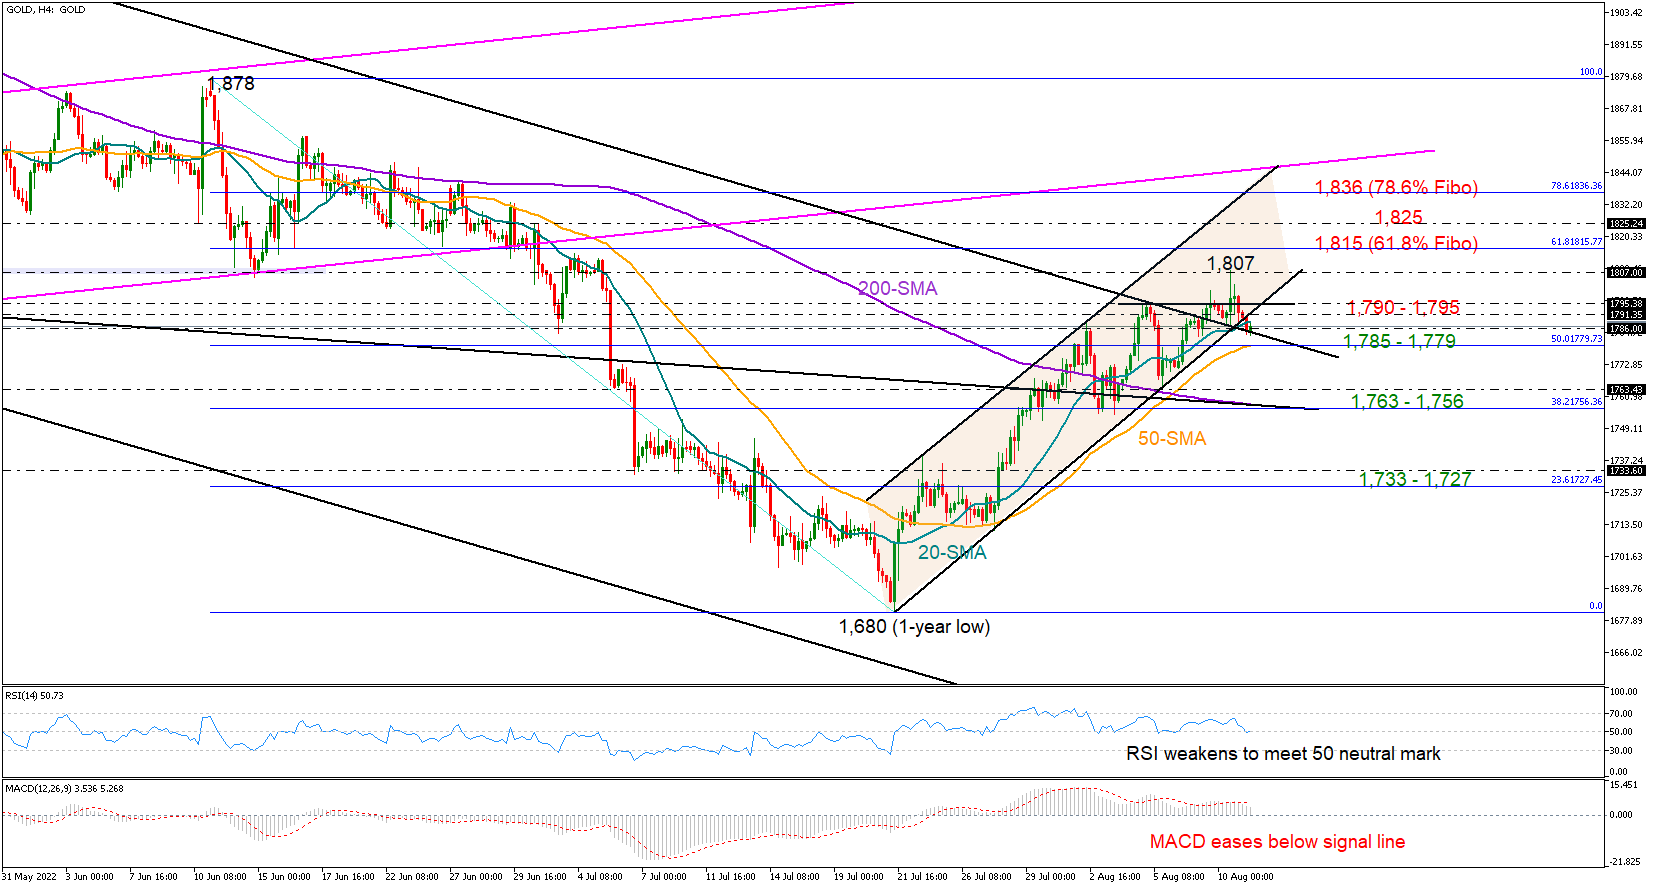
Gold could not sustain its bullish power above the 1,795 ceiling despite its flash spike to 1,807 on Wednesday, with the price retreating below the upward-sloping channel instead to reach a low of 1,783 early on Thursday.
While the negative breakout has raised the odds for more downside, the precious metal might have another opportunity to find its feet near the surface of the March bearish channel at 1,785, while the 50-period simple moving average (SMA) on the four-hour chart, currently aligned with the 50% Fibonacci retracement of the previous downtrend at 1,779, could also come quickly to the rescue.
According to the technical oscillators, the bias is looking neutral-to-bearish as the RSI has diminished to test its 50 neutral mark, while the MACD has decelerated below its red signal line. Yet, if the price pauses its latest pullback immediately and jumps decisively above the nearby 1,790 – 1,795 resistance, the key 1,807 – 1,815 barrier could come again under examination. A successful move higher from here could then clear the way towards the 1,825 – 1,836 zone, where the surface of the bullish channel is positioned.
Otherwise, a leg below $1,779 could trigger a sharp decline towards the 1,763 - 1,756 support region, which encapsulates the 200-period SMA, the 38.2% Fibonacci, as well as the constraining line drawn from the 2020 record high of $2,079. Failure to pivot here could cause another aggressive downfall to 1,733 - 1,727.
In summary, negative vibes surrounded gold after the close below the bullish channel, though sellers may wait for a confirmation below 1,785 - 1,779 to drive the market lower.
AUDUSD Spikes After Soft US CPI Print
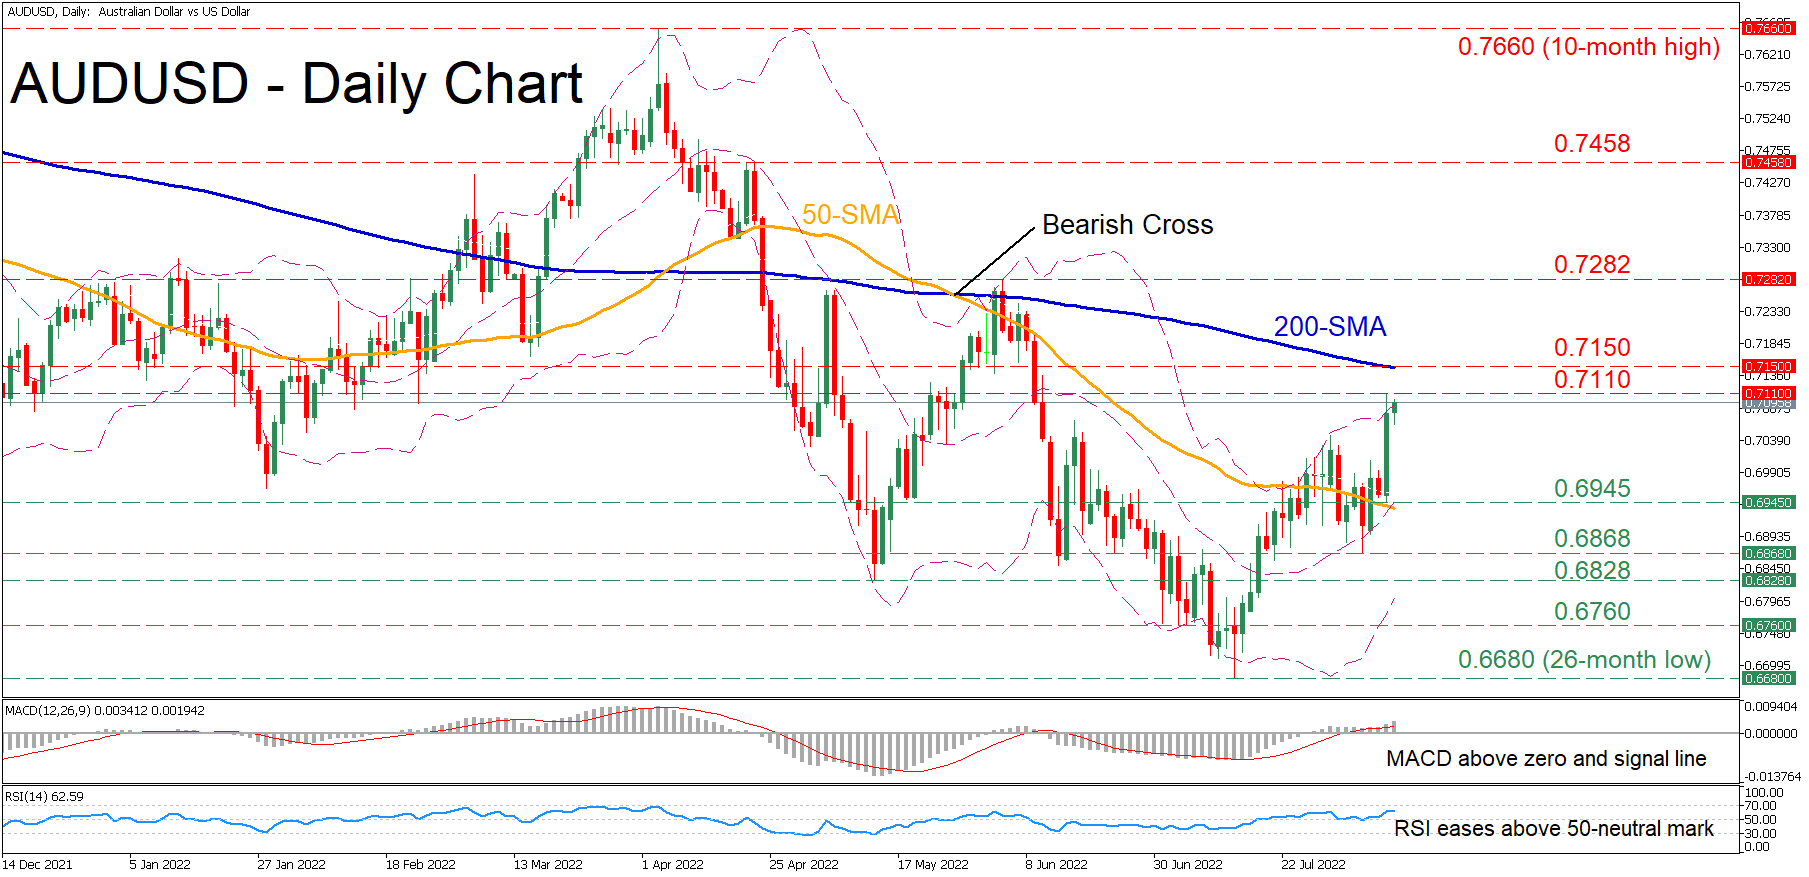
AUDUSD had been battling with its 50-day simple moving average (SMA) after it rebounded from the 26-month low of 0.6680. However, in the previous session the pair experienced a huge jump, closing decisively above its 50-day SMA and coming to a halt at the upper Bollinger band.
The short-term oscillators are reflecting the intensifying positive momentum. Specifically, the MACD histogram has jumped above zero and its red signal line, while the RSI is flatlining above its 50-neutral threshold.
Should buying pressures persist, the recent peak of 0.7110 could be the initial resistance barrier. Piercing through this region, the bulls could target the 200-day SMA, currently at 0.7150. Violating this zone, the spotlight might turn to the June high of 0.7282 before 0.7458 appears on the radar.
On the flipside, if the pair reverses downwards, the 0.6946 hurdle may act as the first line of defence. Should that floor collapse, the recent low of 0.6868 might come under examination. Failing to halt there, the price could descend towards the May low of 0.6828 or lower to challenge the 0.6760 region.
Overall, AUDUSD is showing an appetite for some recovery. Therefore, a break above 0.7282 is needed to alter its medium-term outlook to bullish.
Oil Report: Bulls to Disrupt Current Stabilisation?
WTI’s price was on the rise yesterday, yet overall seems to remain rather stable yet at lower levels than our last report as the price remains near $90 per barrel. It should be noted that the data released related to the US oil market tended to show a slack, as the EIA yesterday, showed that the was a built up of oil inventories in the US over the past week of 5.458 million barrels. Also the API weekly crude oil inventories figure last Tuesday, reported a built up of oil inventories for the past week, yet lower, at 2.156 million barrels. Also we would note that last Friday the Baker Hughes oil rig count showed that the number of active oil rigs in the US dropped by 7 reaching 598 which could be an indication of lower demand levels. Overall the figures stemming from the US seem to show that demand levels were not able to reach production of oil, which could have kept oil prices at relatively low levels.
High Gasoline Demand and weak dollar support oil prices
On the other hand, we highlight the drop of gasoline inventories levels, as drawdown of almost -5 million barrels was reported. The release implied a high demand for gasoline that could be translated to higher demand for crude oil in the future given that the demand levels for gasoline surpassed production and could force refineries to faster production levels. At the same time a Reuters report tended to imply that strong energy consumption is expected for the second half of the year that could boost oil prices in the coming months if realised. Also on a fundamental level we note that the US CPI rates for July dropped weakening the USD, which may also support the dollar denominated commodity’s price.
Druzhba pipeline resumes oil flow
The news that flow of oil from Russia to Europe has resumed through the Druzhba pipeline may have helped to keep oil prices at low levels. It should be noted that the flow was disrupted at the southern part of the pipeline which was going through Ukraine to parts of central Europe. The disruption occurred about a month ago and had intensified worries for the supply of the commodity to Europe which could intensify the energy crisis in the continent. The resumption of supplies tended to ease market worries about the supply side of the commodity and thus may have not allowed oil prices to ascend higher.
Iran nuclear deal near
Also on a fundamental level, we note that the US and Iran seem to be nearing a possible deal for the continuation of Iran’s nuclear program. The two sides seem to be nearing an agreement on restoring Iran’s 2015 nuclear deal, after another round of talks practically ended with a final text being drawn by the EU. Despite some Iranian objections to the text, there is some slight optimism that the two sides will be reaching an agreement. For the time being the text has been forwarded to the capitals for approval, which is to be another risky process. Should the two sides actually reach a deal, we may see oil prices dropping as the agreement would allow Iran to re-enter the global oil market as a major international supplier.
OPEC’s monthly report
Also today we note the release of the OPEC monthly report that could interest oil traders. It should be noted that the OPEC Monthly Oil Market Report (MOMR) discusses major issues affecting the world oil market especially in regards to expected demand and production levels for the coming year as well as the oil market balance, which could affect the market’s mood for the commodity’s price, as it would allow for an insight in the possible actions of the organization. Should the report show a meagre increase in the global demand for oil being anticipated, we may see the commodity’s price dropping, while a tightness in expected production levels could push oil prices higher.
Technical Analysis
WTI H4
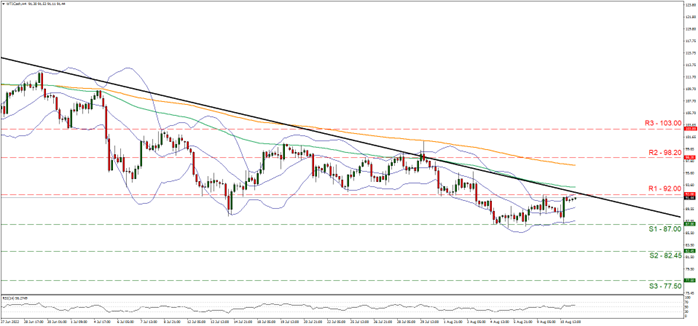
WTI’s price retreated at some point below the reading of $90 per barrel, yet seems to remain rather stable near that level currently. It’s characteristic that the commodity’s price remained in a sideways movement between the 92.00 (R1) resistance line and the 82.45 (S1) support line, since the 3rd of August. We tend to maintain our bias for a sideways movement of WTI’s price currently and as long as the price action respects the pre-mentioned levels. On the other hand, we highlight that the commodity’s price is on a collision course with the downward trendline that has been guiding WTI’s price action since the 14th of June. It should be noted that the RSI indicator below our 4-hour chart is running along the reading of 50 also implying a rather indecisive market for the time being. Should bulls take over the initiative for WTI’s price, we may see it breaking the 92.00 (R1) resistance line which forms the upper boundary of its current sideways motion and aims for the 98.20 (R2) level that provided resistance on the 26th and 28th of July. Even higher we note the 103.00 (R3) resistance barrier that was aimed for on the 8th of July. Should the bears be in charge of the commodity’s price, we may see it breaking the 87.00 (S1) support line that is currently the lower boundary of its sideways movement and take aim for the 82.45 (S2) support level, while even lower we note the 77.50 (S3) support hurdle.