Sample Category Title
AUD/USD Daily Report
Daily Pivots: (S1) 0.6983; (P) 0.7046; (R1) 0.7145; More...
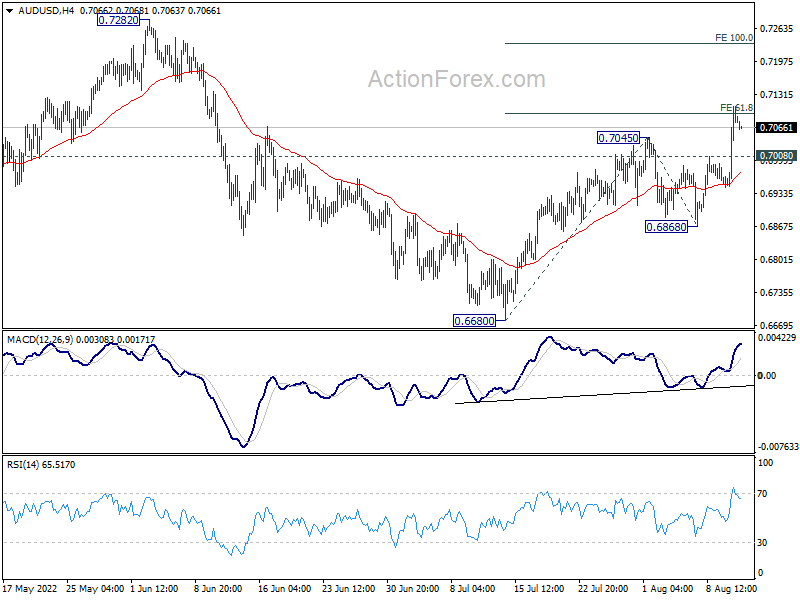
AUD/USD's rally from 0.6680 is still in progress and met 61.8% projection of 0.6680 to 0.7045 from 0.6868 at 0.7094. Intraday bias stays on the upside, and firm break of 0.7094 will target 100% projection at 0.7233. On the downside, below 0.7008 minor support will turn intraday bias neutral first. But further rally will remain in favor as long as 0.6868 support holds, in case of retreat.
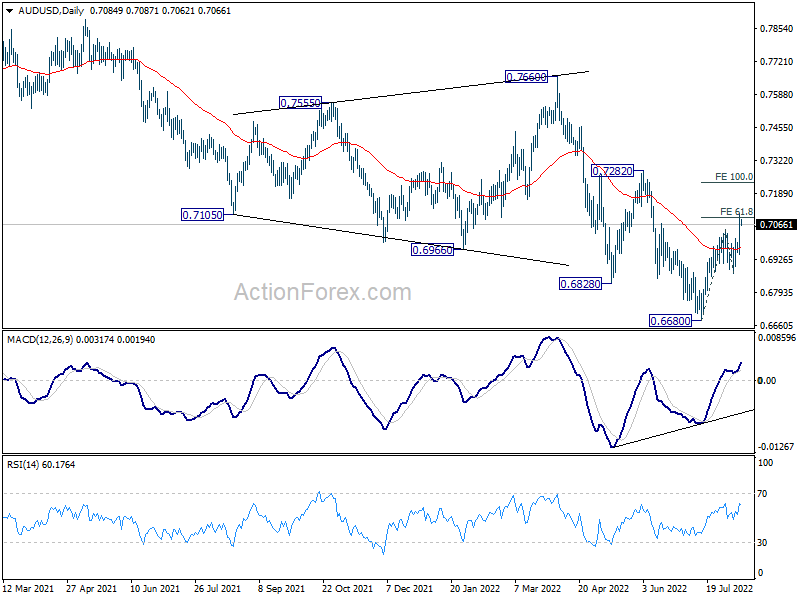
In the bigger picture, price actions from 0.8006 (2021 high) is seen more as a corrective pattern to rise from 0.5506 (2020 low). Or it could be a bearish impulsive move. In either case, outlook will remain bearish as long as 0.7282 resistance holds. Next target is 61.8% retracement of 0.5506 to 0.8006 at 0.6461.
Dollar Recovering Mildly after Selloff, Aussie and Kiwi Strong
After yesterday's selloff, Dollar is recovering slightly in Asian session today. But the greenback remains the worst performing one for the week. New Zealand and Australian Dollars are taking most advantage for now, helped by risk-on sentiment. But Swiss Franc and Yen are also strong on falling major benchmark yields. Euro and Sterling are on the softer side, even though they still outperform Dollar.
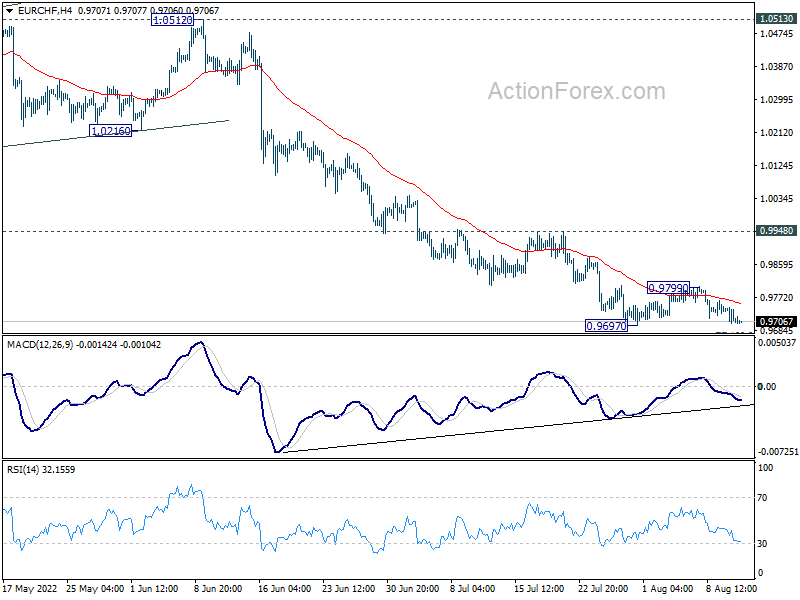
Technically, while Dollar is under broad-based pressure, the weakness in Euro is also worth a mention. EUR/CHF is on the verge on breaking through 0.9697 low to resume long term down trend. Meanwhile, EUR/AUD is also eyeing a break of 1.4508 to resume the near term fall from 1.5396 towards 1.4318 low. Break of these levels could cap Euro's rally against Dollar.
In Asia, Japan is on holiday. Hong Kong HSI is up 1.83%. China Shanghai SSE is up 1.25%. Singapore Strait Times is up 0.46%. Overnight, DOW rose 1.63%. S&P 500 rose 2.13%. NASDAQ rose 2.89%. 10-year yield dropped -0.011 to 2.786.
Fed Kashkari wants rate at 3.9% by year-end, 4.4% next
Minneapolis Fed President Neel Kashkari said yesterday that in the June economic projections, he recommended interest rate at 3.9% by the end of this year, and 4.4% next. He added, "I haven't seen anything that changes that."
Even after yesterday's July CPI release, the Fed is "far away from declaring victory" on inflation, Kashkari said. "This is just the first hint that maybe inflation is starting to move in the right direction, but it doesn't change my path."
"I think a much more likely scenario is we will raise rates to some point and then we will sit there until we get convinced that inflation is well on its way back down to 2% before I would think about easing back on interest rates," he said.
Fed Evans: Inflation still unacceptably high, rates to rise to 3.5% by year end
Chicago Fed President Charles Evans said yesterday's CPI data was the first "positive" reading since Fed started tightening. Yet, inflation is still "unacceptably" high". He expects Fed to continue to raise interest rate to 3.25-3.50% by year end, and to 3.75-4.00 by the end of next year.
Evans was optimistic that the economy will "continue to grow" in H2. "I'm not looking for the economy to turn down in a significant fashion any time soon," he added. He expected growth to be 1.5-2.0% next year.
DOW to take on 55 W EMA after strong rally
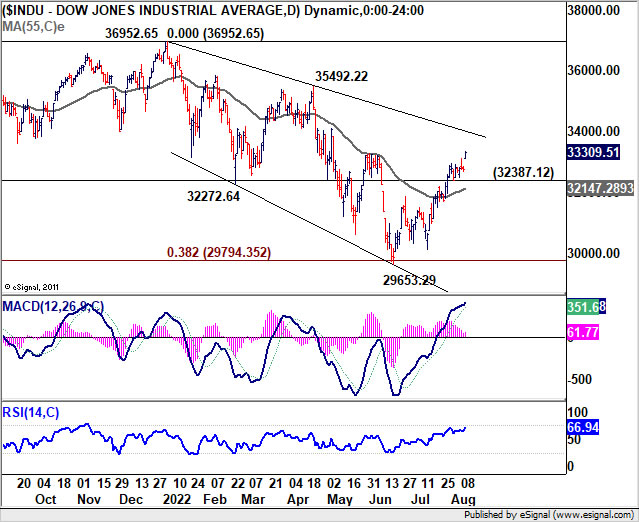
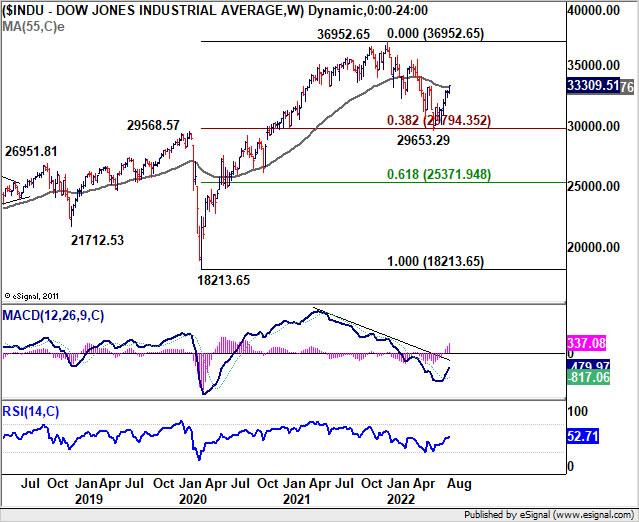
US stocks staged a strong rally yesterday on hope that inflation has finally peaked. DOW gained 535pts or 1.63% to close at 33309.
The development affirms the case that whole correction from January's peak at 36952 .65 has completed with three waves down to 29653.29. 55 week EMA (now at 33169.39) is now the key hurdle to overcome. Sustained trading above that will add even more credence to the bullish case. That should set the stage for further rally to retest 36952.65 later in the year.
For the near term, in any case, further rise is expected as long as 32387.12 support holds.
Elsewhere
UK RICS house price balance dropped to 63 in July, above expectation of 60. Australia consumer inflation expectations eased from 6.3% to 5.9% in August. US PPI and jobless claims are the only feature in a light day.
AUD/USD Daily Report
Daily Pivots: (S1) 0.6983; (P) 0.7046; (R1) 0.7145; More...
AUD/USD's rally from 0.6680 is still in progress and met 61.8% projection of 0.6680 to 0.7045 from 0.6868 at 0.7094. Intraday bias stays on the upside, and firm break of 0.7094 will target 100% projection at 0.7233. On the downside, below 0.7008 minor support will turn intraday bias neutral first. But further rally will remain in favor as long as 0.6868 support holds, in case of retreat.
In the bigger picture, price actions from 0.8006 (2021 high) is seen more as a corrective pattern to rise from 0.5506 (2020 low). Or it could be a bearish impulsive move. In either case, outlook will remain bearish as long as 0.7282 resistance holds. Next target is 61.8% retracement of 0.5506 to 0.8006 at 0.6461.
Economic Indicators Update
| GMT | Ccy | Events | Actual | Forecast | Previous | Revised |
|---|---|---|---|---|---|---|
| 23:01 | GBP | RICS Housing Price Balance Jul | 63% | 60% | 65% | |
| 01:00 | AUD | Consumer Inflation Expectations Aug | 5.90% | 6.30% | ||
| 12:30 | USD | PPI M/M Jul | 0.20% | 1.10% | ||
| 12:30 | USD | PPI Y/Y Jul | 10.40% | 11.30% | ||
| 12:30 | USD | PPI Core M/M Jul | 0.40% | 0.40% | ||
| 12:30 | USD | PPI Core Y/Y Jul | 7.60% | 8.20% | ||
| 12:30 | USD | Initial Jobless Claims (Aug 5) | 265K | 260K | ||
| 14:30 | USD | Natural Gas Storage | 40B | 41B |
DOW to take on 55 W EMA after strong rally
US stocks staged a strong rally yesterday on hope that inflation has finally peaked. DOW gained 535pts or 1.63% to close at 33309.
The development affirms the case that whole correction from January's peak at 36952 .65 has completed with three waves down to 29653.29. 55 week EMA (now at 33169.39) is now the key hurdle to overcome. Sustained trading above that will add even more credence to the bullish case. That should set the stage for further rally to retest 36952.65 later in the year.
For the near term, in any case, further rise is expected as long as 32387.12 support holds.
Fed Kashkari wants rate at 3.9% by year-end, 4.4% next
Minneapolis Fed President Neel Kashkari said yesterday that in the June economic projections, he recommended interest rate at 3.9% by the end of this year, and 4.4% next. He added, "I haven't seen anything that changes that."
Even after yesterday's July CPI release, the Fed is "far away from declaring victory" on inflation, Kashkari said. "This is just the first hint that maybe inflation is starting to move in the right direction, but it doesn't change my path."
"I think a much more likely scenario is we will raise rates to some point and then we will sit there until we get convinced that inflation is well on its way back down to 2% before I would think about easing back on interest rates," he said.
Technical Outlook and Review
USD/JPY:
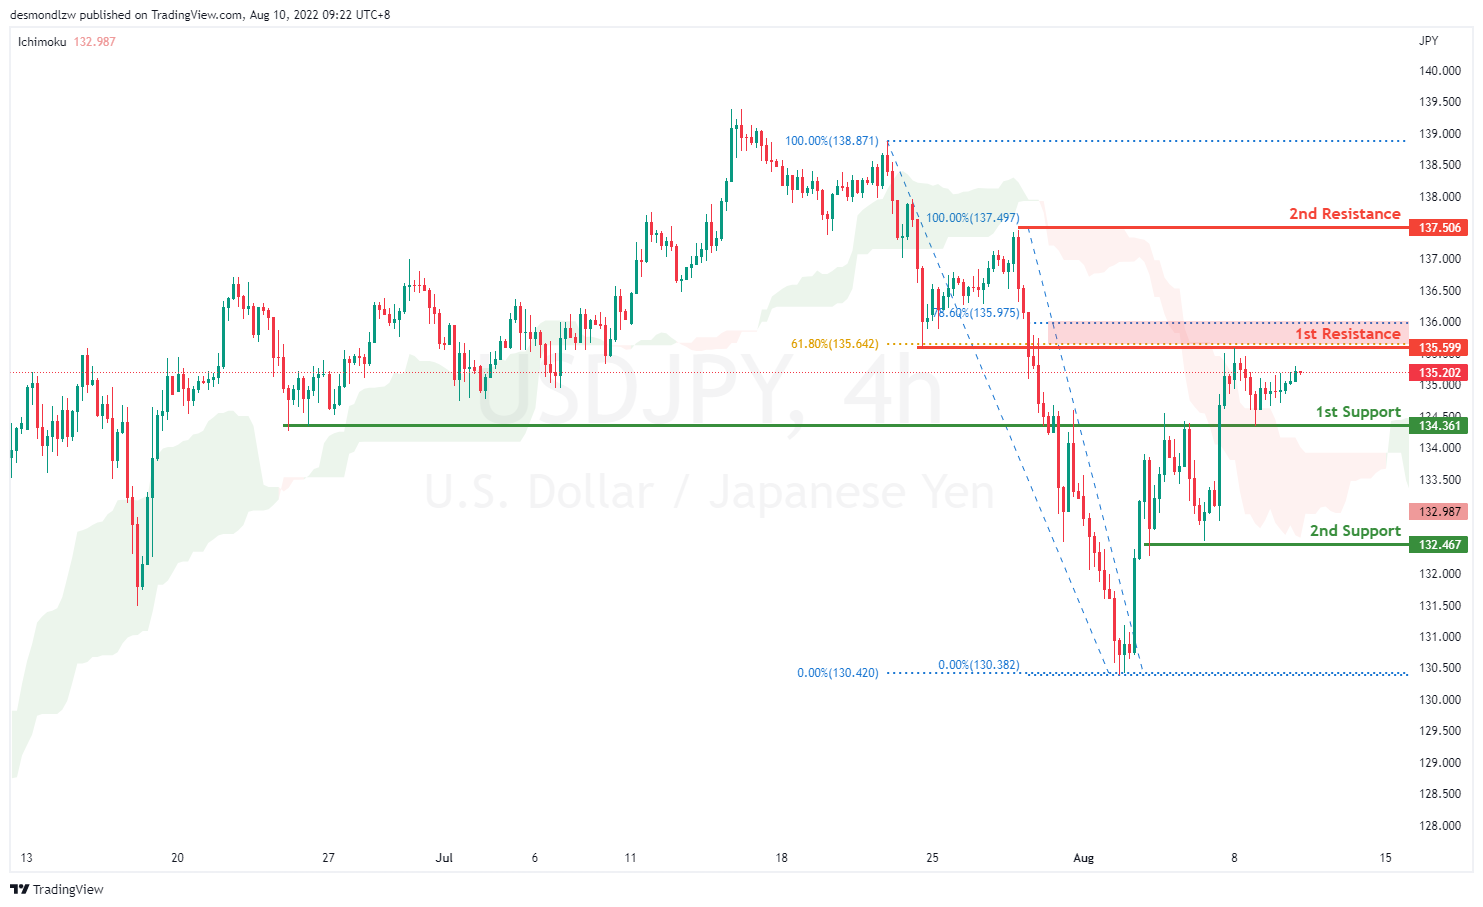
On the H4, price is still bullish biased as it fails to pull back to the first support the previous session. It is currently moving towards the first resistance at 135.599 which coincides with the 61.8% Fibonacci retracement and the previous swing low. If price breaks this level, it will move up to test at the second resistance which is the previous swing high at 137.506. Alternatively, price could pull back to test at the first support 134.361 which is the previous swing low
Areas of consideration:
- H4 time frame, 1st resistance at 135.599
- H4 time frame, 1st support at 134.361
DXY:
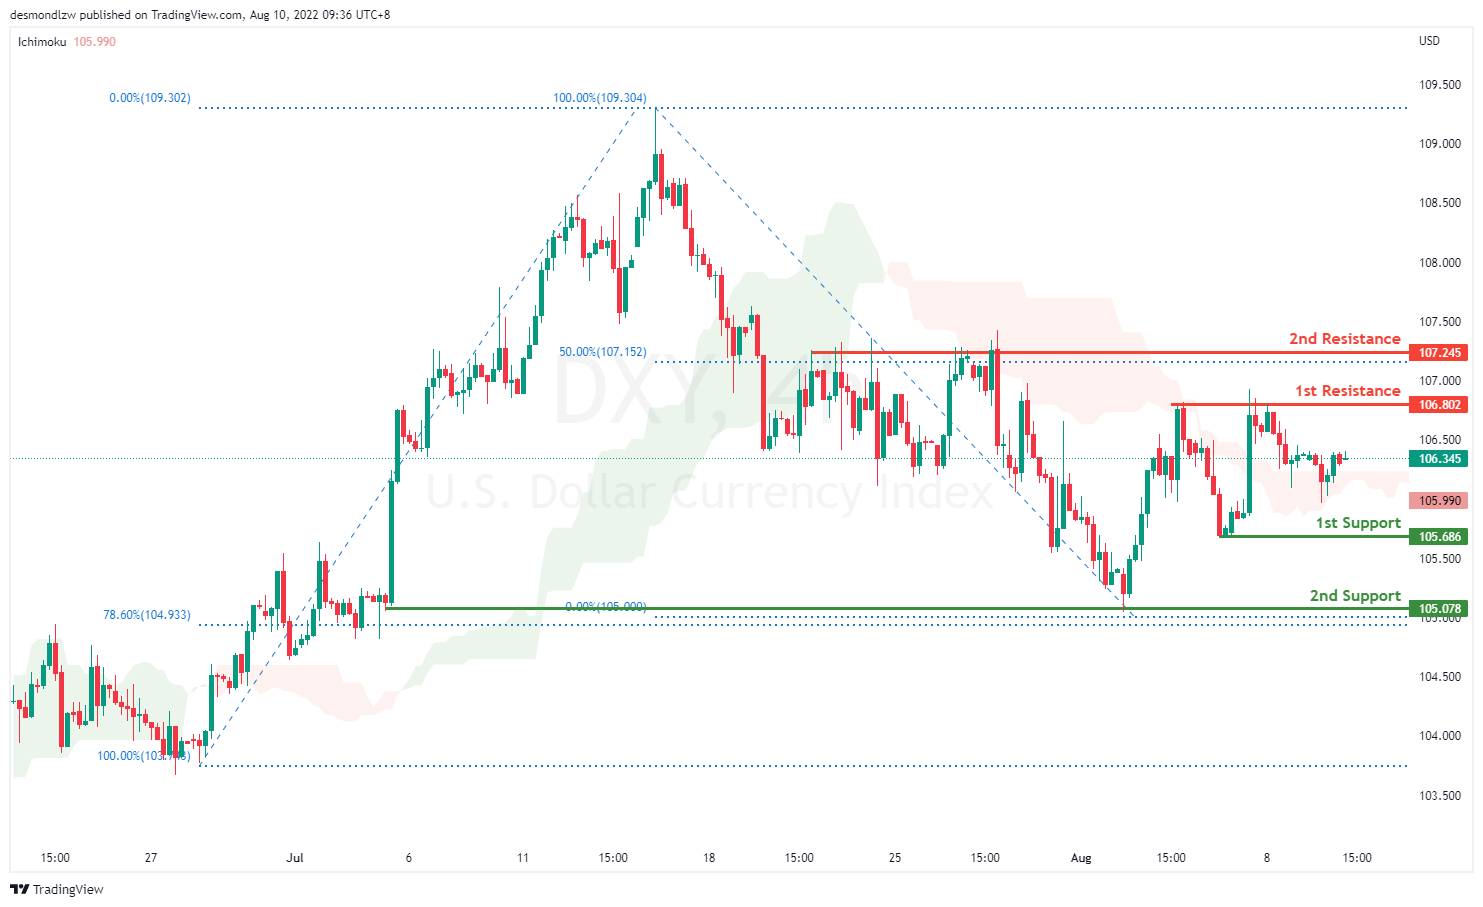
On the H4, prices have broken the descending trend into a bullish biased trend. Prices look like it’s going to test at the first resistance 106.802 where the previous swing high sits. If prices break the first resistance it will confirm a bullish momentum and prices will continue to move in an ascending trend towards the second resistance at 107.245 where the 50% fibonacci retracement sits. If prices rejects the first resistance and continues in the descending trend, it will test at the first support 105.686 and then the second support at previous swing low 105.078
Areas of consideration:
- H4 time frame, 1st resistance at 106.802
- H4 time frame, 1st support at 105.686
EUR/USD :
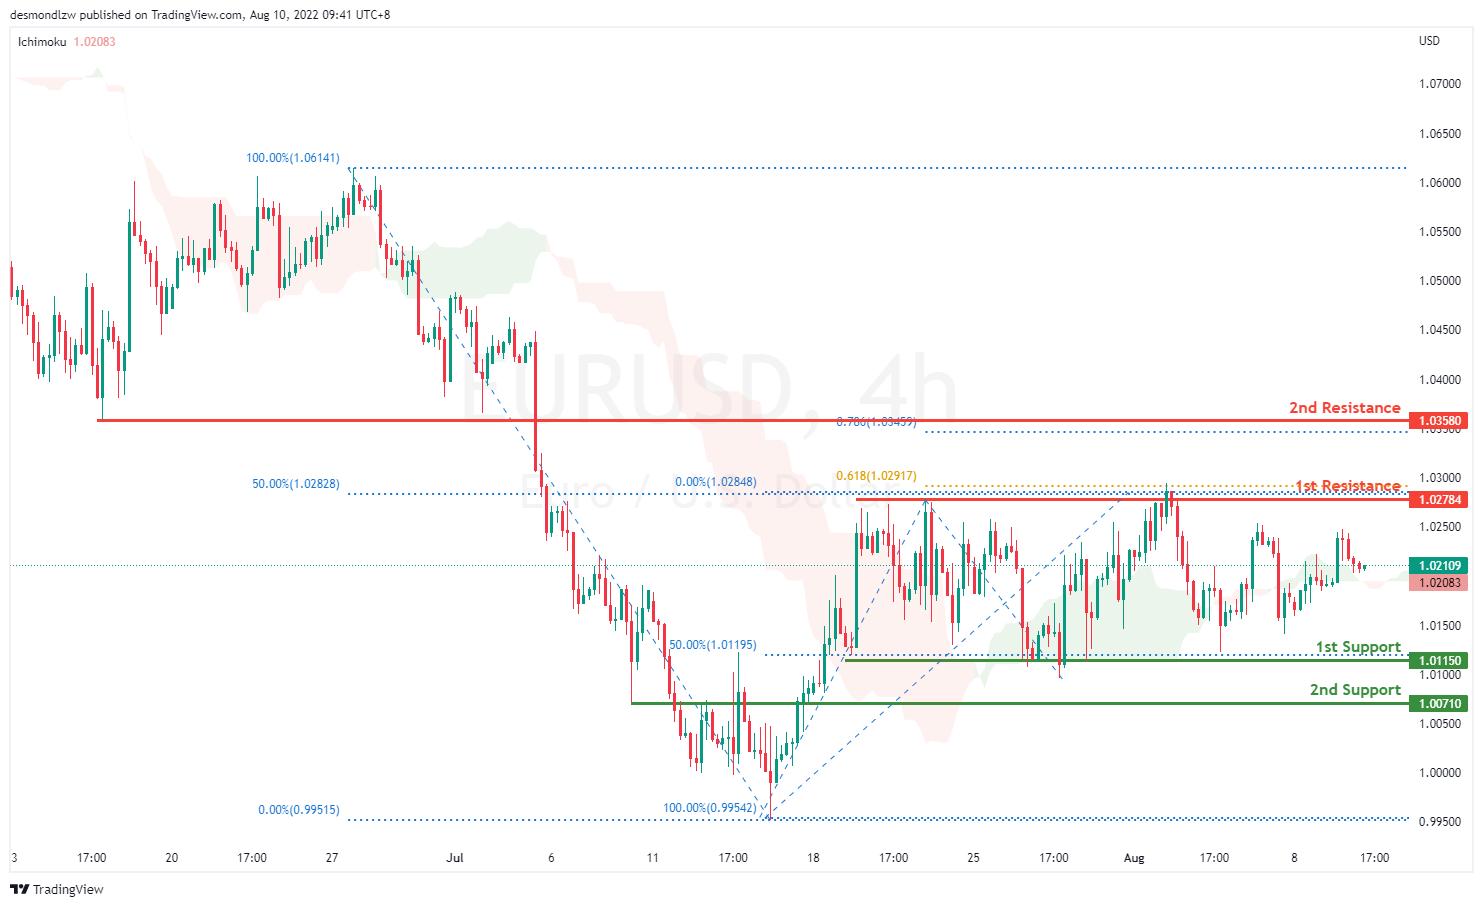
On the H4, prices have broken the bearish trend moving into a slightly bullish biased trend. Price is ranging and it seems like it’s going back to test the first resistance at 1.02784 where the 61.8% fibonacci projection and 50% retracement sits. If prices break the first resistance, it will pull back further to test at the second resistance at 1.035. Alternatively, price might test the 1st support at 1.011
Areas of consideration :
- H4 1st resistance at 1.027
- H4 1st support at 1.011
GBP/USD:
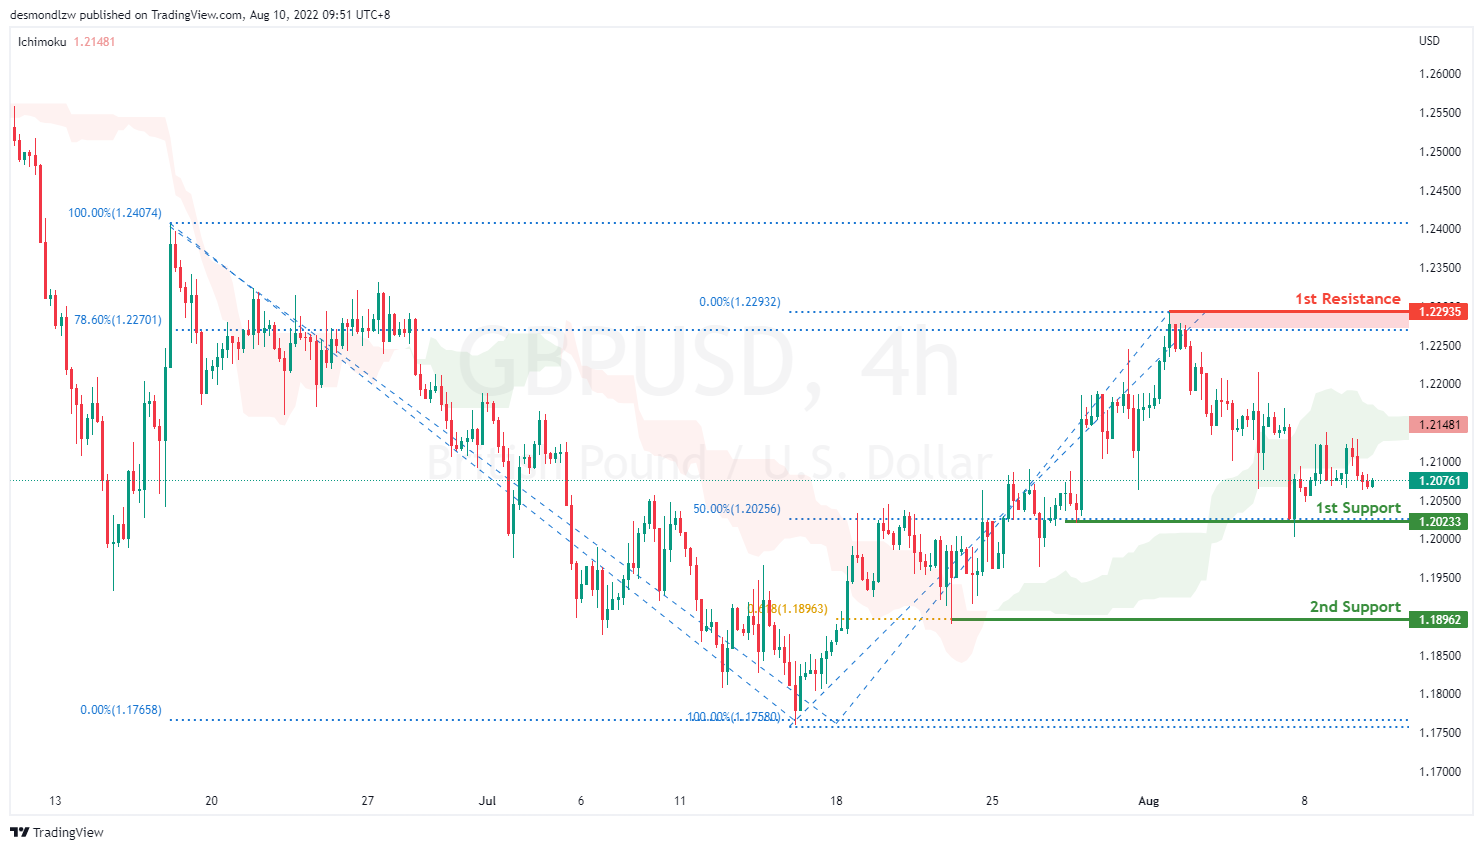
On the H4, with prices breaking the ascending channel we are now slightly bearish biased. Price is now moving toward the first support at 1.202 which coincides with 50% Fibonacci retracement. If price break supports and confirms downside trend, we would expect downside momentum to carry price to 2nd support at 1.189 61.8% Fibonacci projection. Alternatively, price could bounce back to test at 78.6% Fibonacci retracement at 1.229
Areas of consideration:
- H4 1st resistance at 1.229
- H4 1st support at 1.202
USD/CHF:
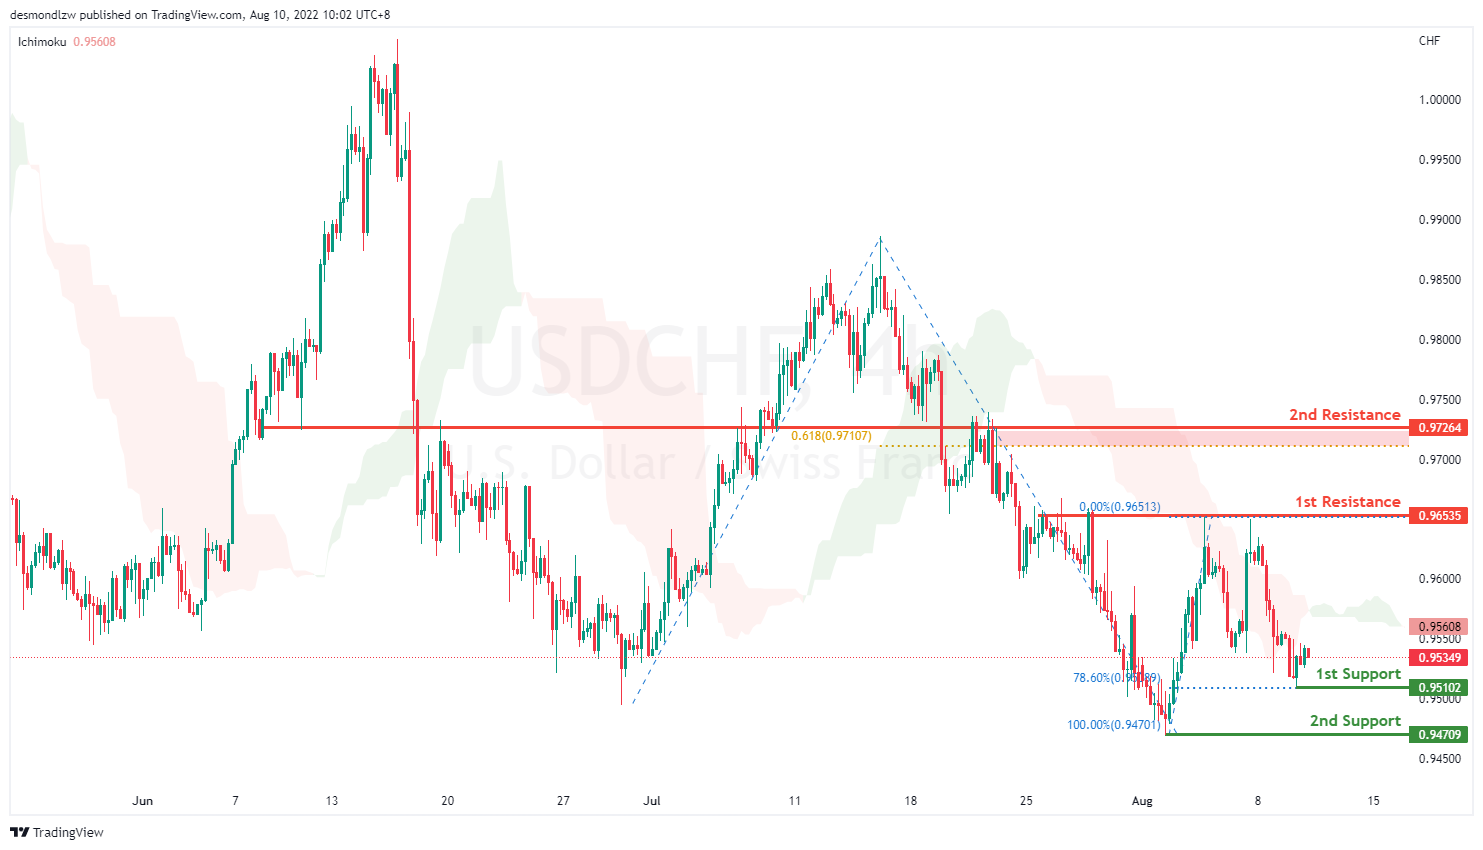
On the H4, prices have signalled a slightly bearish momentum as it rejected the 1st resistance at 0.965 which is also the precious swing highs. Prices are moving toward the first support at 0.951 where the 78.6% fibonacci retracement sits. If price continues with the downward momentum, it will bring price to the previous swing low at 0.947. 50% Fibonacci retracement to test at the 1st support 0.955 23.6% fibonacci retracement. If prices break this key level, it will pull back further to test at the second support at 0.947. Alternatively price could test 1st resistance 0.963 subsequently the second resistance at 0.972 where the 61.8% fibonacci projection and previous swing low levels sit
Areas of consideration
- H4 1st resistance at 0.963
- H4 1st support at 0.951
XAU/USD (GOLD):
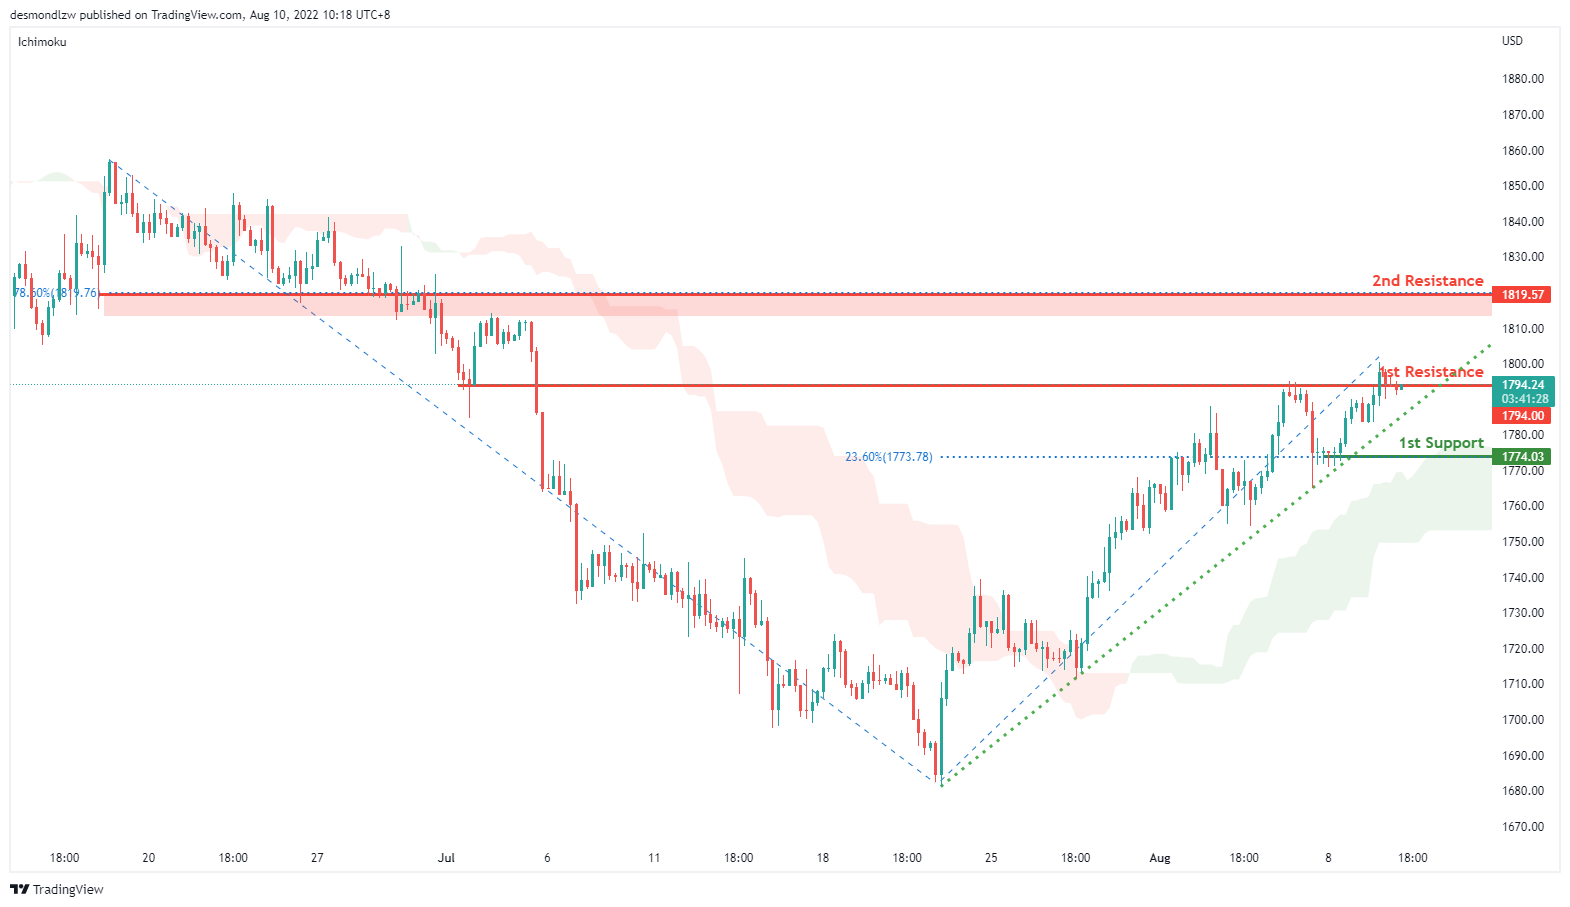
On the H4, with prices moving along the ascending trendline and above the ichimoku cloud, we have a bullish bias that the price may rise from the 1st resistance at 1794.00, which is in line with the overlap support to the 2nd resistance at 1819.57, which is in line with the 78.6% fibonacci retracement. Alternatively, prices may drop to 1st support at 1774.03,which is in line with the pullback support.
Areas of consideration:
- H4 time frame, 1st resistance at 1794.00
- H4 time frame, 2nd resistance at 1819.57
AUD/USD:
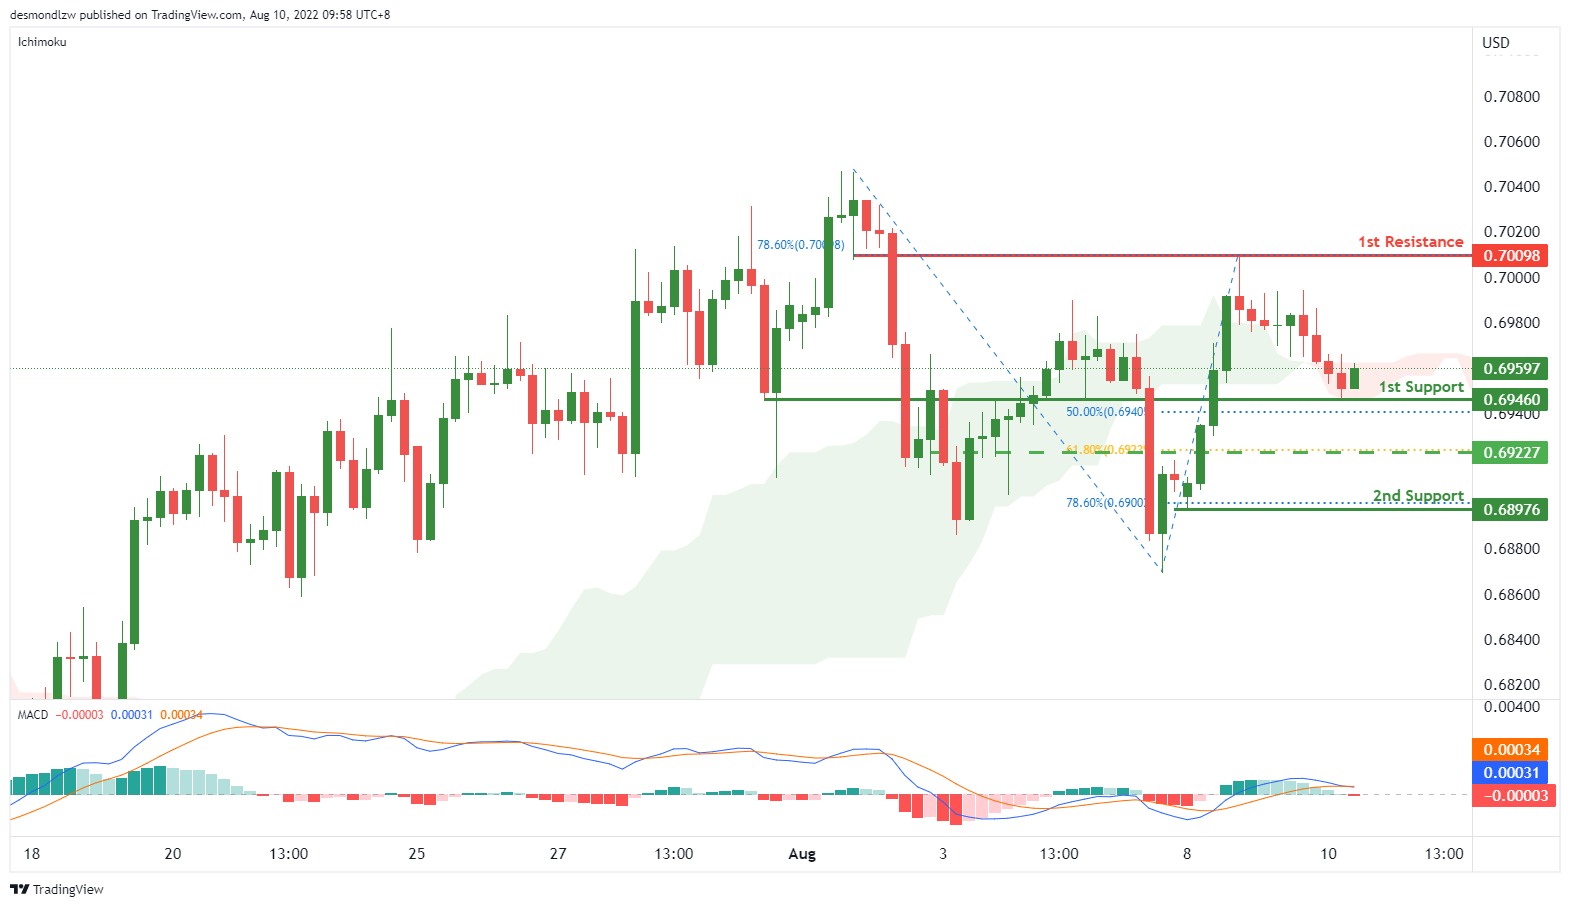
On the H4, with the DIF line is breaking below the signal line in MACD, we have a bearish bias that price may drop from the 1st support at 0.69460, where the swing low and 50% fibonacci retracement are to the 2nd support at 0.68976 where the 78.6% fibonacci retracement is. Alternatively, price may rise to the 1st resistance at 0.70098 which is in line with 78.6% fibonacci retracement and swing high. Take note the 0.69227 could be our intermediate support, which is in line with 61.8% fibonacci retracement.
Areas of consideration
- H4 1st support at 0.69460
- H4 2nd support at0.68976
NZD/USD:
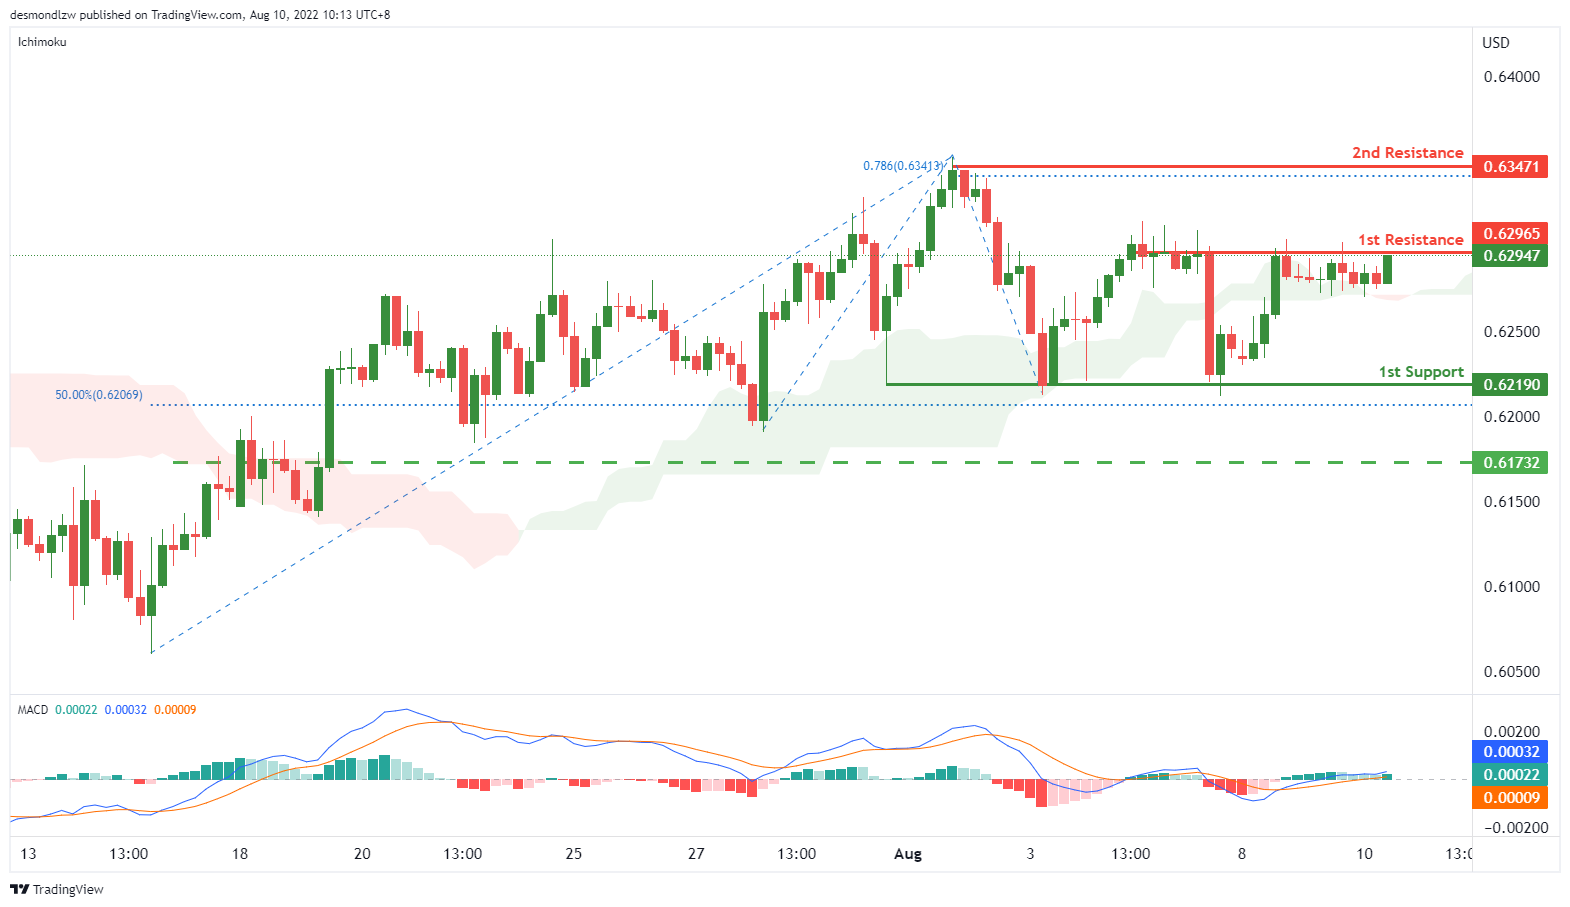
On the H4, with price moving above the ichimoku cloud and the histogram is above zero axis, we have a bullish bias that price may rise from the 1st resistance at 0.62965 where overlap resistance is to the 2nd resistance at 0.63471 where 78.6% fibonacci projection is. Alternatively, price may reverse off the 1st resistance and drop to 1st support at 0.62190 where the swing low support is.
Areas of consideration:
- H4 time frame, 1st resistance at 0.62965
- H4 time frame,2nd resistance at 0.63471
USD/CAD:
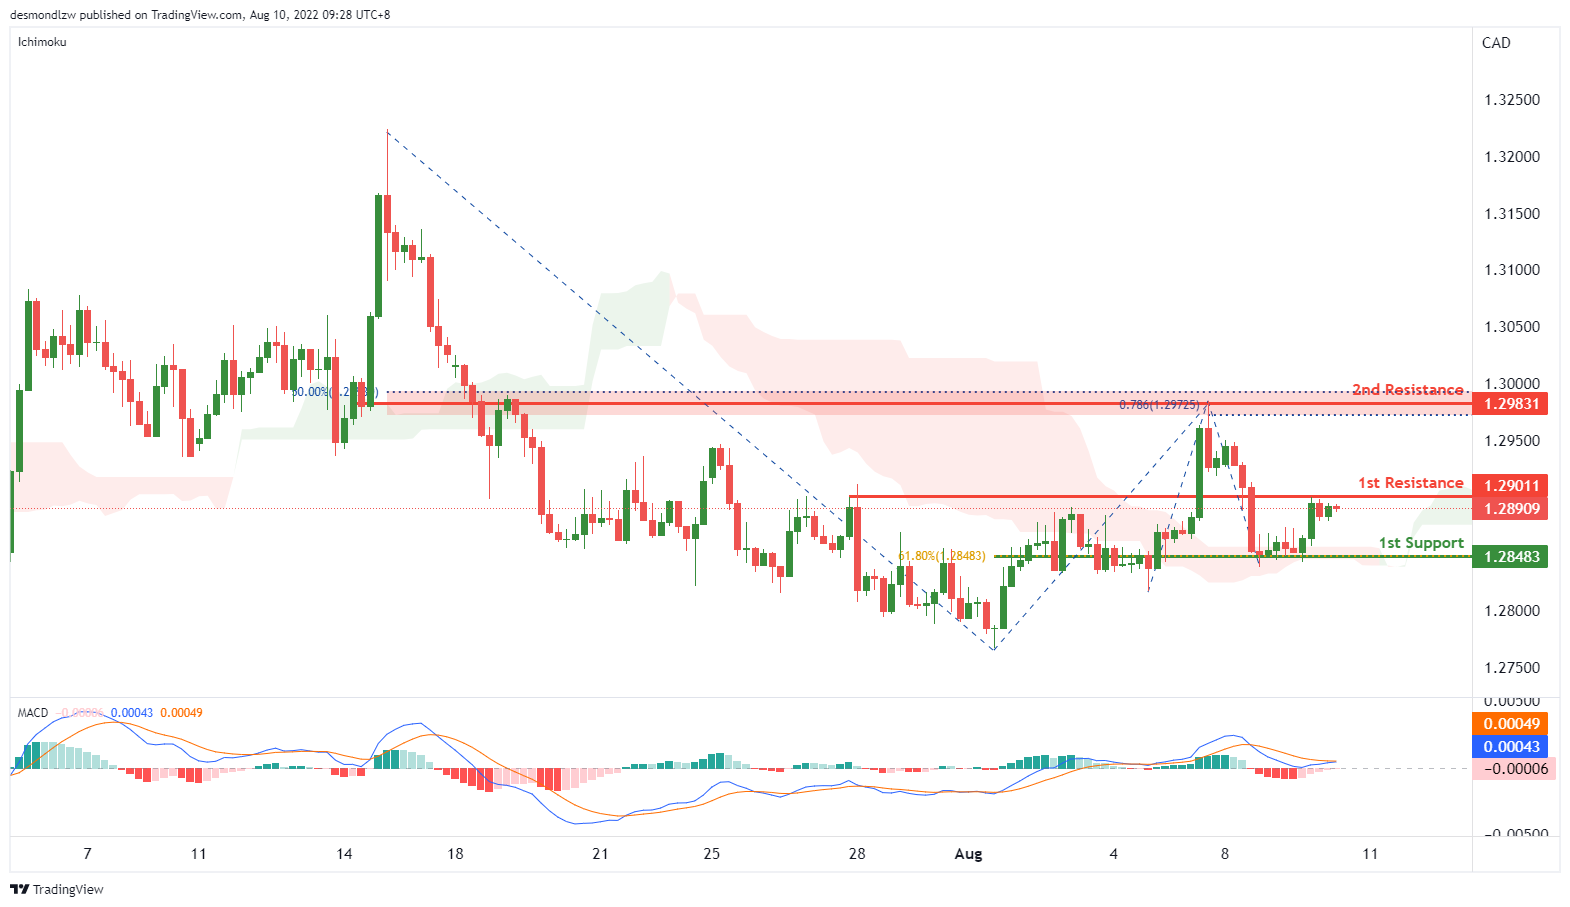
On the H4, with the price going above ichimoku cloud, and DIF is breaking the signal line in MACD, we have a bullish bias that the price may rise from our 1st resistance at 1.29011, which is in line with previous swing high to our 2nd resistance at 1.29831, which is in line with the 78.6% fibonacci projection and 50% fibonacci retracement. Alternatively, the price may drop to the 1st support at 1.28483, which is in line with 61.8% fibonacci retracement and pullback support.
Areas of consideration:
- H4 time frame, 1st resistance at 1.29011
- H4 time frame, 2nd resistance at 1.29831
OIL:
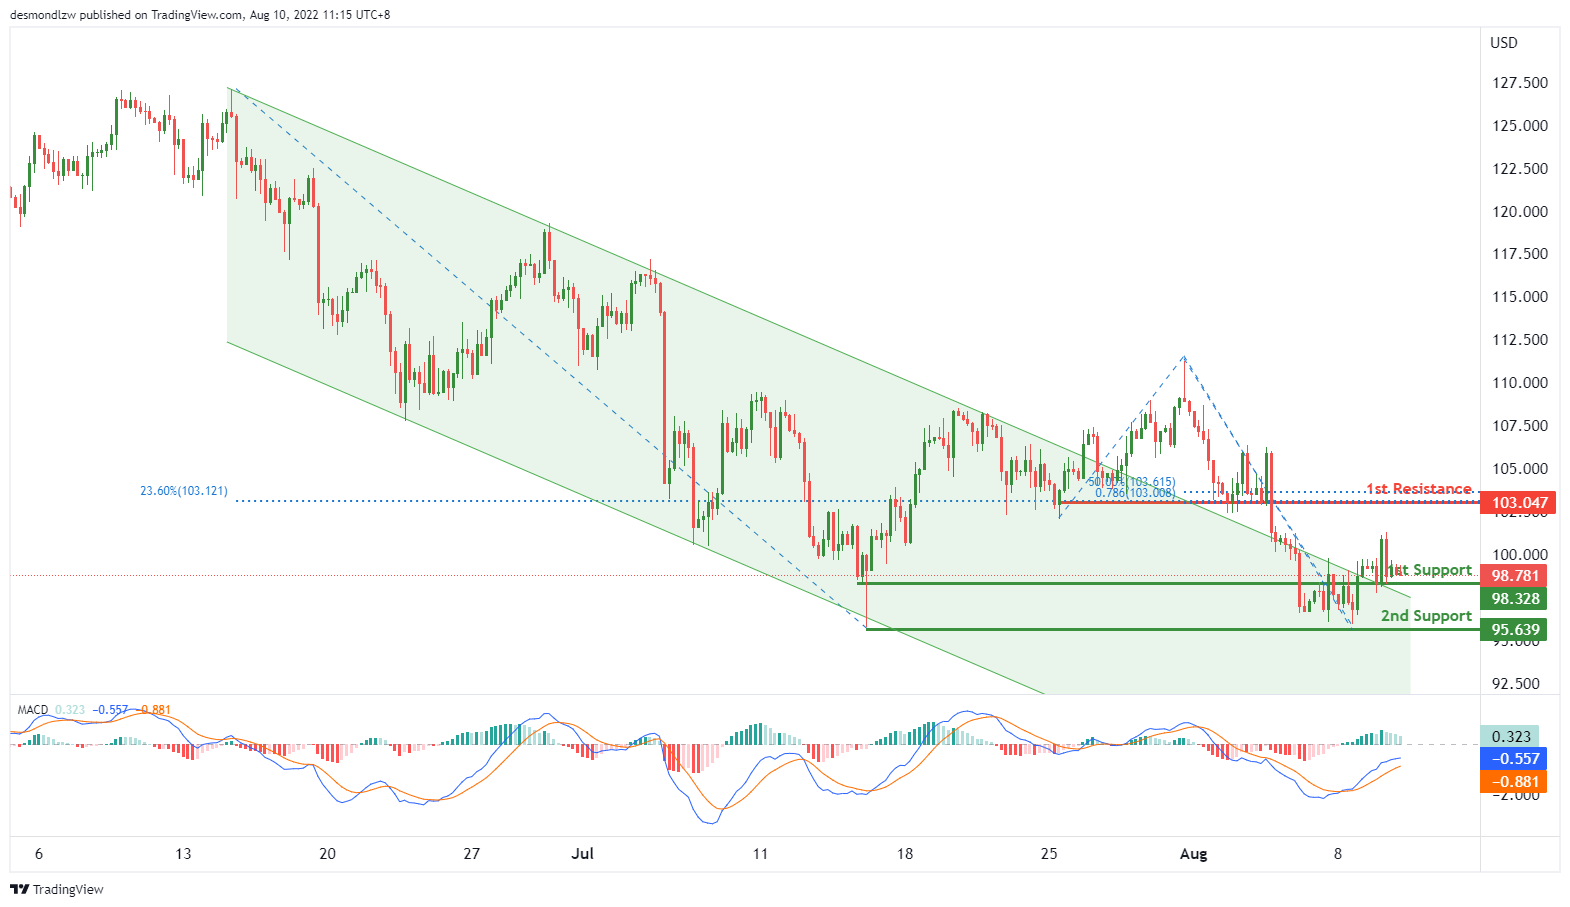
On the H4, with price braking the descending trendline, and the histogram of MACD is above zero axis, we have a bullish bias that the price may rise from our 1st support at 98.211, which is in line with the overlap support to the 2nd resistance at 103.047, which is in line with the 23.6% fibonacci retracement, overlap resistance, 50% fibonacci retracement and 78.6% fibonacci projection. Otherwise, the price may drop to our 1st support at 95.639, where the swing low support is.
Areas of consideration:
- H4 time frame, 1st resistance at 98.211
- H4 time frame, 2nd resistance at 103.047
Dow Jones Industrial Average:
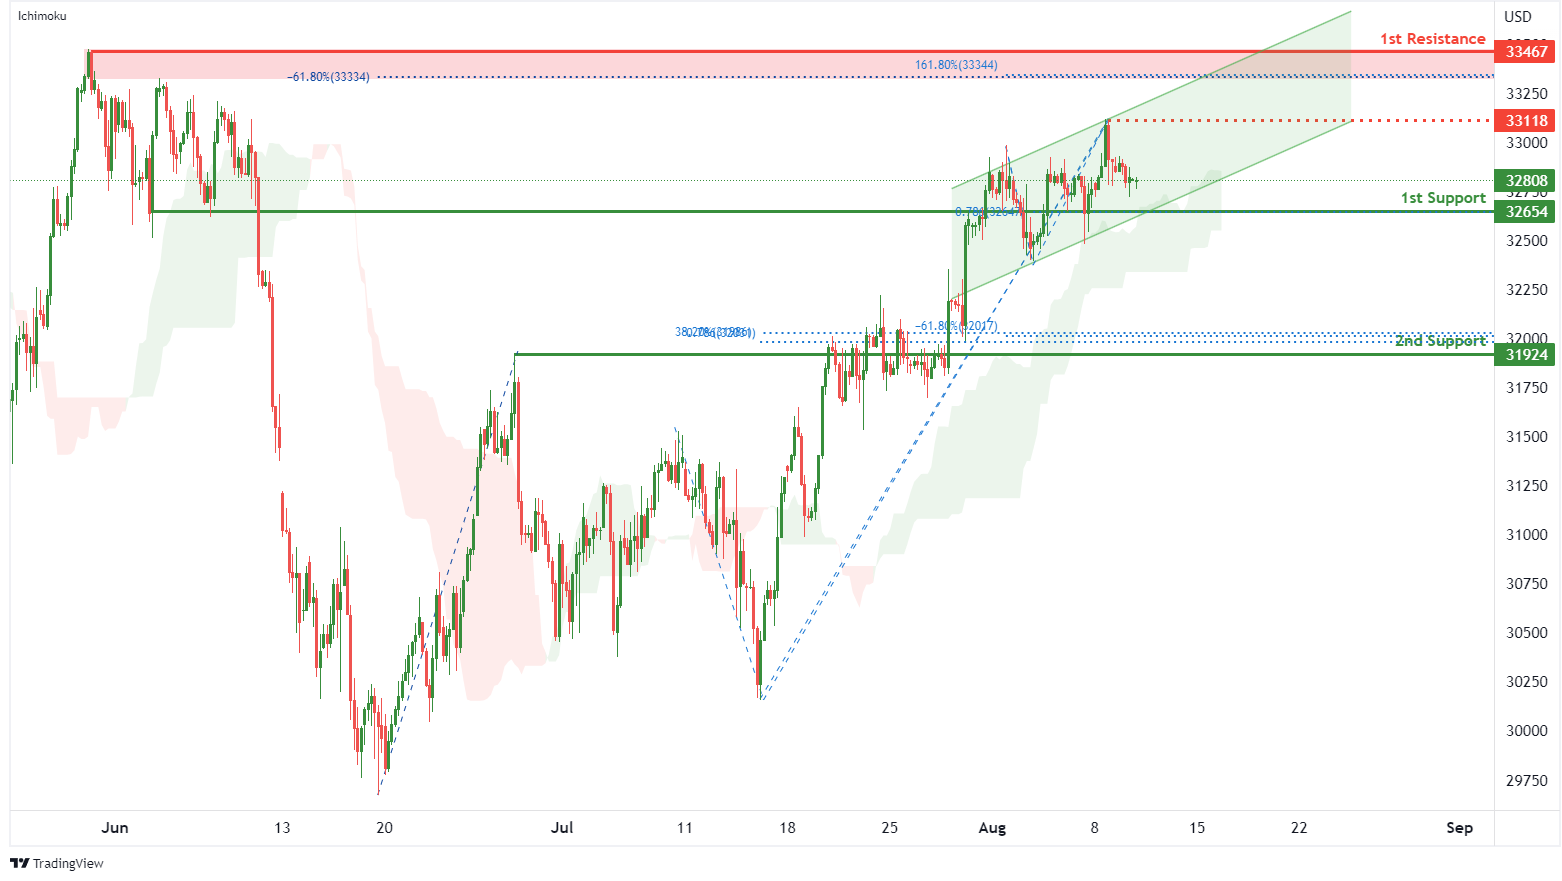
On the H4, with price moving above the ichimoku indicator and within an ascending channel, we have a bullish bias that price will rise from the 1st support at 32654 where the pullback support and 78.6% fibonacci projection are to the 1st resistance at 33467 where the swing high resistance, 161.8% fibonacci extension and -61.8% fibonacci expansion are. Take note of intermediate resistance at 33118 where the swing high resistance is. Alternatively, price could break 1st support structure and drop to 2nd support at 31924 where the pullback support, -61.8% fibonacci expansion, 38.2% fibonacci retracement and 78.6% fibonacci projection are.
Areas of consideration:
- H4 time frame, 1st resistance of 33467
- H4 time frame, 1st support at 32654
DAX:
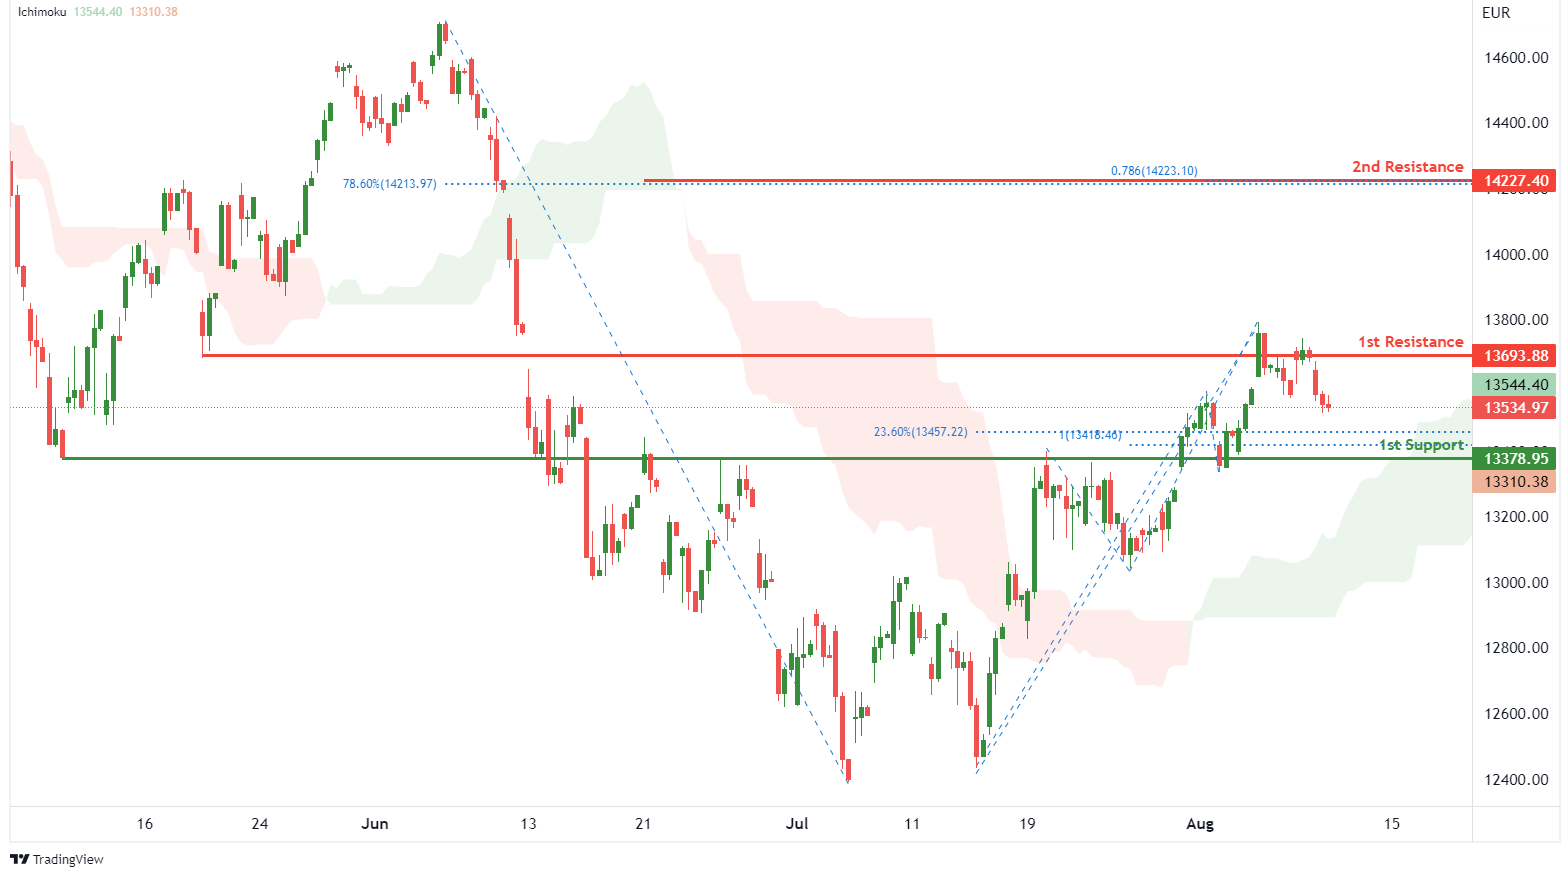
On the H4, with price moving above the ichimoku indicator, we have a bullish bias that price will rise to 1st resistance at 13693.88 where the pullback resistance is. Once there is upside confirmation of price breaking 1st resistance structure, we would expect bullish momentum to carry price to 2nd resistance at 14227.40 in line with 78.6% fibonacci projection and 78.6% fibonacci retracement. Alternatively, price could drop to 1st support at 13378.95 where the overlap support, 100% fibonacci projection and 23.6% fibonacci retracement are.
Areas of consideration:
- H4 time frame, 1st resistance of 13693.88
- H4 time frame, 1st support at 13378.95
ETHUSD:
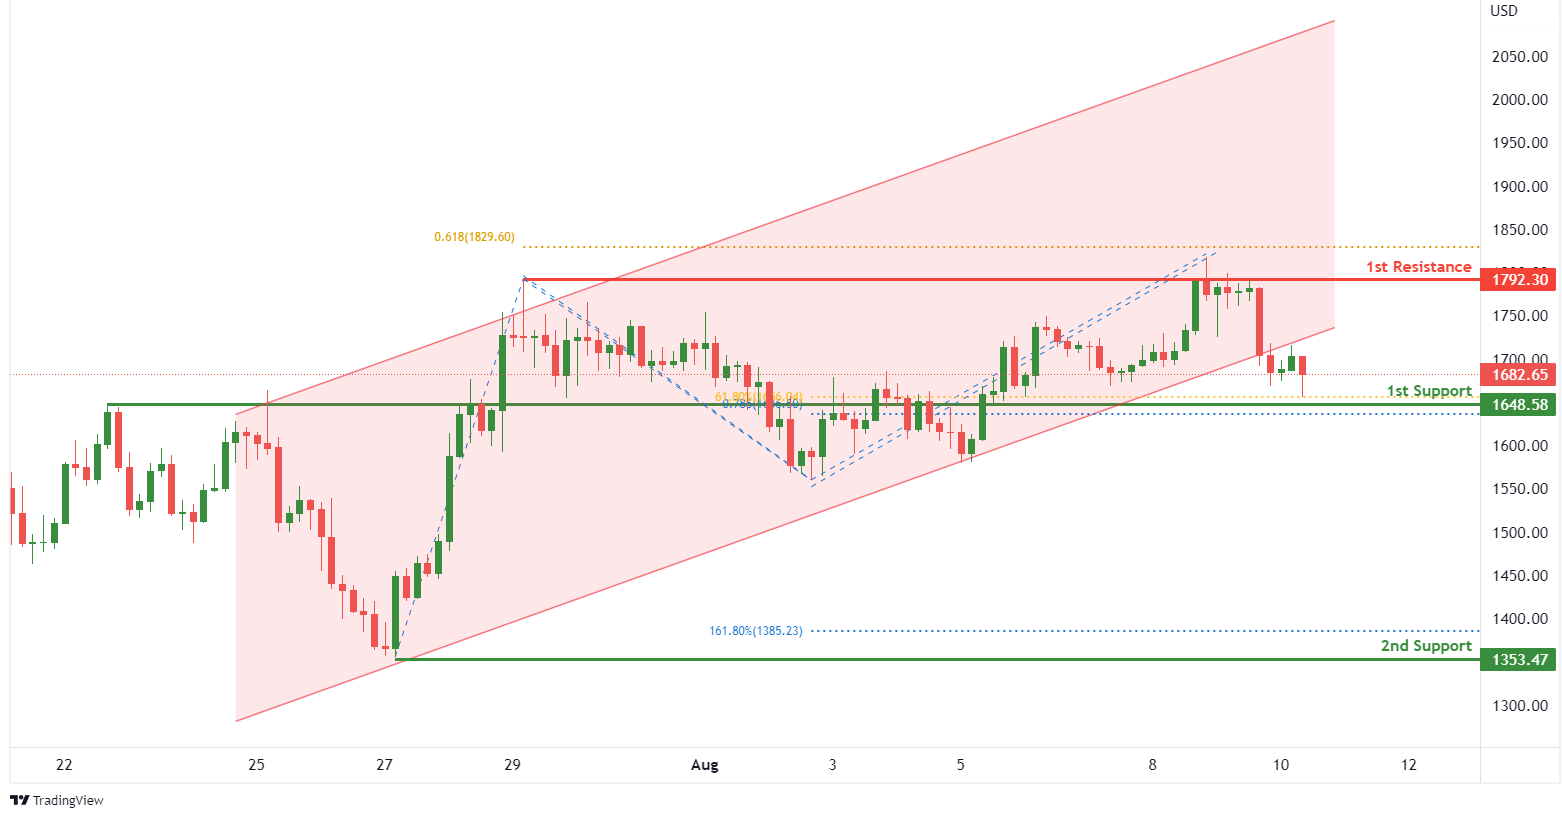
On the H4, with price breaking out of an ascending channel, we have a bearish bias that price will drop to 1st support at 1648.58 where the overlap support, 61.8% fibonacci retracement and 78.6% fibonacci projection are. Once there is downside confirmation that price has broken the 1st support structure, we would expect bearish momentum to carry price to 2nd support at 1353.47 where the swing low support and 161.8% fibonacci extension are. Alternatively,price could rise to 1st resistance at 1792.30 where the swing high resistance and 61.8% fibonacci projection are.
Areas of consideration:
- H4 time frame, 1st resistance of 1792.30
- H4 time frame, 1st support at 1648.58
BTCUSD:
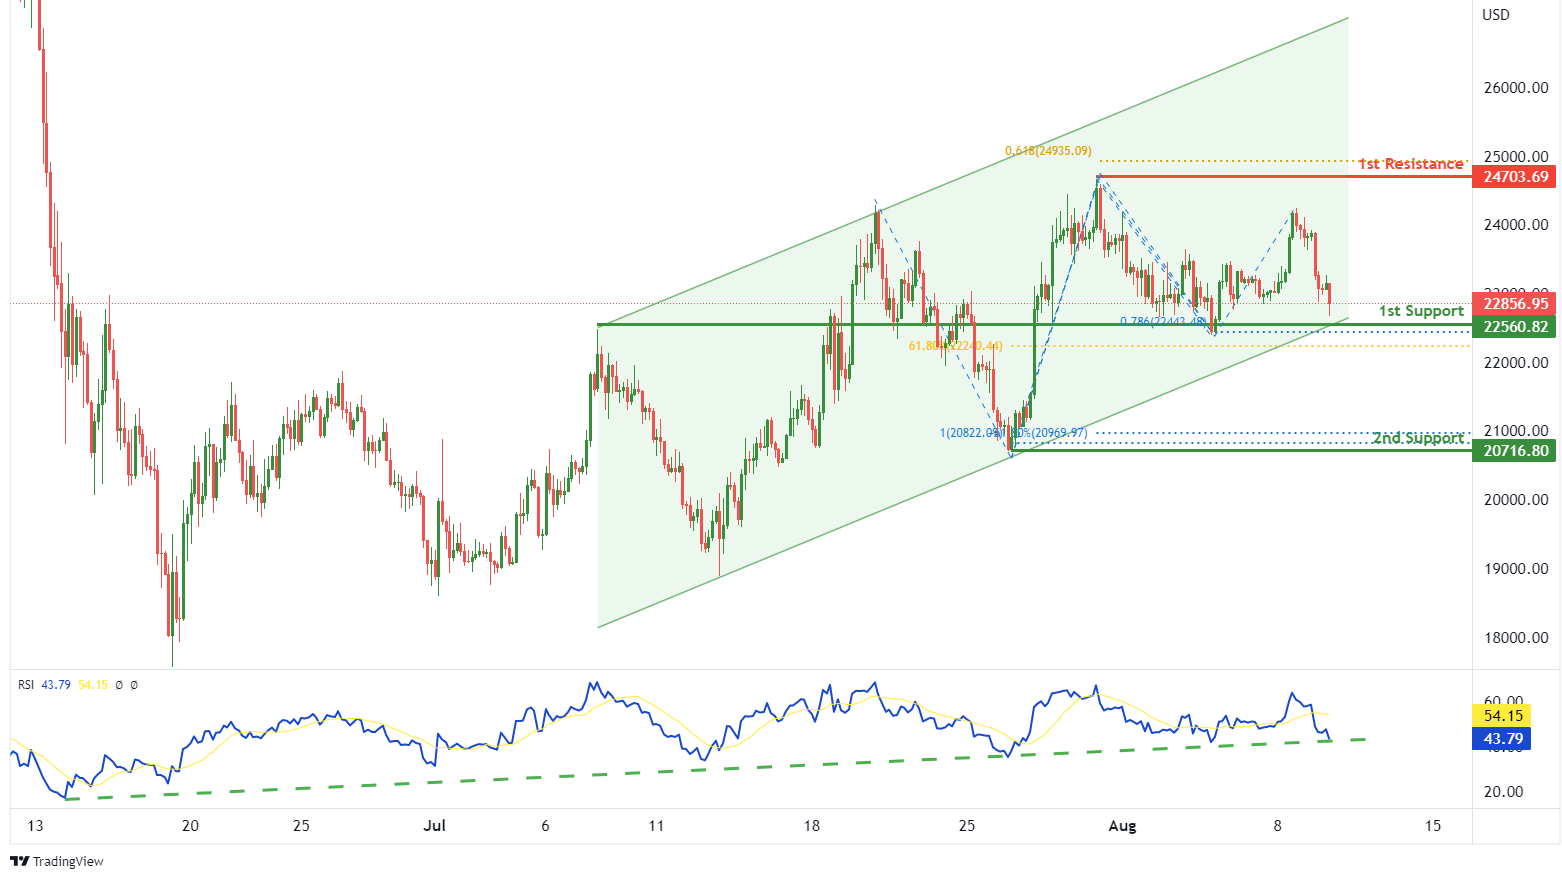
On the H4, with price moving within a bullish channel and RSI moving along an ascending trendline, we have a bullish bias that price will rise from our 1st support at 22560.82 where the pullback support, 61.8% fibonacci retracement and 78.6% fibonacci projection are to the 1st resistance at 24703.69 where the swing high resistance and 61.8% fibonacci projection are. Alternatively, price could break 1st support structure and drop to 2nd support at 20716.80 where the swing low support, -61.8% fibonacci expansion and 100% fibonacci projection are.
Areas of consideration:
- H4 time frame, 1st resistance of 24703.69
- H4 time frame, 1st support at 22560.82
S&P 500:
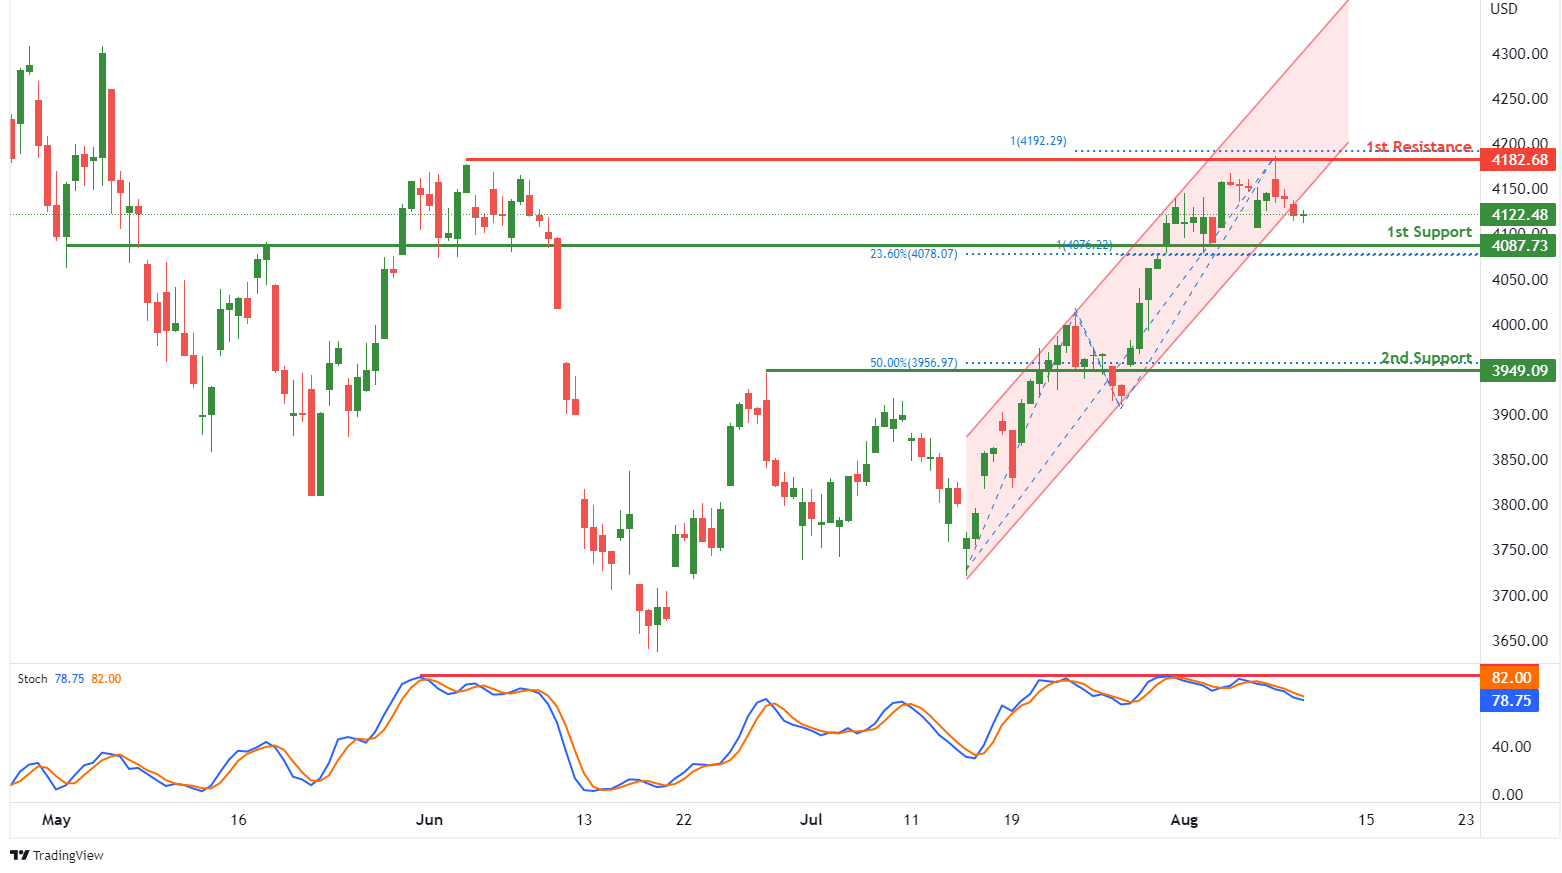
On the H4, with price breaking out of the ascending channel and reversing off the stochastic resistance, we have a bearish bias that price will drop to our 1st support at 4087.73 where the overlap support, 23.6% fibonacci retracement and 100% fibonacci projection are. Once there is downside confirmation that price has broken the 1st support structure, we would expect bearish momentum to carry price to 2nd support at 3949.09 where the pullback support and 50% fibonacci retracement is. Alternatively, price could rise to 1st resistance at 4182.68 where the swing high resistance and 100% fibonacci projection are.
Areas of consideration:
- H4 time frame, 1st resistance of 4182.68
- H4 time frame, 1st support at 4087.73
NZD/USD Broke Hurdles, Dollar Takes Hit
Key Highlights
- NZD/USD gained pace after it broke the 0.6320 resistance zone.
- A connecting bullish trend line is forming with support near 0.6300 on the 4-hours chart.
- EUR/USD spiked higher above the 1.0280 resistance zone.
- AUD/USD surged above the 0.7050 resistance zone.
NZD/USD Technical Analysis
The New Zealand Dollar formed a base above the 0.6250 level against the US Dollar. NZD/USD remained in a positive zone and climbed above the 0.6300 resistance.
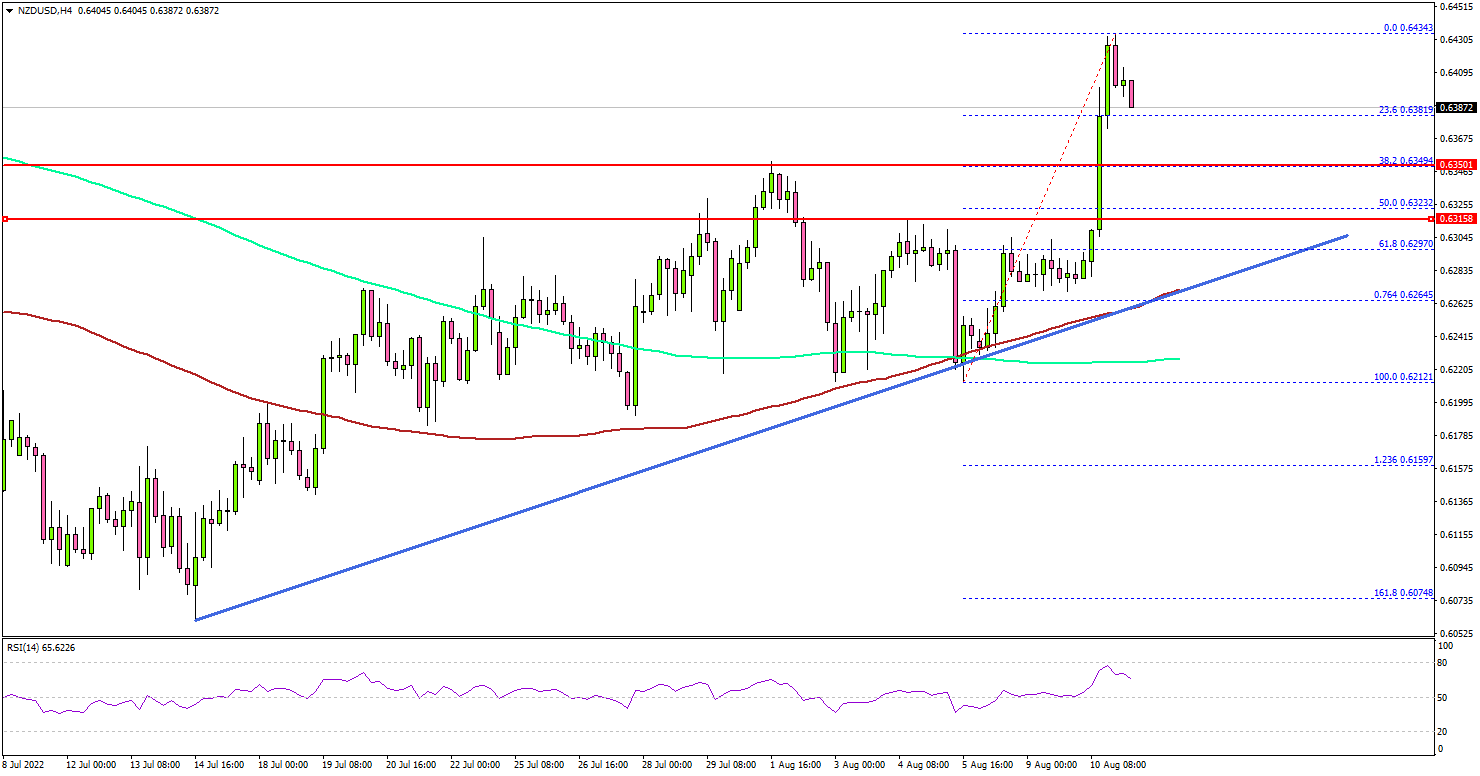
Looking at the 4-hours chart, the pair was able to clear the 0.6350 resistance. There was also a close above the 0.6350 level, 100 simple moving average (red, 4-hours), and the 200 simple moving average (green, 4-hours).
The pair even spiked above 0.6400 and traded as high as 0.6434. It is now correcting gains and trading near the 0.6385 level. On the downside, the first major support is near the 0.6380 level.
The main support is now forming near the 0.6320 level. Besides, there is a connecting bullish trend line forming with support near 0.6300 on the same chart. A downside break below the 0.6300 support might spark more losses.
The next major support is near 0.6230 and the 200 simple moving average (green, 4-hours). Any more losses might send the pair towards the 0.6200 zone.
On the upside, the pair is facing resistance near the 0.6420 level. The next major resistance is near the 0.6440 level, above which the pair could accelerate higher. In the stated case, the pair could rise towards the 0.6500 resistance zone in the near term.
Looking at EUR/USD, the pair broke the 1.0280 resistance and seems like there could be more upsides in the coming sessions.
Economic Releases
- US Initial Jobless Claims - Forecast 263K, versus 260K previous.
Eco Data 8/11/22
[php_everywhere instance="1"]
Fed Evans: Inflation still unacceptably high, rates to rise to 3.5% by year end
Chicago Fed President Charles Evans said today's CPI data was the first "positive" reading since Fed started tightening. Yet, inflation is still "unacceptably" high". He expects Fed to continue to raise interest rate to 3.25-3.50% by year end, and to 3.75-4.00 by the end of next year.
Evans was optimistic that the economy will "continue to grow" in H2. ""I'm not looking for the economy to turn down in a significant fashion any time soon," he added. He expected growth to be 1.5-2.0% next year.
The Inflation Wheel Has Turned, Hitting the Dollar
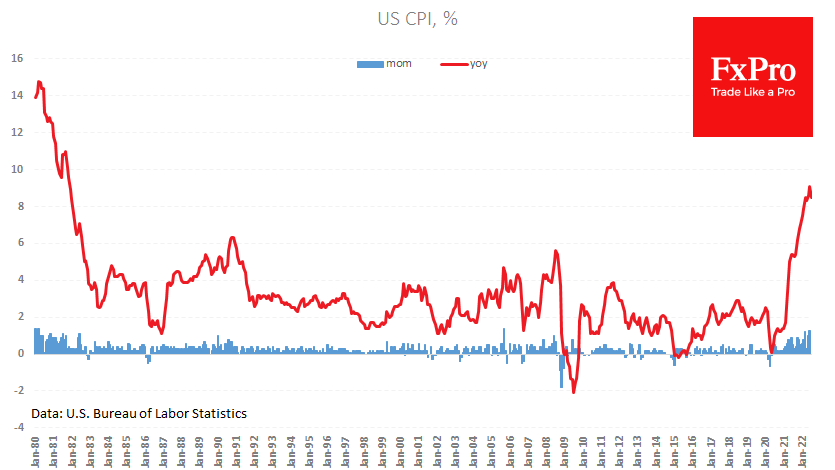
US consumer inflation slowed to 8.5% in July from 9.1% a month earlier. As we had pointed out, the fact was noticeably lower than the forecasted 8.7%, and this caused an immediate market reaction. FedWatch Tool showed the market’s estimate of a 75-point hike in the Fed Funds rate at the end of September fell from 68% to 33%.
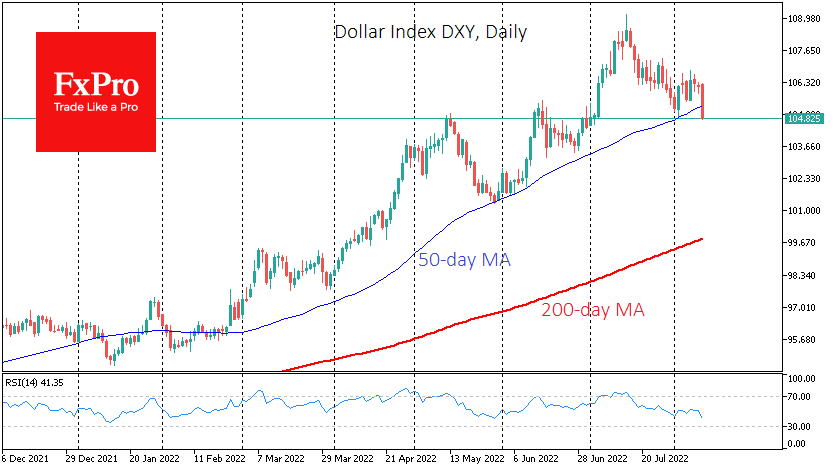
The currency market and index futures also saw a momentary reaction. The Dollar Index lost 1% within 15 minutes of publication, confirming its status as the market’s most important economic indicator.
The technical picture keeps a close eye on how the day will close. A DXY consolidation below 105.20, where the 50-day moving average and the local August lows are concentrated, could be confirmation of a reversal of a Dollars’ bull trend since May 2021. For most of these 14 months, the Fed has been tightening its rhetoric and accelerating rate hikes.
A sharp slowdown in inflation and signs that this move will continue in the coming months set the markets up for a reversal of Fed rhetoric. Right now, a 50-point rate hike is the most likely scenario. Further prospects are shrouded in uncertainty and tightly linked to inflation data. The Fed may move to a 25-point rate hike in November or December. The key word is “uncertainty” because it determines the degree of market volatility and investor sentiment. We are near the point of a cycle change, which means we are not in danger of a calm market.
USDCHF Wave Analysis
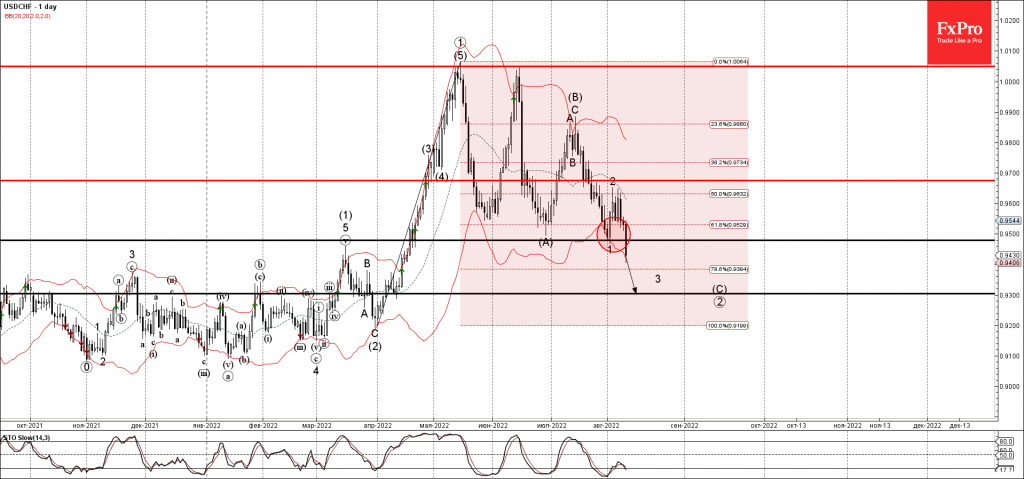
- USDCHF broke key support level 0.9480
- Likely to fall to support level 0.9300
USDCHF currency pair recently broke the key support level 0.9480 (which stopped the earlier minor impulse wave 1 at the start of August).
The breakout of the support level 0.9480 follows the earlier breakout of the 61.8% Fibonacci correction of the upward impulse from March.
USDCHF can be expected to fall further toward the next support level 0.9300 (target price for the completion of the active intermediate impulse wave (C)).