

Sample Category Title
EUR/CHF Daily Outlook
Daily Pivots: (S1) 0.9724; (P) 0.9745; (R1) 0.9764; More....
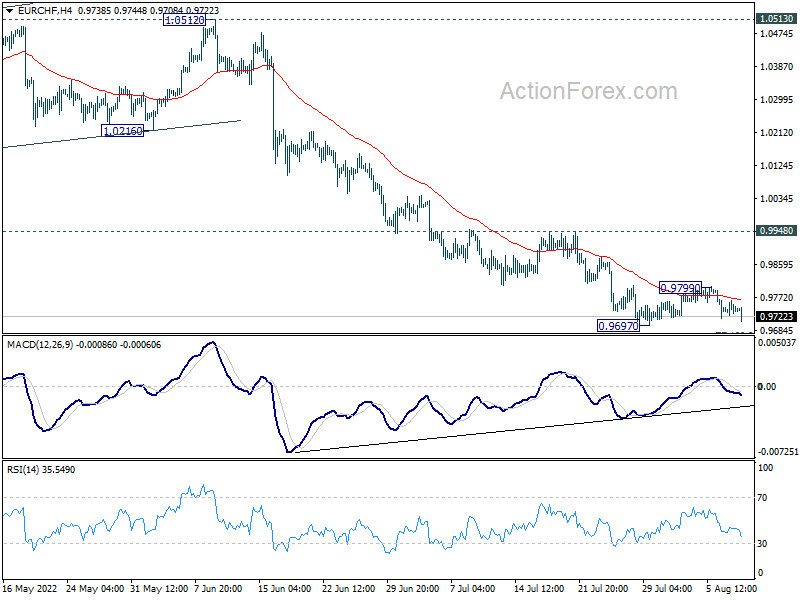
Range trading continues in EUR/CHF and intraday bias remains neutral. On the downside, firm break of 0.9697 will resume larger down trend to 0.9650 long term projection level. Strong support could be seen there to bring rebound. On the upside, break of 0.9799 minor resistance will turn bias to the upside for stronger rise to 0.9948 resistance. However, firm break of 0.9650 will target 100% projection of 1.1149 to 0.9970 from 1.0513 at 0.9334.
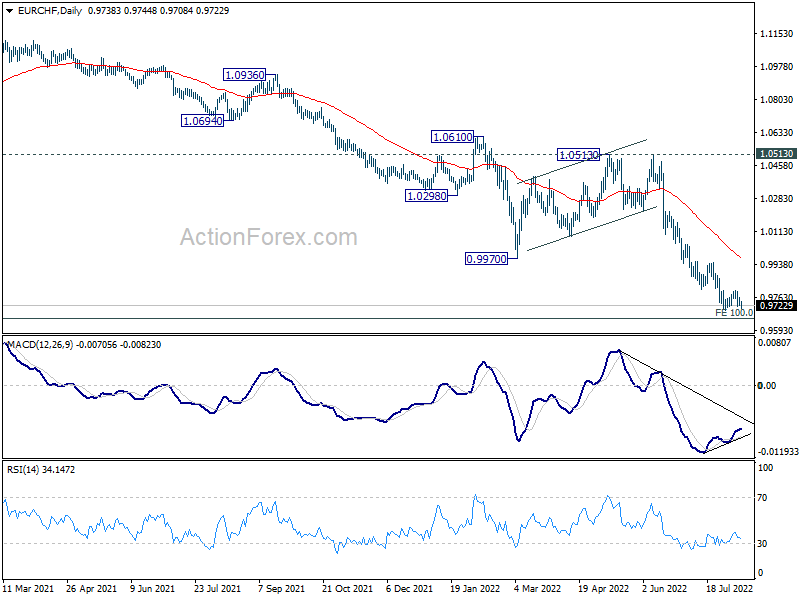
In the bigger picture, long term down trend from 1.2004 (2018 high) is expected to target 100% projection of 1.2004 to 1.0505 to 1.1149 at 0.9650. Firm break there will target 138.2% projection at 0.9033. On the upside, break of 1.0513 resistance is needed to indicate medium term bottoming. Otherwise, outlook will stay bearish in case of strong rebound.
USDJPY Resumes Rebound but 50-day SMA Caps Advance
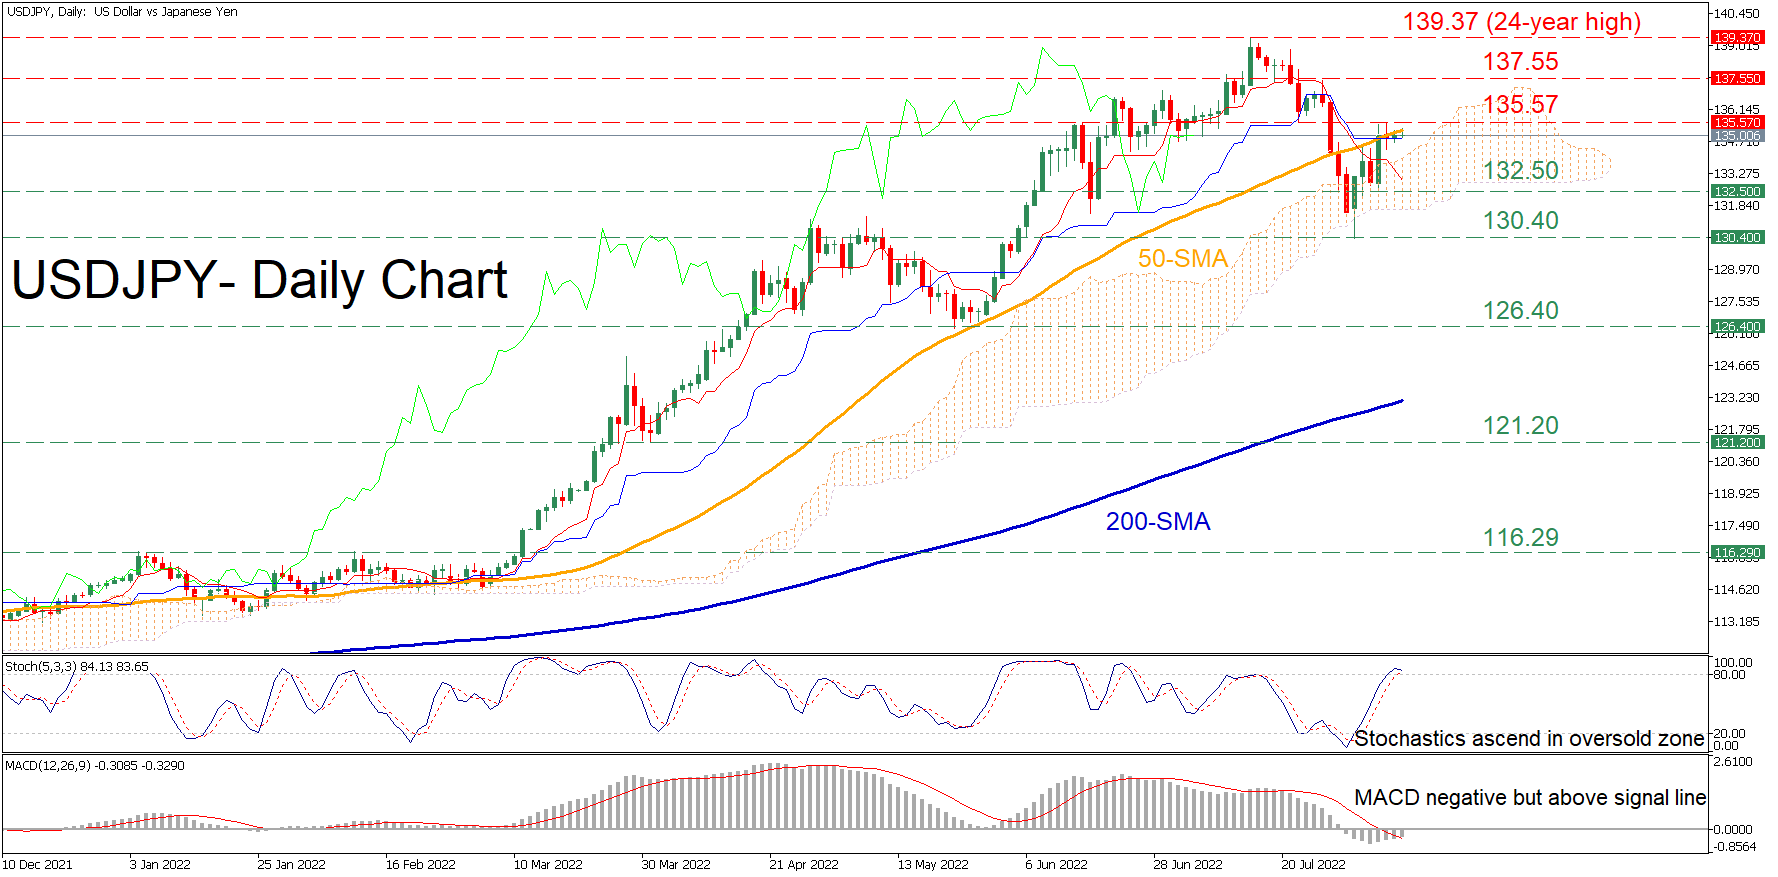
USDJPY has been gaining some ground in the short-term after its latest decline came to a halt at the 130.40 region. However, the recent price recovery has been repeatedly held down by the ascending 50-day simple moving average (SMA).
The momentum indicators suggest that near-term risks are tilted to the upside. Specifically, the stochastic oscillator is flatlining in its 80-overbought area, while the MACD histogram has jumped above its red signal line but remains in negative territory.
Should positive momentum strengthen and the price crosses above its 50-day SMA, initial resistance could be met at the recent peak of 135.57. Conquering this barricade, the bulls could then aim for the 137.55 barrier. An upside violation of the latter could set the stage for the 24-year high of 139.37.
Alternatively, if selling pressures arise, the pair could descend to challenge the 132.50 hurdle. Sliding beneath that floor, the recent low of 130.40 might be the next support zone for the price. Any further declines may then stall at the May low of 126.40 before the spotlight turns to 121.20.
Overall, USDJPY’s short-term picture appears to be constantly improving but the 50-day SMA has proved to be a tough resistance barrier for the bulls. Nevertheless, a drop beneath the 130.40 floor could shift the technical picture back to negative.
Inflation Angst Could Roil Markets
Market volatility has eased in the lead up to today’s highly anticipated US CPI data. The VIX index has moderated closer to 20, which is notably below the mid-30s peaks it has witnessed on multiple episodes so far this year. The JPMorgan Global FX Volatility Index has also cooled below its 100-day moving average.
Still, this relative calm could be upended by today’s US July inflation print, where the median estimate for economists’ forecasts comes in at 8.7%. Although that would mark an easing from June’s 9.1%, it would still be more than four times higher than the Fed’s 2% target.
Markets are well aware that multi-decade high inflation remains the Fed’s number one enemy, to the point that policymakers are willing to crimp economic growth in the name of vanquishing scorching-hot inflation.
The headline CPI figure has shown a tendency to surprise to the upside, having done so in five of the past six releases. Yet another hotter-than-expected CPI print today could prompt risk assets to unwind more of their recent gains.
However, signs that US inflation has peaked may further embolden risk-taking activities in markets, on the notion that the Fed can start to walk back from more jumbo-sized rate hikes.
EUR/USD Daily Outlook
Daily Pivots: (S1) 1.0186; (P) 1.0217; (R1) 1.0244; More...
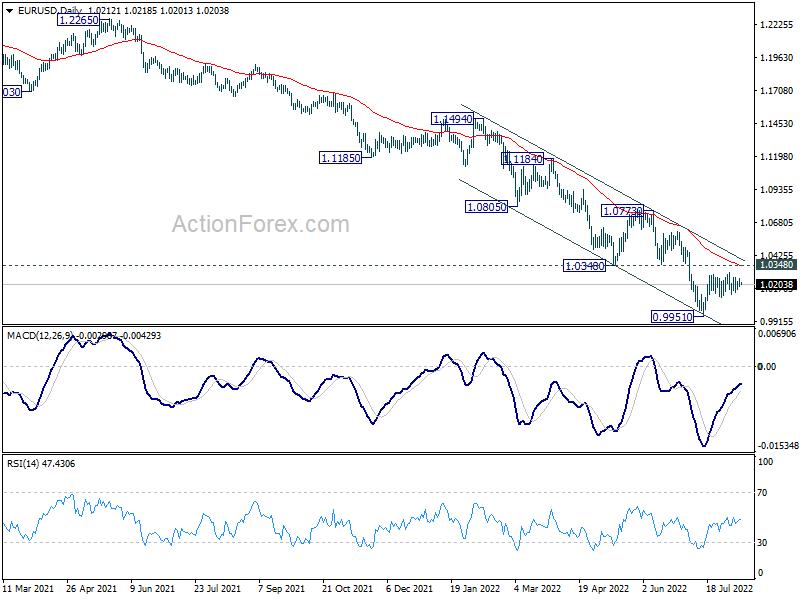
Intraday bias in EUR/USD remains neutral at this point. On the downside, break of 1.0095 minor support will argue that larger down trend is ready to resume. Intraday bias will be back to the downside for retesting 0.9951 low first. For now, outlook will stay bearish as long as 1.0348 support turned resistance holds, even in case of another rise.
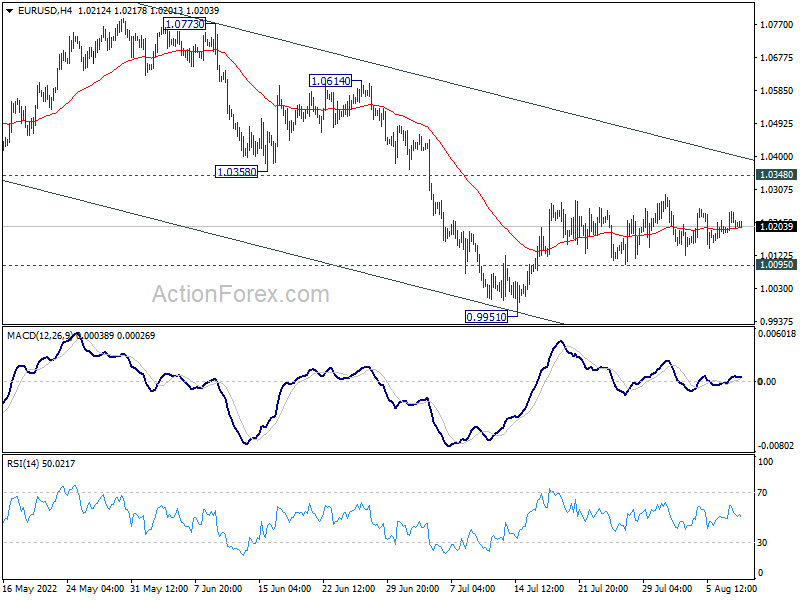
In the bigger picture, down trend from 1.6039 (2008 high) is still in progress. Next target is 100% projection of 1.3993 to 1.0339 from 1.2348 at 0.8694. In any case, outlook will stay bearish as long as 1.0773 resistance holds, in case of strong rebound.
GBP/USD Daily Outlook
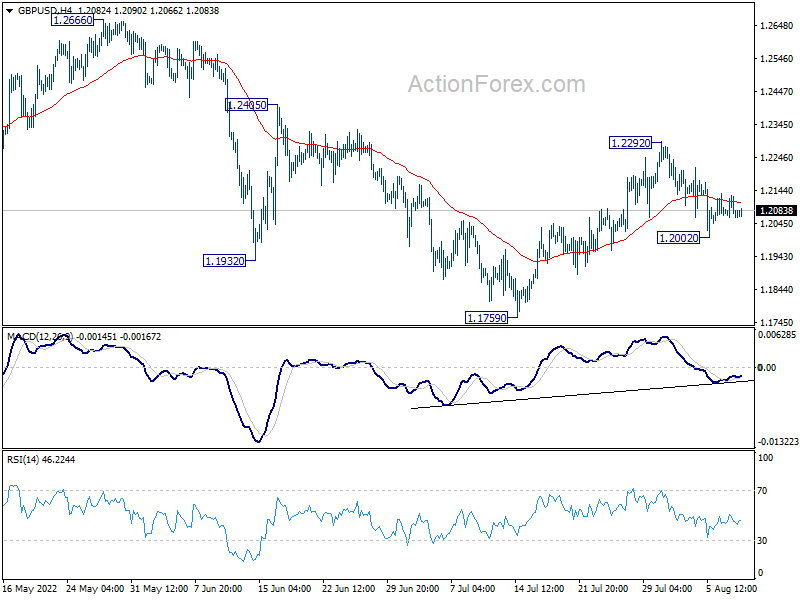
Daily Pivots: (S1) 1.2049; (P) 1.2090; (R1) 1.2117; More...
Intraday bias in GBP/USD remains neutral for the moment. Outlook is unchanged that rebound from 1.1759 should have completed after hitting 55 day EMA. On the downside, below 1.2022 will bring deeper fall to retest 1.1759 low. On the upside, break of 1.2292 will invalidate this view and resume the rebound towards 1.2405 resistance instead.
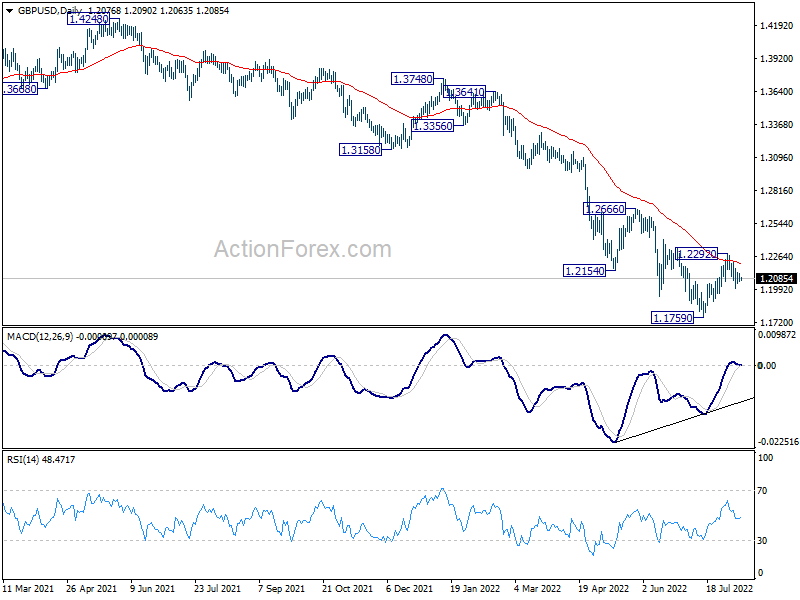
In the bigger picture, fall from 1.4248 (2018 high) could be a leg inside the pattern from 1.1409 (2020 low), or resuming the longer term down trend. Deeper decline is expected as long as 1.2666 resistance holds. Next target is 1.1409 low. However, firm break of 1.2666 will bring stronger rise back to 55 week EMA (now at 1.2925).
USD/CHF Daily Outlook
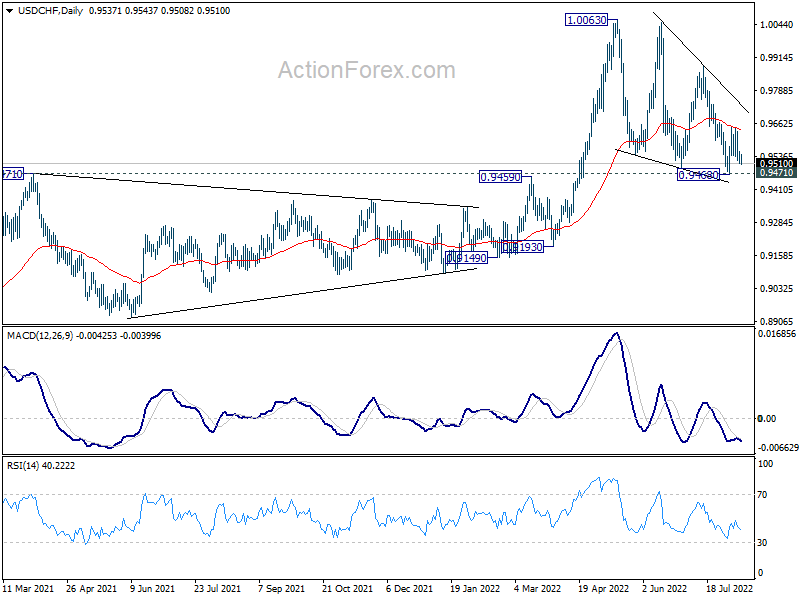
Daily Pivots: (S1) 0.9511; (P) 0.9536; (R1) 0.9560; More...
Intraday bias in USD/CHF stays neutral for the moment. On the upside, break of 0.9650, and sustained trading above 55 day EMA (now at 0.9647) will raise the chance that corrective pattern from 1.0063 has completed. Further rally should then be seen to 0.9884 resistance next. However, decisive break of 0.9471 support will carry larger bearish implication.
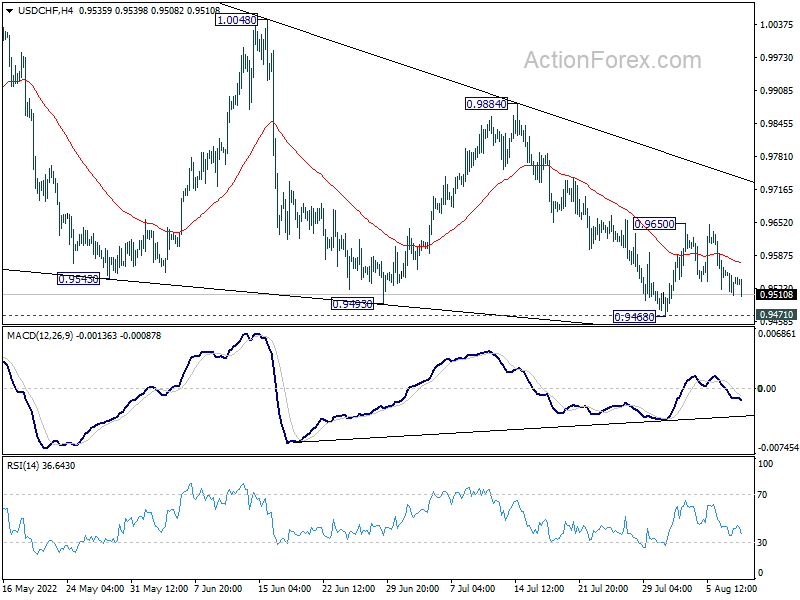
In the bigger picture, medium term up trend from 0.8756 (2021 low) is still in progress. On resumption, next target is 1.0342 (2016 high). Sustained break there will resume long term up trend from 0.7065 (2011 low). This will remain the favored case as long as 0.9471 resistance turned support holds. However, firm break of 0.9471 will raise the chance that such up trend is over.
USD/JPY Daily Outlook
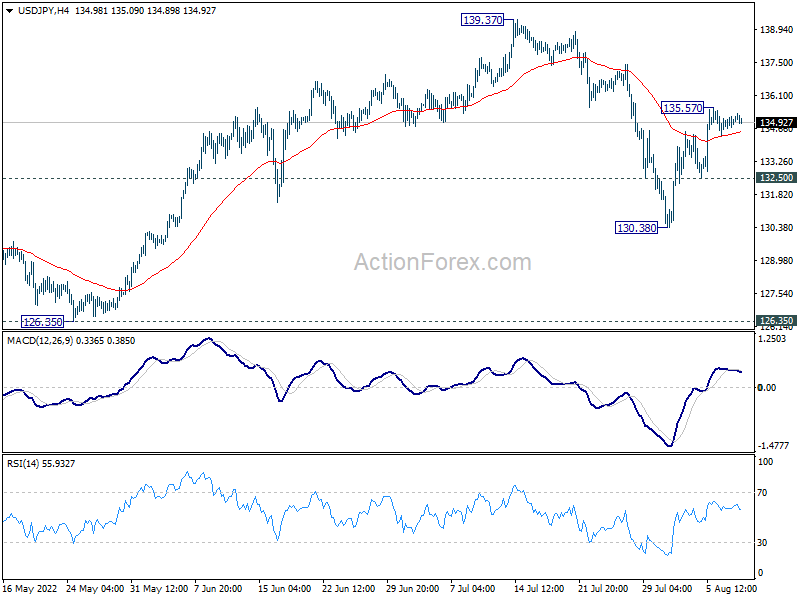
Daily Pivots: (S1) 134.81; (P) 135.00; (R1) 135.34; More...
Intraday bias in USD/JPY is turned neutral first. On the upside, above 135.57 will resume the rebound from 130.38. But upside should be limited by 139.37 resistance, to bring another fall, as the third leg of the consolidation pattern from 139.37. On the downside, below 132.50 minor support will resume the fall from 139.37 towards 126.35 structural support.
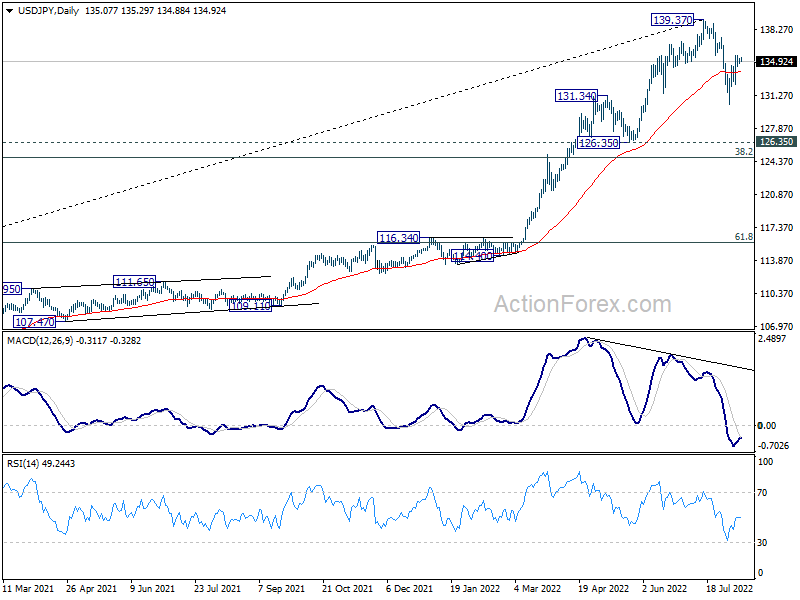
In the bigger picture, fall from 139.37 medium term top is seen as correcting whole up trend from 101.18 (2020 low). While deeper decline cannot be ruled out, outlook will stays bullish as long as 55 week EMA (now at 121.84) holds. Long term up trend is expected to resume through 139.37 at a later stage, after the correction finishes.
USD/CAD Daily Outlook
Daily Pivots: (S1) 1.2853; (P) 1.2876; (R1) 1.2909; More...
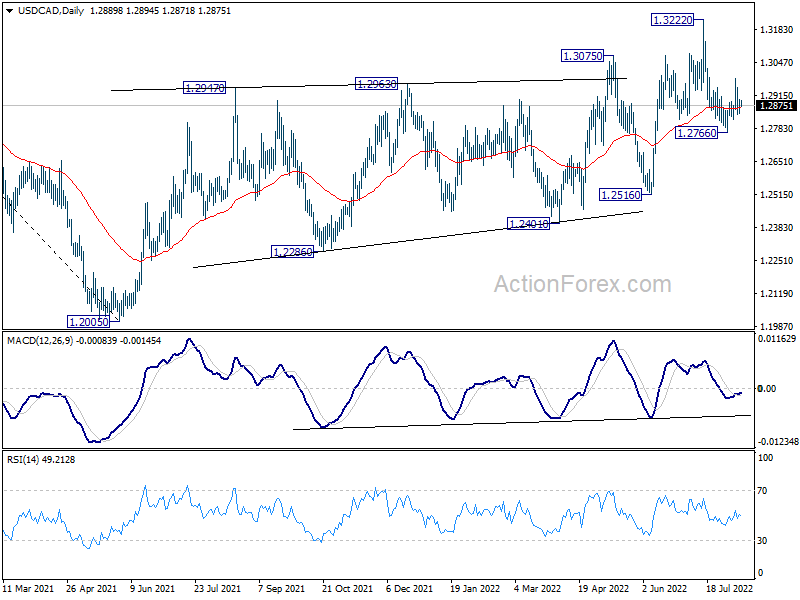
Intraday bias in USD/CAD remains neutral at this point. On the downside, break of 1.2817 minor support will suggest that fall from 1.3222 high is ready to resume. Intraday bias will be back on the downside for 1.2766 support and below. On the upside, above 1.2984 will resume the rebound to retest 1.3222 high instead.
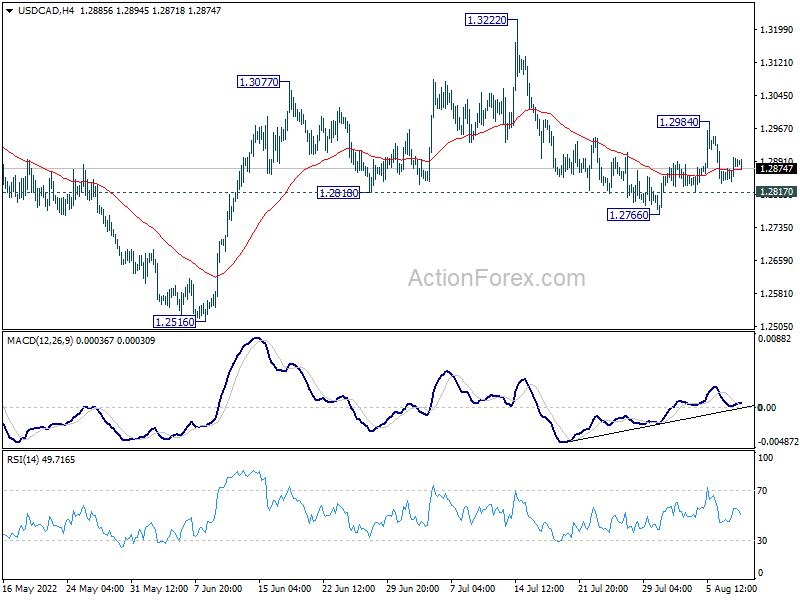
In the bigger picture, down trend from 1.4667 (2020 high) should have completed at 1.2005, after defending 1.2061 long term cluster support. Rise from there should target 61.8% retracement of 1.4667 to 1.2005 (2021 low) at 1.3650. This will remain the favored case now as long as 1.2516 support holds.
NZDUSD in Quiet Trading ahead of US CPI Inflation
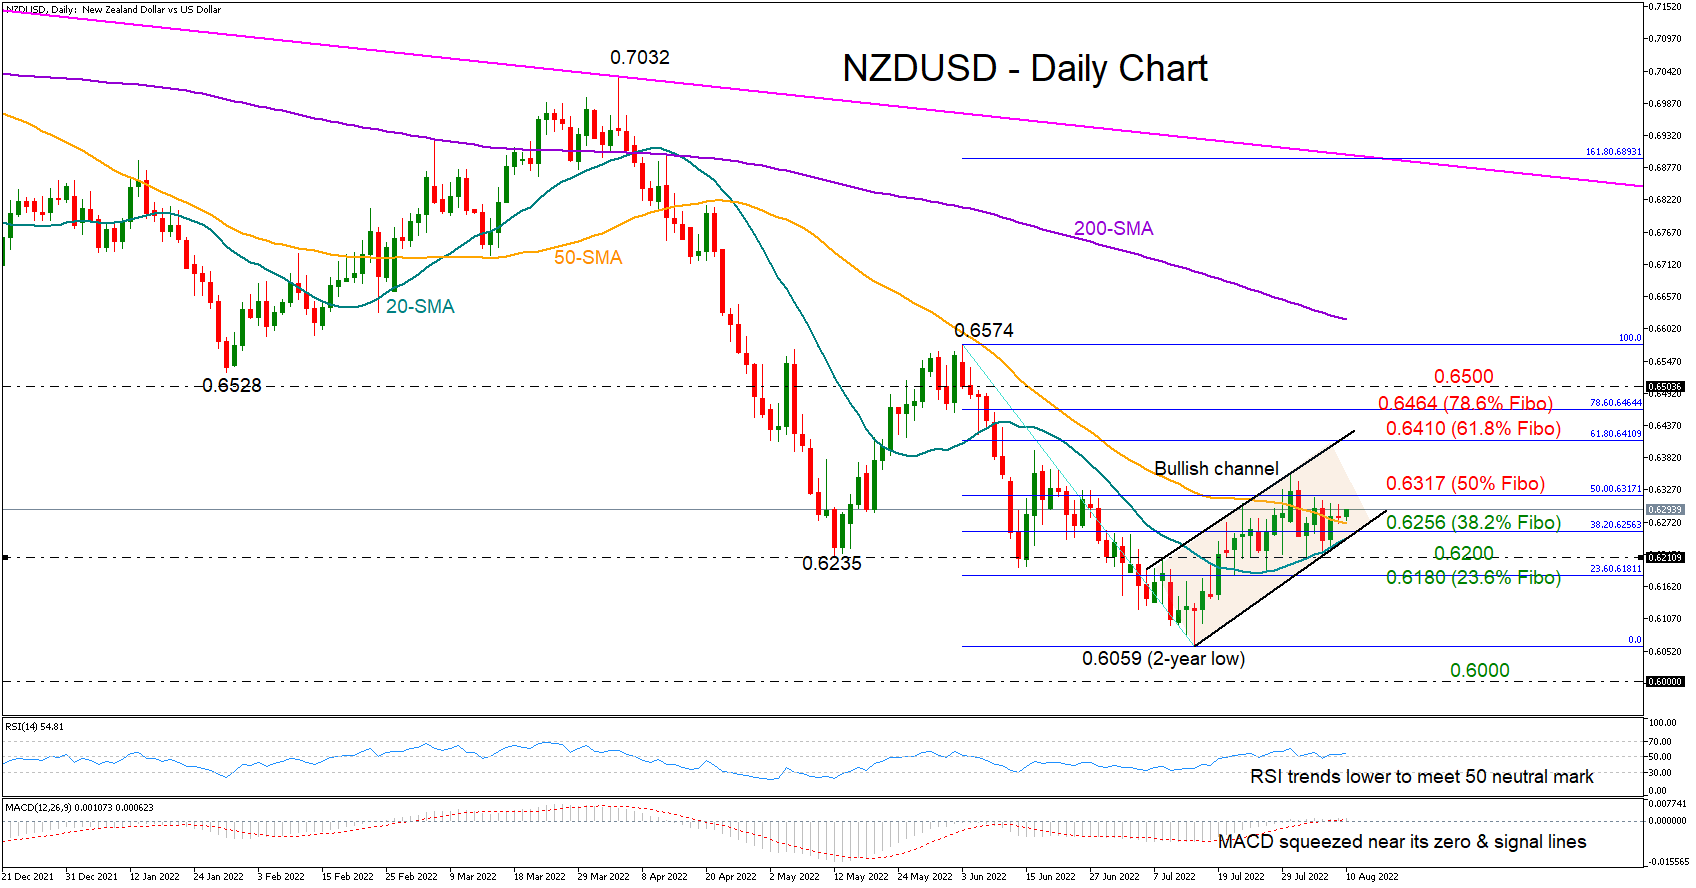
NZDUSD has been silent since Monday’s negligible pickup, which put the market in the green territory on a weekly basis, trading flat at 0.6280 ahead of the US CPI inflation early on Wednesday.
The pair is currently trying to build a floor around the 50-day simple moving average (SMA) at 0.6274 following the bounce on the 20-day SMA and the lower boundary of the short-term bullish channel on Monday, but the technical oscillators are barely promoting any meaningful rebound at the moment. In particular, the RSI has been diminishing towards its 50 neutral mark, while the MACD has been muted near its zero and signal lines, both mirroring a neutral short-term bias instead.
Perhaps, a close above the 50% Fibonacci retracement of the latest downleg at 0.6317 could provoke the much-needed bullish power. If that proves to be the case, the price could fly towards the channel’s upper limit, which currently coincides with the 61.8% Fibonacci of 0.6410. Not far above, the 78.6% Fibonacci of 0.6464 and the 0.6500 psychological mark could next come into consideration ahead of the 0.6574 high.
On the downside, a decisive step below 0.6256, where the 20-day SMA, the channel’s lower trendline, and the 38.2% Fibonacci are aligned, could initially pause somewhere between 0.6200 and the 23.6% Fibonacci of 0.6180. If that base cracks, the sell-off could exacerbate towards the two-year low of 0.6059.
In brief, although NZDUSD is currently declaring a neutral status, upside movements remain possible as long as the 0.6256 area provides a foundation.
Bitcoin Seeks Support
Market picture
Bitcoin lost 3.8% on Tuesday, ending it at around $23.2K, and is developing a decline to $22.9 by Wednesday morning. Ethereum has lost 5.6% in the last 24 hours, to $1680. Top altcoins are down 2.5% (BNB) to 7.2% (Solana).
Total crypto market capitalisation, according to CoinMarketCap, fell 3.9% overnight to $1.08 trillion.
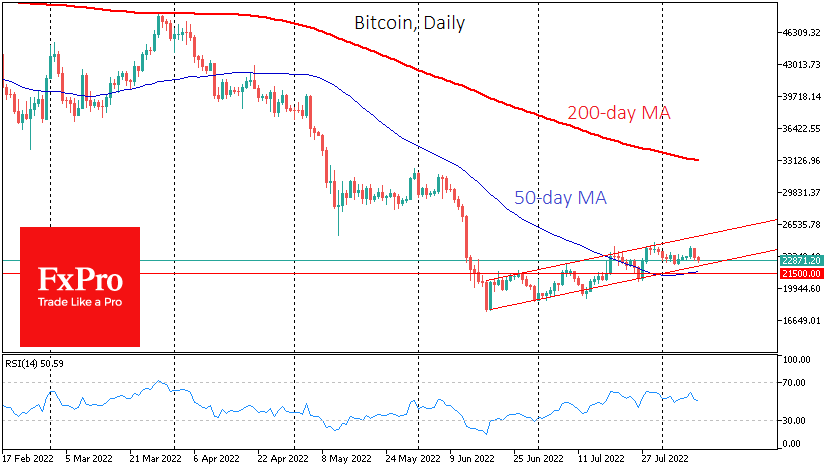
The recovery in stock indices has choked, but even earlier and more dramatically, these changes have affected Bitcoin and the whole crypto market. Should the decline develop, investors and traders should pay close attention to the 21500 area, where the previous local lows are concentrated. A dip below that and a decisive return below the 50-day average could start a new wave of decline that could take the crypto market to new lows. At least, there might be a test of the June-July lows.
News background
According to CoinShares, net capital inflows into crypto funds slowed to $3m last week, with Ethereum accounting for the most investments at $16m. Funds investing in bitcoin lost $8.5m; those allowing shorting it faced $7.5m in outflows.
Michael Novogratz, CEO of investment firm Galaxy Digital, expects bitcoin to consolidate in the $20,000-$30,000 range for a while.
Circle has blocked 75K USDC on Tornado Cash mixer wallets, which have come under sanctions from the US Treasury. According to the agency, attackers have laundered cryptocurrency worth more than $7 billion since its inception in 2019, with about $0.5 billion linked to the North Korean hackers Lazarus Group.
The Reserve Bank of Australia is working with the Digital Finance Corporate Research Centre (DFCRC) to launch a pilot project to explore options for the practical use of CBDC digital currency.
El Salvador President Nayib Bukele said the legalisation of bitcoin last year contributed to significant growth in the country’s tourism.
Iran conducted its first import transaction worth $10 million paid in cryptocurrency, bypassing the global financial system restricted by US sanctions.